
Abstract
Human pluripotent stem cells (hPSCs) are promising therapeutic tools for regenerative therapies and disease modeling. Differentiation of cultured hPSCs is influenced by both exogenous factors added to the cultures and endogenously secreted molecules. Optimization of protocols for the differentiation of hPSCs into different cell types is difficult because of the many variables that can influence cell fate. We present microfluidic devices designed to perform three- and four-factor, two-level full factorial experiments in parallel for investigating and directly optimizing hPSC differentiation. These devices feature diffusion-isolated, independent culture wells that allow for control of both exogenous and endogenous cellular signals and that allow for immunocytochemistry (ICC) and confocal microscopy in situ. These devices are fabricated by soft lithography in conjunction with 3D-printed molds and are operable with a single syringe pump, eliminating the need for specialized equipment or cleanroom facilities. Their utility was demonstrated by on-chip differentiation of hPSCs into the auditory neuron lineage. More broadly, these devices enable multiplexing for experimentation with any adherent cell type or even multiple cell types, allowing efficient investigation of the effects of medium conditions, pharmaceuticals, or other soluble reagents.
Introduction
Human pluripotent stem cells (hPSCs) are promising therapeutic tools for regenerative therapies and disease modeling. Differentiation of hPSCs toward a desired cell fate is typically accomplished by exposing cells to soluble ligands or proteins for set periods of time. Differentiation protocols must be developed and optimized for each target cell type, a daunting task given the number of parameters that affect specificity and yield. Furthermore, cultured cells continuously secrete endogenous signaling molecules that affect both the cell itself and other cells in a concentration-dependent manner.1–7 hPSCs are typically cultured in plates and flasks with large volumes of culture media and large surface areas 8 that limit the ability to control for the effects of endogenous factors. This likely contributes to lack of replicability between experiments and laboratories. The traditional culture paradigm also has technical limitations in terms of multiplexing and automation. Each well requires individual manipulation of cell density, the number and concentration of exogenous factors, and the culture substrate, leading to laborious and time-consuming demands on investigators. Such cumbersome steps have been automated but require expensive fluid handling robotics that are unavailable to most laboratories.9–11
In contrast, microfluidic devices present many distinct advantages. These include better control of local microenvironment and endogenous signaling, reduced resource consumption, efficient multiplexing, and cost-effective automation.1,12–15 Microfluidics typically operate in the laminar flow regime, where viscous forces dominate over inertial forces.15,16 Mixing and flow become predictable and consistent quantities, with mixing generally dominated by diffusion. The working medium volume is also significantly reduced compared with conventional culture techniques, from the milliliter scale down to micro- or nanoliters. In this way, the concentration of relevant endogenously secreted proteins becomes both biologically significant and controllable.12,13 If the cell seeding density is controlled, these factors can be studied by varying the frequency of medium perfusion within the microfluidic culture wells.1,12,13 Thus, multiplexing becomes possible by controlling flow analogous to the current control in an electric circuit; the average volumetric flow rate varies proportionately to hydraulic resistance, a function of channel length and cross section, for a given pressure difference between the channel inlet and outlet.15–17 In this way, many small culture wells receiving culture medium of different compositions can be constructed on a single device,18–23 increasing efficiency of experimentation while minimizing user workload.
When studying the effects of multiple variables on various cell types, the most efficient and powerful experimental design is factorial, where all factors of interest are tested in all possible combinations simultaneously. 24 Factorial design has the added benefit of allowing interaction effects among factors to be estimated. Previously, various devices have been developed that generate three- and four-factor, three-level full factorial designs for investigating the effects of medium composition and endogenous factor accumulation on differentiating hPSCs.3–6 These devices are designed for very slow, continuous medium flow. Endogenous factor exposure is varied spatially: each medium condition is presented to a series of connected culture wells, with the continuous flow causing an increase in secreted factors down the line (increasingly “conditioned” medium). This approach relies on the assumption that the secreted factors from each well are equivalent, which is unlikely in the view of the differences in cell phenotypes identified in sequential wells. Additionally, these kinds of data are difficult to apply directly toward optimizing differentiation conditions, since it is impossible to create the conditions in one culture well without affecting preceding wells.
To overcome these obstacles, we have developed two novel microfluidic devices that enable three- and four-factor factorial design experiments to efficiently test the exposure of soluble medium components on cells. By using multiple devices in tandem, endogenously secreted factors can be incorporated as a further variable by using different medium exchange frequencies between devices. Culture wells are kept isolated by long fluid channels that prevent diffusive contact between wells, allowing for batch medium perfusion. These devices passively perform dilution and mixing to create 9 or 16 independent complex mixtures from six or eight single-component master mixes fed to the inlets, dramatically decreasing user workload and the likelihood of pipetting errors.
After culture, response variables can be detected by on-chip immunocytochemistry (ICC) and confocal microscopy. While the devices were designed for factorial experiments, other experimental designs are also obtainable with the devices presented. To make these devices accessible to labs that may not be familiar with microfluidics, the devices described can be cast from 3D-printed molds, obviating a need for cleanroom facilities or specialized expertise. The fabricated device can be operated easily with a single syringe pump or pressure control system providing negative pressure at the outlet. As a specific application of this technology, we consider optimization of hPSC differentiation toward a target cell type (i.e., the auditory neuron lineage) and demonstrate on-chip ICC analyses. We have also developed R code 25 that can be used to determine the fluidic resistance network necessary to generate an arbitrary set of experimental conditions from a minimum number of inlets.
Materials and Methods
Microfluidic Device Design and Fabrication
Initial designs were created as circuit diagrams and modeled in LTSpice (Linear Technology, Milpitas, CA) to verify channel resistances that allowed for appropriate distribution and mixing in the culture wells. Resulting circuit diagrams were then used as reference for the fabrication of 3D-printed molds. Three-dimensional mold schematics were created using Autodesk Inventor (Autodesk, San Rafael, CA), and resulting files were printed at the highest available resolution (25 µm layer thickness) in clear or gray resin (GPCL02 or GPGR03, Formlabs, Somerville, VA) using a Form2 3D printer and accompanying Preform software (Formlabs). Printed molds were then washed with 100% isopropyl alcohol twice for 10 min. Molds were baked for 24 h at 70 °C to fully cure resin, as uncured monomer prevents casts from fully curing at the surface. Molds were treated with a solution of 50% ethanol and 1% Span80 (Sigma-Aldrich, St. Louis, MO) to facilitate release of casts from the mold after curing.
Polydimethylsiloxane (PDMS) was cast on molds to fabricate final devices. PDMS monomer (Sylgard 184, Dow Corning, Midland, MI) was mixed with curing agent in a 10:1 ratio per manufacturer instructions. Device layers were cast and fully cured by pouring the silicone mixture into molds, degassing the mold and solution for 1 h in a vacuum, and then baking for 24 h at 70 °C. Cured PDMS layers were removed from molds by cutting around the perimeter of the PDMS with a scalpel or razor blade and slowly peeling back the layer until it was free. Finished layers were then washed with 100% isopropyl alcohol.
To bond multiple layers together, the partial-cure bonding method was used. 26 The mold and solution for the lower layer were incubated at 70 °C until the surface of the PDMS was tacky (approximately 30 min). The fully cured top layer was then carefully placed on the partially cured layer, ensuring that channels were sealed (but not collapsed) and minimal air pockets were present. Channel connections between layers were punched with a 16-gauge blunt-tip needle (Covidien, Dublin, Republic of Ireland) or 1.2 mm biopsy punch (World Precision Instruments, Sarasota, FL). Outlets were punched with either a 21-gauge blunt-tip needle (Covidien) or 0.5 mm biopsy punch (World Precision Instruments). Blunt-tip needles were sharpened using a whetstone, leading to cleaner punches. Finished devices were bonded to a thin, partially cured PDMS layer in the bottom of a 150 mm petri dish to seal channels. A fully cured, thin PDMS sheet was placed over the top to seal holes punched through the top surface (with the exception of the inlets and outlet). Devices were finally filled with 1% (w/v) bovine serum albumin (BSA; Sigma-Aldrich) in Dulbecco’s Phosphate-Buffered Saline (DPBS; 21-030-CM, Corning, Corning, NY) by the method of vacuum filling 27 and covered with DPBS to prevent evaporation, and then incubated for 24 h at room temperature.
Microfluidic Device Validation
Devices were perfused with food dyes to qualitatively observe mixing and final well conditions. Blue, red, and yellow dyes were pooled over each inlet and drawn through the device via negative pressure at the outlet by using an NE-4000 Double Syringe Pump (New Era Pump Systems, Inc., Farmingdale, NY) set at a rate of 150 µL/min for the three-factor device and 1920 µL/min for the four-factor device, placing droplets over the device surface to create inlet sources (
To quantitatively investigate fluid distribution, a 100 μg/mL (three-factor device) or 130 μg/mL (four-factor device) solution of fluorescein sodium salt (Sigma-Aldrich) in DPBS was drawn through one inlet while a 10 μg/mL solution of fluorescein sodium salt was drawn through the remaining inlets via negative pressure applied at the outlet as previously. The device designs predict well concentrations for both the three- and four-factor devices of 40 μg/mL for high-concentration wells, 25 μg/mL for medium-concentration wells, and 10 μg/mL for low-concentration wells after perfusion. Images of each well were taken using a fluorescence microscope at 2× magnification and 50% light intensity, with 82.8 ms exposure to cyan LED light optimized for FITC fluorescence (MIRA Light Engine, Lumencor, Inc., Beaverton, OR). The process was repeated for each inlet on three independent devices for both the three- and four-factor device cases.
Images were analyzed using ImageJ (NIH, version 1.51d). 28 A region of interest was defined for the fluorescent well area in all images and used consistently for all analysis. Background regions were similarly defined. The average pixel intensity of the background times the well region of interest area was subtracted from the raw integrated pixel density of the well to compute the corrected integrated pixel density. This value was then compared with a standard curve constructed from 0.001, 0.01, and 0.06 mg/mL solutions of fluorescein sodium salt in DPBS perfused into each respective device to solve for the fluorescein concentration. Curves were created by pumping each solution through the outlet at a rate of 1000 µL/min prior to performing image analysis as for experimental conditions. Standard curves were created for each well, correcting for slight fabrication differences that could lead to erroneous readings. The fractional volume contribution from each inlet to each well was then computed as

where ρ is the volume fraction contributed to the well by the inlet in question, w is the measured fluorescein concentration in the well, CL is the known low-inlet concentration of fluorescein (10 μg/mL), and CH is the known high-inlet concentration of fluorescein (100 or 130 μg/mL). Volume fractions were normalized such that each well contained volume fractions summing to 1. Plots were created using SigmaPlot (Systat Software, Inc., Chicago, IL).
Diffusive isolation between the wells of the four-factor device was measured quantitatively by perfusing 130 μg/mL solution of fluorescein sodium salt in inlet 7 with a 10 μg/mL solution of fluorescein sodium salt perfused in the remaining inlets via negative pressure at the outlet at a rate of 1920 µL/min. Inlet 7 was selected as it results in the shortest path length between wells of high concentration and low concentration, a worst-case scenario for diffusion. The devices were kept at room temperature for 144 h in darkness except during imaging. Images of the wells were sequentially taken at 0, 24, 48, 96, and 144 h. Image analysis was performed as for the quantitative mixing experiment. Concentrations in each well were normalized to their initial concentration at t0. Data were collected for three independent devices. Average normalized concentrations and standard errors were computed for each well, and these values were then averaged over all initially high- and low-concentration wells and plotted using SigmaPlot. Standard errors were propagated and included as error bars. It is anticipated that at full diffusion, high-concentration wells would reach a normalized value of 0.625, while initially low-concentration wells would reach a normalized value of 2.5.
Human Embryonic Stem Cell Culture
Human embryonic stem cell (hESC) culture was performed using wells 1–9 of the three-factor device over a course of 5 days. In preparation for culture, the device was perfused with DPBS through the outlet at a rate of 150 µL/min. The device was then sterilized by exposure to ultraviolet light for 24 h in a Class II biosafety cabinet. The device was coated with hESC-Qualified, Ready-to-Use Geltrex (cat. A1569601, Thermo Fisher Scientific, Waltham, MA) by perfusing 80 µL through the outlet using a P20 pipette, and then incubated for 1 h at 37 °C and 15 min at room temperature as per manufacturer instructions.
Culture media, composed of 10 µM Rho Kinase Inhibitor (Ri) Y27632 (cat. 04-0012, Stemgent, Cambridge, MA) in mTeSR1 (cat. 85850, STEMCELL Technologies, Vancouver, British Columbia, Canada), was then perfused through the outlet at a rate of 150 µL/min for a total of 3100 µL. hESCs (Line H1 [WA01], WiCell Research Institute, Madison, WI) suspended in the same medium were loaded at a concentration of 2 × 10⁶ cells/mL via a P20 pipette for a total of 80 µL through the outlet. After all medium changes, the device was submerged in sterile DPBS to prevent evaporation while incubating. The submerging fluid was exchanged daily when medium was changed. The device was then incubated for 24 h in a 5% CO2 incubator at 37 °C to allow for cell attachment. Control experiments were terminated at this point by fixing and staining cells as described in the next section.
For differentiation experiments, differentiation toward the auditory-neuronal lineage was initiated on day 2 and continued for 72 h. Media was changed every 24 h by pooling differentiation media master mixes over their respective inlets ( Table 1 ) and drawing through the device at a rate of 150 µL/min as previously described via a single syringe pump connected to the outlet for a total volume of 3100 µL. Chemically defined medium (CDM), composed of 1% (v/v) N2 supplement, 2% (v/v) B27 supplement, 2 mM glutamine, and 100 μM beta-mercaptoethanol in a 1:1 ratio of Dulbecco’s modified Eagle’s medium (DMEM)/F12 and Neurobasal medium (all reagents from Life Technologies, Carlsbad, CA), was used as the base medium for differentiation master mixes as in our previous published protocol for the generation of auditory neurons. 29 Ten microliters of Y27632 (Rho Kinase Inhibitor; Sigma-Aldrich) was included in the media for the first 48 h of differentiation to prevent cell death. Media master mixes were made fresh each morning. The device was maintained in a standard incubator at 37 °C, 5% CO2 between media changes.
Differentiation Master Mix Composition and Corresponding Device Inlet That the Solution Was Fed to for Stem Cell Differentiation.
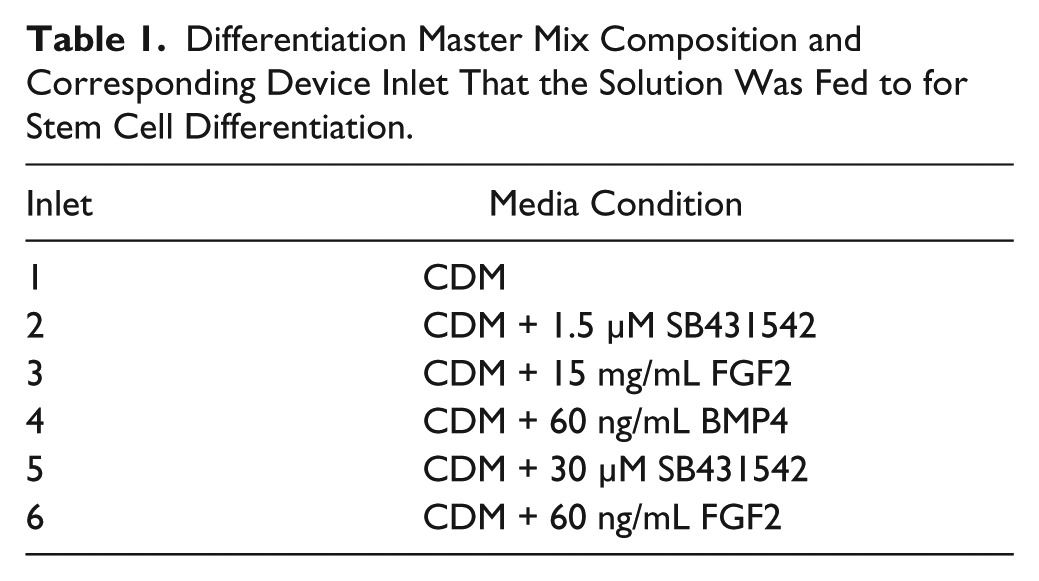
Culture and differentiation in conventional plate cultures were performed as outlined above in six-well plates, with several differences specific to the platform: daily medium changes were performed manually with pipettes rather than with a syringe pump, a culture volume of 2.5 mL medium per well was used, and cells were seeded at a density of 1.0 × 10⁴/cm2. 29 CDM was used as the base medium for differentiation and supplemented either with 10 ng/mL BMP4 and 10 ng/mL FGF2 or with 10 ng/mL BMP4, 10 ng/mL FGF2, and 1 μM SB431542.
Immunocytochemistry
After differentiation, cells were fixed by adding 150 µL of 4% (w/v) paraformaldehyde (PFA) in DPBS solution to the outlet via a syringe pump at a rate of 150 µL/min. The device was incubated for 10 min at room temperature. PFA was withdrawn by removing 200 µL from the outlet at a rate of 150 µL/min, and then quenched by adding 200 µL of 0.1 M glycine in DPBS at the same rate. The device was incubated for a further 5 min at room temperature, and the quenching step was repeated. Two hundred microliters of 0.25% (v/v) solution of Triton X-100 (Sigma-Aldrich) in DPBS was added to permeabilize cell membranes and incubated in the device for 8 min at room temperature. The device was then flushed with filtered 5% BSA (w/v) solution in DPBS through the outlet for a total volume of 3100 µL at a rate of 150 µL/min and incubated at room temperature for 30 min. Two hundred microliters of primary antibody solution diluted in 5% BSA solution was perfused through the outlet at a rate of 150 µL/min. The primary antibodies included depended on the experiment and were used as follows: 1:100 ratio of anti-DLX3 antibody (mouse, cat. SAB1412375, Sigma-Aldrich); 1:50 ratio of anti-Brachyury (rabbit, cat. NBP2-2467655, Novus Biologicals, LLC, Littleton, CO); 1:150 ratio of anti-OCT3/4 (goat, cat. SC-8628, Santa Cruz Biotechnologies, Dallas, TX); 1:150 ratio of anti-Nanog (rabbit, cat. AB21603, Abcam, Cambridge, MA); and 1:50 ratio of anti-SSEA-4 (mouse, cat. MAB4304, Millipore, Burlington, MA). The device was then incubated for 1 h at room temperature before being washed with 3100 µL of DPBS. Two hundred microliters of a secondary antibody solution diluted in 5% BSA (w/v) was perfused through the outlet, and then the device was incubated for 1 h in the dark at room temperature. Secondary antibodies were always included at a ratio of 1:400. The specific antibodies used varied depending on the experiment, taken from the following list: donkey-anti-mouse Alexa Fluor 488 nm (cat. A21202), donkey-anti-rabbit Alexa Fluor 594 nm (cat. A21207), donkey-anti-goat Alexa Fluor 488 nm (cat. A11055), donkey-anti-rabbit Alexa Fluor 647 nm (cat. A31573), and donkey-anti-mouse Alexa Fluor 594 nm (cat. A21203); all secondary antibodies were purchased from Thermo Fisher Scientific. The device was again washed with DPBS. A solution of 300 nM DAPI (cat. D1306, Invitrogen, Carlsbad, CA) in DPBS was perfused and incubated for 5–10 min at room temperature, followed by another DPBS wash. A 5% BSA solution was finally perfused through the device as mounting solution. In six-well plate cultures, cells were fixed and stained as described previously. 29 Fluorescence images of each well were captured using either a Nikon A1 inverted confocal microscope or Nikon Ti2 widefield microscope, each with a 20× objective. Quantification of positive cells was determined using corrected total cell fluorescence based on Burgess et al.’s formula (Supplemental Information). 30
Statistical Analysis
Statistical analysis was performed with one-way ANOVA (with Tukey–Kramer’s post hoc test to identify significant differences between means while controlling the family-wise error rate). A free statistical software package, R (version 3.2.5), was used to perform these tests. 25 Mean values are typically expressed as mean ± standard error. A significant p value is indicative of a significant difference where the probability is less than 0.05 (p < 0.05), 0.01 (p < 0.01), and 0.001 (p < 0.001).
Results and Discussion
Device Design
Factorial design experiments have two distinct advantages over investigating one factor at a time when there are multiple variables of interest: (1) cooperative interaction effects are estimated, where in the one-factor approach they are ignored entirely, and (2) for a given statistical power, the combinatorial approach requires a smaller sample size to identify factor effects. The experimental increase in efficiency over the one-factor approach increases with the number of factors of interest. One drawback to these experiments is that they require an exponentially increasing sample size as the number of samples increases. With microfluidics, medium distribution can be controlled to deliver reagents to cell culture wells in efficient parallel fashion, modeling flow with a hydraulic equivalent to Ohm’s law.15–22,31 To facilitate the use of factorial experiments, we designed devices that create the necessary independent conditions for three- and four-factor experiments, multiplexing 8 or 16 runs in parallel.
One drawback of this approach is missing potential nonlinear effects when investigating only two levels of a factor.24,32 To overcome this drawback, two-level designs are commonly augmented with a further condition where all factors are measured at the midpoint of the high and low levels, termed a center point. Thus, if nonlinearity is present with any factor, it can be detected and investigated further. For these reasons, three replicated center point wells (wells 9–11) were included in the three-factor device. Due to spatial constraints, center point wells were omitted from the four-factor device; however, center points could still be run using multiple devices.
Using the hydraulic analogy to electric circuits, microfluidic devices can be designed by hand to distribute fluids arbitrarily. An incompressible fluid undergoing laminar flow at steady state follows an analog to Ohm’s law known as the Hagen–Poiseuille equation:16,17,20,31

where ∆P is the pressure drop across the channel, Q is the average volumetric flow rate, and R is the hydraulic resistance to flow, given by

for a fluid of viscosity m, cylindrical channel of radius r, and length L, or
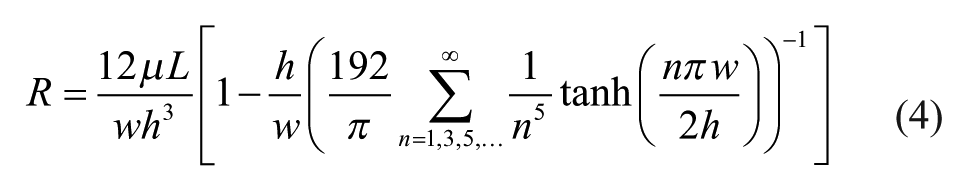
for a rectangular channel cross section of width w and height h, where n is the index of summation. Applying conservation of energy and momentum gives further analogs to Kirchoff’s voltage and current laws, which can be applied to a fluidic circuit to compute the channel resistances necessary to control current through the device. As in an electric circuit, “wire” channel resistance can be approximated as negligible when the channel has very low resistance (large cross section) compared with “resistor” channels. Controlling the volumetric flow rate from one part of the device to another is then a matter of designing an electric circuit with appropriate resistance values.
The important variable to control for maintaining mixing fractions in wells is the ratio of resistances to one another, rather than absolute channel resistances. As such, a variety of cross-sectional areas can be chosen, so long as laminar flow is maintained in the device during operation. Higher total resistances tend to minimize unwanted flow from hydrostatic pressure differences, while smaller resistances with larger-cross section channels make fabrication more consistent and equilibrate more quickly to flow driven by a syringe pump. We used resistor channel cross sections of either 100 × 80 µm or 150 × 200 µm and wire channels of either 300 × 300 µm or 900 × 900 µm (
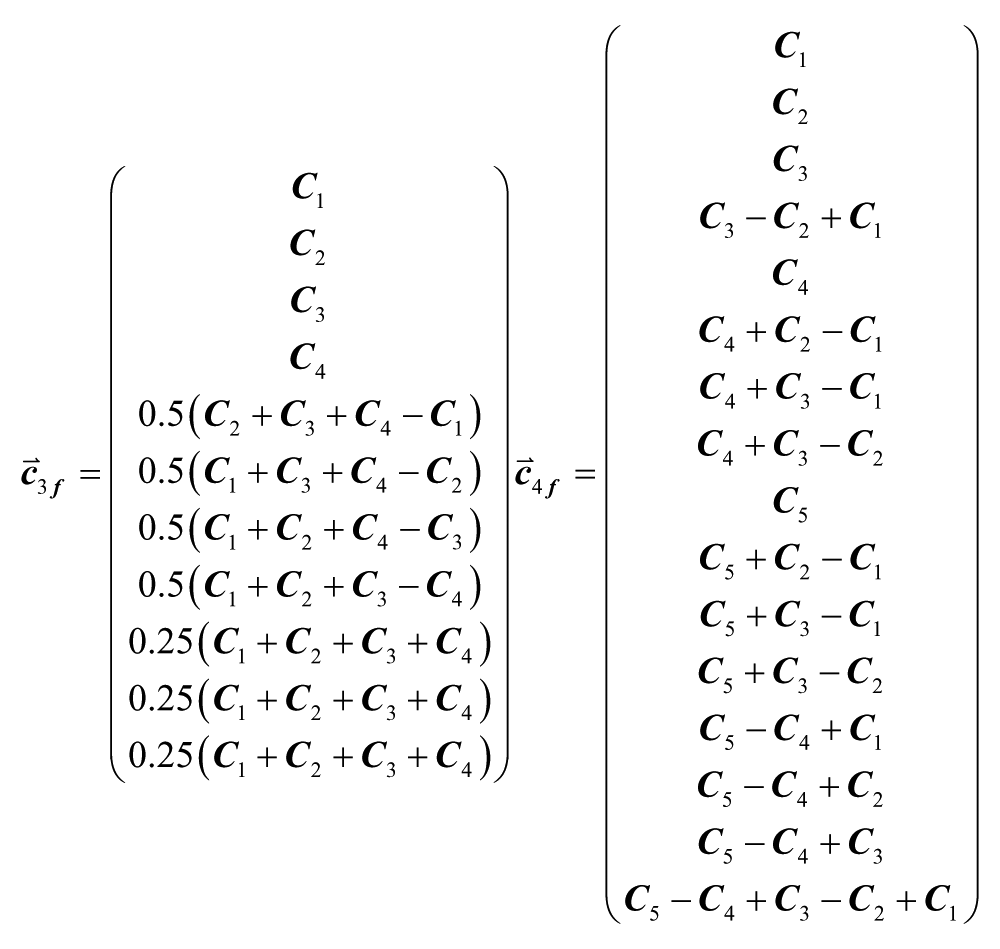
Microfluidic circuits were designed to automatically distribute medium for both a three-factor, two-level experimental design with three center points and a four-factor, two-level experimental design from minimally complex inlet solutions (i.e., high and low concentrations for each factor). To generate a resistance network that creates a desired set of concentrations in wells from a given set of inlet conditions, the device can be modeled as a matrix by the relation

where
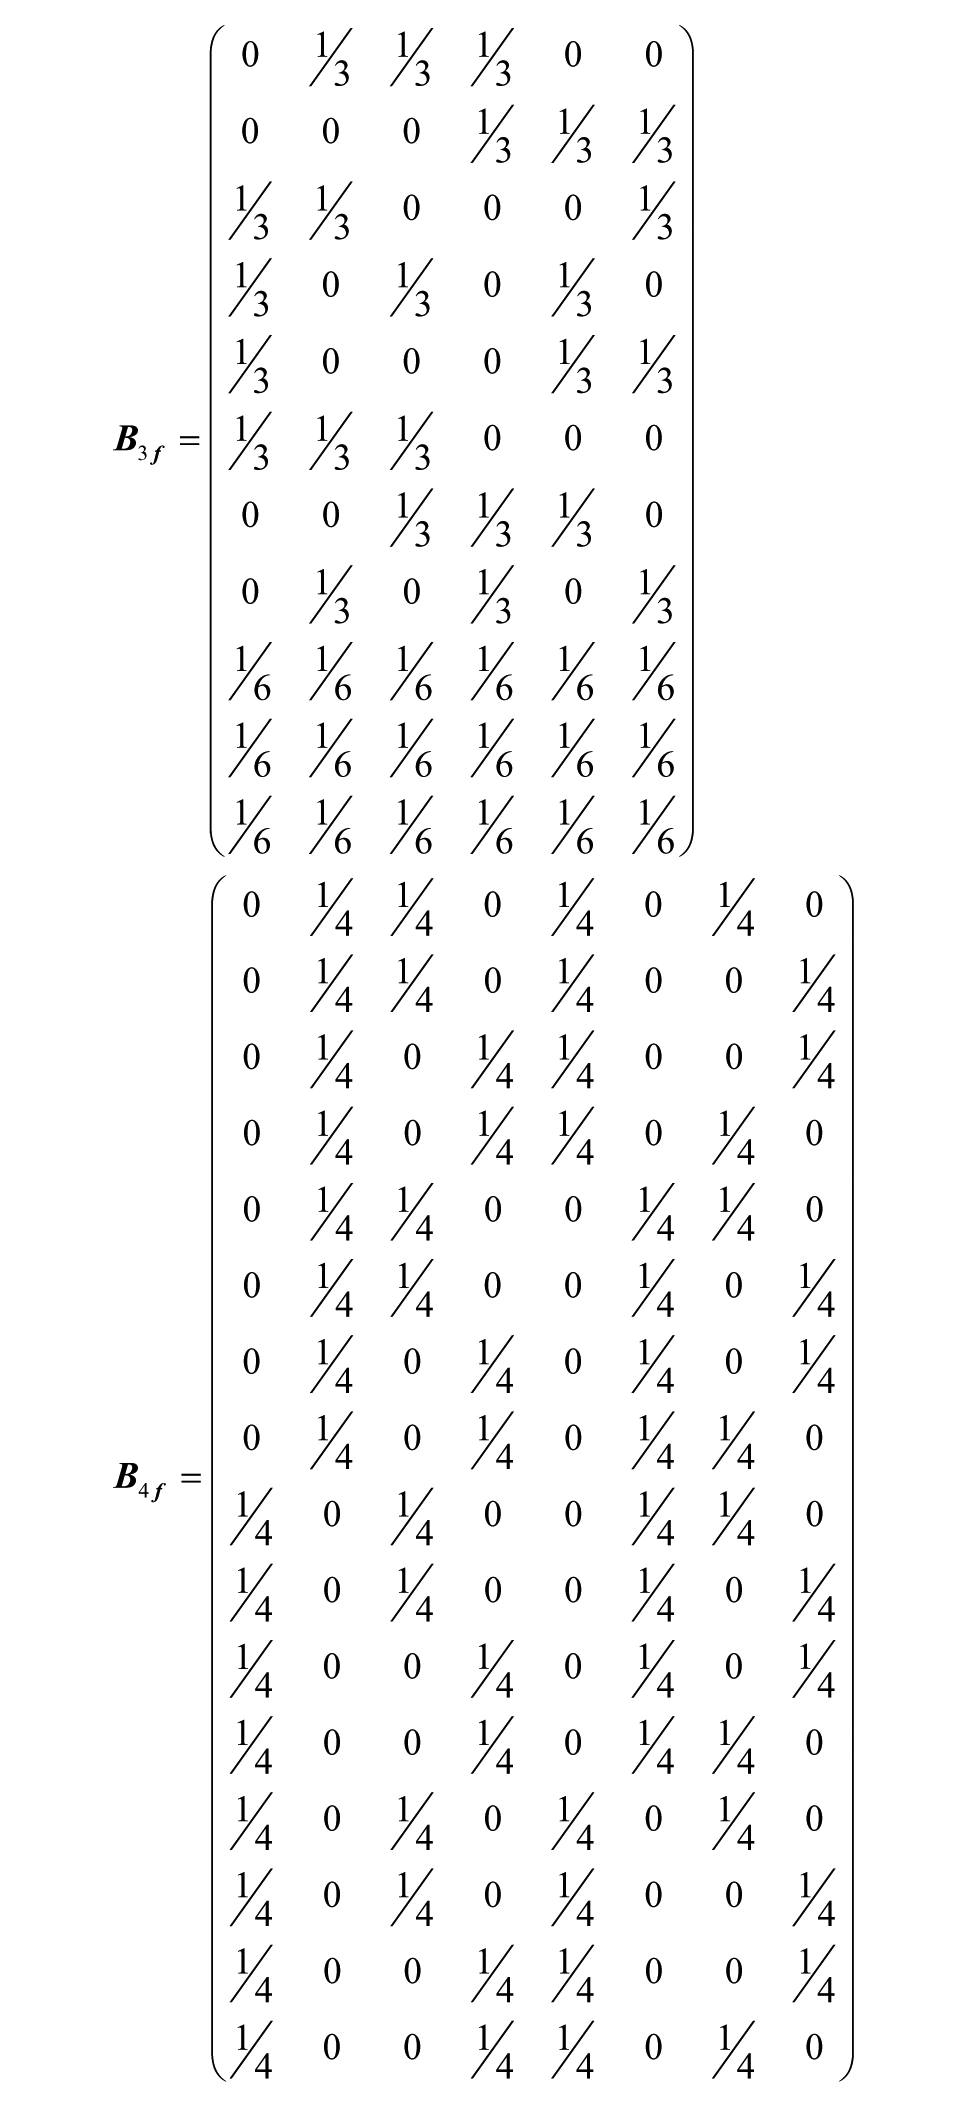
These matrices predict the device flow distributions (
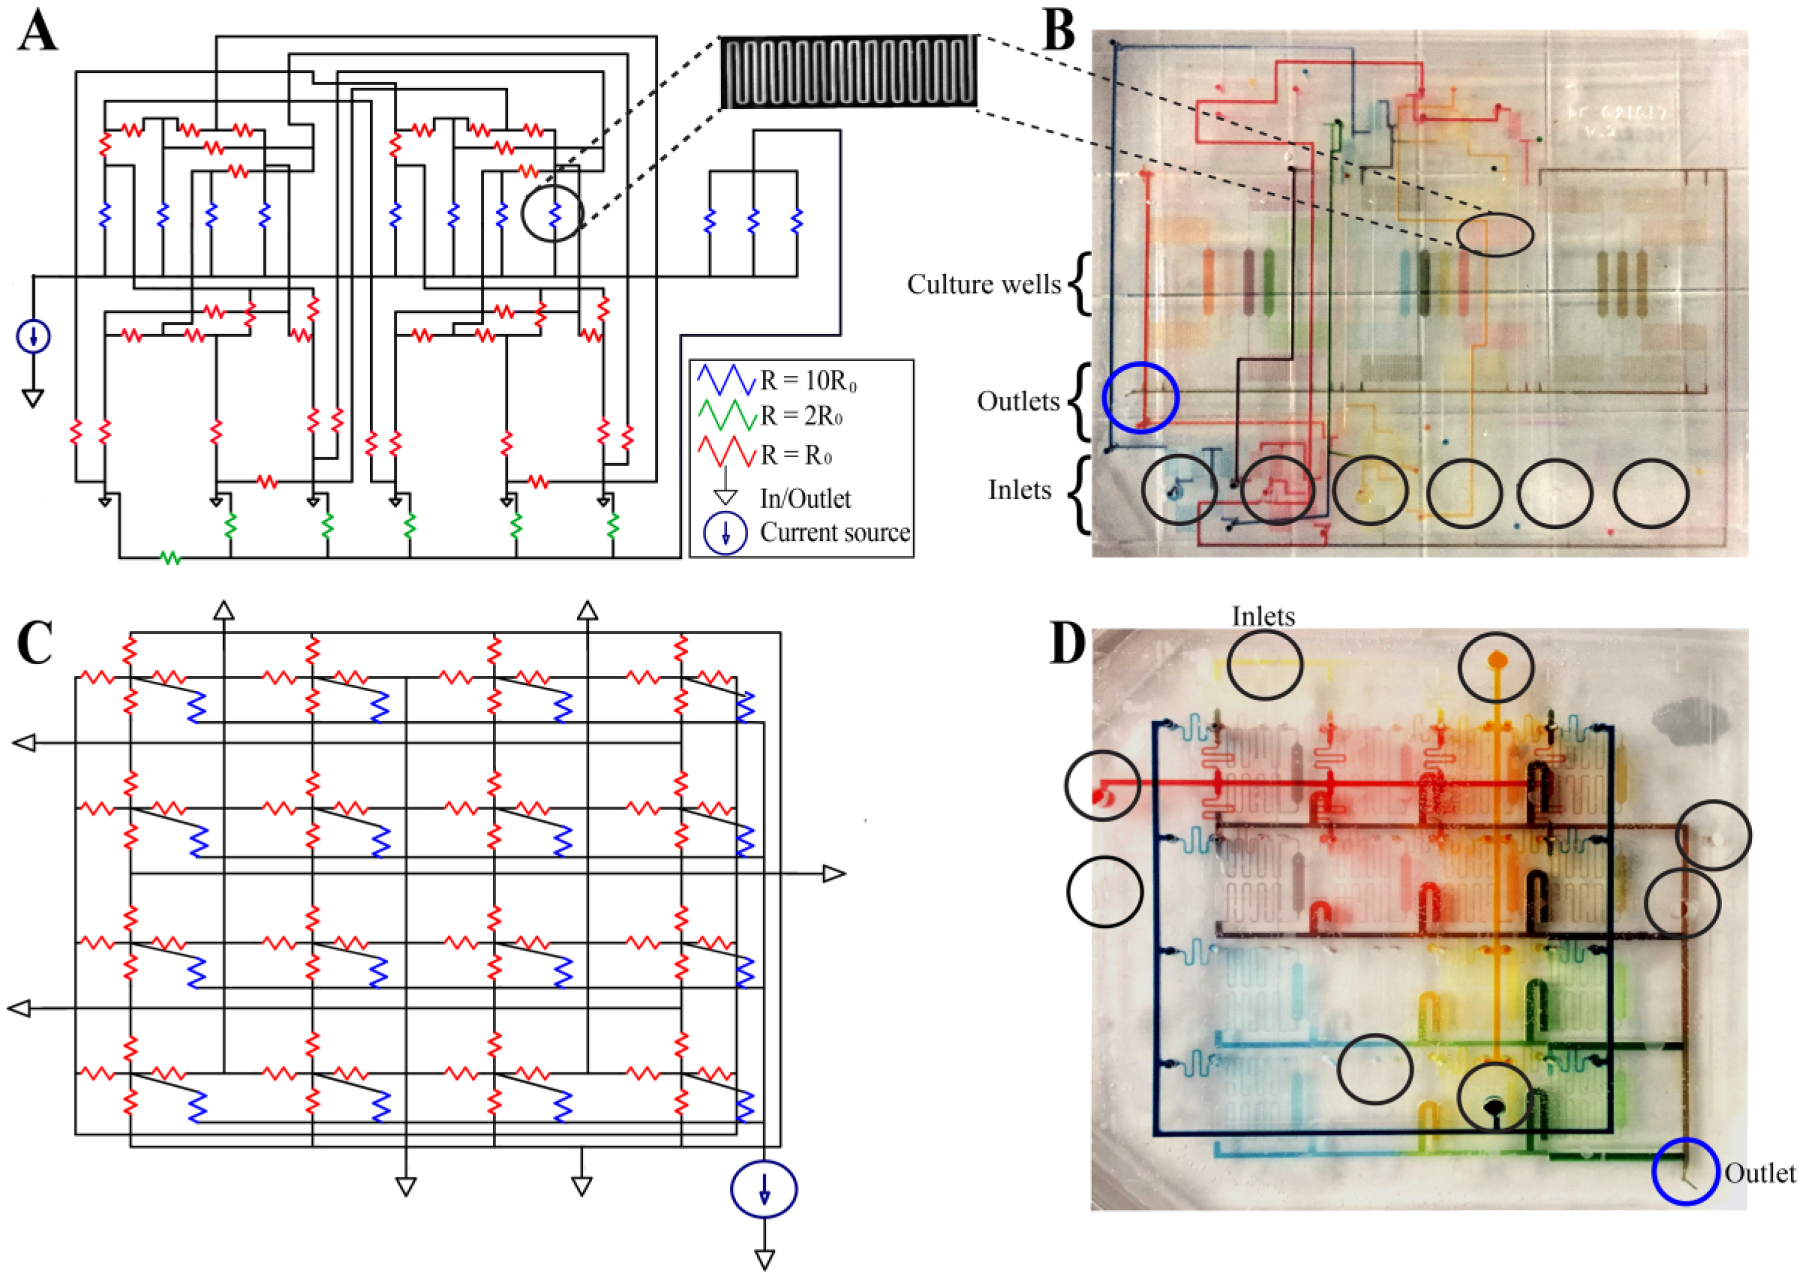
Microfluidic device designs and construction methodology. The three-factor device was designed first as an electric circuit (
Device Fabrication
Channel geometries were based on the hydraulic analogy to electric circuits and subsequent simulation in LTSpice to verify the desired flow conditions (
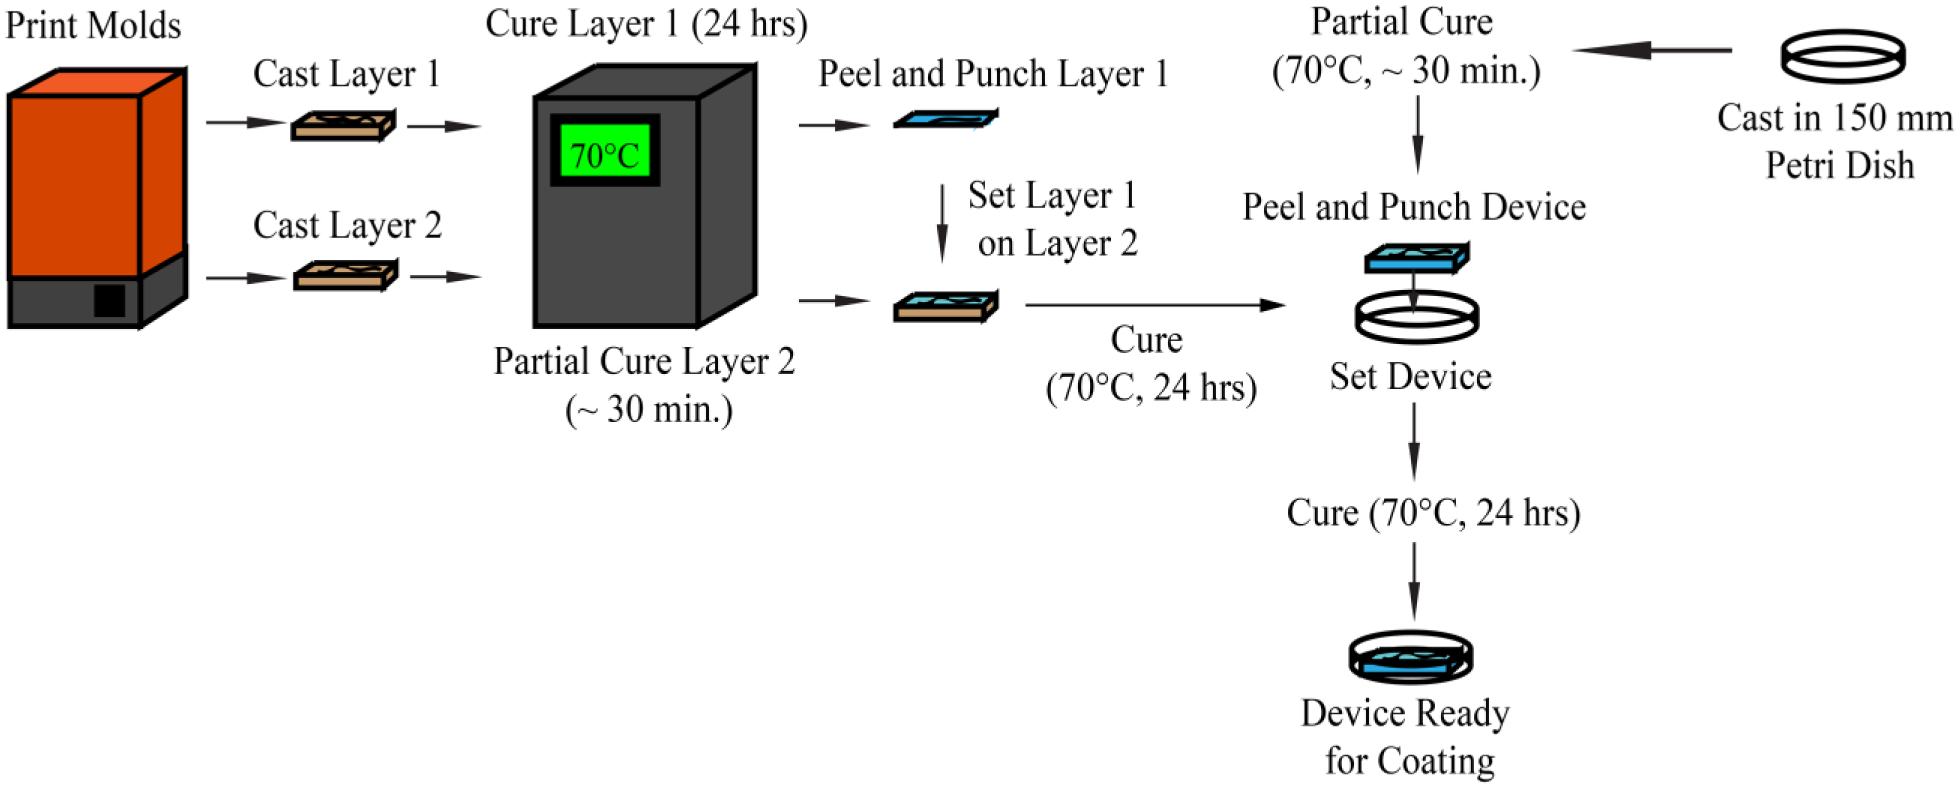
The fabrication process of the three- and four-factor microfluidic devices.
Multilayer devices were formed by the method of partial-cure bonding
26
in a layer-by-layer manner (
Prior to use, the hydrophobic surface of the PDMS device must be treated to protect against nonspecific protein adsorption.37–43 Protein absorption (i.e., change in fluorescence normalized to average untreated fluorescence) was best attenuated by BSA treatment compared with other methods (
Fluid Mixing and Distribution
Food dyes were used to qualitatively visualize medium distribution after flow through each device. Both devices are designed to construct all mixing combinations of three or four soluble factors at two levels. For the three-factor device, the high level of each factor contained dye (blue, red, or yellow), while the low level contained no dye (
The three- and four-factor food dye experiments are visualized graphically to show the predicted color combinations in each case (
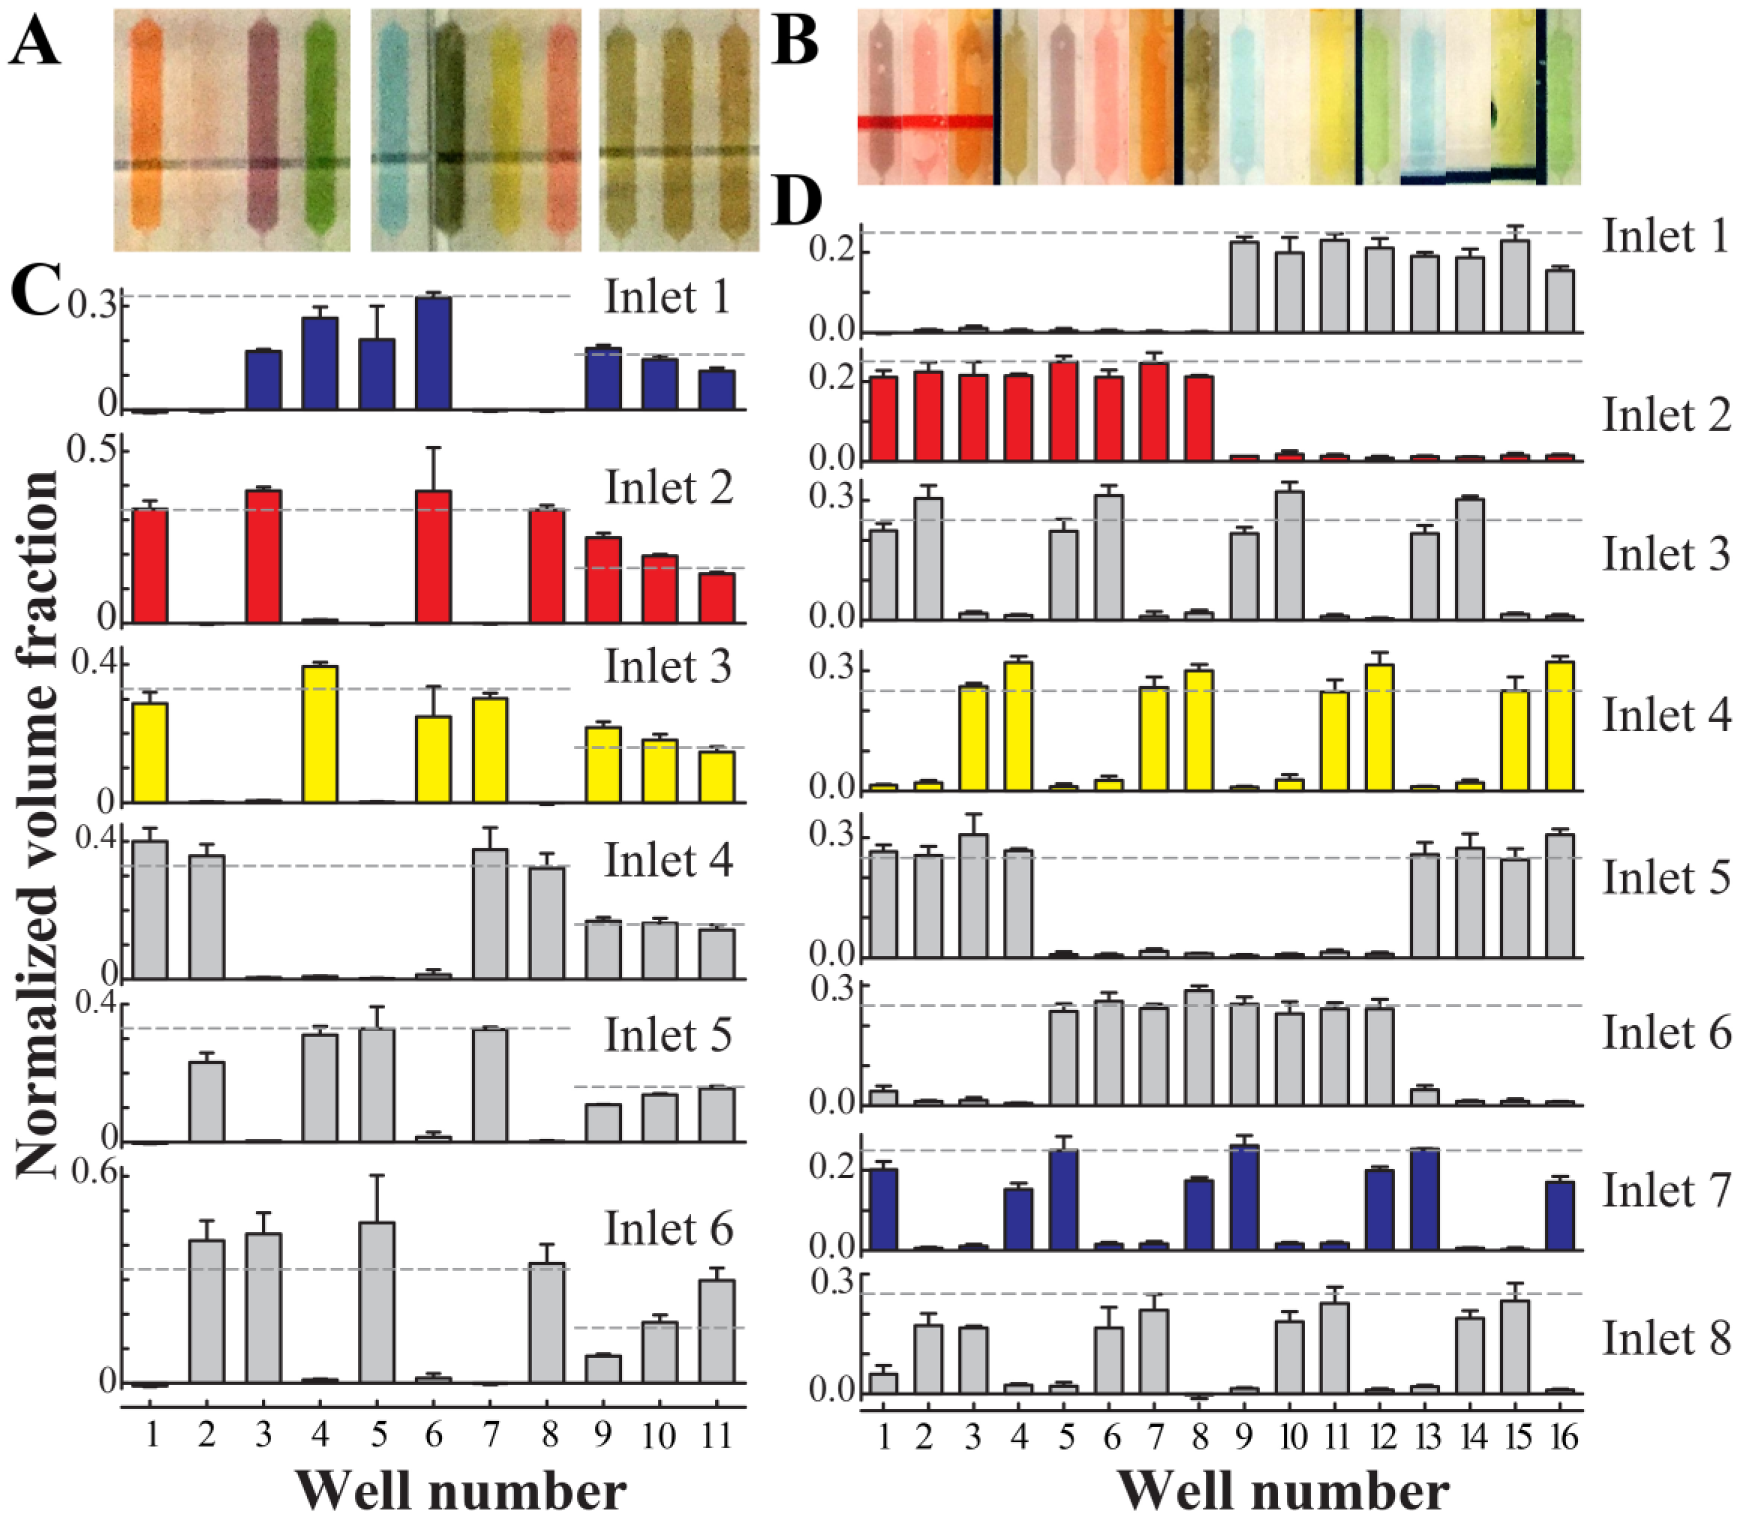
Quantitative validation of the culture well conditions. During operation, each well of the three-factor (
Diffusive Isolation and Modeling
Endogenous factor concentrations will be controlled by varying medium exchange frequency, requiring flow stoppages lasting up to several days. Wells must be isolated to prevent cross-contamination. We achieve this with long, serpentine resistance channels (
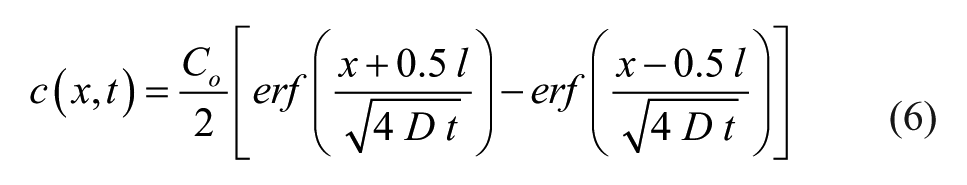
Here, C0
Time to Reach Indicated Percentage of Initial Culture Well Solute Concentration at the Well Edge for Several Representative Solutes Based on Indicated Diffusion Coefficient. 16
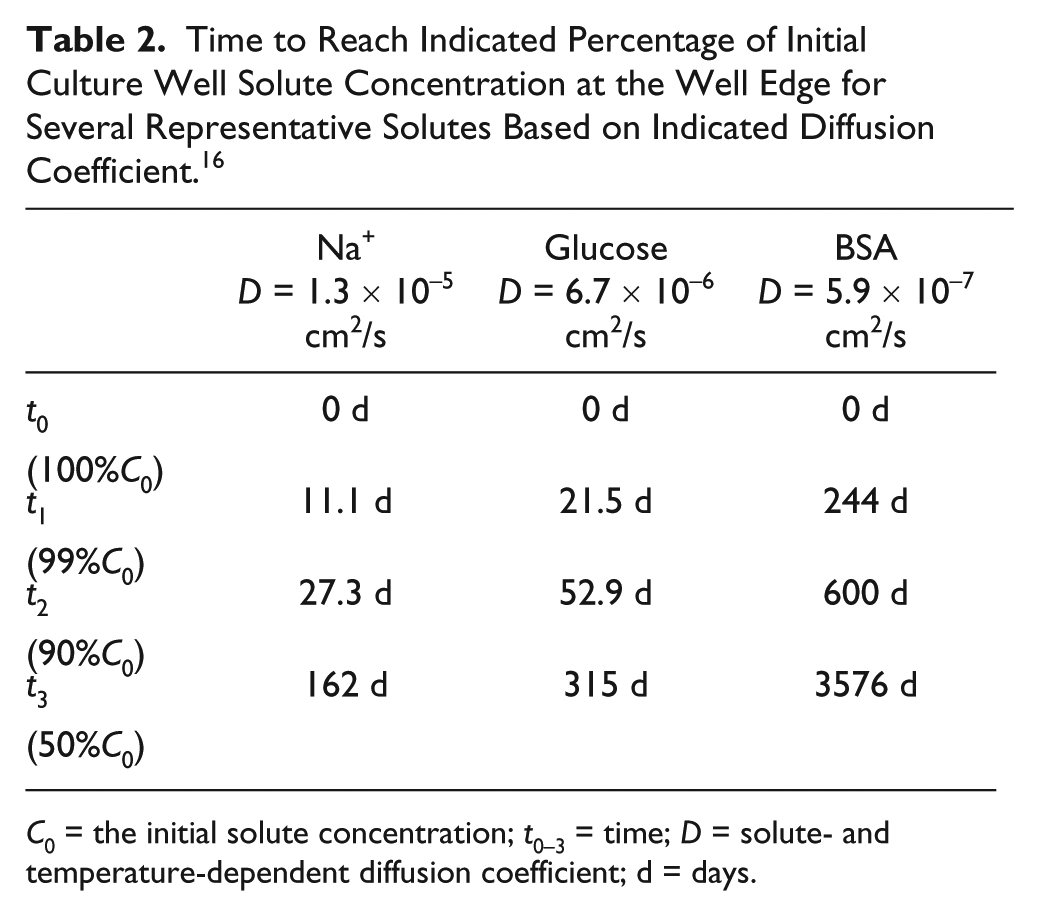
C0 = the initial solute concentration; t0–3 = time; D = solute- and temperature-dependent diffusion coefficient; d = days.
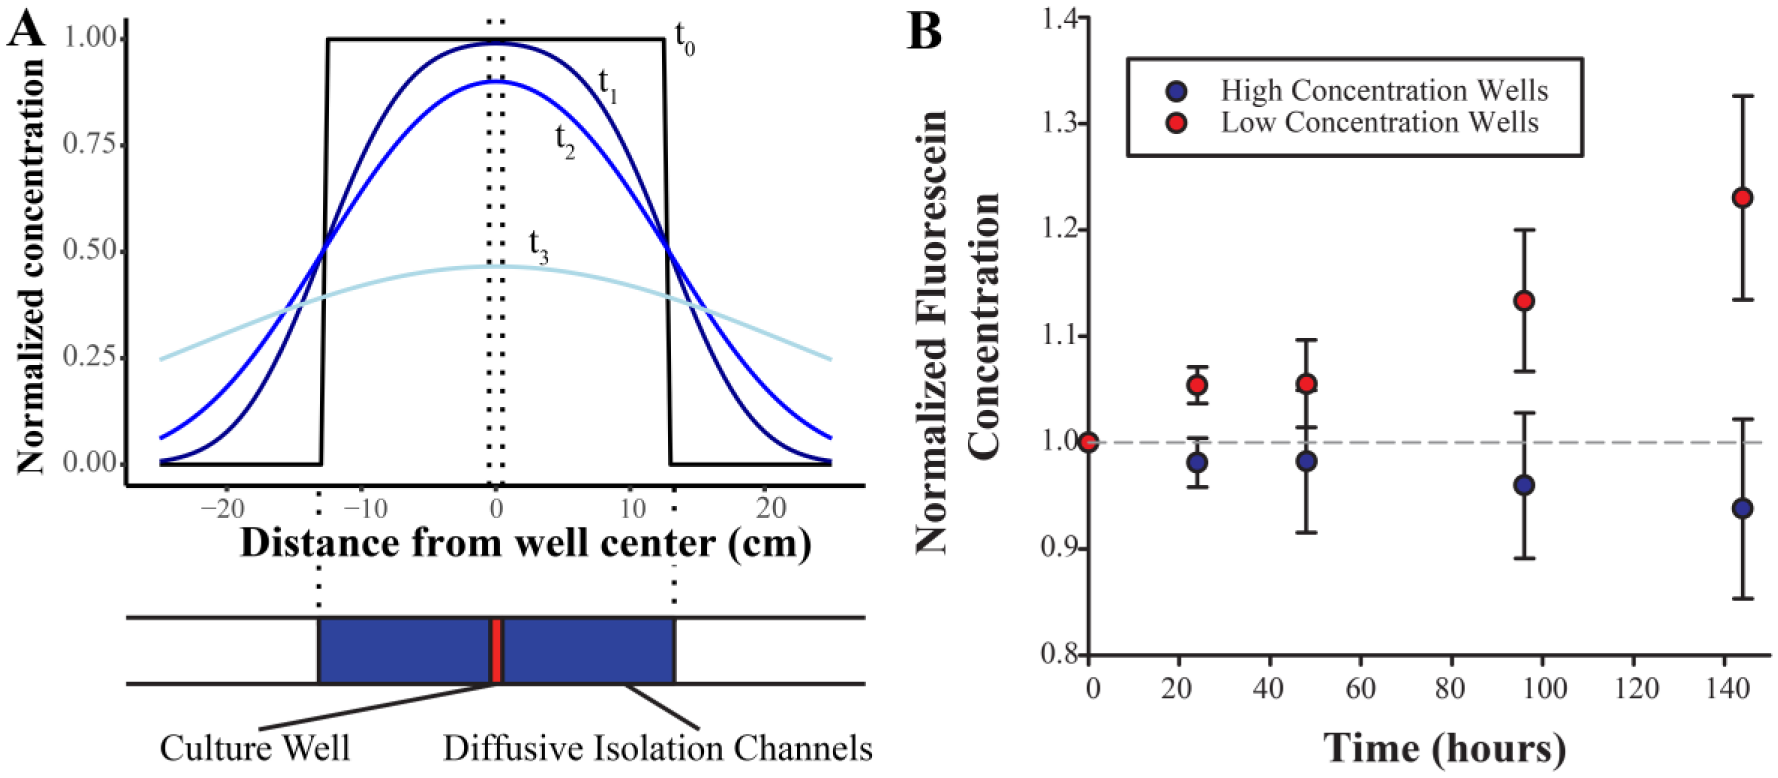
Diffusive isolation of culture wells was modeled in one dimension based on channel lengths from the four-factor device (
Well isolation was validated by perfusing high-concentration fluorescein into inlet 7 of the four-factor device and low-concentration fluorescein into all others as in the fluid distribution validation experiment. Images of each well were collected over a 144 h period. Empirically, well fluorescence stayed at less than 5% of the expected fully diffused fluorescence in both high- and low-concentration wells for over 48 h; it is thus recommended to choose medium exchange rates within this time frame to justify the assumption of independent culture conditions. It is unlikely that medium changes would occur outside of this range. The inlet 7 condition was chosen to place each high-concentration well next to a low-concentration well. This creates the shortest distance between high- and low-concentration regions on the device and is thus the worst-case diffusion scenario.
Cell Culture and Immunocytochemistry
To demonstrate the utility of the presented devices, we cultured H1 hESCs using the three-factor device under differentiation conditions toward the nonneuronal ectoderm (NNE) lineage over a 3-day period. NNE lineage differentiation is the first step to generate human auditory neurons from hESCs.
29
Three soluble factors, BMP4 (TGF-β superfamily of proteins), SB431542 (BMP/TGF-β signaling pathway inhibitor), and FGF2 (growth factor), were evaluated in their ability to direct hESCs to the NNE fate using a two-level, three-factor factorial design with a single center point condition. After 3 days in culture, cells were fixed, permeabilized, and stained for NNE marker DLX3 and mesendoderm marker Brachyury. Images were obtained within the device by confocal microscopy for each tested condition (
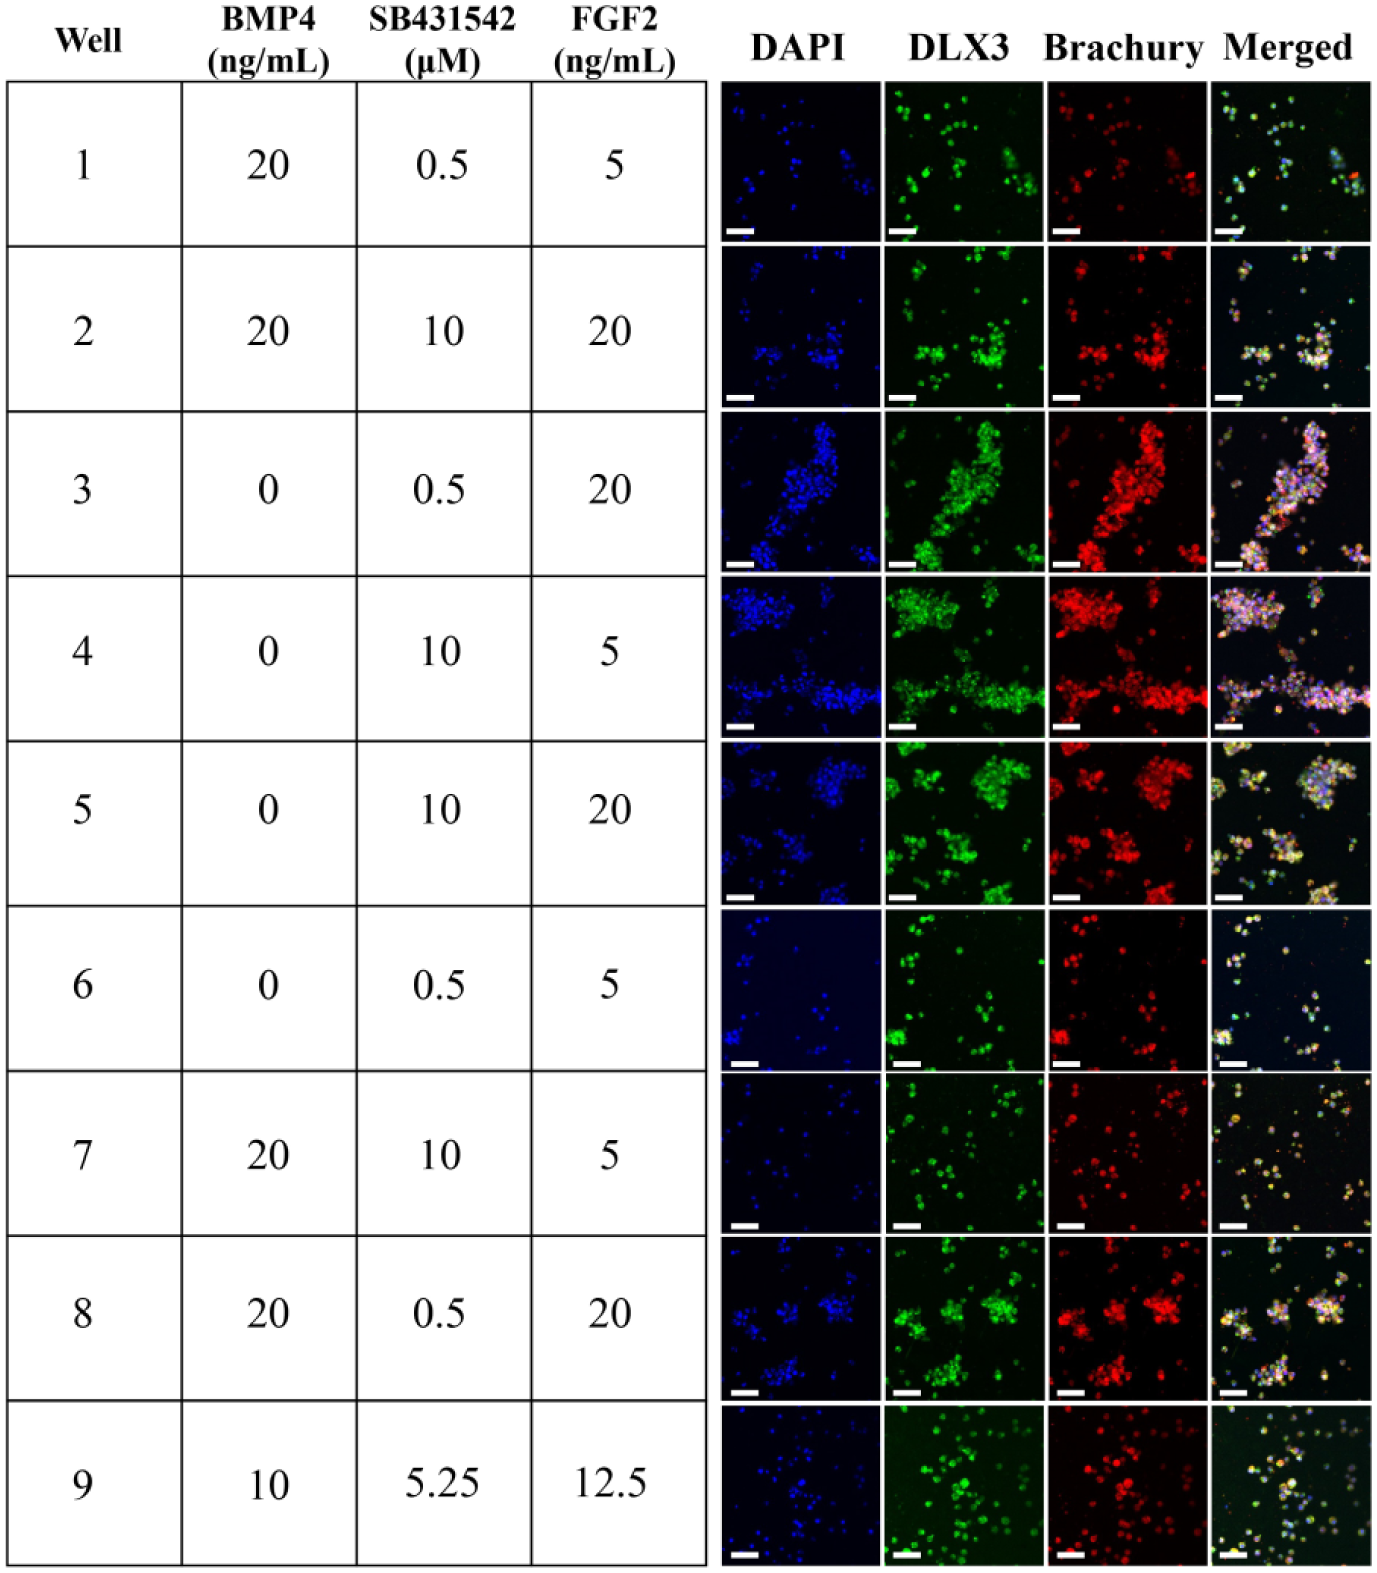
In situ ICC of 3-day, on-chip hPSC differentiation using the three-factor device. Target well conditions in each of the three variable factors (BMP4, SB431542, and FGF2) are given for each well, along with corresponding in situ fluorescence ICC images. Only 9 of the 11 wells were investigated in this experiment. Scale bar = 100 µm.
In recently published work, we devised a modular protocol allowing for differentiation of hESCs into otic neuronal progenitor cells (ONPs) by stepwise exposure to diffusible ligands that mimic native development conditions, beginning with the differentiation to NNE cells by 72 h of exposure to 10 ng/mL BMP4, 1 μM SB431542, and 10 ng/mL FGF2 in N2/B27 CDM with daily medium changes. 29 Although our study determined working concentrations for the diffusible factors used, further optimization may improve differentiation efficiency for clinical translation. Our initial study also did not explore potential benefits from incorporating endogenously secreted factors into the differentiation protocol. Endogenous factor accumulation to biologically relevant levels, leading to auto- and paracrine signaling events, will likely alter process characteristics during hESC differentiation. Previous work suggests that allowing factors to accumulate directs stem cells to differentiate toward an ectoderm lineage,1,2,12 supports growth of hippocampal neurons, 44 and can increase the reprogramming efficiency of fibroblasts to induced pluripotent stem cells (iPSCs) by one to two orders of magnitude. 13
When cultured in a microfluidic environment with exposure to all combinations of two levels of the three exogenous factors and a medium exchange frequency of 1 d−1, cells were nearly uniformly positive for both DLX3 and Brachyury by ICC, even in wells with no exogenous BMP4 (
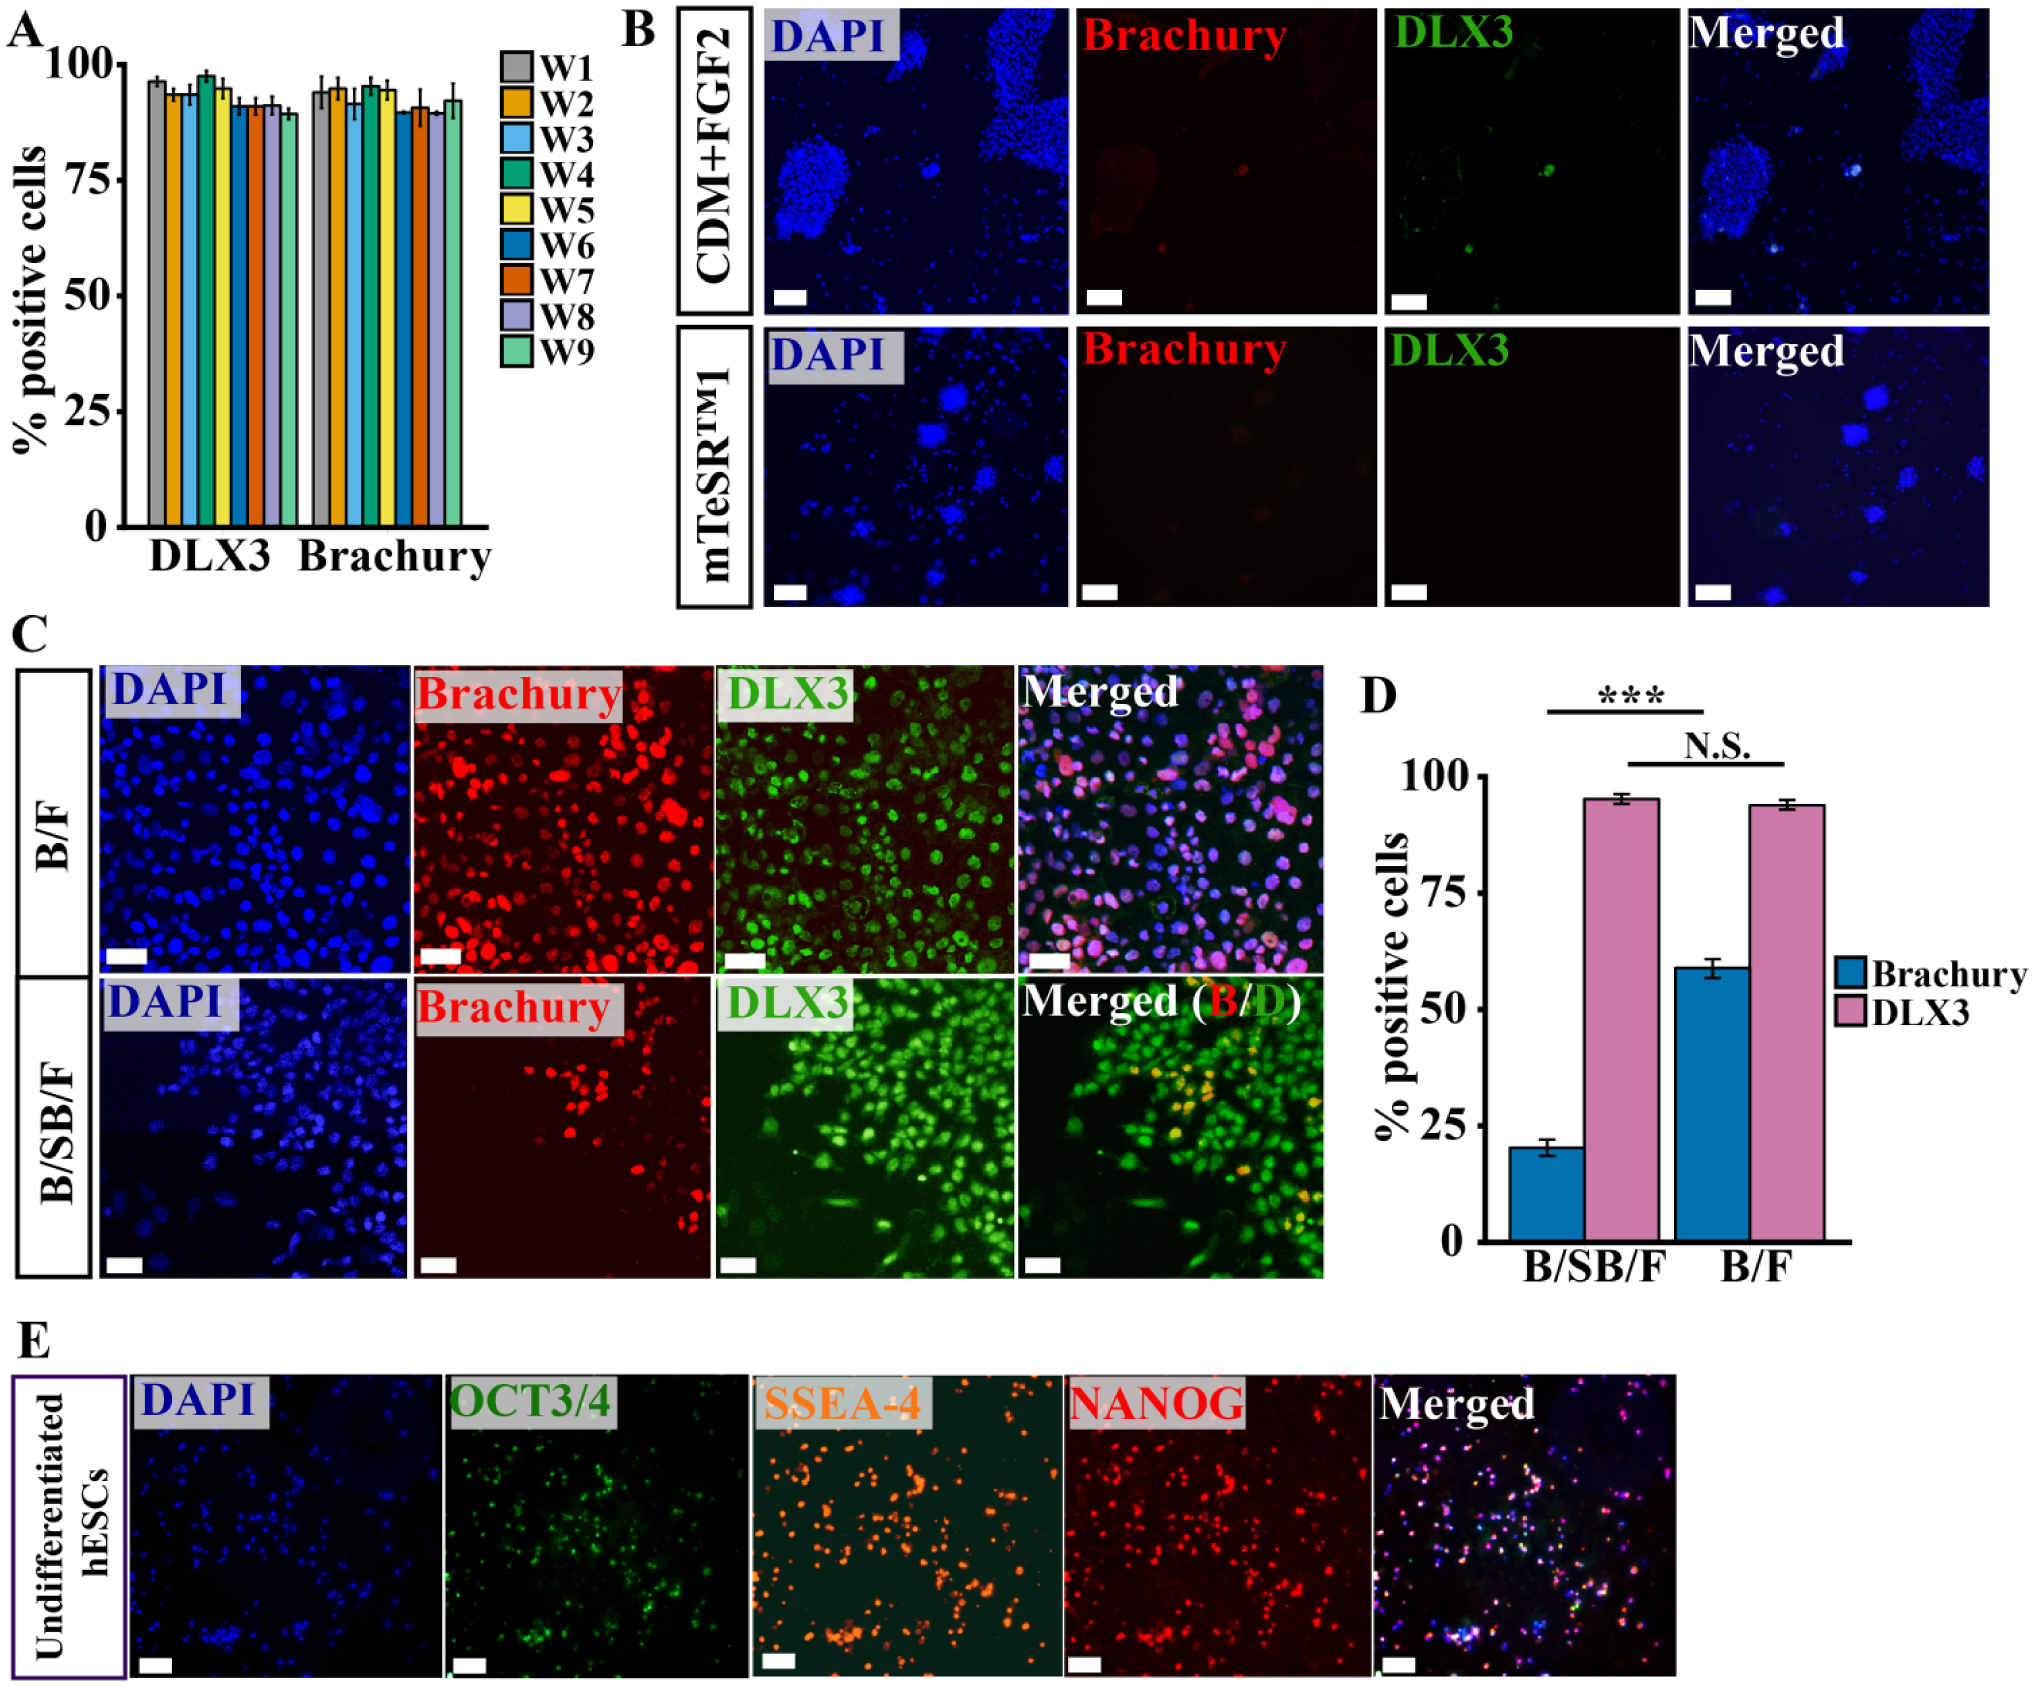
Immunocytochemical comparison of differentiation in microfluidic and conventional culture wells. Quantification of images from the experiment depicted in Figure 5 reveals that 89%–98% of cells are positive for state markers DLX3 and Brachyury (
The uniform populations observed in the three-factor experiment (
To demonstrate pluripotency prior to differentiation, we seeded cells in the three-factor device, allowed for attachment, and then stained for three pluripotency markers (OCT3/4, NANOG, and SSEA-4) at the point when differentiation with exogenous factors would otherwise have been initiated. We found that cells uniformly expressed these markers (
Alternative Experimental Designs and Design Tools
Although these devices were designed to generate three- and four-factor, two-level full factorial experimental designs, other designs can be generated by varying the conditions at the inlets; this has already been shown in the case of the four-factor device, wherein we generated a replicated three-factor design rather than a four-factor design with food dye (

where I is the identity matrix and Bg is the Moore–Penrose generalized inverse of
Although there are only four and five degrees of freedom in the choice of well concentrations, useful sets of experimental conditions can still be generated. In general, the inlet conditions that create a consistent set of well concentrations are not uniquely defined but are given by

where
where C0 is an arbitrary constant (maintaining inlet ordering as in Figure 1B , numbering wells from left to right). This could be used to efficiently screen a single reagent on cells for effective concentrations.
Although these devices adequately generate factorial and other designs, it is possible to simplify the devices and reduce the number of inlets and master mixes needed. The minimum number of inlets necessary to generate a full factorial design with n factors is given by n + 1, intuitively because there must be one inlet per factor to allow arbitrary mixing ratios of factors with one another, and an additional inlet for buffer to dilute them.
Interestingly, this is also true of a fractional factorial design
24
with n factors, as the set of conditions tested in fractional designs is chosen to maximize coverage over the design space. By the nature of fractional factorial designs, a resistance network that can generate a fractional factorial design with n factors will always be able to generate a full factorial design with n – 1 factors, while the converse is not guaranteed. Having sufficient inlets and the ability to generate a full factorial design of n factors is also not sufficient for the generation of a higher-order fractional factorial design. For instance, the devices presented here that generate full factorial designs investigating n factors have 2n inlets but are unable to generate a fractional design for even
To enable the rapid design of resistance networks to create arbitrary experimental conditions, we developed a function for the freely available coding language R that accepts the number of factors being investigated and a matrix describing the desired culture well conditions as inputs, and then outputs the required resistance values in the fluidic circuit, as well as a manipulatable network plot showing all circuit connections (Supplemental Information). The output network uses the minimum number of inlets needed to create the user-defined mixtures of all factors. It is assumed that flow will be driven by a single negative outlet pressure or constant positive pressure at all inlets. Using these resistance values, one can quickly determine acceptable channel cross sections and construct a microfluidic mold in 3D CAD software (such as Autodesk Inventor) for 3D printing.
In conclusion, present two novel microfluidic devices for performing three- and four-factor, two-level full factorial cell culture experiments involving soluble medium components in a microenvironment. Cultures are multiplexed on a single chip such that 9 or 16 independent, complex conditions can be tested on cells in parallel from six or eight single-component master mixes. These devices can be fabricated without access to cleanroom facilities or specialized equipment, with the exception of a 3D printer, and require only a single syringe pump for operation. In situ ICC and confocal microscopy can be performed as an endpoint readout for culture experiments. Although factorial design experiments are recommended, the presented devices can also form a wide array of other experimental conditions by adjusting the master mixes fed to device inlets. Design software is also presented as R code to quickly enable computation of microfluidic resistance networks necessary for the development of arbitrary culture well concentration profiles.
Supplemental Material
DS_TECH783497 – Supplemental material for Full Factorial Microfluidic Designs and Devices for Parallelizing Human Pluripotent Stem Cell Differentiation
Supplemental material, DS_TECH783497 for Full Factorial Microfluidic Designs and Devices for Parallelizing Human Pluripotent Stem Cell Differentiation by Duncan M. Chadly, Andrew M. Oleksijew, Kyle S. Coots, Jose J. Fernandez, Shun Kobayashi, John A. Kessler and Akihiro J. Matsuoka in SLAS Technology
Footnotes
Acknowledgements
We thank Lyuba Lyass, PhD, at Northwestern University Stem Cell Core Facility, and David Kirchenbuechler, PhD, Wensheng Liu, MD, and Constadina Arvanitis, PhD, at Northwestern University Imaging Core Facility, for their assistance. Special thanks are given to Jack Edelbrock (NU) and Alexandra Kolot (NU, SQI) for consultation and syringe pump assistance. Finally, we thank Tammy L. McGuire for continuing assistance and support to our laboratory.
Supplemental material is available online with this article.
Declaration of Conflicting Interests
The authors declared no potential conflicts of interest with respect to the research, authorship, and/or publication of this article.
Funding
The authors disclosed receipt of the following financial support for the research, authorship, and/or publication of this article: This work was supported by the American Otological Society Clinician Scientist Award (A.J.M.), the Triological Society/American College of Surgeons Clinician Scientist Award (A.J.M.), the Department of Otolaryngology of Northwestern University, an NIH K08 Clinician Scientist Award (K08 DC13829-02 to A.J.M.), and NIH P30 NS081774 (J.A.K.).
References
Supplementary Material
Please find the following supplemental material available below.
For Open Access articles published under a Creative Commons License, all supplemental material carries the same license as the article it is associated with.
For non-Open Access articles published, all supplemental material carries a non-exclusive license, and permission requests for re-use of supplemental material or any part of supplemental material shall be sent directly to the copyright owner as specified in the copyright notice associated with the article.