
Abstract
DNA melting analysis provides a rapid method for genotyping a target amplicon directly after PCR amplification. To transform melt genotyping into a broad-based profiling approach for heterogeneous samples, we previously proposed the integration of universal PCR and melt analysis with digital PCR. Here, we advanced this concept by developing a high-resolution digital melt platform with precise thermal control to accomplish reliable, high-throughput heat ramping of microfluidic chip digital PCR reactions. Using synthetic DNA oligos with defined melting temperatures, we characterized sources of melting variability and minimized run-to-run variations. Within-run comparisons throughout a 20,000-reaction chip revealed that high-melting-temperature sequences were significantly less prone to melt variation. Further optimization using bacterial 16S amplicons revealed a strong dependence of the number of melting transitions on the heating rate during curve generation. These studies show that reliable high-resolution melt curve genotyping can be achieved in digital, picoliter-scale reactions and demonstrate that rate-dependent melt signatures may be useful for enhancing automated melt genotyping.
Keywords
Introduction
A technology that accomplishes fast, easy, inexpensive, and sensitive DNA screening is an attractive way to profile samples prior to or in lieu of deeper sequencing investigations. The increased availability of deep sequencing facilities to identify low-level genotypes in complex samples has made deep sequencing an increasingly common research tool. The cost, time, computation, and expertise required to carry out deep sequencing still, however, represent significant hurdles for use in many applications.1–4 High-resolution DNA melting analysis, in which double-stranded DNA is heat denatured into its single-stranded form in the presence of fluorescent intercalating dyes or molecular beacons, is capable of rapidly genotyping sequences. This closed-tube method is performed directly after PCR amplification of specific targets and has traditionally been used for (1) mutation or single nucleotide variation (SNV) detection based on melting temperature (Tm) shifts, or (2) heterozygote detection based on differences in the curve shape when aligned to the homozygous sequence melt curve.5,6 In combination with machine learning algorithms and universal primers or adapters, high-resolution melt analysis can accomplish broad-based sequence identification tasks such as microbial or microRNA profiling.7–16 In its traditional PCR well-plate format, however, melt analysis of heterogeneous samples precludes detection of low-level genotypes and generates complex melt curves that are difficult to interpret.9,17,18
We conceived digital melt analysis to overcome these limitations. 8 It involves partitioning a heterogeneous sample into many small-volume PCR reactions, such that each contains zero or one target molecule, 8 and subsequently conducting universal PCR and melt analysis on all reactions. Because each reaction amplifies from a single target molecule, each digital melt curve is a sequence fingerprint of only one sequence within the heterogeneous sample. Subsequently, machine learning algorithms are used to automatically identify melting curve signatures and quantify the number of reactions containing each signature.8,19 This form of melt analysis distinguishes itself from previous forms by relying not only on Tm or aligning melt curve shapes, but instead using all the temperature points encompassed by the curve. Likewise, digital melt analysis distinguishes itself from digital PCR (dPCR) by virtue of its goal to amplify an entire class of sequences through universal priming for subsequent identification, as opposed to the amplification of a specific sequence by targeted priming for quantification purposes only. Because commercially available dPCR systems cannot be extended to accomplish digital high-resolution melt (dHRM) analysis (because nearly all have heating and imaging components that are physically separated into individual pieces of equipment),20,21 we developed a dedicated digital melt analysis platform. 22 Our device was, however, significantly limited by the poor reproducibility of the temperature ramp, which altered the melting curve shape and melting temperature (Tm) of the amplicons from run to run. This limitation hampers the ability of our algorithm to reliably recognize sequence melt fingerprints. The variation in melt curve along the temperature axis also restricts the scalability of the database, limiting the breadth of detection available for profiling. Dedicated melt curve analysis instruments for traditional PCR formats also suffer from melt curve reliability issues, depending on the sample format and heat transfer methods. A significant need remains for improved uniformity and linearity of thermal control during melting analysis in general, and especially if melt analysis is to achieve the goal of broad-based melt genotyping in a higher throughput format.
The aim of the current study was to design and characterize a robust high-resolution digital melt heating device to minimize melt curve variation among 20,000 725 pL reactions and between runs to enable reliable automated sequence identification. Ideally, the device will accomplish highly linear and reproducible heat ramping that produces no more than 0.1 °C well-to-well and run-to-run variation in Tm. 23 It should also be tunable so that the optimal ramp rate can be determined for different genotyping applications. Heating rate linearity and reproducibility were controlled and characterized using continuous two-point physical temperature measurements. Further characterization and optimization of well-to-well and run-to-run variation were carried out using synthetic DNA oligos as Tm calibrators or amplicons from the bacterial 16S gene. For the purposes of characterizing our device for melting, we directly loaded pre-amplified oligos into the wells at post-PCR concentrations. The device’s ability to precisely control various user-defined heating rates revealed a novel dependence of melt curve dynamics on melting rate that was independent of imaging rate (fluorescence measurement/°C) or melt curve resolution. Well-to-well comparisons also revealed that high-Tm sequences were significantly less prone to melt variability.
Materials and Methods
Sample Preparation for Temperature Calibrator Sequences
Three temperature calibrator sequences with varying GC content and known melting temperatures were used to optimize the heating of our system: 0% GC (TTAAATTATAAAATATTTATAATATTAATTATATATATATAAATATAATA-C3), 12% GC (TTAATTATAAAGGTATTTATAATATTGAATTATACATATCTAATATAATC-C3), and 76% GC (GCGCGGCCGGCACCCGAGACTCTGAGCGGCTGCTGGAGGTGCGGAAGCGGAGGGGCGGG-C3) (Integrated DNA Technologies, Coralville, IA). The master mix containing the three temperature calibrators was created as follows: 1× Phusion HF Buffer containing 1.5 mM MgCl2 (Thermo Fisher Scientific, Waltham, MA), 4 µM of equal mixtures of the three temperature calibrator sequences, 1× ROX (Bio-Rad Laboratories, Hercules, CA), 2× EvaGreen (Biotium, Fremont, CA), and Ultra Pure PCR water (Quality Biological Inc., Gaithersburg, MD) to bring the total volume to 15 µL. Of the 15 µL master mix, 14.5 µL was then loaded onto a commercially available dPCR chip containing 20,000 picoliter-sized reaction wells, the QuantStudio 3D Digital PCR 20K Chip V2 (Applied Biosystems, Foster City, CA), as described in Ortiz et al. 22 The chips were filled with a PCR-grade oil, QuantStudio 3D Digital PCR Immersion Fluid (Applied Biosystems), to prevent sample evaporation during thermocycling, and they were sealed with an adhesive lid that contained an optical window for imaging (included in the 3D Digital PCR 20K Chip V2 Kit).
Sample Preparation for Bacterial Samples
Bacterial genomic DNA (gDNA) was isolated from an overnight culture of bacteria using the Wizard Genomic DNA Purification Kit (Promega Corporation, Madison, WI). The stock DNA concentration was determined by the biospectrometer absorbance readings. Next, the desired DNA concentration was achieved through serial dilutions and added to the master mix, which contained the following concentrations: 1× Phusion HF Buffer containing 1.5 mM MgCl2 (Thermo Fisher Scientific), 0.15 µM forward primer 5′-GyGGCGNACGGGTGAGTAA-3′ (Integrated DNA Technologies), 0.15 µM reverse primer 5′-AGCTGACGACANCCATGCA-3′ (Integrated DNA Technologies), 0.2 mM deoxynucleotides (dNTPs; Invitrogen, Carlsbad, CA), 2.5× EvaGreen (Biotium), 2× ROX (Bio-Rad Laboratories), 0.02 U/µL Phusion HotStart Polymerase (Thermo Fisher Scientific), 0.3 µM temperature calibrator sequence with 0% GC content (see above), and Ultra Pure PCR water (Quality Biological Inc.) to bring the total volume to 15 µL. A reaction volume of 14.5 µL was spread onto the dPCR chip (see above). A flatbed thermocycler was used to amplify the hypervariable regions, V1 to V6, of the 16S ribosomal RNA (rRNA) gene using the following PCR cycle: 1 cycle of 98 °C for 60 s, and 70 cycles of 95 °C for 15 s, 58 °C for 30 s, and 72 °C for 60 s.
Cell Culture
Clinically isolated Moraxella, Acinetobacter, and Salmonella enterica were grown separately overnight in Luria–Bertani (LB) broth. Sterile conditions were used to ensure uncontaminated growth of each bacteria.
Chip Heating Device
The thermoelectric (TEC) heating and cooling device was purchased from TE Technology, Inc. (Traverse City, MI). The proportional-integral-derivative (PID) controller was purchased from Meerstetter Engineering GmbH (Rubigen, Switzerland). Resistance temperature detector (RTD; Class 1/3B) and thermocouple (K-type) sensors were purchased from Heraeus (Hanau, Germany) and OMEGA Engineering (Stamford, CT), respectively. Medium to high amounts of thermal paste gave the most repeatable results (data not shown).
Fluorescent Imaging
The Nikon Eclipse Ti (Nikon, Tokyo, Japan) platform is customized to accomplish imaging for the dHRM system, as described in our earlier work. 22 Fluorescent images are captured with a melt curve intercalating dye, EvaGreen, and a control dye, ROX, at 488/561 nm and 405/488 nm excitation/emission filters, respectively, with an exposure time of 100 ms at a light-emitting diode (LED) intensity of 40%. The microscope is interfaced with a Hamamatsu digital camera, C11440 ORCA-Flash4.0 (Hamamatsu, San Jose, CA), for image acquisition at a rate commensurate with the heat ramping. The imaging rate is adjusted based on the heat ramping to maintain a resolution of 0.1 °C between images ( Table 1 ). NIS-Elements software (Nikon) is programmed to automatically image the chip as the heating device ramps by running a time lapse to image every specified time point. For every image, the microscope automatically records the temperature of the surrogate chip registered by the thermocouple temperature probe within the metadata of the image. For this experiment, we used a Nikon Plan/Fluor 4× objective with a numerical aperture of 0.13 and a working distance of 16.5× to image a corner of the chip. Hence, every section of the chip was imaged as part of a separate run with simultaneous heating of the entire chip. This allowed us to maximize the number of runs and data per chip to characterize our heating system. For an ideal-use case, as described in our previous publication, 22 we can sweep the imaging location to image the entire chip for all runs.
Corresponding Heating and Imaging Rates.
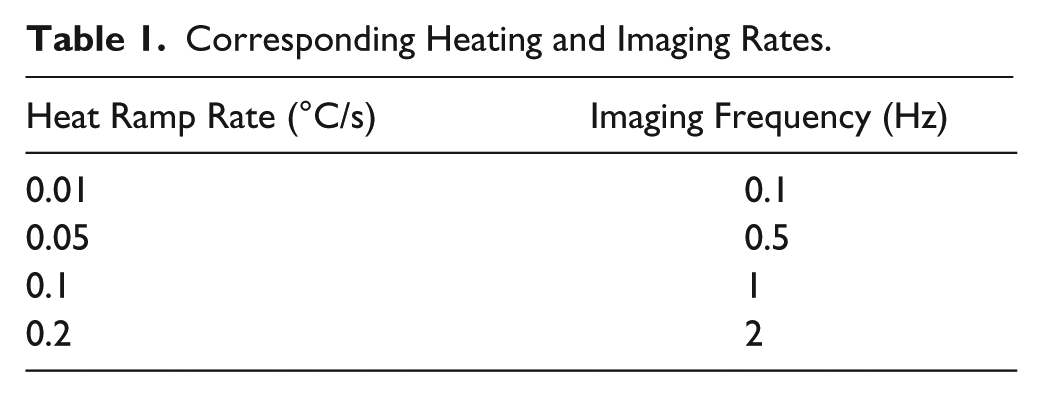
Image Analysis
Melt Curve Data Generation
First, the acquired fluorescence images are aligned using a template-matching plugin in ImageJ. Then, melt curves are generated using an automated image-processing algorithm implemented in MATLAB. The algorithm applies a median filter to remove salt-and-pepper noise in the images. It then generates a binary mask for each well on the chip and tracks them on all images. Pixels within 80% of the detected well radius are recorded and averaged to generate the fluorescence value in both ROX and EvaGreen channels for the specified well. The fluorescence values are tracked for each well among all images to generate curves for both EvaGreen and ROX channels. Filter (EvaGreen) curves generated are normalized against filter (ROX) values to account for any localized errors or noise due to bubbles in the chip, or any abrupt change in ambient light, as described in our previous publication. 22
Temperature Measure
Imaging software records the temperature corresponding to each image from the surrogate chip. The temperature acquisition rate is, however, limited to approximately 0.20 Hz. Line fitting is performed using the unique temperature and time pair acquisitions to estimate temperature for each acquired image for faster imaging rates ( Suppl. Fig. 1 ). A melt curve for each well is plotted against this estimated temperature. The negative derivative is taken with respect to temperature. Normalization and smoothing are performed as described in previous publications. 22 To study the rate dependence of melt curves, bacterial melt curves were generated that aligned the curves to their Tm.
Results
System Design
To optimize the heat ramp control of the microfluidic chip, we redesigned the thermal control system of our dHRM platform. Previously, the chip was housed in a copper block, which was heated or cooled by a TEC device. To precisely control the TEC device, we added a PID controller with temperature feedback from the copper block. The feedback was provided by a highly accurate RTD sensor that was embedded in the middle of the copper block. As described previously, a thin layer of thermal grease was added between the chip, copper block, and TEC device to ensure efficient heat transfer. 22 Heating dissipation from the reverse side of the TEC device was enhanced by attaching a fan to the aluminum heat sink. The speed of the fan was also controlled by the PID controller, commensurate with the sink temperature, using a negative temperature coefficient (NTC) thermistor. Previously, the heat ramping was not reliably linear, and the standard deviation in chip temperature reached up to 1.22 °C at 91.6 °C. 22 The addition of the fan and controller improved our ability to precisely heat to higher temperatures and allowed us to rapidly cool the chip back to room temperature. Fast cooling decreased the wait time between two consecutive runs to less than 5 min as compared to a previous 30 min. The use of an off-the-shelf digital PCR chip did not allow us to place a temperature probe inside the chip in use. Therefore, to ensure that the thermal control achieved for the copper block efficiently transferred to the chip, we monitored the temperature of a surrogate chip placed next to our test chip on the copper block. The surrogate temperature was reported using a thermocouple embedded at its center. The entire chip-heating device assembly was held in place inside a custom-designed 3D-printed stage adaptor to securely mount the device on a microscope for imaging ( Fig. 1 ). Although the copper block was independently controlled by standalone software, the proxy temperature measurement from the surrogate chip was synchronized with fluorescent imaging by the microscope control software (NIS-Elements). Synchronizing imaging with temperature measurement, however, required the use of an NIS-Elements compatible temperature acquisition system (Tokai Hit Co., Japan) using a K-type thermocouple probe. This integrated imaging and temperature acquisition system limited the resolution of temperature measurement to 0.1 °C with a temperature sampling rate of ~0.2 Hz irrespective of the imaging rate. Therefore, our strategy was to precisely control the copper block temperature, establish a repeatable relationship between the copper block–embedded RTD and the surrogate chip–embedded thermocouple, and then use the fitted thermocouple temperature data and fluorescence imaging data to plot melting curves.
Schematic and image of a universal digital high-resolution melt (U-dHRM) platform.
Thermal Controller Characterization
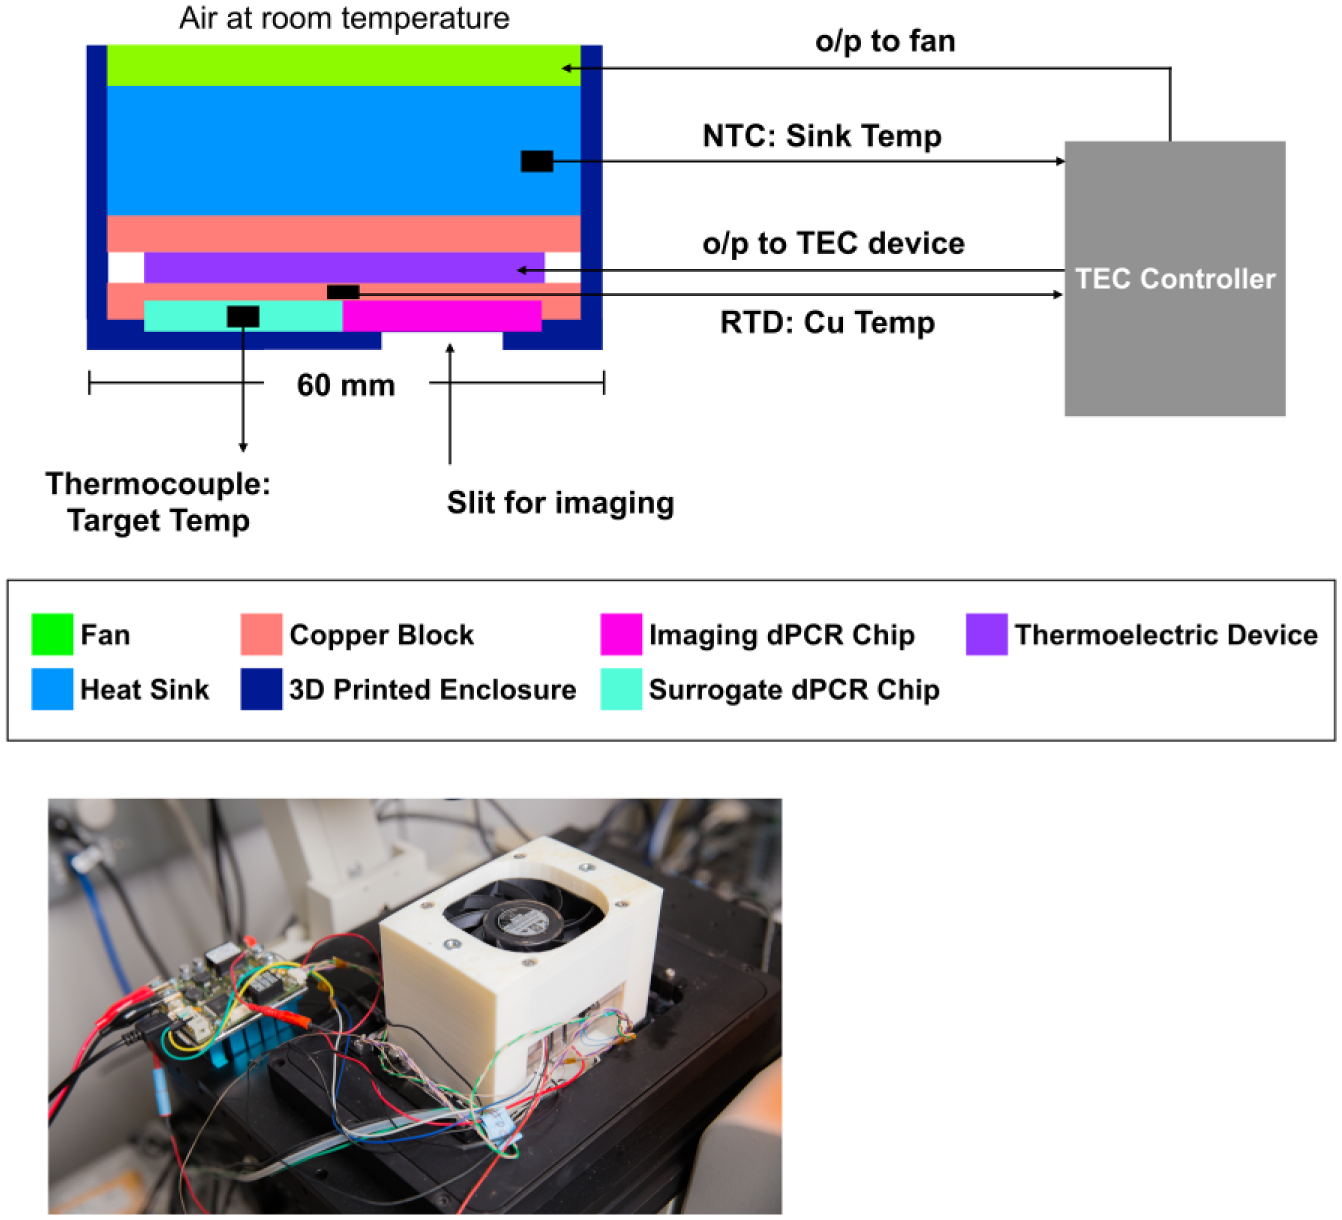
The PID controller provided temperature control of the copper block at the desired ramp rate of 0.1 °C/s. The maximum difference between the expected block temperature and observed temperature recorded using the RTD embedded within the block was measured as 0.004 °C ( Fig. 2A ). Throughout all runs, the expected ramp rate of 0.1 °C/s was observed with a maximum root mean square error (RMSE) of 0.001 °C ( Fig. 2B ). This confirmed that precise temperature control of the copper block was achieved by our new heating system.
Controller performance. (
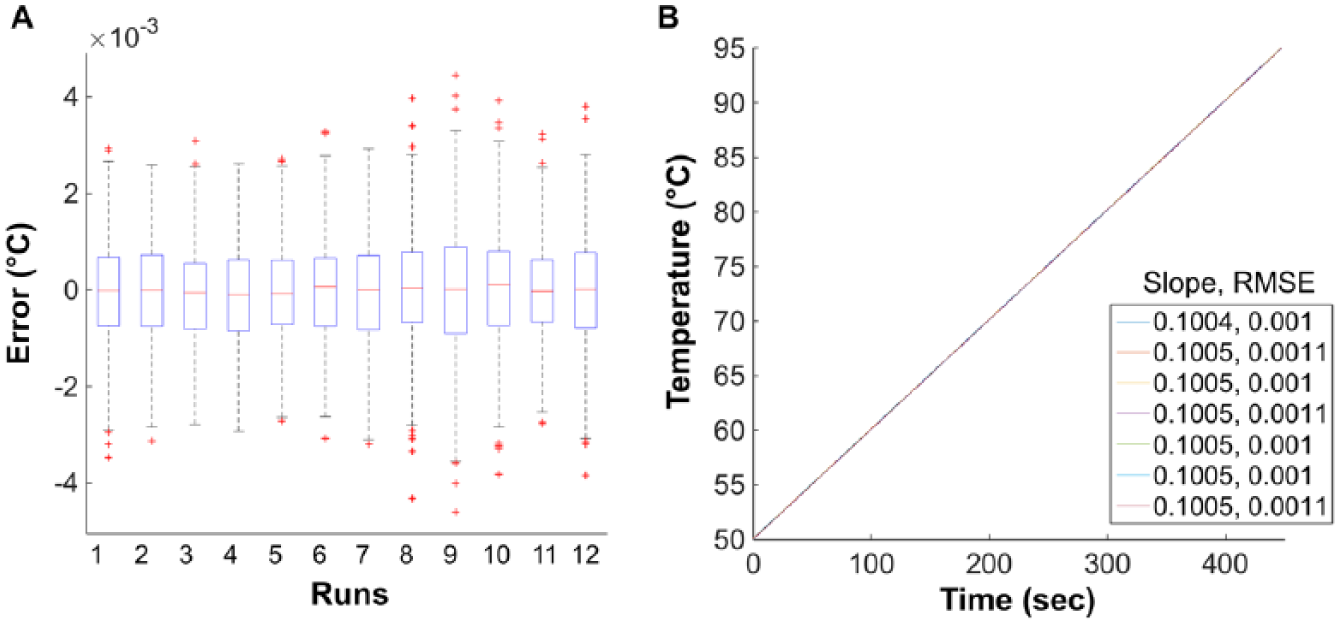
Next, we investigated the relationship between the block temperature and surrogate digital chip temperature. Figure 3 shows temperature ramp measurements taken using the surrogate chip–embedded thermocouple for the same runs as depicted in Figure 2A for the copper block–embedded RTD. For all runs, the thermocouple measured a ramp rate of approximately 0.098 °C/s on the chip, as compared to 0.1 °C/s measured with the RTD in the block. The relationship between the thermocouple and RTD was highly repeatable throughout seven runs ( Fig. 2B and Fig. 3A ). To test the linearity of the slope, we analyzed different temperature ranges of the thermocouple readings and found the slope to be consistent. This justified the use of a straight-line fit for the thermocouple data, revealing a maximum RMSE of 0.05 °C for the runs ( Fig. 3A ). Instantaneous heating rates on the chip were also analyzed and showed no significant deviation (R2 = 1) from linearity due to heat transfer losses from block to chip ( Fig. 3B ). Thus, our design achieved precise and linear heating control on the digital PCR chip within the accuracy and precision limits of the temperature acquisition system.
Surrogate chip behavior. (
Melt Characterization with Temperature Calibrator Sequences
In theory, if heat ramping is linear and heat transfer is efficient, any inaccuracies in the absolute temperatures measured during the melting process could be reliably removed using temperature calibrator sequences. Such control DNA oligos of known Tm can be included in all reactions and designed so that they melt outside of the amplicon’s melting temperature range. 24 As long as the heat-ramping rate is linear (i.e., of a constant slope), the distance between the calibrator Tm and amplicon Tm is reliably maintained. Therefore, temperature offset errors occurring from run to run or well to well because of imperfections in temperature control or uniformity can be removed by simply shifting each melt curve to align the calibrator Tm peaks with their correct melting temperature. Characterization of the thermal controller revealed highly linear and repeatable heat ramping on an empty chip. To further characterize the reliability of heat transfer and DNA melting in a loaded chip, we used three synthetic oligo sequences with predicted Tm in the range of ~57–93 °C to generate melt curve data for run-to-run and well-to-well variability analyses. These temperature calibrator sequences varied in GC content and length to achieve high (~92.9 °C), mid (~62.8 °C), and low (~57.3 °C) melting temperatures. Each well on the chip received these three calibrator sequences, such that three melt curves were generated within each well. For this analysis, melt curves were generated on-chip at a heating rate of 0.1 °C/s for seven replicate runs over several days. Figure 4A shows plots of the calibrator sequences’ melt curves from individual reaction wells grouped by run.
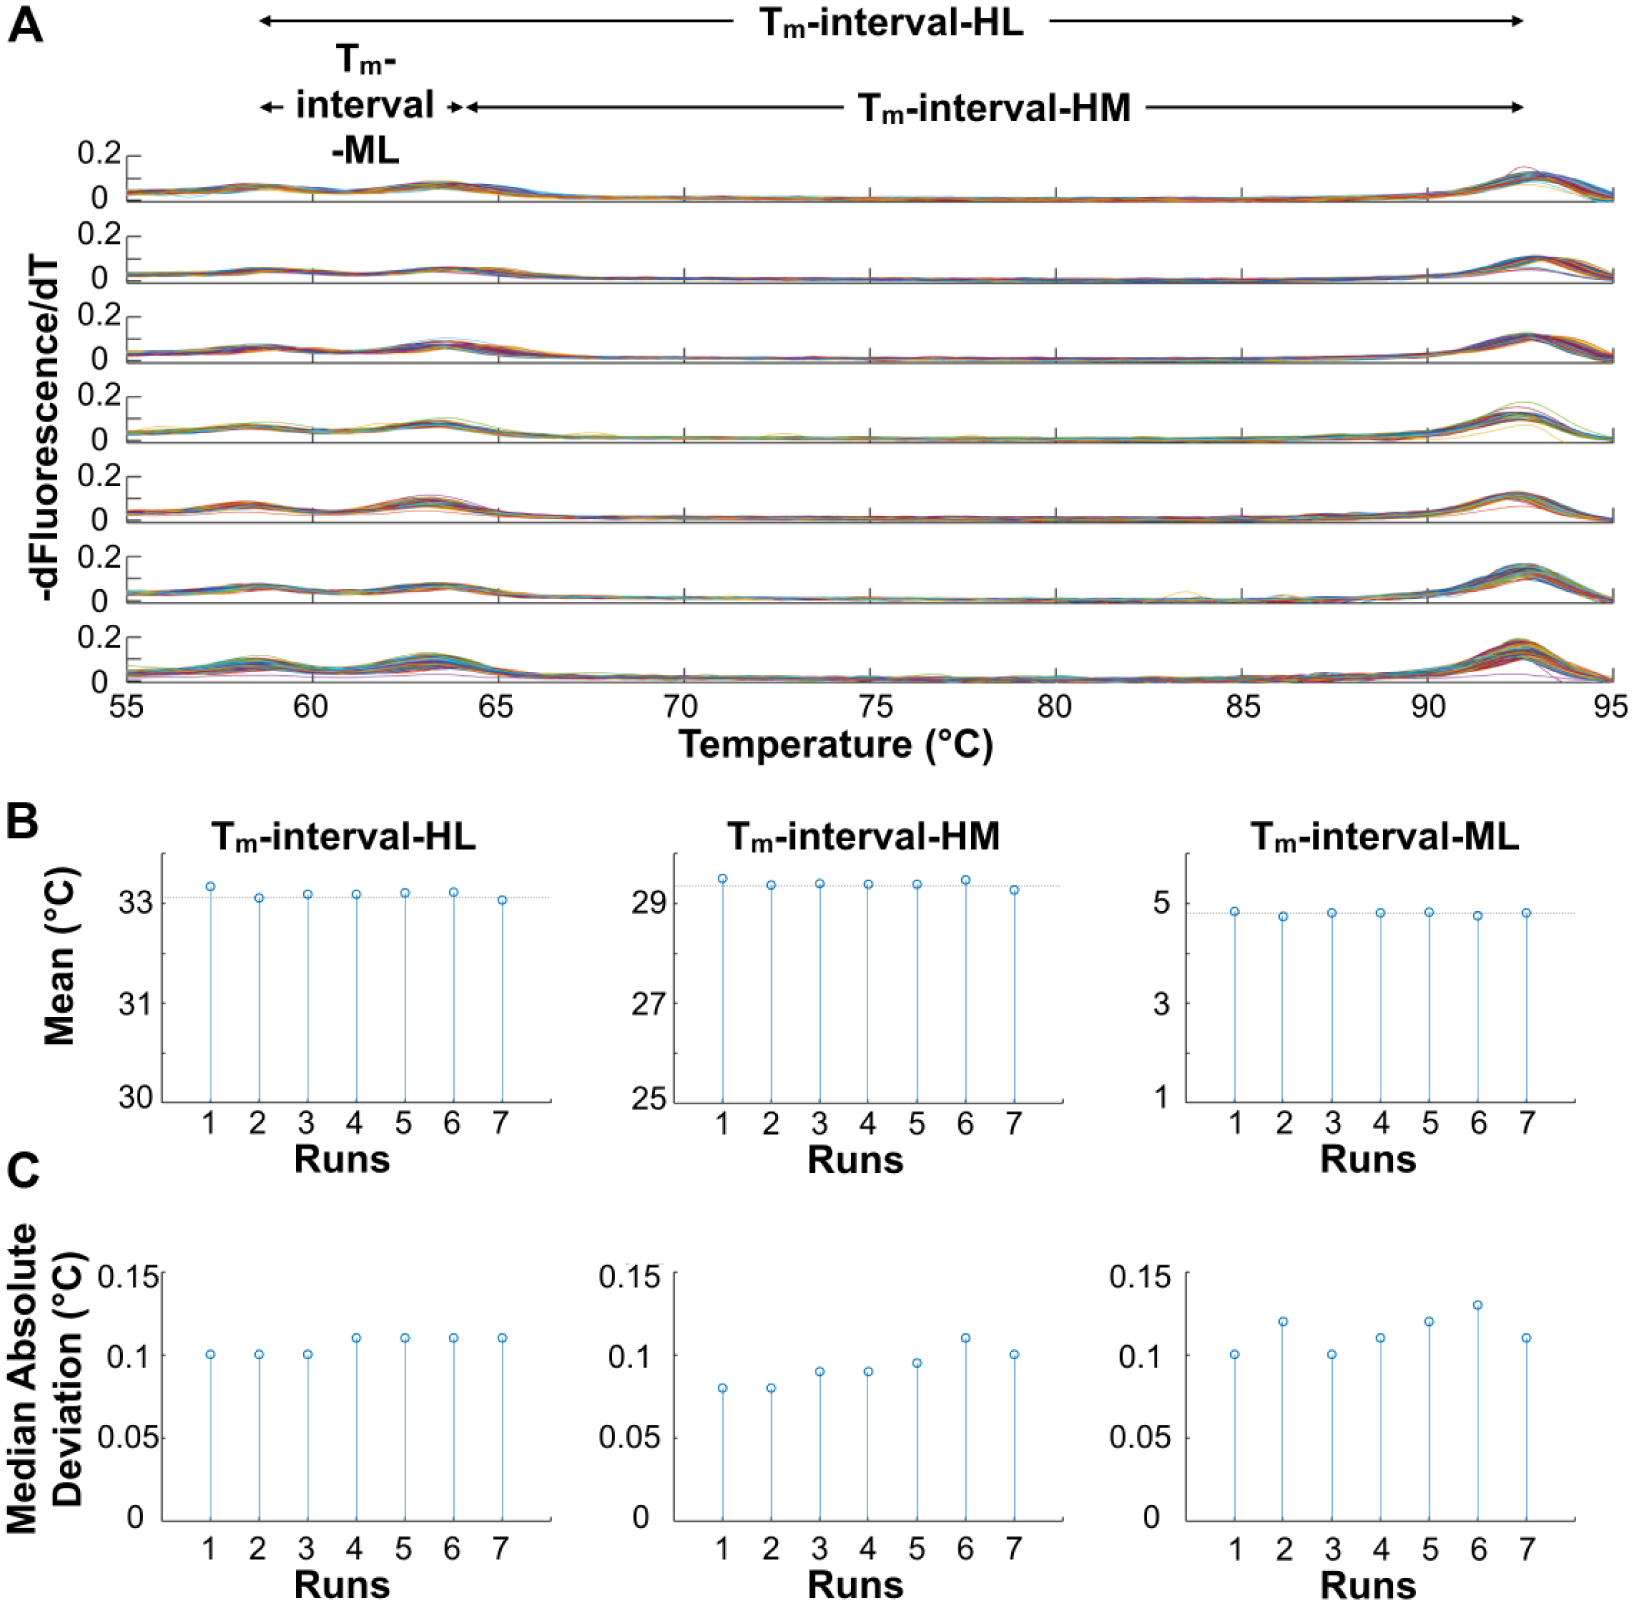
Controller performance using three temperature calibrators with known melting temperatures. (
Variation in Melt Linearity
To assess the linearity of the heat ramp and melting behavior in a loaded chip, we noted that variation would manifest as stretching or compression of the melting curves along the temperature axis. This can be quantified by measuring the temperature intervals between the calibrator Tms, as shown in Figure 4 . If linearity is consistent, any offset temperature errors from run to run could be overcome by simply shifting the melt curves along the temperature axis to align calibrator Tm peaks to match predicted values. Therefore, to assess melt linearity, we first applied a peak detection algorithm to the derivative melt curves from each well ( Fig. 4A ) to find the Tms in a ±3 °C region around the predicted Tm for each calibrator sequence (uMelt 25 : Tm-low 57.3 °C, Tm-mid 62.8 °C, and Tm-high 92.9 °C). Then, we plotted these Tm intervals per chip and compared them throughout seven runs ( Fig. 4B ). Variations in the mean from run to run reveal slight stretching (higher mean interval) or compressing (lower mean interval) of the melt curves along the temperature axis. We next calculated the standard deviation of these mean Tm-intervals. The Tm-intervals varied among runs with a standard deviation less than 0.1 °C. As another metric of variability, we compared the spread of the Tm-intervals per run by calculating the median absolute deviation (MAD) of each well’s Tm-interval to the mean Tm-interval for that run. Figure 4C shows that Tm-intervals vary by approximately ~0.1 ± 0.02 °C. These metrics show that the slight stretching or compressing of the temperature axis from run to run is very close to achieving the performance goal of resolving 0.1 °C differences in Tm. This performance was also within the expected accuracy and precision limits of the combined temperature acquisition system (see System Design) and imaging system.
Variation in Melting Temperature
We next sought to characterize the variability of the melting temperatures from well to well. These differences should not depend on the heat ramp but rather on local thermal gradients, loading differences, and evaporation anomalies throughout the chip. To assess well-to-well variability, we first identified the high, mid, and low calibrator Tm in each well. Then, we compared each well’s Tm values to the mean Tm for the chip. Comparing to the mean of each chip allowed us to repeat this assessment for several chips and ignore potential offset errors from chip to chip. We found that the high-temperature calibrator, Tm-High, displayed lower well-to-well variability in all seven chips compared to Tm-Mid and Tm-Low ( Fig. 5A ). The largest MAD within a chip for Tm-High was 0.1 °C, in comparison to the higher values of 0.13 °C, and 0.14 °C observed for Tm-Mid and Tm-Low, respectively. This calibrator-specific variability can be easily visualized as a scatterplot of the differences in Tm-High and Tm-Mid from their representative mean Tm values ( Fig. 5B ), in which more wells show a higher difference from the mean for the mid calibrator (y-axis spread in Fig. 5B ) than for the high calibrator (x-axis spread in Fig. 5B ). Furthermore, Tm-Low behaved like Tm-Mid ( Suppl. Fig. 2 ). To further investigate the wells with large differences from the mean, we plotted the spatial location of the wells on the chip as a heat map, coloring each well according to the difference of its Tm from the mean value on the chip ( Fig. 5C , chip corners shown). This showed higher variability in Tm-Low and Tm-Mid as compared to Tm-High throughout the chip reactions, with most outliers (> ±2.7 SD) located around the edges and corners of the chip. Analysis of the ROX reference dye intensity throughout the chip also revealed wells with significantly lower intensity located at the edges and corners ( Suppl. Fig. 3 ). This pattern was not, however, correlated with Tm variability ( Fig. 5C ). Importantly, this effect is also not due to uneven illumination throughout the field, because rotating and translating the chip in the field of view do not alter the pattern. Together, these results suggest that the high calibrator sequence may be inherently less susceptible to variation in melting than the low and the mid calibrator sequences. Furthermore, there is a spatial dependence of variability coinciding with the well location on the chip at the edges.
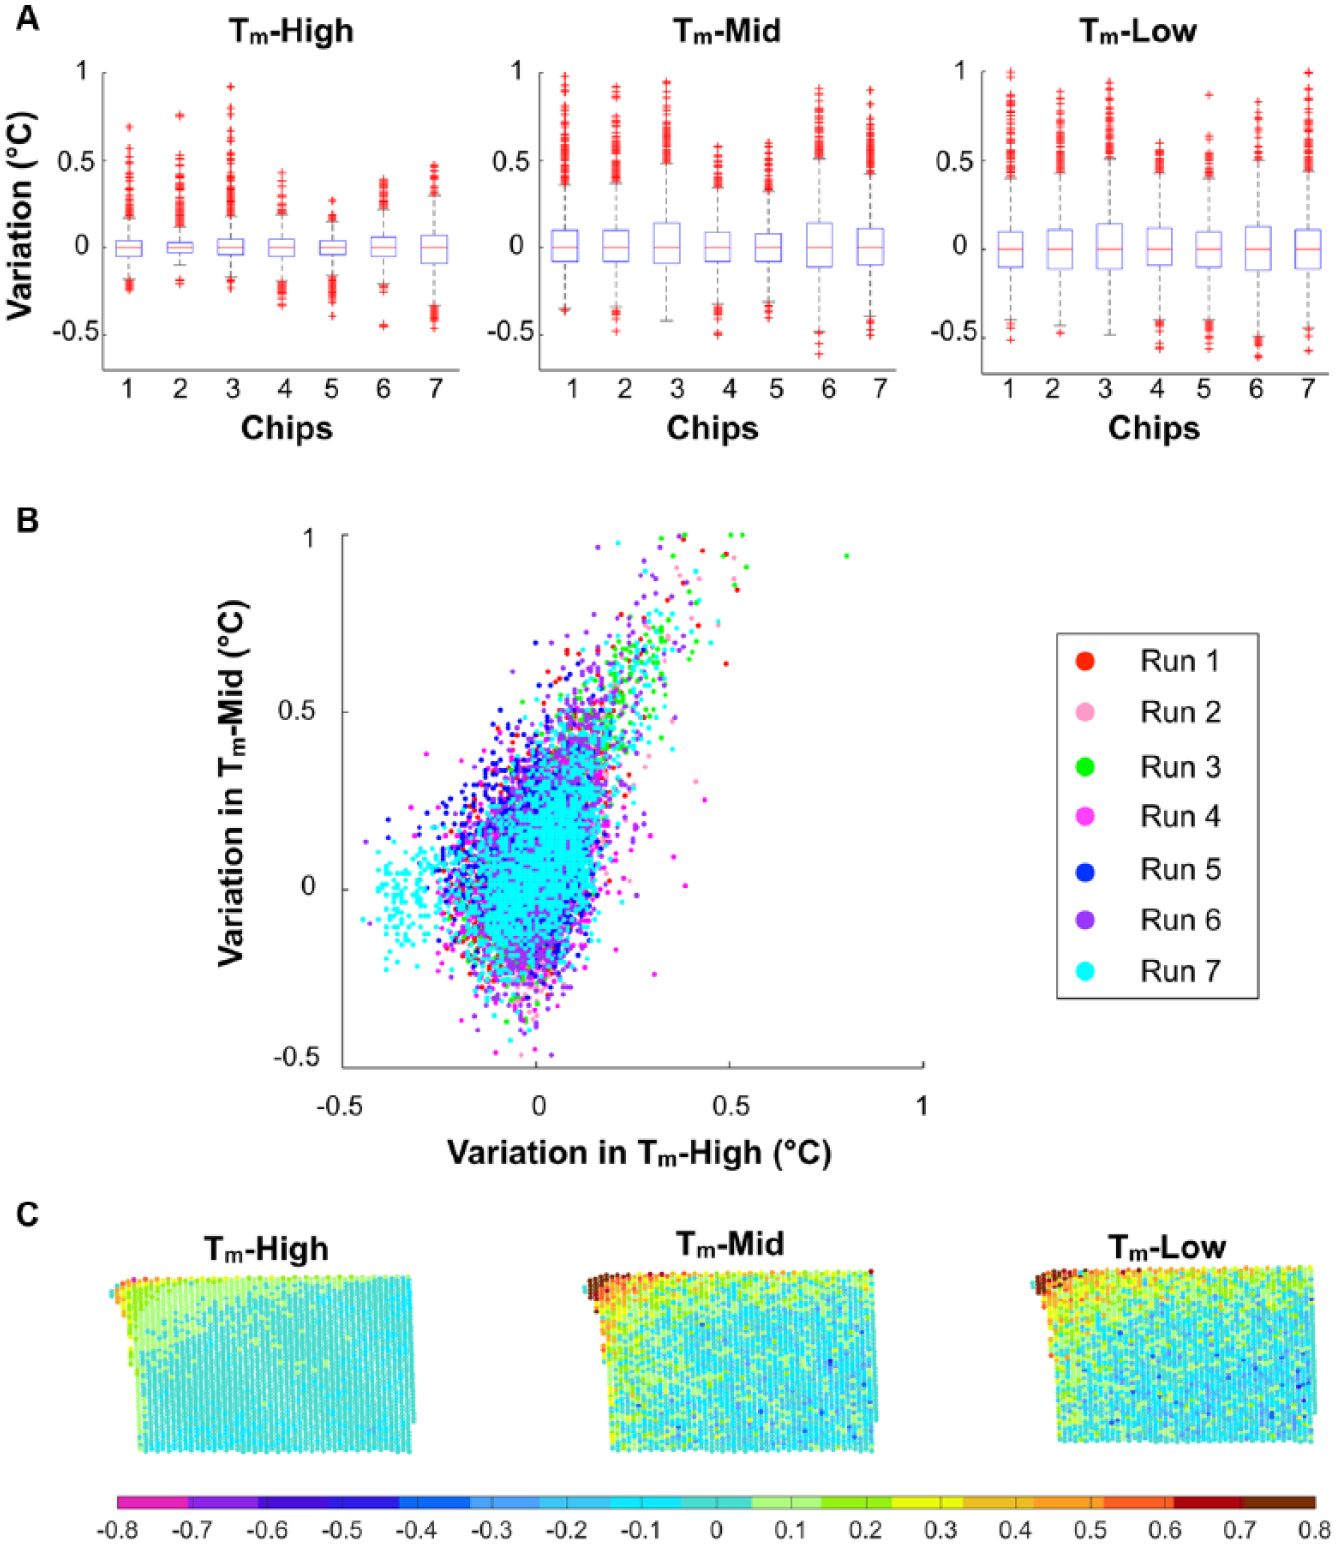
Intrarun variability. (
Ramp Rate Dependence of Melt Curves
Having characterized the reliability of our melting device and validated its performance, we next sought to investigate the dependence of the melt curve characteristics on ramp rate. Because our goal is to use melt curves to profile heterogeneous samples for multiple genotypes, we wanted to understand whether ramp rates could be optimized to enhance the effect of sequence differences on melt curve features. As a model genotyping task, we performed these experiments with bacterial DNA amplified from the 16S rRNA gene that included the hypervariable regions 1–6 (~1 kb in length). Typical quantitative PCR (qPCR) reactions target amplicon size to 200 base pairs or fewer for optimal amplification efficiency to enable accurate quantification. Because dPCR is an endpoint reaction, however, efficiency is not a top priority, and longer amplicons can be targeted at the expense of more PCR cycles. We prefer longer amplicons for melt-based sequence identification because we have previously observed that longer sequences generate more unique melt curves. 26 Here, we chose Acinetobacter, Moraxella, and Salmonella genomic DNA as our templates because we have previously observed that their long-amplicon 16S sequences melt uniquely with either one or two transitions at a ramp rate of 0.1 °C/s in bulk qPCR reactions.8,26
First, we generated 16S amplicons on three independent chips for each bacterium. These chips were then used to generate melt curves at ramp rates of 0.01 °C/s, 0.05 °C/s, 0.1 °C/s, and 0.2 °C/s. We adjusted our imaging settings to maintain 0.1 °C resolution in fluorescence measurement by matching the imaging rate to the heating rate ( Table 1 ). To ensure that our thermal control was accurate for varying ramp rates, we observed the temperature profile in the proxy chip and in the copper block. These profiles were like what was seen for a ramp rate of 0.1 °C/s, reported above. The slopes of the block temperature and fitted chip temperature were repeatable throughout all ramp rates, and there were negligible deviations in instantaneous rates throughout the runs (copper block and surrogate chip behavior for all ramp rates is shown in Suppl. Fig. 4 and Suppl. Fig. 5 ).
The 16S amplicons for Acinetobacter baumannii revealed multiple melt domains for higher ramp rates of 0.1 °C/s and 0.2 °C/s. A single melting domain was, however, observed for 0.01 °C/s, as seen in Figure 6A . The second derivatives of the melt curves further highlight the difference in curve shape at different rates ( Fig. 6B ). Similar rate-dependent melting (RDM) behavior was seen with Moraxella catarrhalis ( Fig. 6C and 6D ). Salmonella enterica serovar Heidelberg amplicons, however, showed no significant RDM ( Fig. 6E and 6F ), and neither did S. enterica serovars Enteritidis and Typhimurium for two chips ( Suppl. Fig. 6 ). Statistically significant differences in curve shape (skewness) were observed for A. baumannii (p < 0.005) between the melt rates of 0.01 °C/s and 0.2 °C/s, but not for S. enterica Heidelberg (p = 0.6). Our previously published machine learning algorithm for automated melt curve genotyping was able to differentiate between melt curves generated at 0.01 °C/s and 0.2 °C/s for A. baumannii with ~97% accuracy. It failed to differentiate melt curves for S. enterica Heidelberg at 0.01 °C/s and 0.2 °C/s (~60% accuracy), which is consistent with the fact that these curve shapes did not appear to change with rate. This indicates that the sequence specificity of the RDM phenomenon could be an additional feature used for melt-based sequence identification.
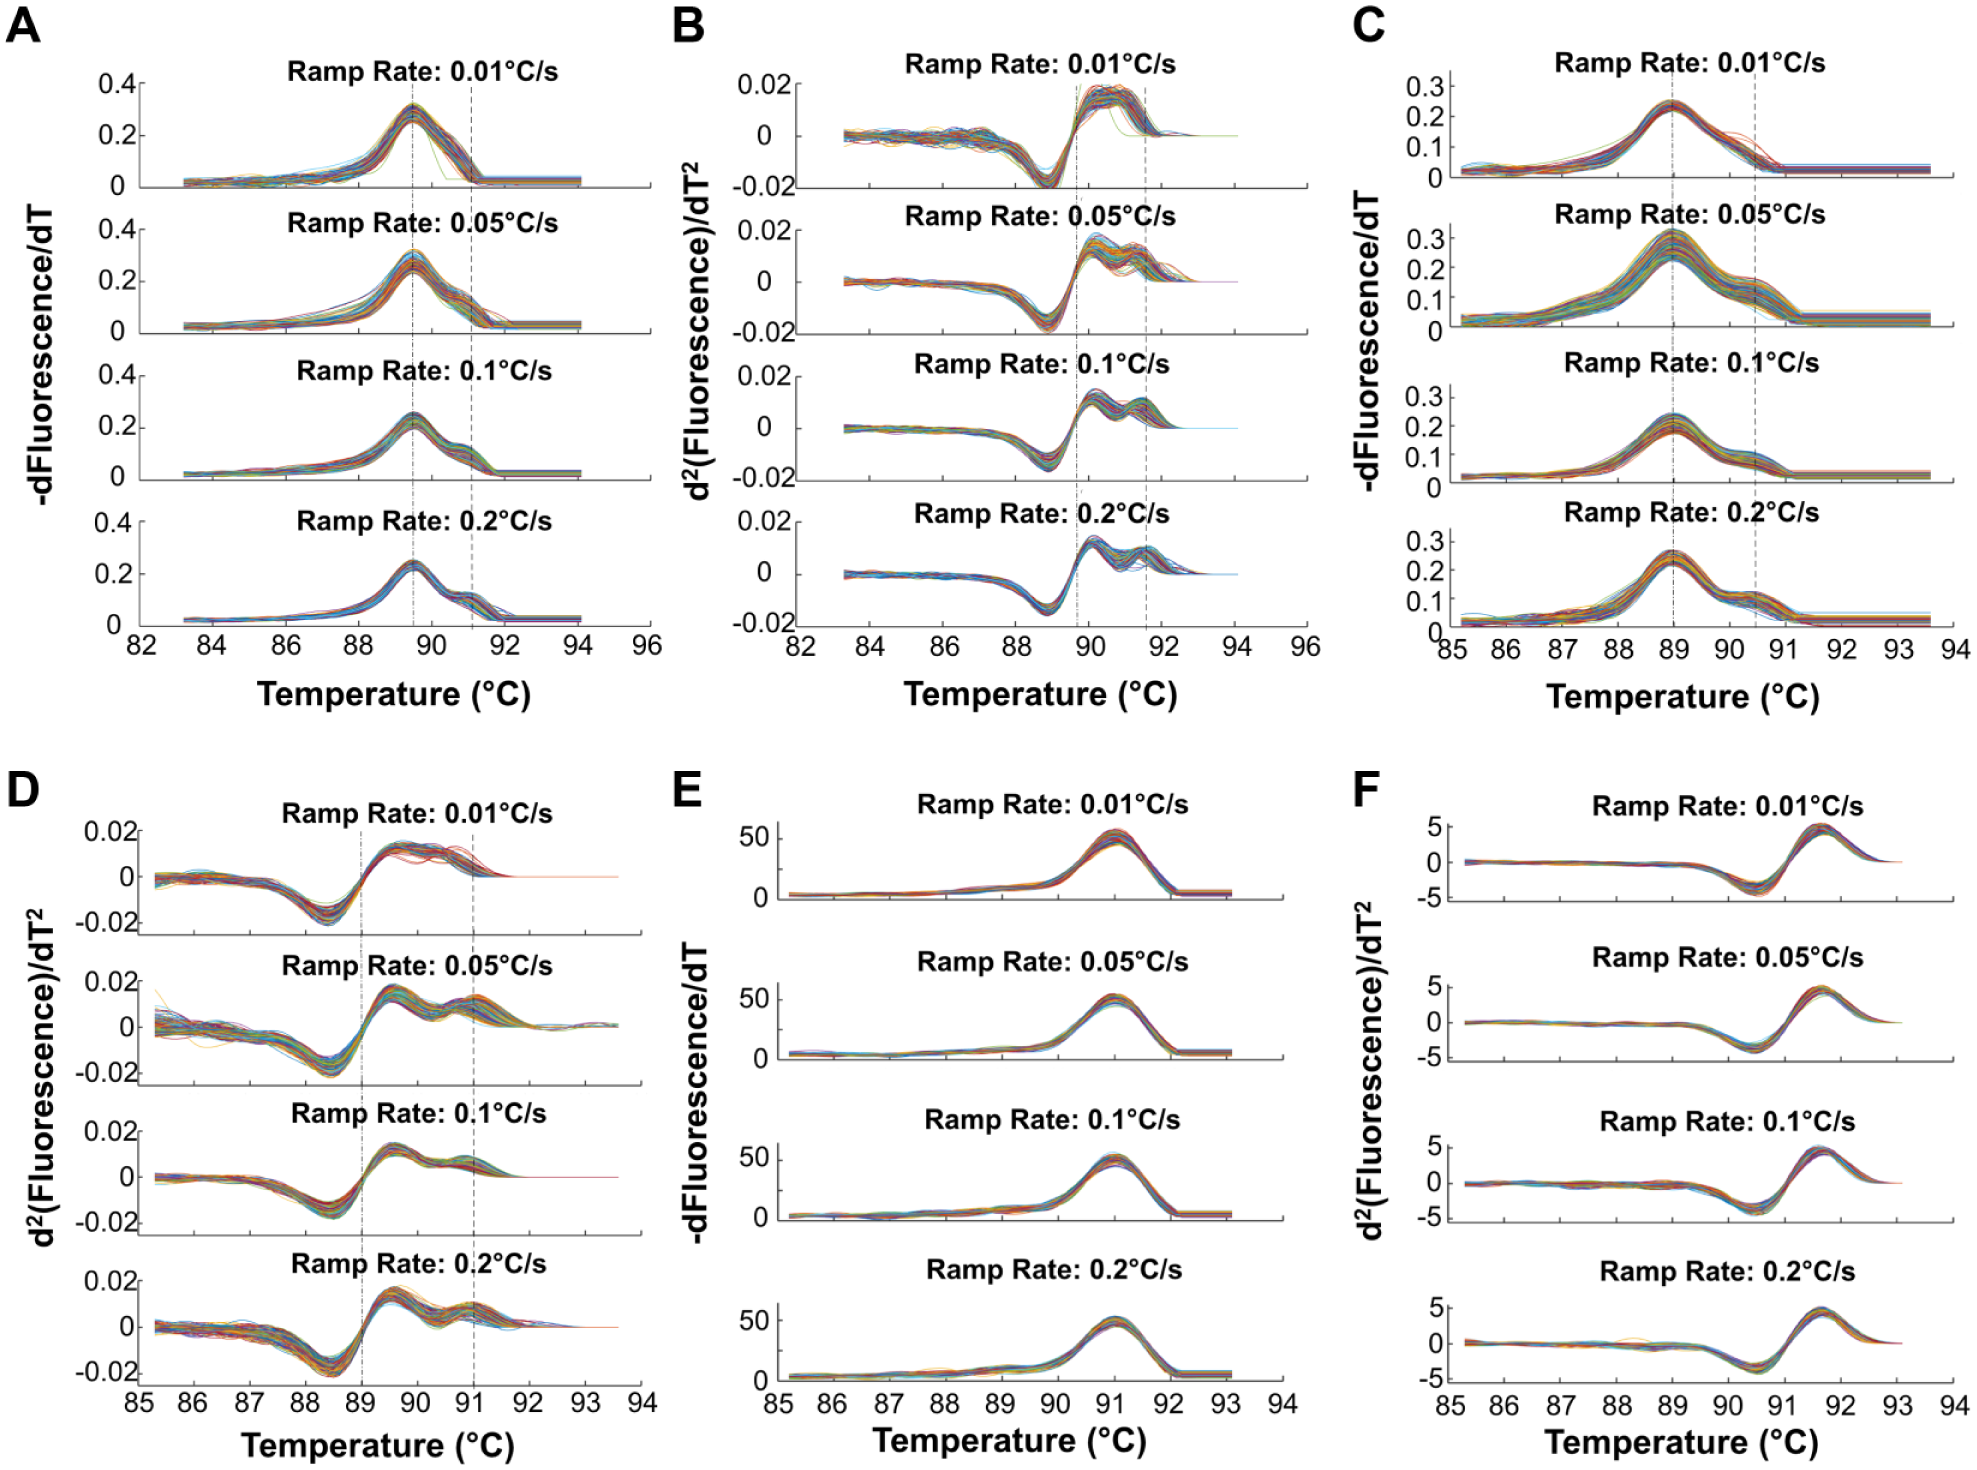
Rate dependence of melt curves in bacteria with one or more melt transitions. (
Discussion
We have successfully designed and characterized a high-throughput digital melt platform capable of generating up to 20,000 high-resolution melt curves in about 5 min. Our design achieves highly repeatable temperature profiles for a range of melt rates and commensurate imaging frequencies. The run-to-run errors we observed were within the expected theoretical error limits of our system, approximately 0.14 °C. Precision in temperature control is an important factor for resolving melt curves. Imaging systems can, however, contribute to melt errors as well. The resolution of our imaging system is one image per 0.1 °C. Thus, the minimum total RMSE error due to imaging (±0.05) and heating (±0.05) for our system is expected to be ±0.07 °C. These error limits can be improved with the development of a custom optical system with integrated and tunable image and temperature acquisition capabilities. This, in addition to increasing our sampling rate for fluorescent data acquisition, would enhance the device’s ability to resolve smaller Tm differences.
The reliability and performance of our heating and hardware system enabled us to identify and characterize other sources of melt variation. Understanding well-to-well variation throughout the chip is crucial for absolute load quantification and sequence profiling at single-genome sensitivity. We observed that wells producing outlier Tm peaks are typically present at the corners and along the edges of the chip, as shown in Figure 5B . These outliers could represent reactions in which evaporation has altered the chemistry of the reaction (specifically, the concentration of ions can shift Tm)27,28 or a spatial temperature gradient on the chip due to chip design. Heating-induced oil flows around the edges of the suspended reaction chip could also be a source of variability at the edges. Analysis of the ROX reference dye intensity throughout the chip revealed a different pattern of outliers with significantly lower intensity located at the edges and corners, indicating that evaporation may be present but is not the primary factor influencing Tm variability.
Compared to conventional PCR, smaller dPCR reaction volumes could be expected to lead to larger variations in Tm due to evaporation. The small form factor of the digital chip is, however, expected to maintain a more uniform thermal gradient throughout the chip, leading to smaller variations in Tm. A previously published study reported Tm differences ranging from 0.35 °C to 1.24 °C among 32–96-well-plate melt instruments with standard deviations of 0.018 °C to 0.274 °C. 23 In comparison, after excluding the outliers at the corners and edges of our chips, differences in the high-temperature calibrator Tm on our digital melt platform were observed to vary from 0.22 °C to 0.6 °C. This represents a significant improvement in heating uniformity compared to the standard well-plate format. Even with outliers included, a MAD ranging from 0.05 to 0.1 °C and a standard deviation of 0.06–0.13 °C were observed throughout the chip, which are less than those of the well-plate format.
Our observation that the Tm-Low and Tm-Mid for the temperature calibrator sequences were more variable than the Tm-High calibrator ( Fig. 5 ) is important for understanding the utility of these oligos as internal melt controls. The most challenging melt genotyping task, resolving class IV single-nucleotide polymorphisms (SNPs; A>T), typically requires resolving 0.1 °C differences in Tm. Because the largest MAD within a chip for Tm-Mid, Tm-Low, and Tm-High was 0.13 °C, 0.14 °C, and 0.1 °C, respectively, using these calibrators for melt curve normalization would introduce unacceptable error. As seen in Figure 5C , the high variability in Tm-High was largely limited to the chip corners. The variability in Tm-Low and Tm-Mid was observed throughout the chip, however, as well as at the corners. This additional variability is likely inherent to these calibrator sequences. Others have shown that the melting temperature of DNA sequences can vary dramatically if the melting process does not proceed through equilibrium. Because the transmission of heat to the reaction chambers is not instantaneous, the sample temperature may not reach equilibrium. Even in cases of extremely slow heating, slow relaxation processes during melting transitions can proceed out of equilibrium, and DNA sequences, especially those with multiple intramolecular binding conformations, can exhibit variation and hysteresis in their melting behavior.29–31 Physical models of DNA melting behavior predict that AT duplexes go through several cycles of hydrogen bond breakage and reformation, often involving an overall shift by one or more bases along the helix, before fully and finally disassociating. In contrast, the corresponding GC duplexes usually come apart only once. 32 Here, the low and mid calibrators have lower GC content (0 and 12%, respectively) and are also shorter in length compared to the high calibrator (76% GC). DNA dissociation rates are also known to increase exponentially with temperature.33,34 Taken together, this suggests that it may be possible to design more reliable low- and mid-temperature calibrators by using very short GC-rich sequences.
Heating rate changes typically result only in shifts in melt curve Tm, whereas the dynamic melting characteristics of a PCR product are thought to be primarily determined by GC content, sequence length, and nucleotide order.35,36 Our study revealed that some long (>1000 kb) amplicons are, however, highly sensitive to melting ramp rate, which not only shifts their Tm but also changes the number and size of distinct melting transitions present. For the long-amplicon sequences we studied, slower heating rates typically resulted in a single melt transition, whereas faster rates generated multiple melting domains. This response to heating rate was, however, highly sequence dependent. Thus, the response of a long amplicon to heating rate changes provides additional sequence-specific information that could enhance the specificity of melt curve–based sequence profiling. The mechanism underlying these differences may involve kinetic sampling of transition states. For example, slower rates would be expected to enable amplicons to sample a wider range of transition states, in which shifting, reorganized binding, or secondary structure formation could effectively average out the fluorescence decay among the bulk population of amplicons. Faster rates may induce more uniform transition behavior involving abrupt local DNA “bubbles” that melt separately at a different temperature from the remainder of the sequence. Indeed, faster rates of melting are associated with higher Tm accuracy in homozygous melt analysis. 37 Alternatively, because heteroduplex melting is more apparent at faster heating rates, the multiple melt domains we observe at faster ramp rates may be the result of distinct heteroduplex binding transition states induced in homoduplex molecules. 37
In conclusion, our novel platform advances the concept of digital melt curve–based sequence profiling and could also support fundamental studies of DNA dissociation kinetics. The ability to rapidly screen a heterogeneous sample of nucleic acids for the presence of a variety of genotypes could be applied to infectious disease diagnostics, cancer mutation and methylation analysis, viral mutation tracking, and microbiome population studies.
Supplemental Material
DS_TECH769846 – Supplemental material for A High-Resolution Digital DNA Melting Platform for Robust Sequence Profiling and Enhanced Genotype Discrimination
Supplemental material, DS_TECH769846 for A High-Resolution Digital DNA Melting Platform for Robust Sequence Profiling and Enhanced Genotype Discrimination by Mridu Sinha, Hannah Mack, Todd P. Coleman and Stephanie I. Fraley in SLAS Technology
Footnotes
Supplemental material is available online with this article.
Declaration of Conflicting Interests
The authors declared the following potential conflicts of interest with respect to the research, authorship, and/or publication of this article: The authors are inventors on patents filed for this research and are exploring commercialization.
Funding
The authors disclosed receipt of the following financial support for the research, authorship, and/or publication of this article: SF and lab members are supported by a Burroughs Wellcome Fund Career Award at the Scientific Interface (no. 1012027); an NSF CAREER Award (no. 1651855); and UCSD CTRI, FISP, and AIM pilot grants.
References
Supplementary Material
Please find the following supplemental material available below.
For Open Access articles published under a Creative Commons License, all supplemental material carries the same license as the article it is associated with.
For non-Open Access articles published, all supplemental material carries a non-exclusive license, and permission requests for re-use of supplemental material or any part of supplemental material shall be sent directly to the copyright owner as specified in the copyright notice associated with the article.