
Abstract
The lack of (inter-)laboratory standardization has hampered the application of universal cutoff values for Alzheimer’s disease (AD) cerebrospinal fluid (CSF) biomarkers and their transfer to general clinical practice. The automation of the AD biomarker immunoassays is suggested to generate more robust results than using manual testing. Open-access platforms will facilitate the integration of automation for novel biomarkers, allowing the introduction of the protein profiling concept. A feasibility study was performed on an automated open-access platform of the commercial immunoassays for the 42-amino-acid isoform of amyloid-β (Aβ1–42), Aβ1–40, and total tau in CSF. Automated Aβ1–42, Aβ1–40, and tau immunoassays were performed within predefined acceptance criteria for bias and imprecision. Similar accuracy was obtained for ready-to-use calibrators as for reconstituted lyophilized kit calibrators. When compared with the addition of a standard curve in each test run, the use of a master calibrator curve, determined before and applied to each batch analysis as the standard curve, yielded an acceptable overall bias of −2.6% and −0.9% for Aβ1−42 and Aβ1–40, respectively, with an imprecision profile of 6.2% and 8.4%, respectively. Our findings show that transfer of commercial manual immunoassays to fully automated open-access platforms is feasible, as it performs according to universal acceptance criteria.
Introduction
Alzheimer’s disease (AD) accounts for more than 60% of all dementia cases. 1 Despite massive investments in clinical trials, no drug has shown significant disease-modifying effects yet. 2 AD is characterized by neuropathologically confirmed hallmarks, including but not limited to (1) aggregation of the 42-amino-acid isoform of amyloid-β (Aβ1–42) in extraneuronal plaques, which is reflected by a lowered Aβ1–42 concentration in the cerebrospinal fluid (CSF); (2) intraneuronal aggregation of hyperphosphorylated forms of the tubulin-associated unit (tau) in neurofibrillary tangles; and (3) neural degeneration, reflected by increased CSF p-tau181 and total-tau (t-tau) concentrations, respectively. 3 CSF levels of the classic AD biomarkers (Aβ1–42, t-tau, and p-tau181) are altered even a decade before symptom onset.3–6
The classic CSF AD biomarkers’ signature has shown satisfying clinical sensitivity and specificity to aid in the diagnosis of AD within a single center7,8 (list of definitions available at https://www.ncbi.nlm.nih.gov/books/NBK338448/). However, the generation of universal cutoff values remains challenging due to (1) the high intra- and interlaboratory variability (20%–30%),9–15 (2) the large bias of the absolute concentration measured with different platforms, and (3) the absence of reference materials or well-defined quality control samples for efficient run-validation purposes.10,12,16–18
The clinical accuracy of immunoassays is determined in part by the intrinsic biological variability for the analyte and the analytical accuracy. The latter is a combination of precision and bias. Robustness of the test procedure is a key parameter to obtain precise data when results are compared within test runs, between test runs, between studies, or between clinical laboratories.
Initiatives from the Alzheimer’s Biomarker Standardization Initiative, the Alzheimer’s Association, the International Federation of Clinical Chemistry and Laboratory Medicine, INSTAND, the European Joint Programming Neurodegener-ative Disease BIOMARKAPD project, and others aim to standardize the preanalytical, analytical, and postanalytical procedures with the ultimate goal to reduce intra- and interlaboratory variability.10,12,19–23 Certified reference materials (CRMs) are currently in the final phase of development for Aβ1–42 and in the planning phase for tau and Aβ1–40. The generation of universally accepted CRMs would reduce the bias observed between analytical platforms. Interestingly, the candidate CRMs for Aβ1–42 (= neat CSF) have been shown to be commutable for almost all commercially available immunoassays, including the manual Aβ1–42 Euroimmun assay.24,25
Recently, the Geneva Task Force for the Roadmap of Alzheimer’s Biomarkers has highlighted the requirement to develop and widely enable fully automated assay systems to reduce measurement variability of the AD biomarkers.26,27 The automated Elecsys Aβ1–42 electrochemiluminescent assay on the integrated, random-access, Roche Cobas platform (Roche Diagnostics, Indianapolis, IN) has resulted in a reduced interlaboratory imprecision of CSF Aβ1–42 measurement. 28 However, the field would also benefit from a multiprotein profiling approach ( Suppl. File 1 ). Indeed, the use of CSF Aβ ratios (Aβ1–42/Aβ1–40 and Aβ1–42/Aβ1–38) has been described to lower the effect of preanalytical variability and to improve the clinical accuracy compared with Aβ1–42 alone.21,29–32 Furthermore, it is preferred that immunoassays (mostly enzyme-linked immunosorbent assays [ELISAs]) that were applied to measure biomarkers in studies should be automated rather than developing distinct immunoassays for automation. The latter requires starting expensive validation studies from scratch, which also delays the progress in the field of biomarkers. The above arguments support the need to develop a system that enables us to automate immunoassays (such as ELISAs) with a high flexibility that will allow an easier integration of a panel of biomarkers into clinical settings. An open-access platform for automation might meet those needs.
As a proof of concept, we explored whether the classic ELISAs for Aβ1–42, Aβ1–40, and t-tau could be fully automated on an open-access system.
Materials and Methods
Immunoassays and Calibrators
Commercially available ELISAs for Aβ1–42 (cat. EQ6511-9601-L), Aβ1–40 (cat. EQ6521-9601-L), and t-tau (cat. EQ6531-9601-L) from Euroimmun Medizinische Labordiagnostika AG (Lübeck, Germany) were used to transfer manual test procedures to automation. Assigned values of the kit calibrators for Aβ1–42, Aβ1–40, and t-tau are listed in Supplementary File 2 . Ready-to-use (RTU) calibrators were produced by dilution of a stock concentration of recombinant Aβ1–42 (rPeptide cat. A-1163) or Tau441 (rPeptide cat. T-1001), in assay diluent (assigned values for the RTU calibrators are listed in Suppl. File 2 ). Calibrators were subsequently fractionated into test tubes (Sarstedt 3.5 mL; cat. 62.617.002) that are compatible in shape and size for application on the JANUS platform. Fractions were frozen at –80 °C and thawed at 37 °C prior to testing.
Validation of the Automated Immunoassays
First, the immunoassays for Aβ1–42, Aβ1–40, and t-tau were run on a semiautomated BEP III system that, upon manual pipetting of the samples, controls, standards, and biotin-labeled secondary antibody, automatically washed the 96-well plate (after a 3 h sample incubation period), added horseradish peroxidase–labeled streptavidin or substrate, and read the plate in a microplate reader at 450 nm with the reference wavelength set up at 650 nm (Siemens Healthcare, Erlangen, Germany). Automation on the BEP III system was validated by means of a commercial panel of five liquor (CSF) controls (Euroimmun, cat. CK6500-0502-L). The liquor controls were composed of lyophilized human CSF pools, supplemented with additives to guarantee long-term stability and to minimize the well-known adsorption of Aβ to the wall of the recipients (“stabilized liquor control”). Target values and specifications for acceptance for bias were defined by Euroimmun. It was defined as the mean ± 95% confidence intervals obtained after manually measuring the five stabilized liquor controls in a minimum of 10 runs in duplicate. To obtain values on the BEP III system of the stabilized liquor controls (duplicate measurements) within the specified acceptance ranges for bias, the instructions of the respective kit inserts had to be optimized accordingly.
Second, the dispensing step of samples, controls, standards, and biotin-labeled secondary antibody was automated on the JANUS Expanded Platform 8-tip Varispan pipetting robot (PerkinElmer, Waltham, MA) upstream of the BEP III platform. Validation of the fully automated assay (automated pipetting process followed by developing the plate on the BEP III system) was performed with the stabilized liquor control panel for each marker as described above to ensure that pipetting through the JANUS platform did not induce any shift toward the target value, for example, by inaccurate pipetting of volume required.
Constitution of the Human CSF Pools
Neat CSF samples, routinely collected from patients consulting the memory clinic of the University Hospitals of Leuven, were pooled to generate a set of pools (five concentrations) for each biomarker used for evaluating parallelism and imprecision of the automated assays. Target range concentrations of the individual samples were estimated based on historical laboratory routine data with the INNOTEST ELISA kit (Fujirebio Europe, Ghent, Belgium). The use of neat CSF samples was approved by the local ethics committee (reference ML9626).
Parallelism and Recovery
The manual assay design and the automated test procedures for Aβ1–42, Aβ1–40, and t-tau assays were assessed for parallelism by serially diluting human neat CSF samples over the analytical range of the respective immunoassays. Parallelism was performed based on CLSI EP06-A, by the polynomial method, for which the best polynomial regression fit was compared to the linear regression model. 33 Parallelism was proven when the difference between the linear regression fit and the best-fitted regression model was lower than 20%. Recovery was calculated, for both automated and manual assays, by dividing the measured concentration by the expected concentration, as defined by the reference concentration divided by the dilution factor. The ratio was expressed as a percentage of the expected concentration.
Imprecision Procedures
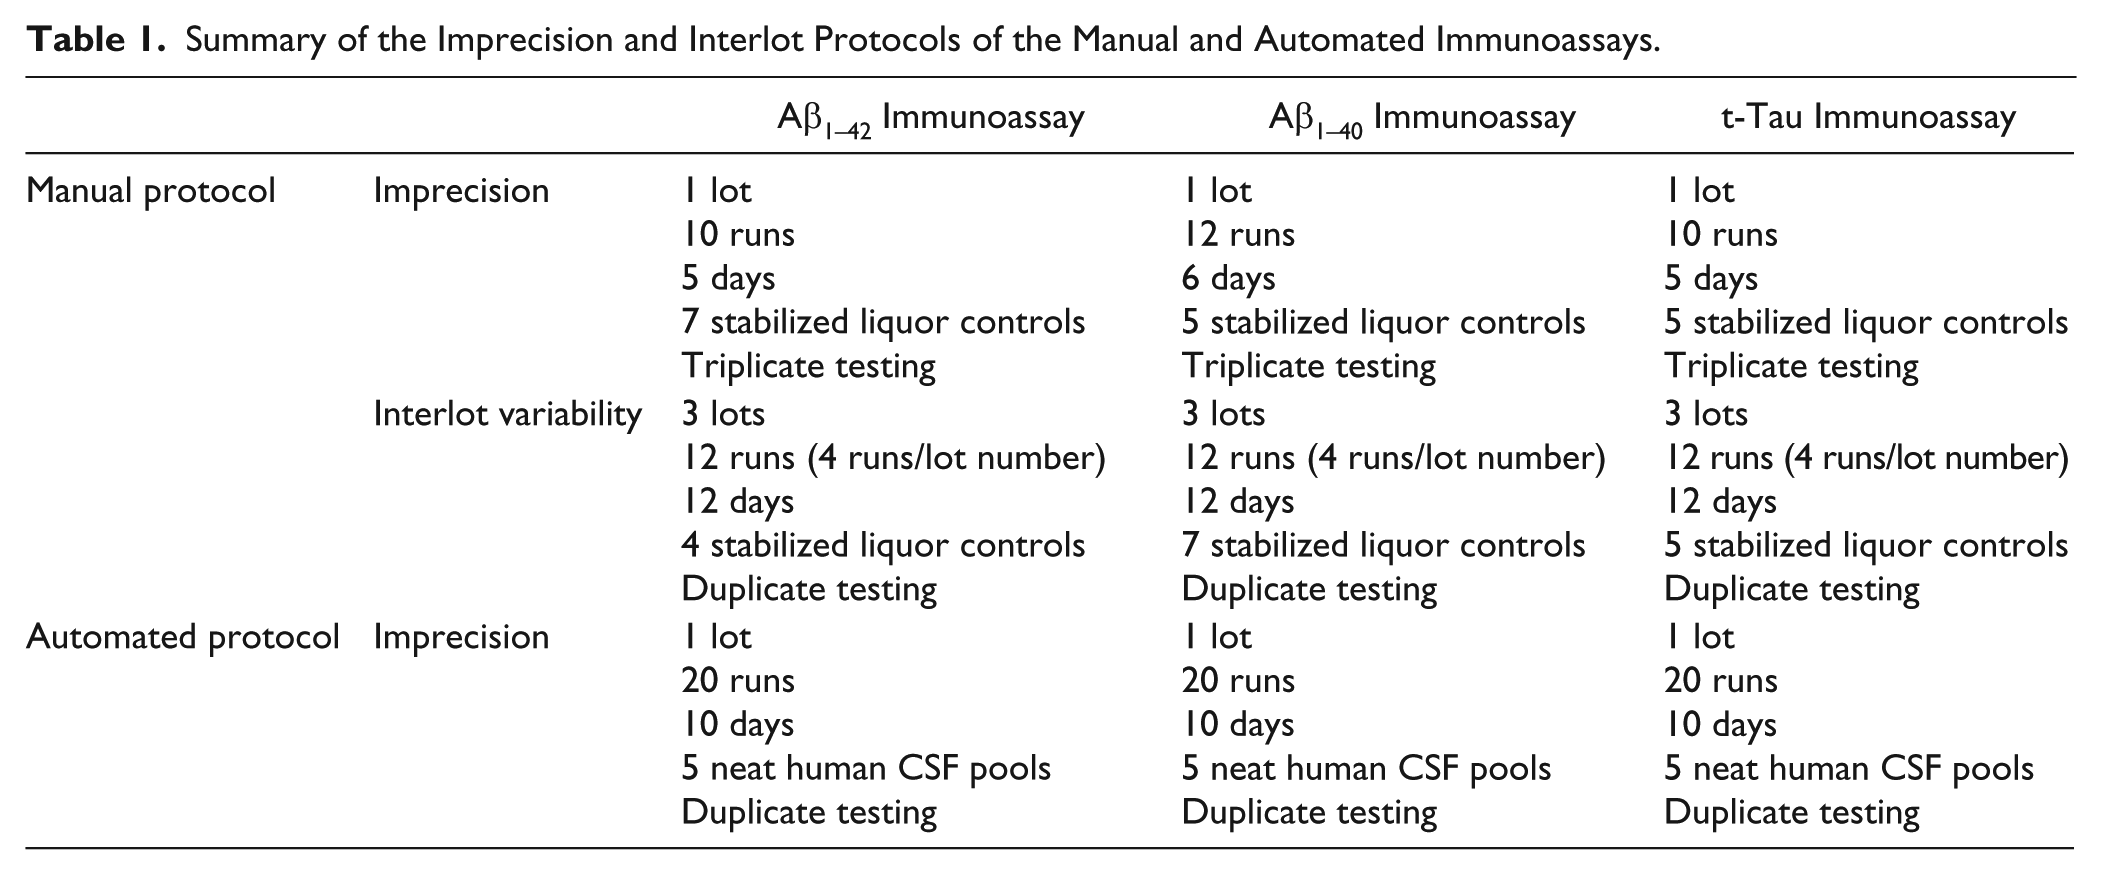
The imprecision and interlot variability protocols of the manual immunoassays for Aβ1–42, Aβ1–40, and t-tau procedures were performed by experienced laboratory technicians ( Table 1 ). The within-run (CV(%)wr) and between-day (CV(%)bd) imprecision of the manual testing were calculated based on the CLSI EP15-A2 guidelines.34,35 The imprecision profiles of the automated immunoassays for Aβ1–42, Aβ1–40, and t-tau were carried out based on the CLSI EP05-A2 guidelines by means of five neat human CSF pools (without additives) (protocol detailed in Table 1 ). 36 Within-run (CV(%)wr), run-to-run (CV(%)rr), and between-day (CV(%)bd) imprecision, as well as total imprecision (CV(%)total), were calculated based on the CLSI guidelines EP05-A2.36,37 Calculations were performed in Microsoft Excel 2010 (version 14.0.4763.1000 [32 bits]). For each biomarker, acceptance limits were defined as 0.75 times the within-subject biological variation.38,39 If the acceptance criteria were not met, the 15% acceptance criteria advised by the Food and Drug Administration (FDA) were defined as secondary acceptance criteria. 40
Summary of the Imprecision and Interlot Protocols of the Manual and Automated Immunoassays.
Additionally, for the automated Aβ1–42 and t-tau immunoassays, all RTU calibrators (see above) were analyzed concomitantly during the imprecision experiment.
Calibration Methods
All runs were analyzed using five parameter–logistic regression curves (5-PL). For every run, the 5-PL was used to fit the data (plotting the signal or observed optical densities [ODs]) against the assigned concentration of the reconstituted kit calibrator (= standard calibration protocol) (Suppl. Files 2 and 3). Moreover, for each run, 5-PL standard curves were generated with the ODs of the six RTU calibrators (excepted for Aβ1–40). For the master calibrator curve model, the 5-PL standard curves of the first run (also called first batch analysis) of the imprecision study of the automated assay with the standard calibration method were used to back-calculate every OD value generated in the following runs of the imprecision study of the automated assay (see above; Suppl. File 3 ). Normalization of the master calibrator curve was performed by dividing the OD signal of every measurement (calibrators and human CSF pools) by the mean OD of an internal standard loaded in duplicate (being a CSF pool or an RTU sample for the automated Aβ1–42 and t-tau assays and a lyophilized calibrator for the Aβ1–40 assay) taken along with every run ( Suppl. File 3 ).
Bias
The bias of the different calibration models compared with the reference standard calibration protocol was assessed for every single measurement for the respective human CSF pools. Bias in a given CSF pool for Aβ1–42, Aβ1–40, or t-tau was calculated as the mean of the difference, for each measurement (n = 40 per CSF pool), between the value obtained with a given calibrator model (normalized against an internal standard or not) and the true value, defined as the mean of the measurement obtained with the standard calibration protocol (considered the comparator method). The bias was expressed as the relative error percentage of the true value. The specifications for bias for Aβ1–42, Aβ1–40, and t-tau were calculated with the following formula: 39
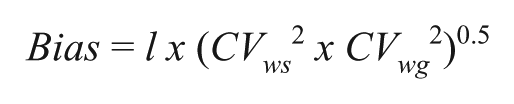
where:
l = Factor corresponding to 0.75 times within-subject variability
CVws = Within-subject variability calculated by Slats et al. 38
CVwg = Within-group variability calculated in amyloid PET scan–negative cognitively healthy subjects 6
Statistical Analysis
Normality of the back-calculated concentrations with the different calibration models was determined with the D’Agostino–Pearson test. The normally distributed back-calculated concentrations with the different calibration models were compared using the two-tailed unpaired t test. Comparisons of the not normally distributed back-calculated concentrations obtained with the different calibration models were made with the two-tailed Mann–Whitney U test. *p < 0.05 and ***p < 0.001 were considered significant.
Results
Assay Optimization
The incubation time of the conjugate solution from kit instructions (30 min for manual testing) was optimized to obtain values on the BEP III system for the stabilized liquor controls within the target ranges using the standard calibration protocol ( Table 2 ). Transfer from manual pipetting to the JANUS platform was validated by obtaining values for the stabilized liquor controls within the target ranges using the standard calibration protocol ( Table 2 ).
Validation of the Automated Immunoassays on the Open-Access Platform with Stabilized Liquor Controls.
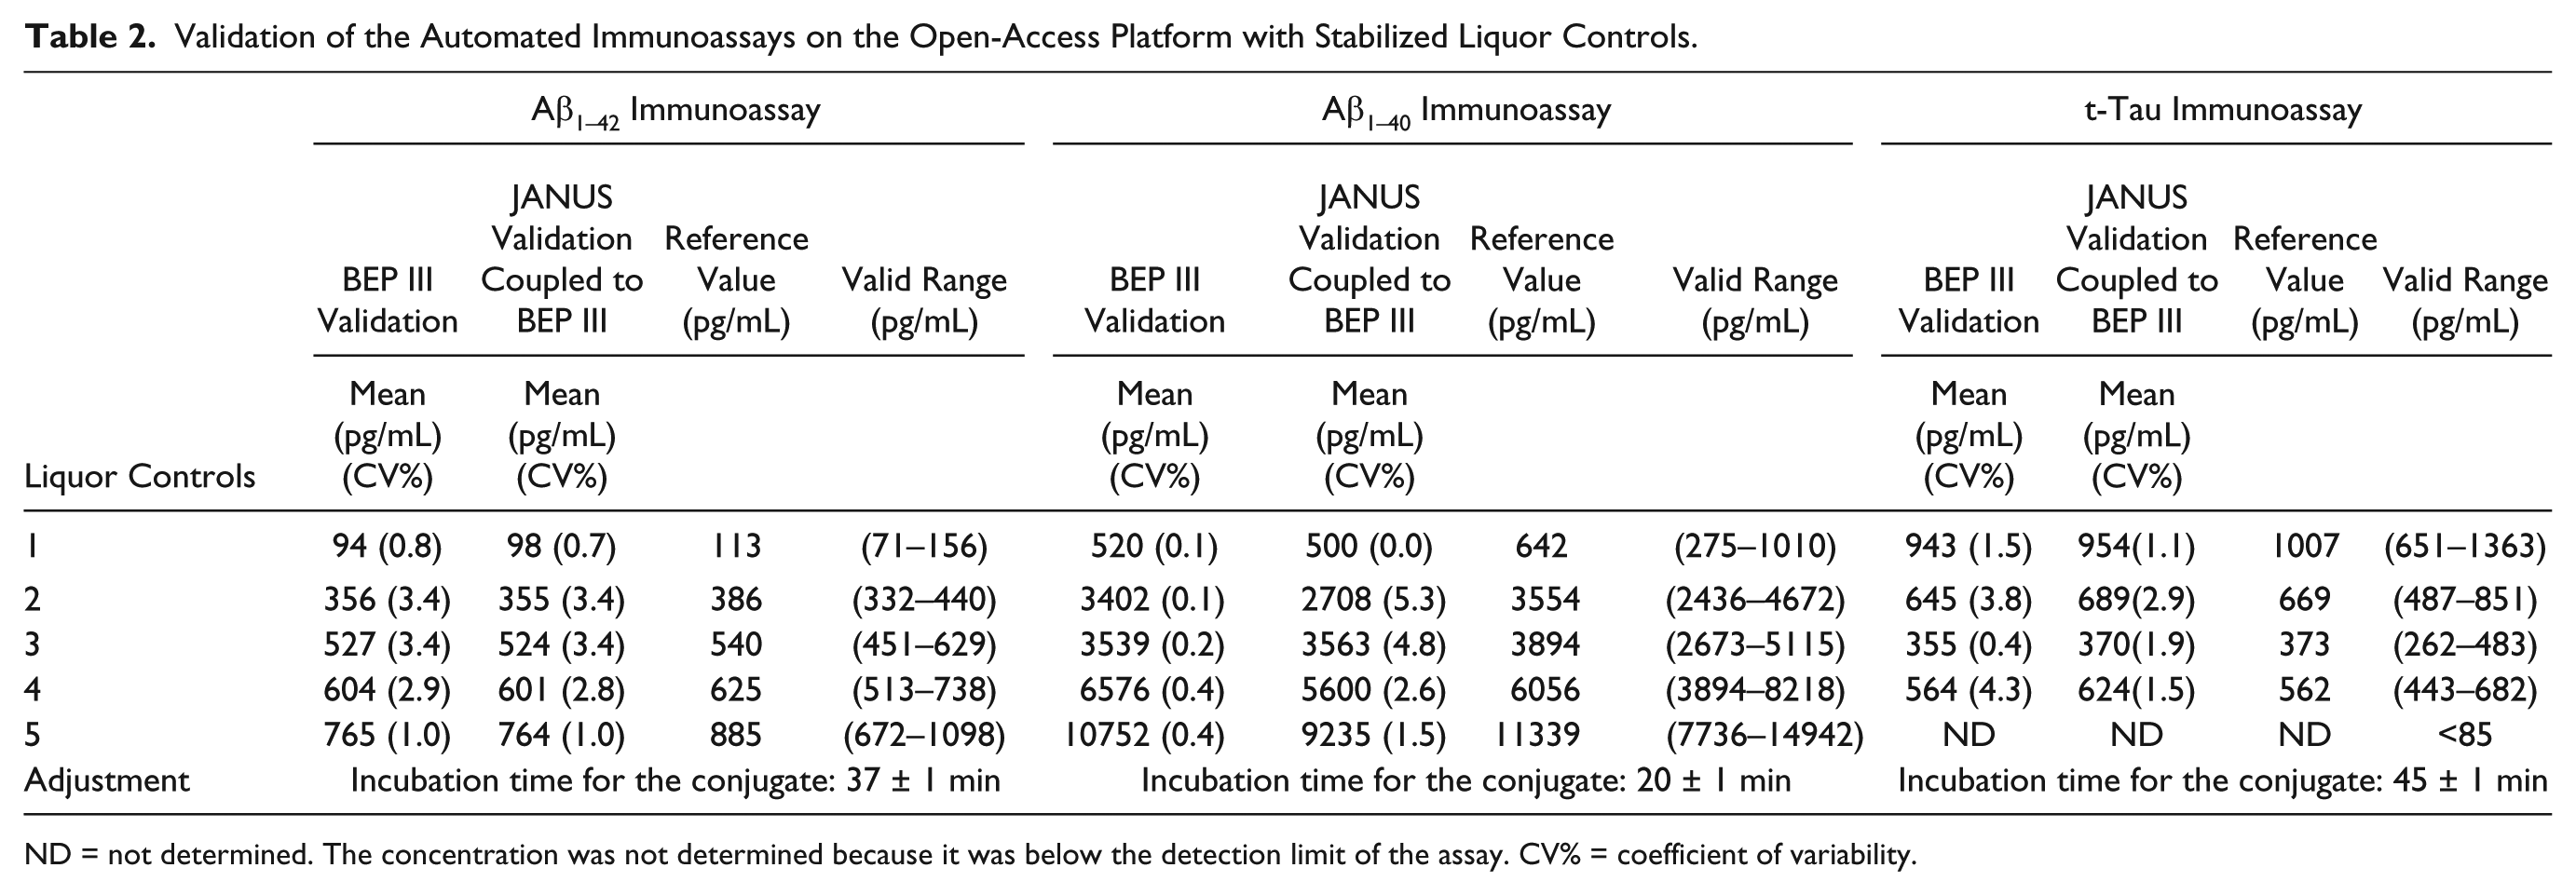
ND = not determined. The concentration was not determined because it was below the detection limit of the assay. CV% = coefficient of variability.
Analytical Performance: Parallelism
Parallelism was proven for the Aβ1–42 immunoassay (manual rho = 0.994, range 68–564 pg/mL; automated rho = 0.998, range 120–1128 pg/mL), Aβ1–40 immunoassay (manual rho = 0.999, range 970–11,285 pg/mL; automated rho = 0.995, range 1220–10721 pg/mL), and t-tau immunoassay (manual rho = 0.988, range 179–1890 pg/mL; automated rho = 0.997, range 86–1106 pg/mL) ( Fig. 1 ). The recoveries of the serially diluted CSF samples with the manual and automated Aβ1–42, Aβ1–40, and t-tau immunoassays were within 80%–120% of the respective expected concentration divided by the given dilution factor ( Suppl. File 4 ). Only for the t-tau automated immunoassay a slight divergence at low concentration could be observed (<176 pg/mL) ( Suppl. File 4 ).
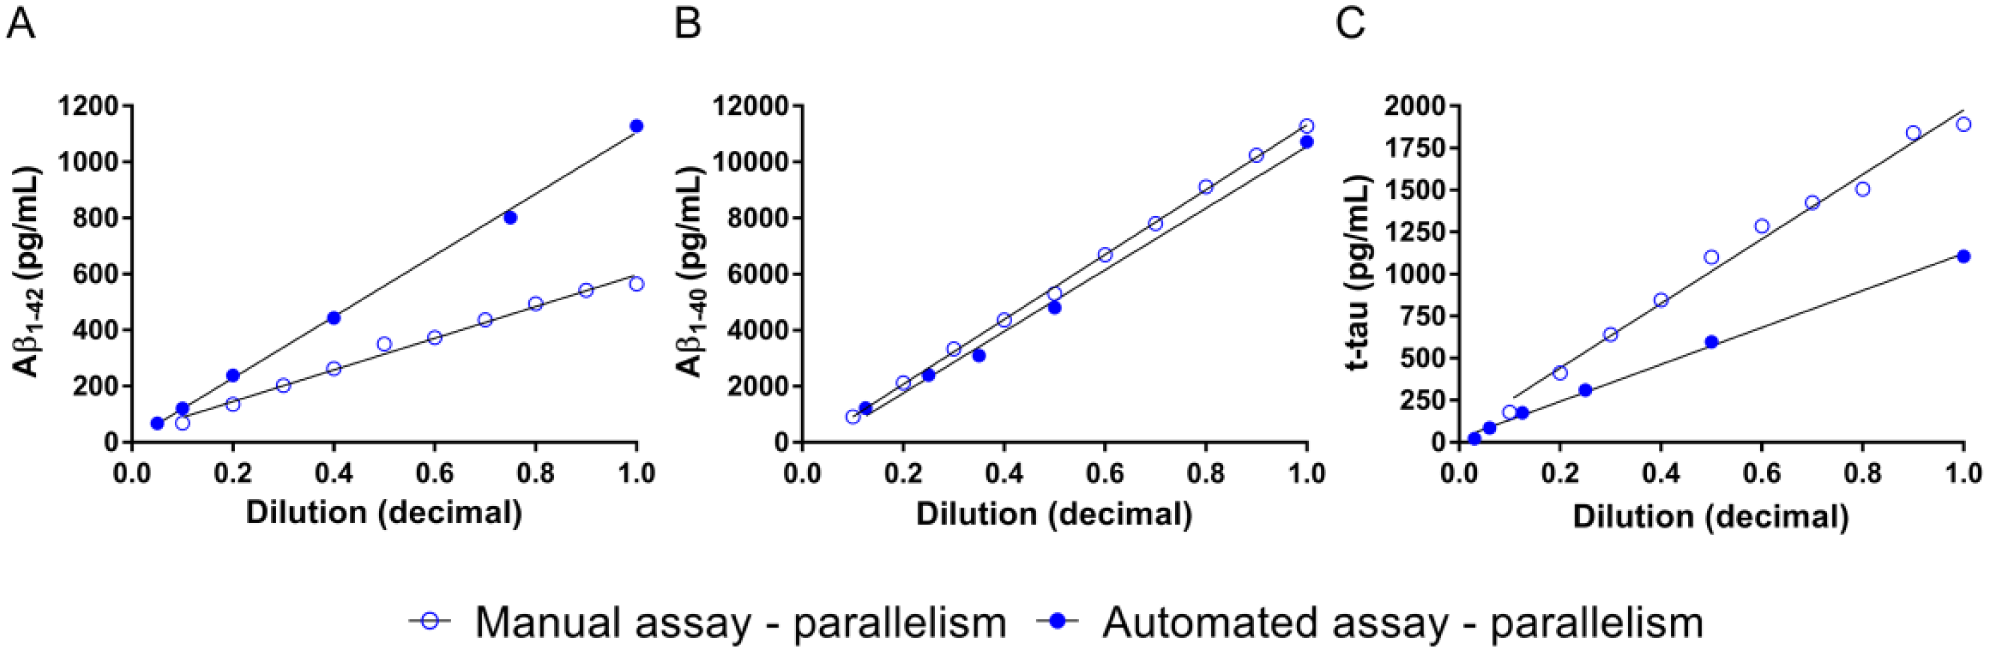
Parallelism of the manual and automated Aβ1–42, Aβ1–40, and t-tau immunoassays. Parallelism for both the manual and automated assays was assessed by serially diluting one CSF pool.
Analytical Performance: Precision
The within-run, run-to-run, day-to-day, and total imprecisions of the human CSF pools and stabilized liquor controls measured with the automated Aβ1–42, Aβ1–40, and t-tau assays, and calibrated using the reconstituted kit calibrators or RTU calibrators, are shown in Figure 2 and Supplementary File 5 .
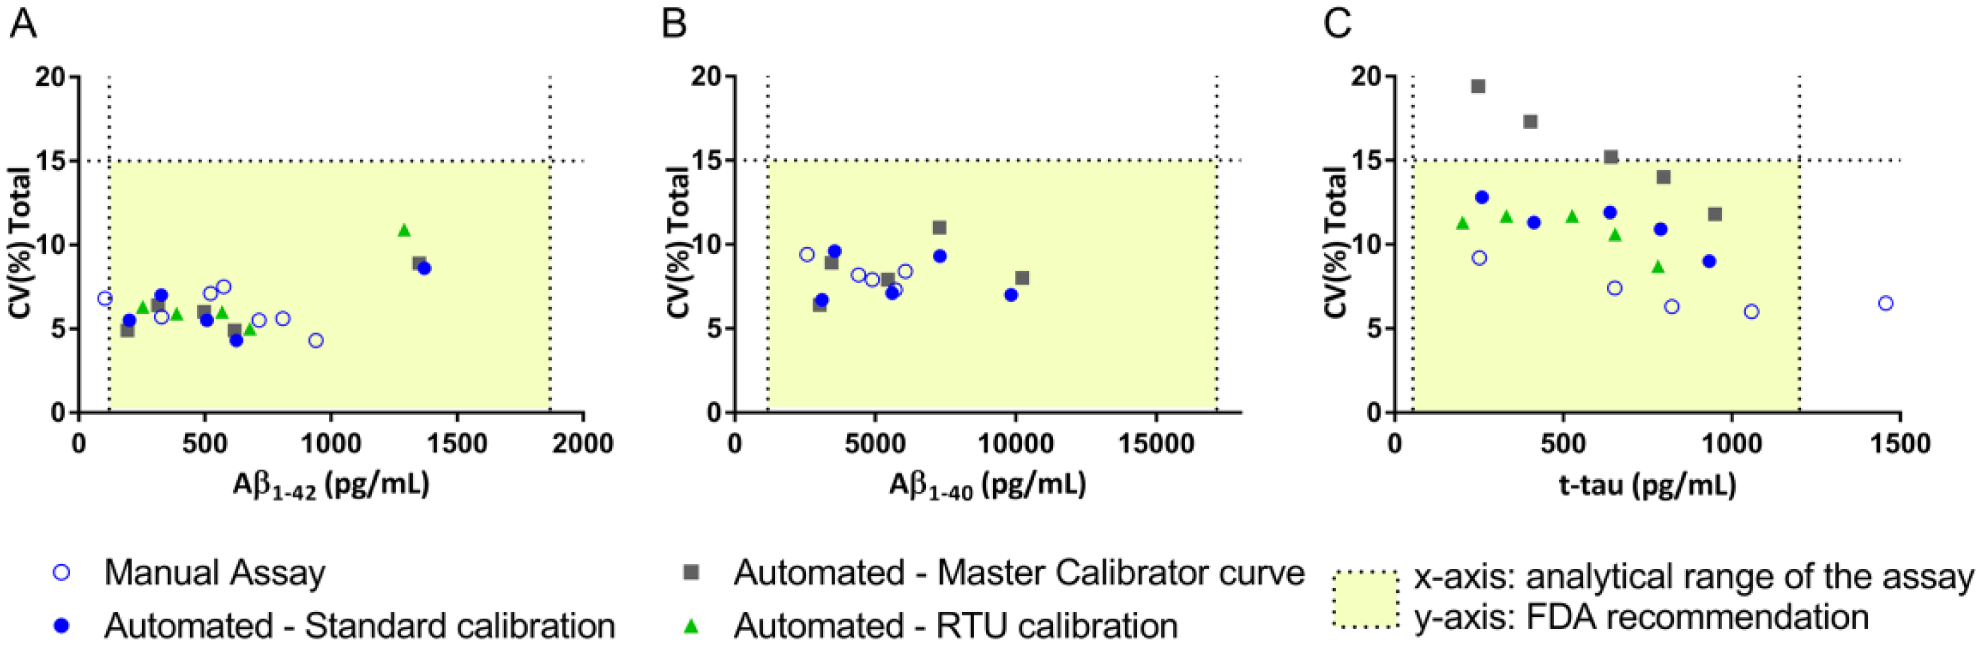
Imprecision profiles of the manual and automated immunoassays with the different calibration protocols. Imprecision profiles of the manual and automated Aβ1–42, Aβ1–40, and t-tau immunoassays according to the different calibration methods (
The total imprecision of the automated Aβ1–42 and Aβ1–40 immunoassays was comparable to that obtained with their manual testing (6.2% vs 6.1% and 7.9% vs 8.2%, respectively), performing below their respective acceptance criteria of 10.8% and 8.4% ( Fig. 2 and Suppl. Files 5 and 6). Automation of the Aβ1–42, Aβ1–40, and t-tau immunoassays improved the within-run imprecision compared with their respective manual testing (mean CV 2.6% vs 5.7%, 2.7% vs 6.7%, and 3.2% vs 6.9%, respectively) (Suppl. Files 5 and 6). At this time and using the current test procedures, automation of the t-tau immunoassay did not result in better imprecision profiles than manual testing (11.2% vs 7.1%, respectively) ( Fig. 2 and Suppl. Files 5 and 6). Although the imprecision of the automated t-tau immunoassay was above the acceptance criterion of 8.6%, it was lower than the 15% total imprecision recommended by the FDA. 40
The interlot variability of the manual procedures for Aβ1–42 was slightly higher than the total imprecision (9.7% vs 6.1%, respectively). The interlot variability of the Aβ1–40 and t-tau immunoassays was comparable to their respective total imprecision (8.9% vs 8.2% and 7.5% vs 7.1%, respectively) ( Suppl. File 6 ).
The imprecision profiles of the automated Aβ1–42 and t-tau calibrated with RTU calibrators were comparable to the imprecision profiles obtained with the standard calibration ( Fig. 2 and Suppl. File 5 ). Calibration toward RTU calibrators for the automated Aβ1–42 assay led to significant overestimated back-calculated concentrations of +11.8% compared with the true value obtained with the standard calibration method ( Suppl. File 7 ). Despite the overall bias of the RTU calibration for the automated Aβ1–42 assay was lower than the acceptance bias of 17.1%, at the low end of the analytical range, the calculated bias was above the accepted bias ( Suppl. File 7 ). In contrast, calibration toward RTU calibrators for the automated t-tau immunoassay led to underestimated back-calculated concentrations, with an overall relative error of −18.6% of the true value, higher than the accepted bias of 14.7% ( Suppl. File 7 ).
The imprecision profiles of the Aβ1–42 and Aβ1–40 automated assays performed according to the master calibrator curve calibration were comparable to those generated with the standard calibration protocol ( Fig. 2 and Suppl. Files 5 and 8). Master calibration of the automated t-tau immunoassay worsened the imprecision profile compared with that obtained with the standard calibration method (Fig. 2 and Suppl. Files 5 and 8), exceeding the 15% acceptance criteria recommended by the FDA. 40 This increased imprecision is driven by a higher run-to-run imprecision, in terms of the OD value, for the automated tau immunoassay than that obtained with the automated Aβ1–42 and Aβ1–40 immunoassays ( Suppl. File 9 ). The back-calculated concentrations obtained with the master calibration model, compared with the reference standard calibration protocol, did not yield to a systematic bias ( Fig. 3 and Suppl. File 7 ). The overall relative errors for the master calibration methods for the Aβ1–42, Aβ1–40, and t-tau assays were –2.6%, –0.9%, and –0.7%, respectively, of the true value obtained with the standard calibration method and were below their respective accepted biases of 17.1%, 11.1%, and 14.7% ( Suppl. File 7 ). The use of an internal standard did not improve the imprecision profile and bias obtained with the master calibration model (Suppl. Files 8 and 10).
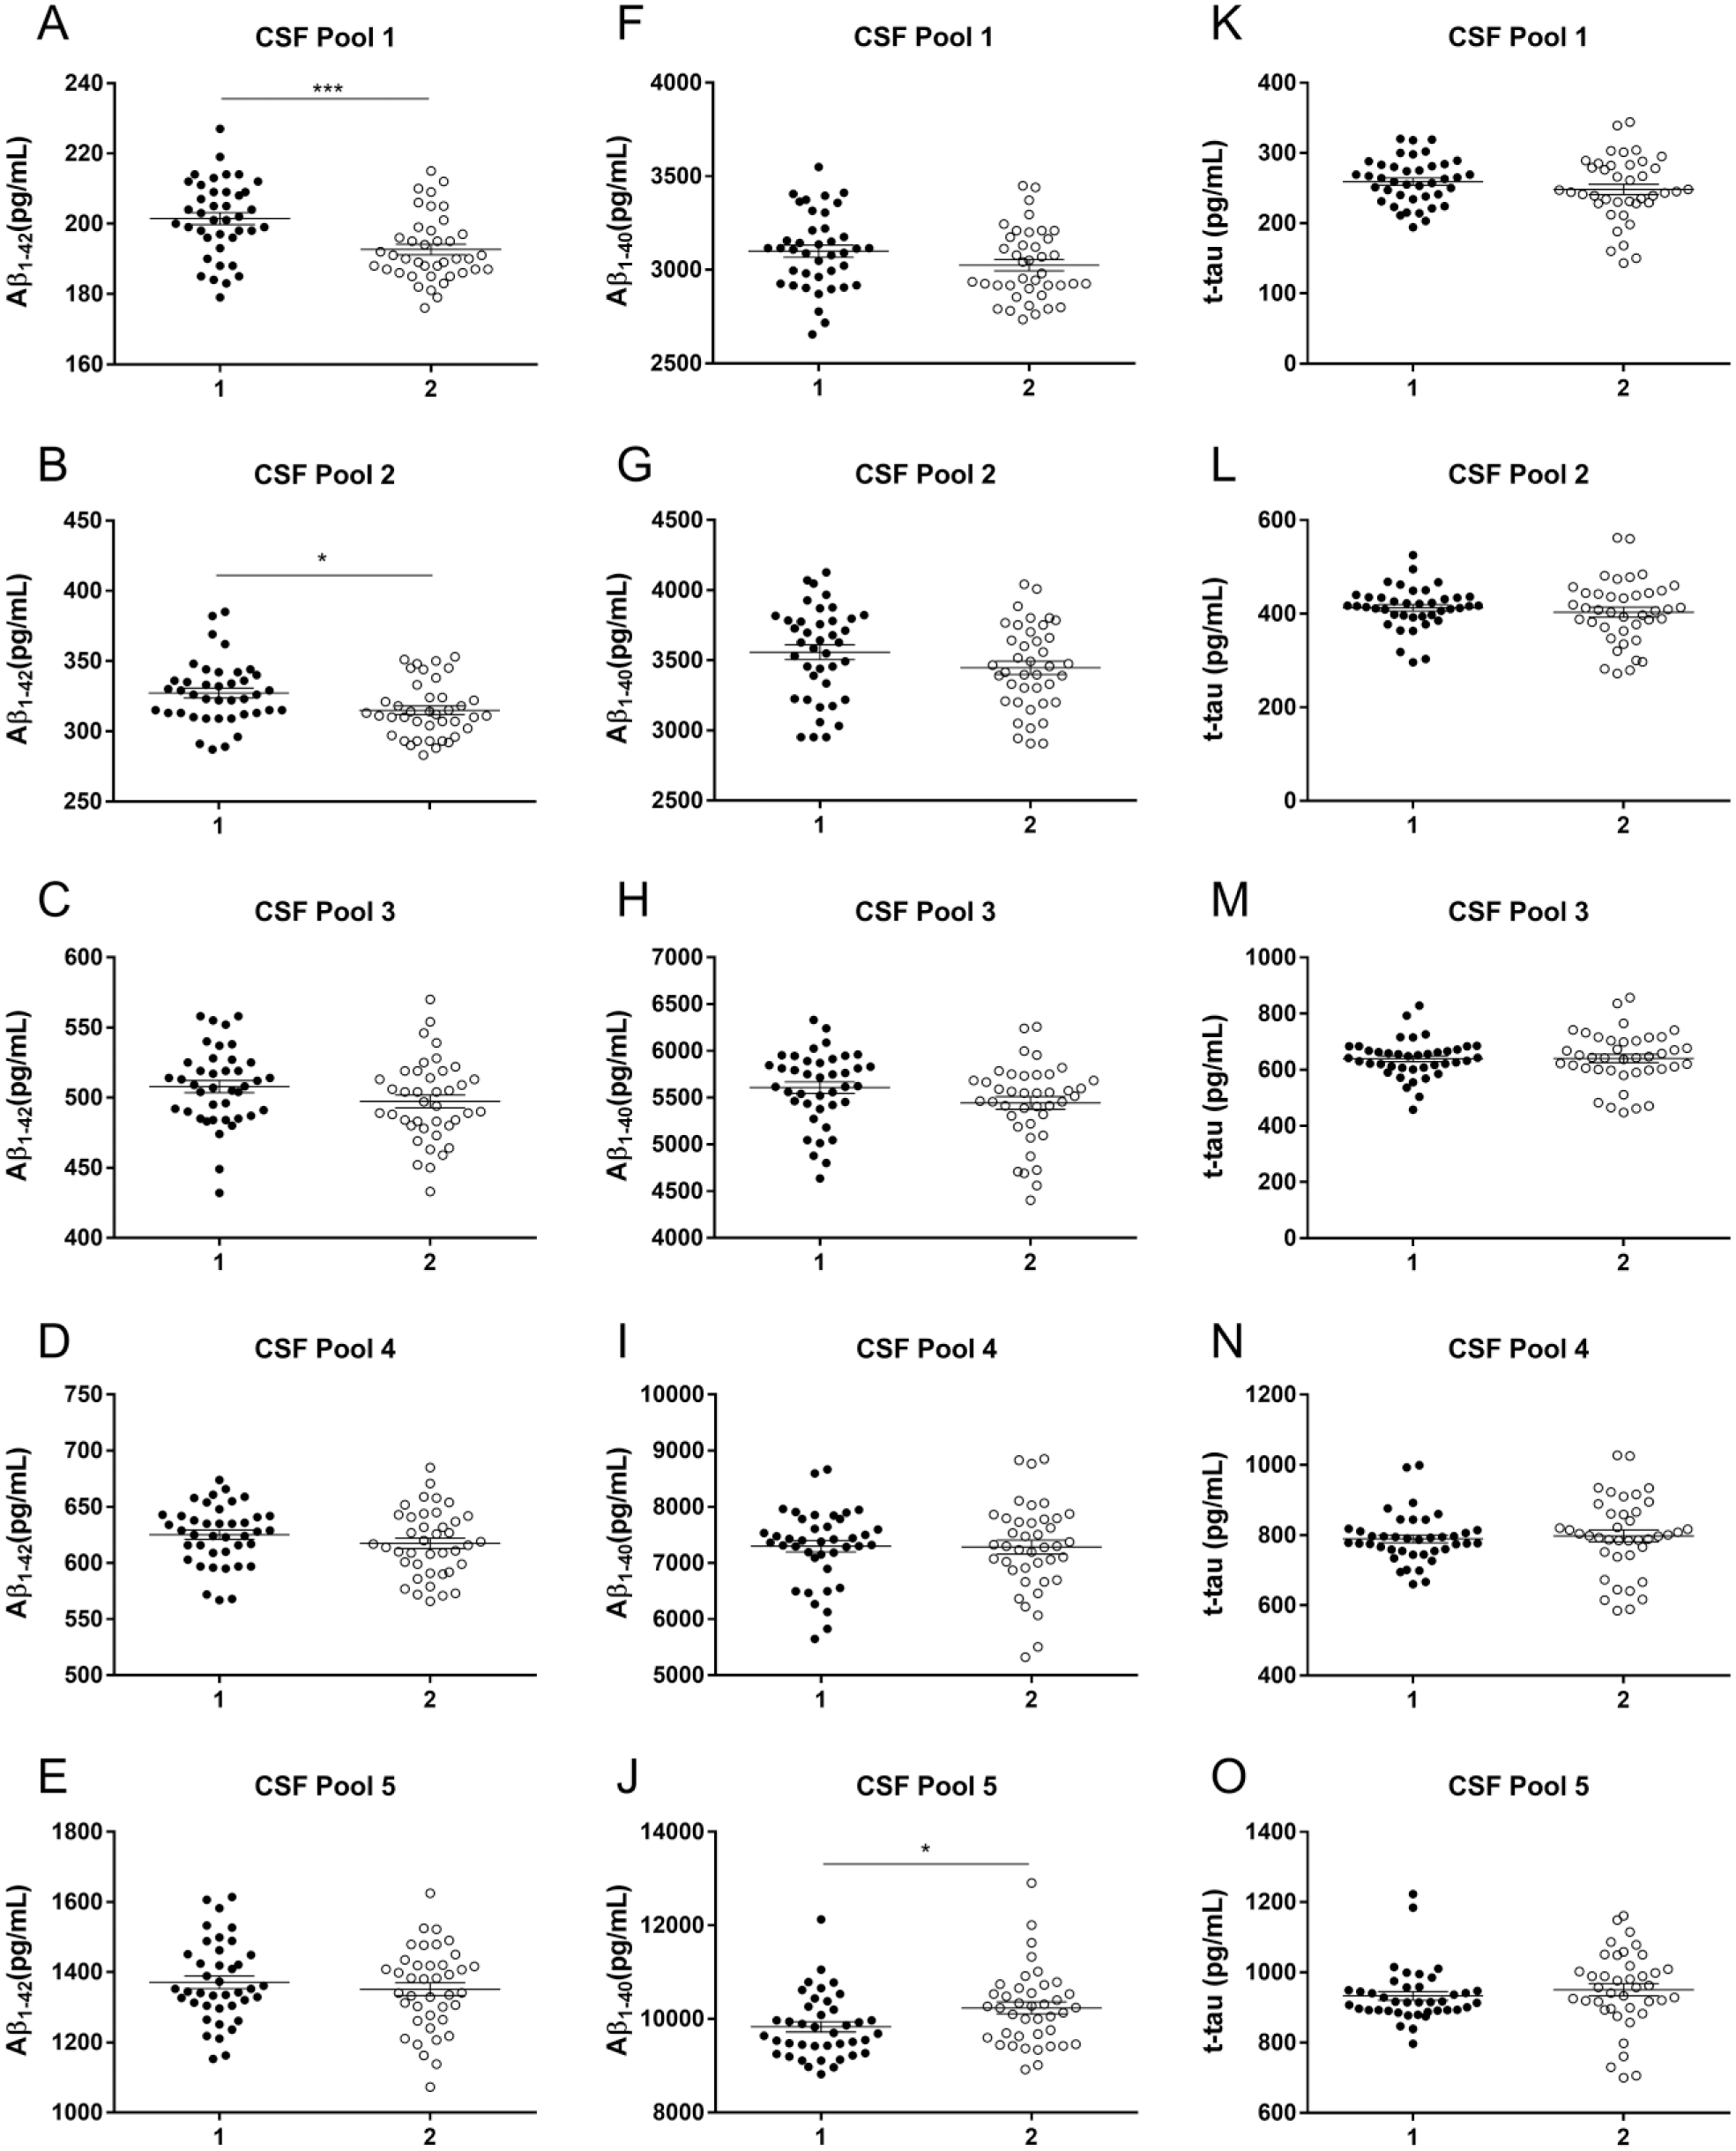
Accuracy of the master calibration protocol compared with the standard calibration procedure.
Discussion
The study provides experimental evidence that it is feasible to transfer manual testing procedures of the Aβ1–42, Aβ1–40, and t-tau immunoassays to full automation on an open-access platform. We adjusted the Aβ1–42, Aβ1–40, and t-tau immunoassay test protocols on an open-access platform for automation to generate results equivalent to those of the respective manual assay formats. The automated assays performed within the preset 15% acceptance criteria for imprecision advised by the FDA 40 and importantly yielded similar total imprecision profiles as their respective manual immunoassays for Aβ1–42 and Aβ1–40, even with improved within-run imprecision profiles. At this time, automation of the t-tau assay did not improve the total imprecision compared with the manual t-tau assay. The slightly higher imprecision data for the Aβ1–40 assay than for the Aβ1–42 assay might be related to the need to dilute CSF with sample diluent prior to the analysis.
The automation of the Aβ1–42 immunoassay on an open-access platform improved the total imprecision compared with the automated version of the assay on the integrated Euroimmun analyzer (total imprecision of 6.2% vs 8.1%, respectively), whereas automation of the Aβ1–40 and t-tau immunoassays on an open-access platform yielded imprecision values similar to those obtained on the Euroimmun analyzer (total imprecision of 7.9% vs 7.3% and 11.2% vs 7.1%, respectively). 22
Automation of the Aβ1–42 immunoassay yielded a within-run imprecision, comparable to the within-run imprecision obtained with other automated integrated platforms.22,28 Automation of the Aβ1–40 and t-tau immunoassays with standard calibration on an open-access platform slightly improved the within-run imprecision compared with the automation of the respective assays on the Euroimmun analyzer I-2P (2.7% vs 3.0% and 3.2% vs 4.3%, respectively).
The use of RTU calibrators compared with lyophilized material might be beneficial to reduce the interlaboratory variability or long-term availability of identical calibrator series, despite disadvantages like stability and logistic issues (use of dry ice for storage and shipment). The RTU calibrators provided imprecision profiles of the automated Aβ1–42 and t-tau immunoassays that were comparable to those of the standard calibration protocol obtained with reconstituted lyophilized kit calibrators. These data suggest that when lyophilized calibrators are reconstituted adequately and strictly following the protocol, precision issues can be overcome in the context of additional handling steps in the test procedure. However, positive and negative systematic biases were observed for the automated Aβ1–42 and t-tau assays, respectively. The RTU calibrators were not calibrated in extenso to the kit calibrators, which might explain these differences. It must be stated that lyophilized calibrators were prepared with the goal to obtain (with respect to time and temperature) calibrators that were more stable than those provided in liquid and to limit the need for shipment of calibrators on dry ice.
Our findings also demonstrate that the master calibration protocol of the automated Aβ1–42 and Aβ1–40 assays, compared with the standard calibration protocol, yielded back-calculated concentrations within their respective acceptance criteria for imprecision and bias. In contrast, the master calibration protocol for the automated t-tau assay increased the overall variability compared with the standard and RTU calibration protocols. The master calibrator curve was defined as the standard calibration curve obtained for the first run of the imprecision study and used over the following runs of the imprecision study. The master calibrator curve allows the end user to significantly reduce the costs for sample testing by having the possibility to include more samples in a single measurement per test run or by reducing the need to have a calibration curve in every test run. However, one must prepare some run-validation samples that will allow the end user to verify whether there is a deviation from the master calibration curve.
Fully integrated systems only require the implementation of one instrument requiring less maintenance than several instruments, reaching the goal of hands-off and displaying low interlaboratory variability.28,41 However, the possibility to transfer manual immunoassays, as shown for Aβ1–42, Aβ1–40, and t-tau assays, to a fully automated open-access platform has major advantages compared with integrated systems. (1) It allows easy integration of CSF protein profiling (i.e., higher flexibility) into a clinical routine environment. CSF protein profiling will allow an easier introduction of ratios (Aβ1–42/Aβ1–40, Aβ1–42/Aβ1–38, and Aβ1–42/t-tau) in clinical practice. Indeed, CSF Aβ ratios have been described to lower the effect of preanalytical variability and to display satisfying sensitivity and specificity (90%–97% and 88%–95%, respectively) to predict brain amyloid burden in preclinical and prodromal AD, and to discriminate controls and AD patients.6,21,29–32 (2) Additionally, automation of the AD biomarker immunoassays on open-access platforms will encourage the automation of other candidate AD biomarker immunoassays, such as neurofilament light chain and neurogranin, in worldwide efforts of standardization. Therefore, as part of a normal turnover in clinical laboratories, open-access platforms have two additional advantages. (3) They guarantee a long-term commitment from clinical laboratory end users to given immunoassays compared with an integrated system. This long-term commitment allows the generation of stable standardized analytical procedures that are mandatory to lower the intra- and interlaboratory variability. (4) In a clinical laboratory context, open-access platforms have the major advantage of being largely commutable, besides the AD biomarker immunoassays, to a broad range of immunoassays without being committed to one assay provider.
The present study has some limitations: (1) Only one protocol was followed to prepare the different human CSF pools in the automated assay format. Previously, it was shown that prewashing CSF collection tubes with specific buffers or the use of “low binding” tubes can reduce adsorption to recipients of Aβ isoforms. 21 However, the latter will have an impact only on bias and not on precision. (2) It was not possible to quantify the Aβ1–42/Aβ1–40 ratio on the same aliquots since both imprecision protocols were performed with different human CSF pools and at different times. It will be important in the future to investigate imprecision profiles for the ratio Aβ1–42/Aβ1–40. (3) The transfer of manual testing to only one open-access platform (JANUS platform manually coupled to the semiautomated BEP III) was investigated. Future studies are required to estimate the added value on interlaboratory variability of such open-access platforms, especially by using different instrumentation. (4) The developed open-access platform still requires a manual step to transfer test plates from the dispensing robot (JANUS platform) to the semiautomated BEP III instrument. (5) We did not integrate into the study an evaluation of interlot and interlaboratory imprecision profiles of the fully automated Aβ1–42, Aβ1–40, and t-tau immunoassays, the former underestimating, in part, the true long-term within-laboratory precision profile. (6) In the context of this study, it was not possible to compare the robustness of manual and automated procedures in a clinical routine context. Indeed, the manual immunoassays were performed by highly experienced operators specialized in these particular assays. This may underestimate the imprecision of the manual testing due to a lower number of random and systematic errors, as documented in the results from the Alzheimer’s Association quality control program. 10 (7) The study was focused on analytical performance. No evaluations were performed to verify the impact of automation on the clinical performance of the assays.
Conclusions
Our findings describe that automation of the Aβ1–42, Aβ1–40, and t-tau immunoassays on an open-access platform is feasible and performs within the acceptance criteria for precision and bias. An open-access platform has the major advantage that even with modifications of the assays (e.g., change of antibodies), the assays can be further used on the platform. RTU calibrators can further improve the intercenter or lot variability, especially taking into account the need for having kit stability of more than 2 years for testing samples from clinical trials. Finally, we showed that the master calibrator curve performs as accurately as the standard calibration protocol without modifying the precision profile of the automated Aβ1–42 and Aβ1–40 immunoassays.
Footnotes
Acknowledgements
We gratefully thank Paul Drent, Martin Reynders, Jeroen Vandersmissen, Anne Clinckspoor, Marie-Christine Clukkers, and Katrien Overloop for assistance with automation of the immunoassays.
Supplementary material is available online with this article.
Declaration of Conflicting Interests
The authors declared the following potential conflicts of interest with respect to the research, authorship, and/or publication of this article: Erik Stoops: employee of ADx NeuroSciences and shareholder of ADx NeuroSciences; Leentje Demeyer: employee of ADx NeuroSciences; Cindy Francois: employee of ADx NeuroSciences; Britta Brix: full-time employee of Euroimmun; Rik Vandenberghe: clinical trial agreements with Merck, Novartis, Eli Lilly, Roche, Biogen, and AbbVie; Hugo Vanderstichele: cofounder of ADx NeuroSciences and a founder of Biomarkable; Koen Poesen: assays for Alzheimer’s biomarkers were sponsored by Euroimmun and travel fees were compensated by Euroimmun.
Funding
The authors disclosed receipt of the following financial support for the research, authorship, and/or publication of this article: This work was supported by Flanders Innovation & Entrepreneurship (VLAIO).
References
Supplementary Material
Please find the following supplemental material available below.
For Open Access articles published under a Creative Commons License, all supplemental material carries the same license as the article it is associated with.
For non-Open Access articles published, all supplemental material carries a non-exclusive license, and permission requests for re-use of supplemental material or any part of supplemental material shall be sent directly to the copyright owner as specified in the copyright notice associated with the article.