
Abstract
Gut-on-a-chip in vitro modeling is an emerging field, as the human gut epithelium and gut microbiome have been recently identified as novel drug targets for a wide variety of diseases. Realistic in vitro gut models require a variety of precise environmental cues, such as chemical and gas gradients, in combination with substrates like mucus that support the growth of microbial communities. This technical brief describes a microfluidic architecture capable of developing a physiologically relevant oxygen gradient that emulates the oxygen profile proximal to the epithelial inner lining of the human colon. The device generates stable and repeatable defined oxygen gradients from 0% to 4 % partial pressure O2 over a length scale of hundreds of microns, and was applied to study the effects of oxygenation on the structure of native mucus that lines the colon wall. Using simulation as a design tool for hybrid gas–liquid microfluidic devices enables on-chip creation of defined, physiologically oxygen gradients. These microfluidic architectures have powerful potential applications for gut physiology, including providing optimal oxygenation conditions for the culture of mammalian epithelial cells in the gut lining, as well as creating a realistic mimic of the oxygen gradient found in the intestinal lumen for complex microbiome cultures.
Introduction
Modeling of in vivo physiology requires exquisite control of environmental factors and gradients, such as temperature, oxygen percent, and nutrients. Gut-on-a-chip platforms specifically have been gaining attention, as the human gut and microbiome have been identified as potential new drug targets for various gut 1 and central nervous system (CNS) 2 disorders. While the mammalian cellular physiology at the colon wall is well understood, deciphering the complex interactions between the mammalian gut lining and the microbiome remains challenging, as it is difficult to carry out nondisruptive in vivo studies with animal models. A wide range of in vitro devices have already been developed to model the human gut; 3 however, most of these devices can be viewed as bioreactors at different scales, creating uniform environments with uniformly defined pH levels, oxygenation, and chemical compositions that have little resemblance to the physiochemical gradients, both radial and linear, present in the human gut. 4 In this work, we describe the development of a microfluidic tool for both basic and translational research that emulates the steep oxygen gradient found in the mucosal layer at the inner intestinal wall of the colon. Comprising both gas-filled microchannels to dynamically regulate oxygen concentration and fluid channels that can support biologically relevant solutions, the microfluidic device can be easily adapted to any potential microfluidic geometry to study gut phenomena or other biological studies requiring fine control of oxygen partial pressure (e.g., tumor growth 5 and dental biofilms 6 ).
A key advantage of our system is its simplicity in fabrication and use to enable the standard microbiology laboratory to be able to run our platform without specialized engineering equipment or expertise. The device was fabricated with reusable aluminum molds, which can be purchased directly from contract manufacturers, such as ProtoLabs, and a curable polymer (polydimethylsiloxane [PDMS]) then bonded the layers thermally or with a weak plasma treatment. Adjustments to the design can be easily changed in CAD software, such as SolidWorks, and ordered for less than $150 per mold, forgoing the need for a clean room and the soft lithography techniques traditionally required for PDMS microfluidics. These “maker microfluidics” enable nonexperts to benefit from the advantages of microfluidics without the advanced resources typically required. 7
The trade-off of the use of millifluidic molds for prototyping versus lithographically patterned molds with tight dimensions introduces modeling discrepancies and reduces the goodness of fit of simulated versus experimental oxygenation profiles. However, we argue that while our system does not improve on previous work on microfluidic oxygenation,8–13 our low-tech method is an acceptable compromise, as the technology enables more laboratories to make parts for oxygen-sensitive applications, like gut-on-a-chip, where the penetration depth of the oxygenation profile is more critical than the absolute shape.
As medical research drives the development of more biomimetic in vitro platforms, there is an emerging interest in the mucosal layer, which exists at the interface between the human microbiome and the mammalian gut cells. Mucus, composed of highly glycosylated proteins called mucins, along with water, lipids, salts, growth factors, and enzymes, serves a multipurpose role in gut biology. 14 Mucus functions as a barrier for harmful toxins 15 and pathogenic bacteria, 16 a source of microbial carbon 17 and antimicrobial agents, 18 and a region of colonization for many bacteria. 19 As the interface between our human cells and our microbiota, the mucosal layer is colonized by commensal bacteria that synthesize antimicrobial compounds against pathogens, and slight perturbations in the properties of the layer can lead to serious disease. A depleted mucosal layer can reduce the barrier function it serves and trigger a strong immune response and inflammation of the gut. 20 Additionally, small changes in viscosity have been associated with diseases such as bronchitis and cystic fibrosis (more viscous mucus), as well as bacterial vaginosis (less viscous mucus). 21
The mucosal layer can be conceptually divided into two layers, a compact inner layer proximal to the epithelial cells lining the intestine and a diffuse outer layer. The outer layer hosts a distinct microbial niche occupied by the commensal bacteria, while the inner layer primarily functions as a protective cell barrier. 22 The functional properties of these inner and outer layers have been extensively studied and discussed in literature, yet the differences in their physical properties are only beginning to be explored. Intestinal mucus constitutes a gel due to mucin–mucin intermolecular interactions, including disulfide bonds. As disulfide bonds require oxygen to be maintained, the lack of oxygen in the gut lumen may cause this outer layer to break down, reducing its effective crosslinking density and enabling greater mobility of microbial populations. Although it is unknown how the oxygen concentration may affect mucus barrier properties, previous studies have shown that mucus viscosity and transport properties are altered by mild stimuli, including pH, salts, and lipids. 23 Thus, this work investigates the significance of oxygen concentration on mucus barrier properties through measurement of effective diffusivity coefficients. The observed oxygen gradient measured in the murine colon has effectively measured 0% oxygen in the lumen, with a sharp increase proximal to the epithelial lining approaching 5% oxygen. 24 To investigate this hypothesis that oxygen concentration contributes to the density gradient of mucus at the epithelial lining, we have developed a microfabricated device that emulates the steep oxygen gradient at the colon wall.
Materials and Methods
COMSOL Modeling
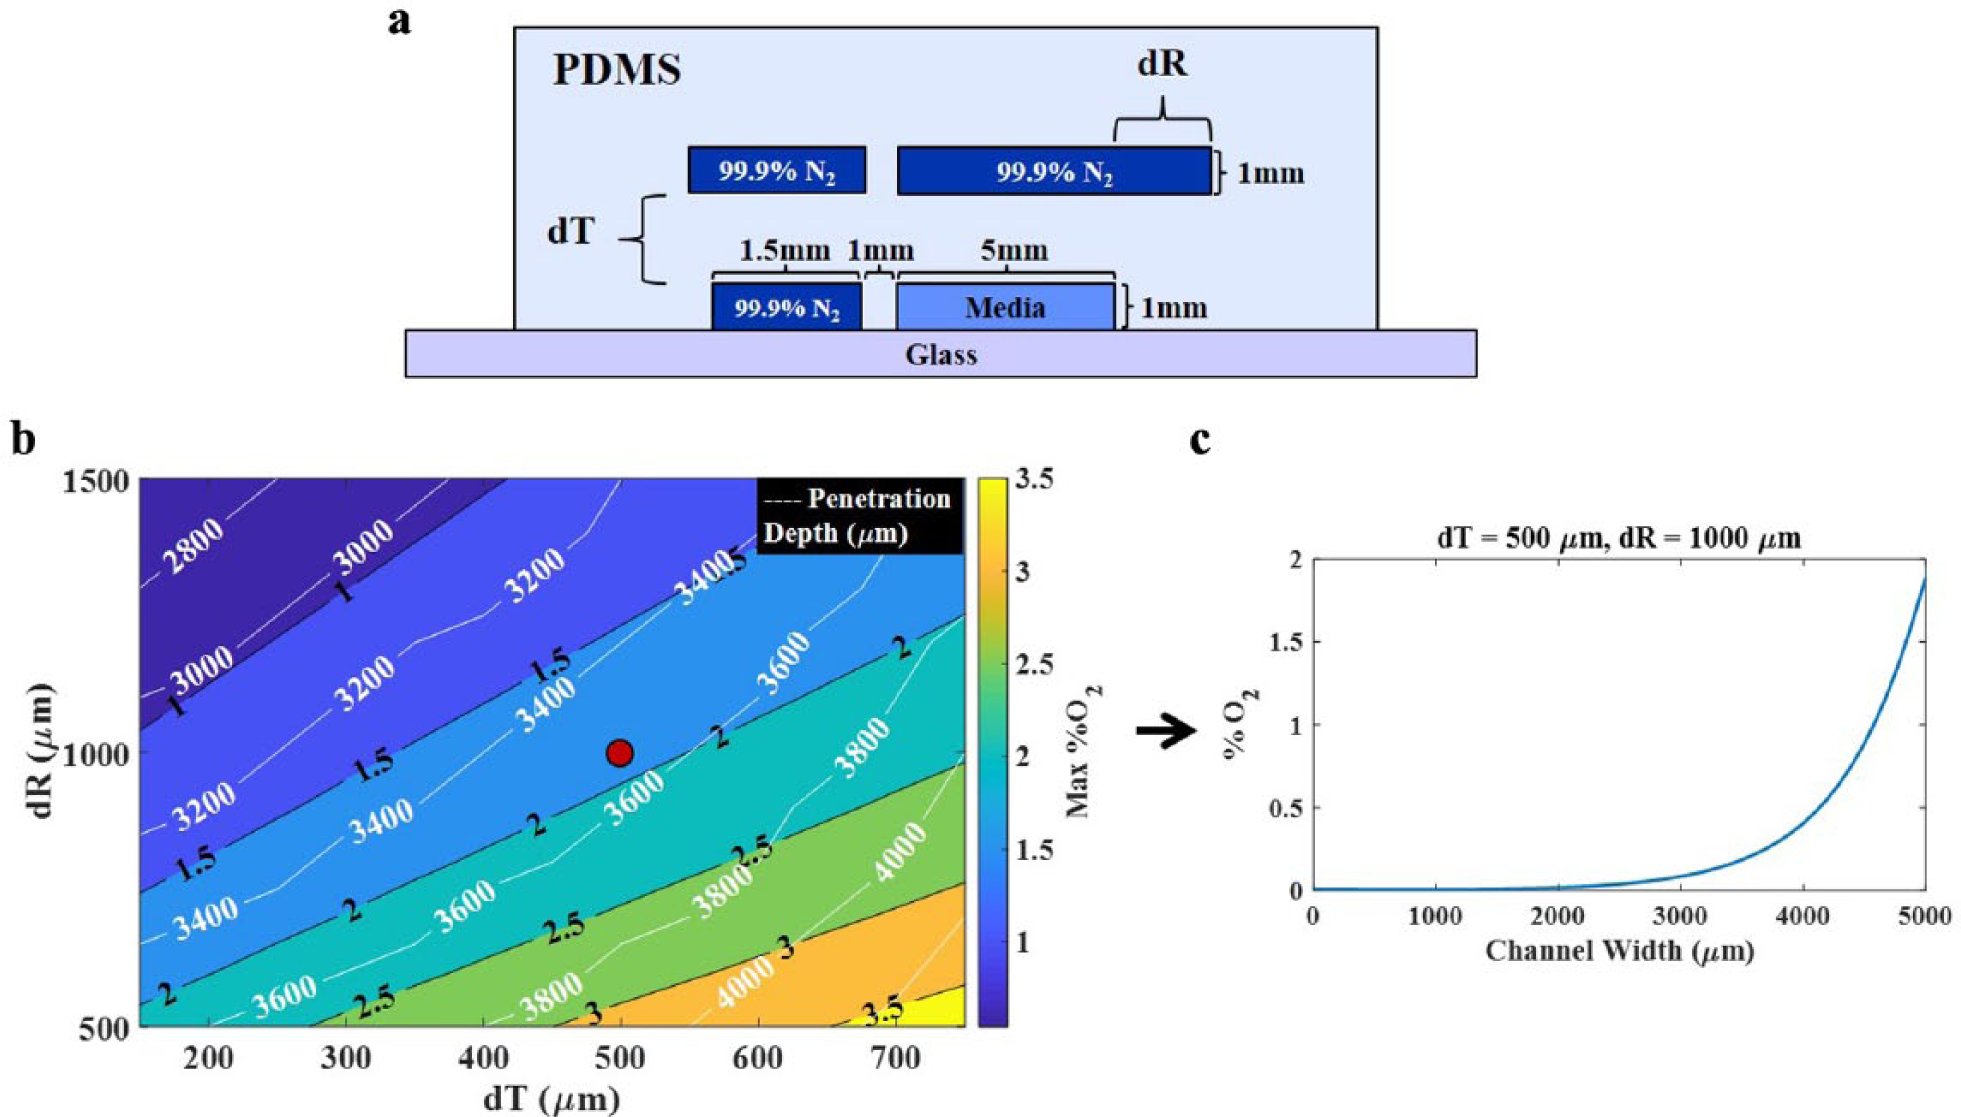
Finite element analysis was completed using COMSOL Multiphysics 5.2a, following a procedure similar to that found in Kim et al. 25 Both the two-dimensional (2D) and three-dimensional (3D) simulations considered the mass transfer of O2 at steady state throughout the PDMS device and media channel. A zero-partial-pressure O2 concentration boundary condition was applied along walls of the gas channels, through which pure N2 was flowed. The external walls of the PDMS, in contact with ambient atmosphere, had an O2 concentration boundary condition corresponding to 0.21 atm of partial pressure. All boundaries in contact with the glass substrate had a no-flux boundary condition applied. The mass transfer of O2 from PDMS to the media channel was determined by the relative O2 solubilities of each material, as demonstrated in Kim et al. 25 For the 2D simulation models, the device cross section perpendicular to N2 flow was modeled, capturing the induced O2 gradient ( Fig. 1 ). This model contains only one sample chamber and neglects entrance effects and any mass transfer via the unmodeled channel faces. The 3D simulation models the entire device with four sample chambers and includes mass transport from all directions.
COMSOL Modeling. (
Device Fabrication
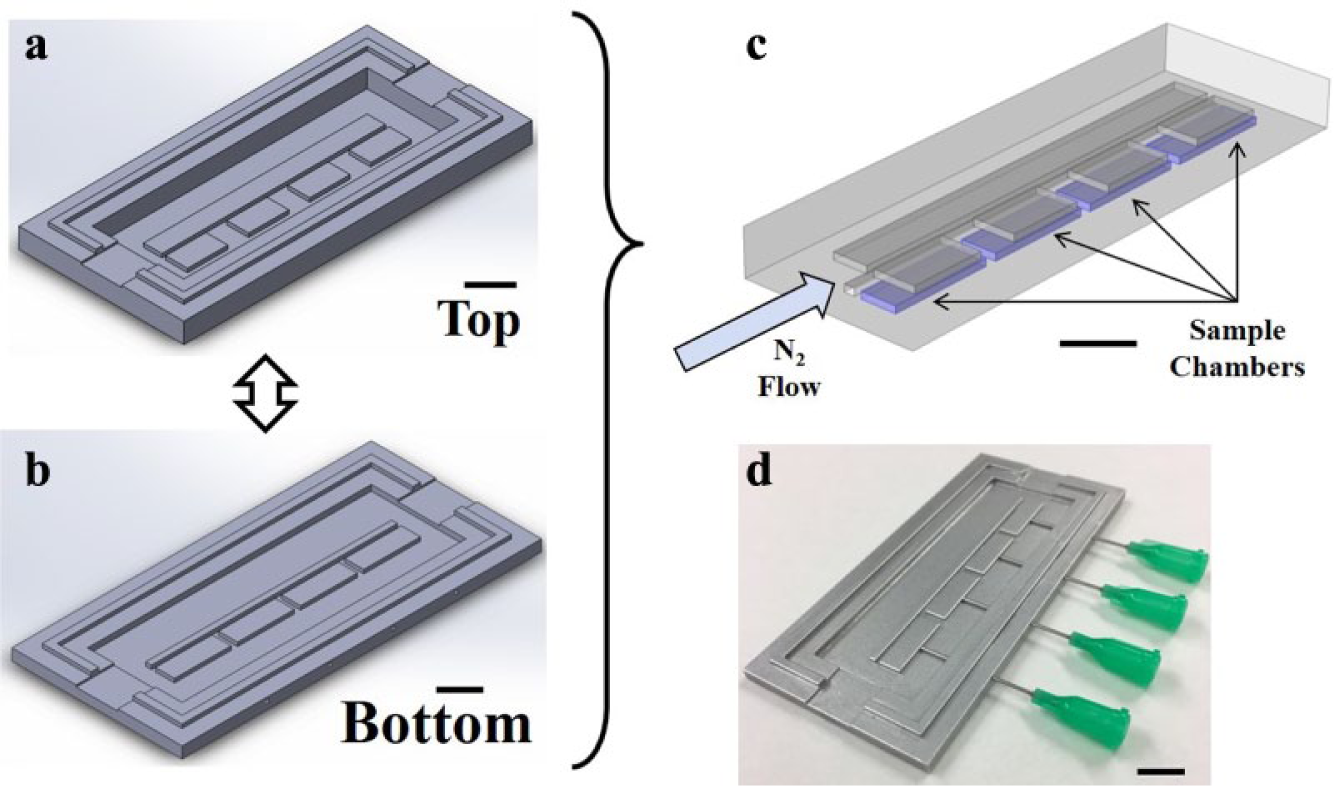
Two aluminum molds for each layer of the device modeled in COMSOL were designed in SolidWorks and prototyped via computer numerical control (CNC) milling at Protolabs (Maple Plain, MN). The molds are visualized in Figure 2a,b ; the bottom layer mold is photographed in Figure 2d . PDMS (Sylgard 184, Dow Corning, Midland, MI), at a 10:1 ratio of elastomer to curing agent, was mixed, degassed, and poured over both molds to create top and bottom device layers. Fiber-optic oxygen sensor inlets were molded into the side of the bottom device layer by placing long dispensing needles (no. 75165A681, McMaster-Carr, Robbinsville, NJ) through the side of the mold, flush against the fluidic mucus chamber ( Fig. 2d ). For the primary cure, the PDMS-filled molds were degassed for 5 min under vacuum to remove residual bubbles before being placed in a 72 °C oven for 20 min. After baking, the molds were removed from the oven. First, the dispensing needles were carefully removed from the mold, leaving behind ports large enough to fit the 21-gauge oxygen sensor needle without tearing, but tight enough to create a gas leak-free seal around the sensor needle housing. The top and bottom PDMS parts released with an X-Acto knife. Inlets and outlet ports were subsequently made in the top layer using a biopsy punch. After a brief surface cleaning with Scotch tape, the layers were aligned by eye and placed back in the 72 °C oven for 1 h, forming a covalent chemical bond at the interface. After bonding, additional inlets and outlets were punched through the two-layer device, providing access to the channels and chambers on the bottom surface of the composite device. The device was then bonded media chamber side down to a microscope slide by activating the device and slide surfaces with oxygen plasma treatment (100 W, 30 s) (Gasonics, Calgary, AB). Finally, the finished device was hard-baked in a 150 °C oven overnight to improve bonding at the PDMS–glass interface.
Device fabrication. All black scale bars are 5 mm. (
Oxygen Gradient Measurements
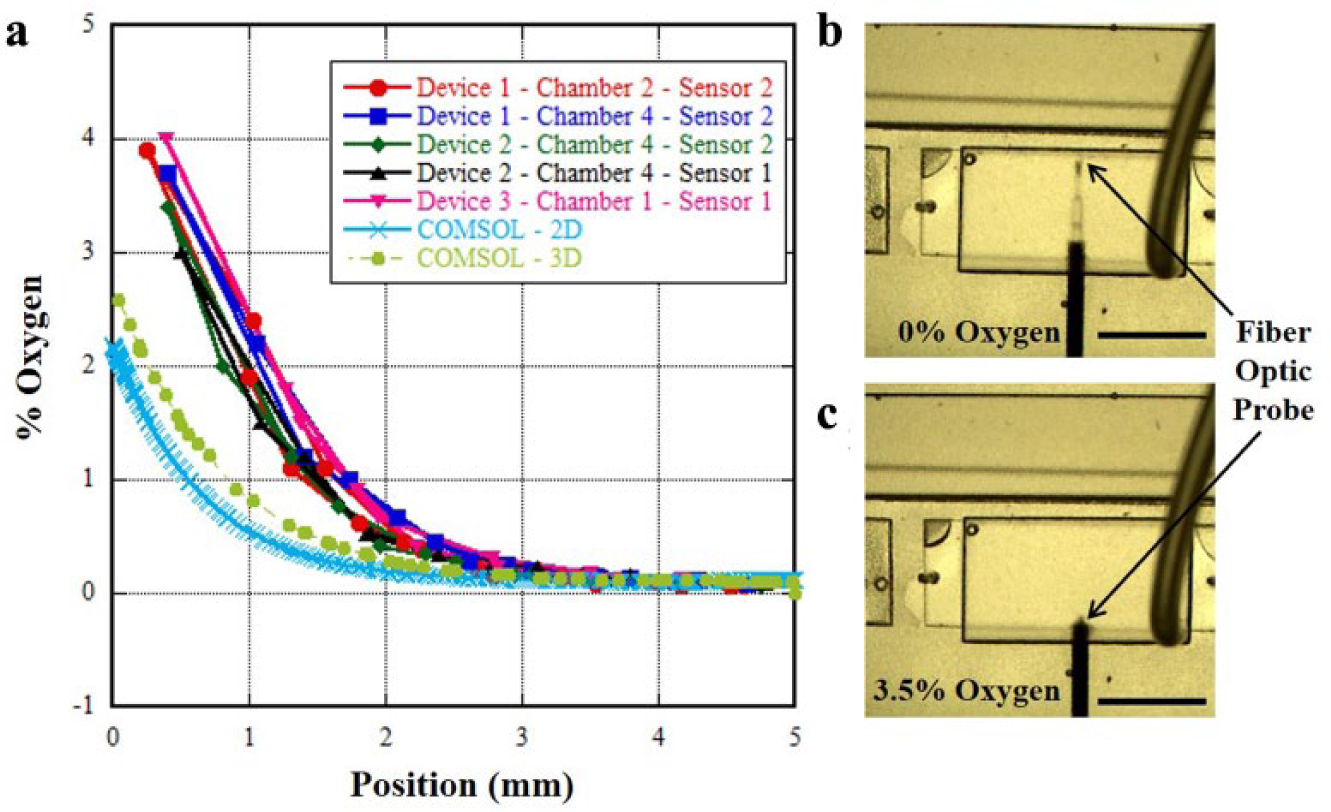
Completed devices were first checked for leaks by filling all fluidic chambers with water and running N2 through all gas channels above each of the four media chambers using Tygon tubing at a pressure of 2 psig ( Fig. 2c ). Initial oxygen calibration was carried out by inserting PM-PSt8 fiber-optic oxygen profiling sensors (PreSens, Regensburg, Germany) into the side ports of the device and equilibrating the sensors at the far end of the media chambers ( Fig. 3b,c ) for 30 min to obtain stable steady-state gradient measurements. The aluminum syringe housing for the oxygen probe served as a gastight cladding, preventing measurement bias from gas diffusion through the sensor inlet holes. The device was subsequently imaged under a stereomicroscope (Nikon SMZ1500, Melville, NY), with oxygen measurements (percent partial pressure oxygen) recorded as a function of probe position in the media channel.
Oxygen gradient characterization. All black scale bars are 5 mm. (
Mucus Preparation
Pig intestines were acquired from a local abattoir (Research 87, Boylston, MA), and porcine intestinal mucus was collected from pig jejunum within 2 h of slaughter via gently scraping with a spatula. Aliquots of 500 µL of mucus in 2 mL Eppendorf tubes were stored at −80 °C until experimentation. Immediately before experiments, native mucus vials were thawed for 30 min at room temperature before being pipetted with a large-volume pipet (P1000 Pipetman) to minimize shear and maintain sample integrity. The mucus was not sterilized to maintain its physical properties, leaving some cells from the host present in the mucus that were spread out through pipetting up and down several times before experiments.
Mucus Particle Tracking Experiments
Fluorescent nanoparticle solutions were prepared using carboxylate-modified yellow-green 200 nm FluoSpheres (Invitrogen, Carlsbad, CA). The microsphere surfaces were functionalized with polyethylene glycol (PEG) using di-amine PEG (MW = 2000 Da, Nektar Therapeutics, San Carlos, CA) following manufacturer protocols and dialyzing in water overnight. The derivatized nanoparticle solutions were then diluted in Hank’s Balanced Salt Solution (HBSS) to yield a final concentration of 0.0025% w/v. All particle tracking experiments were performed in native mucus. To create the final nanoparticle suspension, 25 µL of the nanoparticle solution was added to 500 µL of native mucus, followed by gentle pipetting with the P1000 to mix. Two hundred microliters of the nanoparticle mucus mixture was then pipetted slowly into the media chambers of the test devices to minimize shear, followed by a 30 min incubation at room temperature to allow particle diffusion through the mucus gels and O2 gradient stabilization while N2 was actively flowed through the gas channels. Ten-second fluorescent videos (0.33 s/frame) were taken with a green fluorescent protein (GFP) filter on a Nikon Ti-E fluorescence confocal microscope to record fluorescent nanoparticle Brownian motion at 40× magnification (CFI Super Plan Fluor ELWD 40×c objective). Multiple measurements were taken at both high and low oxygen extremes at each edge of the sample chambers in the device.
Particle Tracking Analysis
Particle tracking was performed as previously described. 26 Briefly, a 2D particle tracking plug-in was used in ImageJ to identify nanoparticles and produce a data table containing all information of detected trajectories. Measured trajectories were filtered out if they were present below 250 (of 300) frames and if their mean-squared displacement (MSD) or moment scaling spectra (MSS) was <0.03 (to remove immobile particles that may be stuck to the glass) or >1 (to remove unobstructed particles), as suggested by the literature. 27 Effective diffusion coefficients (Deff) were then averaged for each location on each device over 10 s.
Results and Discussion
Device Development
The iterative device development process began in COMSOL, where various device geometries were tested via trial and error to create an oxygen gradient profile comparable to the physiological gradient in the gut as measured by Albenberg et al. 24 Blocking oxygen from the top and one side of the media chamber using nitrogen flowing through the gas channels allows oxygen to penetrate the media chamber through one side wall of the oxygen-permeable PDMS. To reduce computational complexity, a 2D model was first used to investigate the sensitivity of the O2 gradient to physical parameters. It was found that the shape and intensity of the O2 gradient were largely dependent on the top N2 channel overhang (dR) over the media channel and the PDMS spacing between the bottom and top channels (dT) ( Fig. 1a ). A parametric sweep was conducted over these two geometric variables, and the resulting concentration profile was quantified by calculating the maximum percent O2 along the channel and the O2 penetration depth, defined as the point where the concentration is reduced to 0.01% partial pressure O2. A contour plot of this sweep is shown in Figure 1b . Using this modeling result as a guide, the device was designed with a steep oxygen concentration profile along the width of the channel and a range of 0%–2% O2, or roughly 0–15 mm Hg of oxygen, at dR = 1000 μm and dT = 500 μm. The 2D simulated O2 profile along the channel width is shown in Figure 1c . The conservative maximum of 2% O2 was selected as a starting point, as we expected nonlinearity, 3D effects, and fabrication challenges to cause a potential increase in the measured gradient.
While developing our device to create a defined oxygen gradient profile, a systems analysis was also performed to ensure that the technology could be usable by microbiology labs without advanced engineering expertise and pumps. PDMS and glass were selected as low-cost materials that can be directly autoclaved for sterilization before use. Device dimensions were optimized to fit within the advanced CNC capabilities of the contract manufacturer Protolabs for aluminum molds, thus obviating the need for traditional microfluidic photolithography manufacturing, which must be done in a clean room. Bonding the two PDMS layers together was done chemically through baking, and while oxygen plasma was used to bond the PDMS device to glass, other methods, such as thermal bonding PDMS to an epoxy glass slide on a hot plate, have also been reported to be successful. 28 Low-cost consumables, such as Tygon tubing, stainless steel connector pins (New England Smalltube, Litchfield, NH), and a gas splitter and regulator (McMaster-Carr, Elmhurst, IL), can be hooked up to a standard N2 tank for device operation.
Oxygen Gradient Characterization
The results of the oxygen probe measurements through water are shown in Figure 3 . As the fiber-optic oxygen probe gets closer to the gas channels on the far side (proximal to the coplanar nitrogen channel), the oxygen concentration drops to <0.1% ( Fig. 3b ). Once the oxygen probe retracts to 2 mm away from the far edge, the oxygen concentration begins to rapidly increase. The experimental and simulated oxygen partial pressure curves are in reasonable agreement with each other with respect to oxygen partial pressure values (similar in shape and penetration depth, and differing by a factor of 2–3 in maximum measured oxygen concentration), as well as the curve profile. The experimentally generated oxygen gradient profiles exhibited good repeatability (≤7.9% standard deviation) across multiple devices, positions of fluidic chambers in devices, and fiber-optic sensors ( Fig. 3a ). A 3D COMSOL model was also developed to determine if variations in the media chamber height around the nominal design dimension of 1 mm had a significant impact on the oxygenation profile. The results of the 3D model ( Fig. 3a ) show that 3D effects contribute to the oxygen profile, with elevated maximum percent oxygen levels that are a better fit than the experimental values (variance of mean experimental data from model: 2D, 1.299; 3D, 0.792). The observed deviations between the oxygen gradients generated in the experimental platform and simulations are not entirely unexpected, as oxygen (and gas) diffusivity through PDMS rubber is sensitive to many small factors, such as interlayer alignment of channels and absolute channel dimensions of molded parts. Additionally, the oxygen solubility in PDMS used as a modeling parameter is only an approximate value, as it is influenced at the experimental level by several factors, including cure temperature and time of cure, as well as absolute crosslinking catalyst concentrations between manufactured lots of PDMS. Overall, the COMSOL models enabled us to prototype devices with oxygen gradients that are very similar to those observed in the colon, 24 with epithelial lining concentrations up to 5%.
Mucus Particle Tracking Studies
Observations of the outer mucus layer (luminal side) in the colon have shown that it is more diffuse, with a lower effective viscosity than the mucus closer to the mammalian epithelial cells lining the colon. The physiochemical explanation for this effect is not completely understood. Existing theories include that the luminal bacteria directly degrade the outer mucus, the outer mucus is less compacted, and the low oxygen in the lumen causes breakage of the mucins’ disulfide bonds, which gives the layer its viscous structure. We addressed the latter hypothesis to determine whether oxygen concentration alone can reduce mucus viscosity, thus increasing the effective diffusive coefficient of nanoparticles in the mucus matrix. Porcine intestinal mucus containing PEG-modified fluorescent nanoparticles was injected into pretested oxygen chambers of devices, and images were taken at low-oxygen (0%) and high-oxygen (3.5%) partial pressures, with results shown in Figure 4 . While the benefit of a gradient could enable us to explore rheology along the changing oxygen concentration, we wanted only to identify whether a measurable difference between rheology at the two extremes could be measured as a proof-of-concept test.
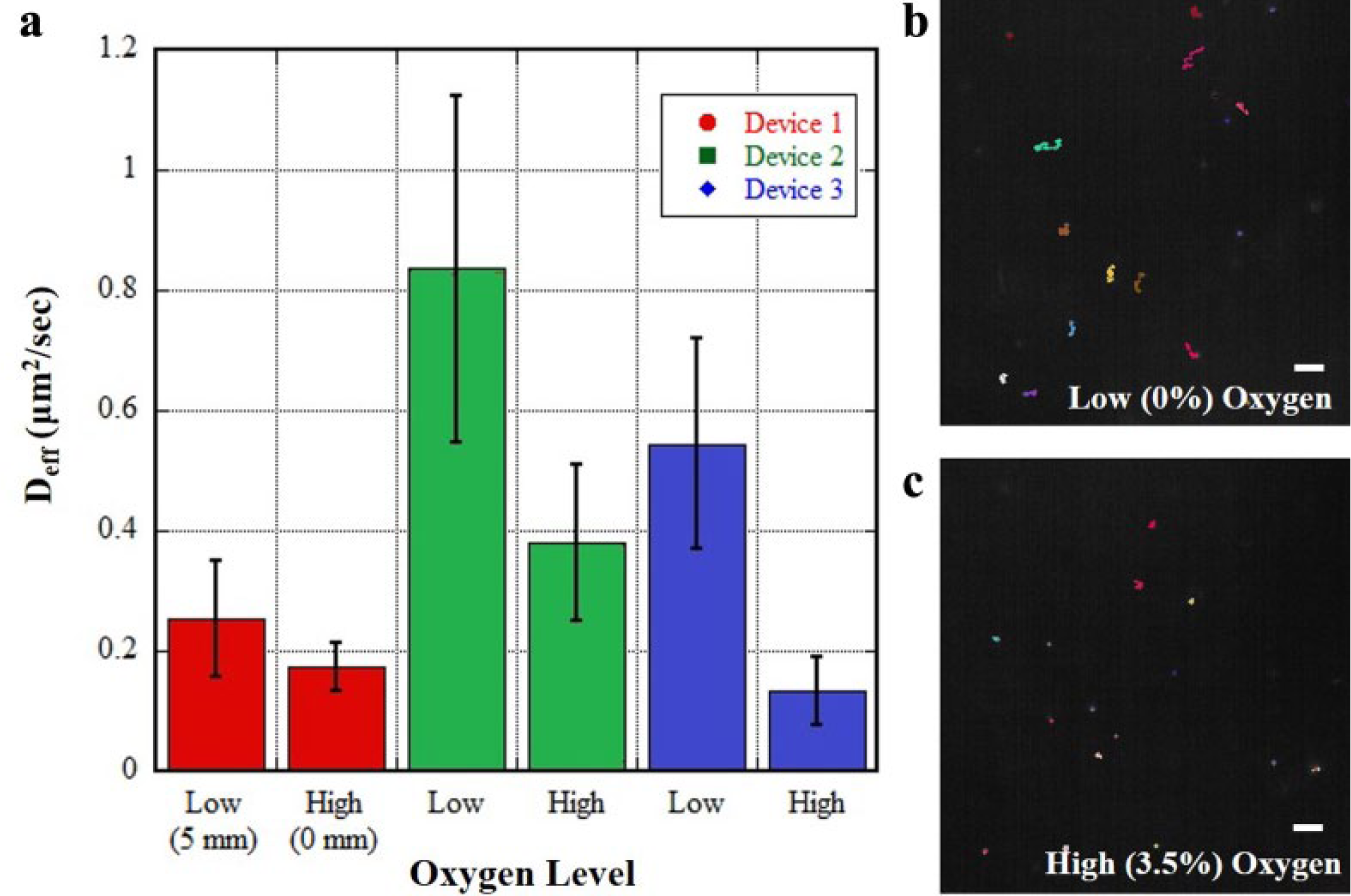
Proof-of-concept characterization of mucus barrier changes under an oxygen gradient. All white scale bars are 10 µm. (
From the three devices tested, a significant difference in viscosity between oxygen concentrations was seen in two of them ( Fig. 4a ). The data suggest that relative oxygen concentration affects the rheology of native mucus, while other factors may certainly contribute to total rheology differences seen in vivo. From visual inspection, the trajectories of the PEG-coated nanoparticles in the low and high oxygen concentrations ( Fig. 4b,c ) show the higher oxygen condition is more limiting to the Brownian motion of the nanoparticles. Additionally, the PEG coating on the nanoparticles enables the nanoparticles to move freely throughout the mucus microenvironment, minimizing interactions (e.g., electrostatic) with the mucus matrix. Our measured diffusion coefficients were comparable to those in a similar study of effective diffusion coefficients of particulates within native mucus. 29 Variation in diffusivity across individual samples, well within an order of magnitude, is not surprising given the heterogeneous nature of the unpurified porcine mucus used in the experiments.
An additional benefit of our device is its ability to examine small samples (200 µL) of mucus. While native mucus is very heterogeneous and multiple devices need to be tested for ensemble averaging, smaller sample volumes enable multiplexed testing. Mucus rheology studies can be expanded to also study bacterial growth in the mucosal niche, as well as compare it to bacteria growth in other matrices (e.g., commercially processed mucin, purified native mucin, 30 and agar). Particle tracking experiments using native mucus can be challenging due to the inherent proteolytic activity of bacteria and active enzymes trapped in the collected mucus. This device enables a rapid development of a stable oxygen gradient in thawed mucus within 30 min, enabling researchers to take quick measurements with minimal structural loss of mucus from its environment.
Conclusions
This technology brief discusses an innovation in developing high-resolution oxygen gradients to be utilized by researchers for developing anaerobic–aerobic coculture systems to study gut physiology and pathophysiology. The device described herein can be built without traditional microfluidic clean room technology, making the technology more accessible to researchers in microbiology laboratories without the need for advanced engineering expertise and equipment. The versatility of this device enables a wide variety of geometries to be studied under a defined oxygen gradient. While we designed this platform to emulate the oxygen levels in the colon, the flexibility of this system enables the oxygen gradient to be tailored to custom applications by changing the dT and dR lengths to create an oxygen gradient of the user’s choosing. In a proof-of-concept experiment in which mucus was loaded in the device, we demonstrated how our device, with the capability to generate an oxygen gradient of the same magnitude and on the same length scale as that observed at the inner colon wall, can be used as a tool to study colonic mucus physiology.
Footnotes
Supplementary material is available online with this article.
Declaration of Conflicting Interests
The authors declared no potential conflicts of interest with respect to the research, authorship, and/or publication of this article.
Funding
The authors disclosed receipt of the following financial support for the research, authorship, and/or publication of this article: This material is based on work supported by the Assistant Secretary of Defense for Research and Engineering under Air Force Contract No. FA8721-05-C-0002 and/or FA8702-15-D-0001. Any opinions, findings, conclusions, and recommendations expressed in this material are those of the authors and do not necessarily reflect the views of the Assistant Secretary of Defense for Research and Engineering.
References
Supplementary Material
Please find the following supplemental material available below.
For Open Access articles published under a Creative Commons License, all supplemental material carries the same license as the article it is associated with.
For non-Open Access articles published, all supplemental material carries a non-exclusive license, and permission requests for re-use of supplemental material or any part of supplemental material shall be sent directly to the copyright owner as specified in the copyright notice associated with the article.