
Abstract
Point-of-care (POC) testing has revolutionized diagnostic healthcare, bringing medical results directly and immediately to the patient. With faster diagnostics, more immediate clinical management decisions can be made. POC tests most often use a dipstick or swab format to detect the presence of a pathogen, disease, or other relevant biomarker. In these formats, the POC tests eliminate the need for complex lab equipment and trained personnel to collect, process, and analyze sample data for simple diagnostics. However, these tests cannot satisfy all clinical needs, because accurate quantitative results are needed. The present study serves as a template for designing a nonfaradaic electrochemical biosensor toward quantitative POC diagnostics. We focus on investigating the most important parameters when constructing a nonfaradaic biosensor through both mathematical modeling and electrochemical measurements. Furthermore, we demonstrate quantitative affinity biosensing of a model protein toward developing a POC device.
Introduction
To date, commercially available solutions for point-of-care (POC) diagnostics are primarily driven by the detection of biomarkers using a combination of lateral-flow assays and colorimetric tests. 1 Typically, this is achieved with reporting of the presence or absence of a target biomarker through a color change. In many cases, these dipsticks and lateral-flow assays offer only qualitative or (at best) semiquantitative results.1,2 Recently, medical diagnostics has undergone a change toward rapid, quantitative biomarker detection, enabling POC-based biosensing.
The key challenge in developing a POC test lies in defining the design parameters of the biosensor toward enabling sensor performance suitable for quantifying the biomarker of interest. Affinity biosensors function on the principle whereby an immobilized receptor binds a target biomolecule, producing a measurable chemical change at a localized surface. 3 This binding event is then transduced to a quantifiable output. For electrochemical biosensors, the measured signal is transduced into either a current or voltage output, which is then amplified and processed using peripheral electronics. The transduction method often influences the biosensor design to enhance performance. 3 This is especially true in the case of electrochemical signal transduction, where the geometry should promote both stability and sensitivity for the biosensor. Electrode shape and spacing dictate the distribution of electric charge throughout the electrolyte and at the electrode surface, so a comprehensive understanding of the electrochemical response is vital before selecting the biosensor geometry. 4
POC electrochemical biosensors often employ a coplanar, two-electrode design consisting of a working electrode (WE) and a reference electrode (RE) deposited onto a planar substrate. In a two-electrode biosensor, the cell potential is measured at the WE against a set RE potential. Coplanar electrodes can be fabricated using an array of established manufacturing techniques. 5 This simple design can be easily integrated with electronics to perform rapid measurements for a POC system. However, two-electrode biosensors often suffer when sensing in complex biofluids like saliva, sweat, and urine. 6 These biofluids can carry redox active species, resulting in faradaic charge transfer at the RE altering its potential. To account for nonspecific faradaic charge transfer, a three-electrode biosensor is often used for independent measurements of the half-cell potential between the WE and RE. Here, a counterelectrode (CE) acts as a current source or sink for the faradaic reactions. Introducing the CE encourages a stable RE potential to accurately monitor the WE-RE half-cell for nonfaradaic measurements even when faradaic charge transfer occurs within the system. In this article, we identify which parameters are most significant when designing a coplanar, three-electrode affinity biosensor.
Affinity biosensors achieve high selectivity and sensitivity through the immobilization of biological recognition elements on the sensor substrate, usually at the WE. The number of available binding sites for the target biomolecule is directly dependent on the surface density of the recognition element and the surface area of the WE. Enhancing the number of binding sites increases the likelihood of a target biomolecule binding at the WE, resulting in a lower detection limit and wider dynamic range. Methods for immobilizing recognition elements at the WE include physisorption, cross-linking, covalent bonding, entrapment, and encapsulation. The efficiency of immobilization is heavily dictated by the substrate material. In this article, we utilize gold electrodes to create an amine reactive self-assembled monolayer (SAM) of dithiobis succinimidyl propionate (DSP). The thiol end of the DSP readily chemisorbs to gold surfaces, resulting in the amine reactive N-hydroxysuccinimide (NHS) esters orthogonal to the electrode surface.7,8 The NHS esters are then reacted with a biological recognition to encode selectivity. Various gold-electrochemical biosensors have utilized DSP to cross-link a recognition element to the electrode surface, and detection of bioanalytes leveraging this thiolated cross-linker has been demonstrated in the literature, as summarized in Table 1 .
Comparison of Gold-Electrochemical Biosensors Utilizing DSP Cross-Linker.
Gold is often selected as the WE material, not just to leverage the gold thiol interaction, but also because gold is highly conductive, physically robust, and otherwise chemically inert. 8 Gold possesses an extensive double-layer region that is free of faradaic behavior in most pure electrolytes, making it a highly resistant metal to dissolution and corrosion. 9 Furthermore, gold electrodes can be fabricated using a variety of either thin-film or thick-film techniques. Thin-film deposition of gold, for example, physical vapor deposition, is often employed for planar substrates and applications reaching for disposable or reusable biosensors, while thick-film deposition of gold, for example, screen printing, is being explored for continuous-monitoring fabric-based or wearable sensors.
Previous research has demonstrated the impact of modifying electrode size and positioning for three-electrode systems. Hsieh et al. established the effect of RE geometry and position on the accuracy of impedance measurements. 10 They discussed the need to place the RE on a surface such that the electrode does not significantly perturb the primary currents within the system. Cimenti et al. identify distortions in impedance due to misalignment and relative sizes of the WE and CE in fuel cells. 4 By controlling the current distribution in the electrolyte, they ensure that the RE effectively separates the overpotential of the WE from the potential drop of the cell. However, little work has been conducted on assessing coplanar electrode geometries. In this article, we evaluate the CE positioning with respect to a fixed WE and RE for a biosensor analogue with coplanar electrodes. We investigate how CE positioning impacts the resulting electrochemical response toward the selection of an optimal design for a POC affinity biosensor suitable for incorporation into urine and saliva dipsticks.
This article is a demonstration of optimization of the criteria toward designing an affinity-based electrochemical biosensor suitable for POC applications. We utilize electrochemical impedance spectroscopy (EIS) to quantify surface phenomena on a POC biosensor analogue. EIS is commonly used to decouple the faradaic and nonfaradaic responses, making it a robust nondestructive technique for low-power applications. Affinity binding in the presence of redox active species is detected through changes in faradaic charge transfer across the electrode–electrolyte interface, whereas nonfaradaic EIS leverages changes in interfacial capacitance to determine targeted biomolecule binding events. Whether leveraging faradaic or nonfaradaic charge transfer, the biosensor design should promote a uniform current distribution to prevent distortions in the impedance spectra.4,11,12 Thus, positioning of the CE should be carefully chosen to maintain a stable potential at both the WE and RE throughout the experiment.
In this work, we used COMSOL modeling to investigate both potential distribution and current density responses across various biosensor iterations to downselect the optimal placements of the CE for the coplanar three-electrode biosensor. Following the mathematical modeling, both thermodynamic and kinetic stability were evaluated through open-circuit potential (OCP) and cyclic voltammetry (CV) measurements, respectively. To identify the final CE placement for optimal POC biosensing, we also considered form factor constraints to reduce the sensing region, and thus the necessary volume of fluid to saturate the sensor. We then established surface functionalization techniques with the self-assembly of a DSP monolayer onto gold, planar electrodes. We probed selective functionalization of just the WE, as well as functionalization of all three electrodes. Then we utilized the DSP monolayer to capture the model protein bovine serum albumin (BSA). The binding of BSA to the DSP monolayer was detected through impedance changes using EIS, and a dose-dependent impedance curve was constructed. This article demonstrates the utilization of the BSA analogue to deconstruct the role of each of the components (electrode, cross-linker, and biomolecule) of the affinity biosensor.
Materials and Methods
Chemicals and Reagents
All chemicals were of analytical grade and used without further purification. Conductive silver epoxy was purchased from Electron Microscopy Sciences (Hatfield, PA). Potassium hexacyanoferrate(III) (ferricyanide), DSP, BSA, DMSO, phosphate-buffered saline (PBS), acetone, and 70% v/v isopropanol were all purchased from Fisher Scientific (Pittsburgh, PA).
Sensor Design
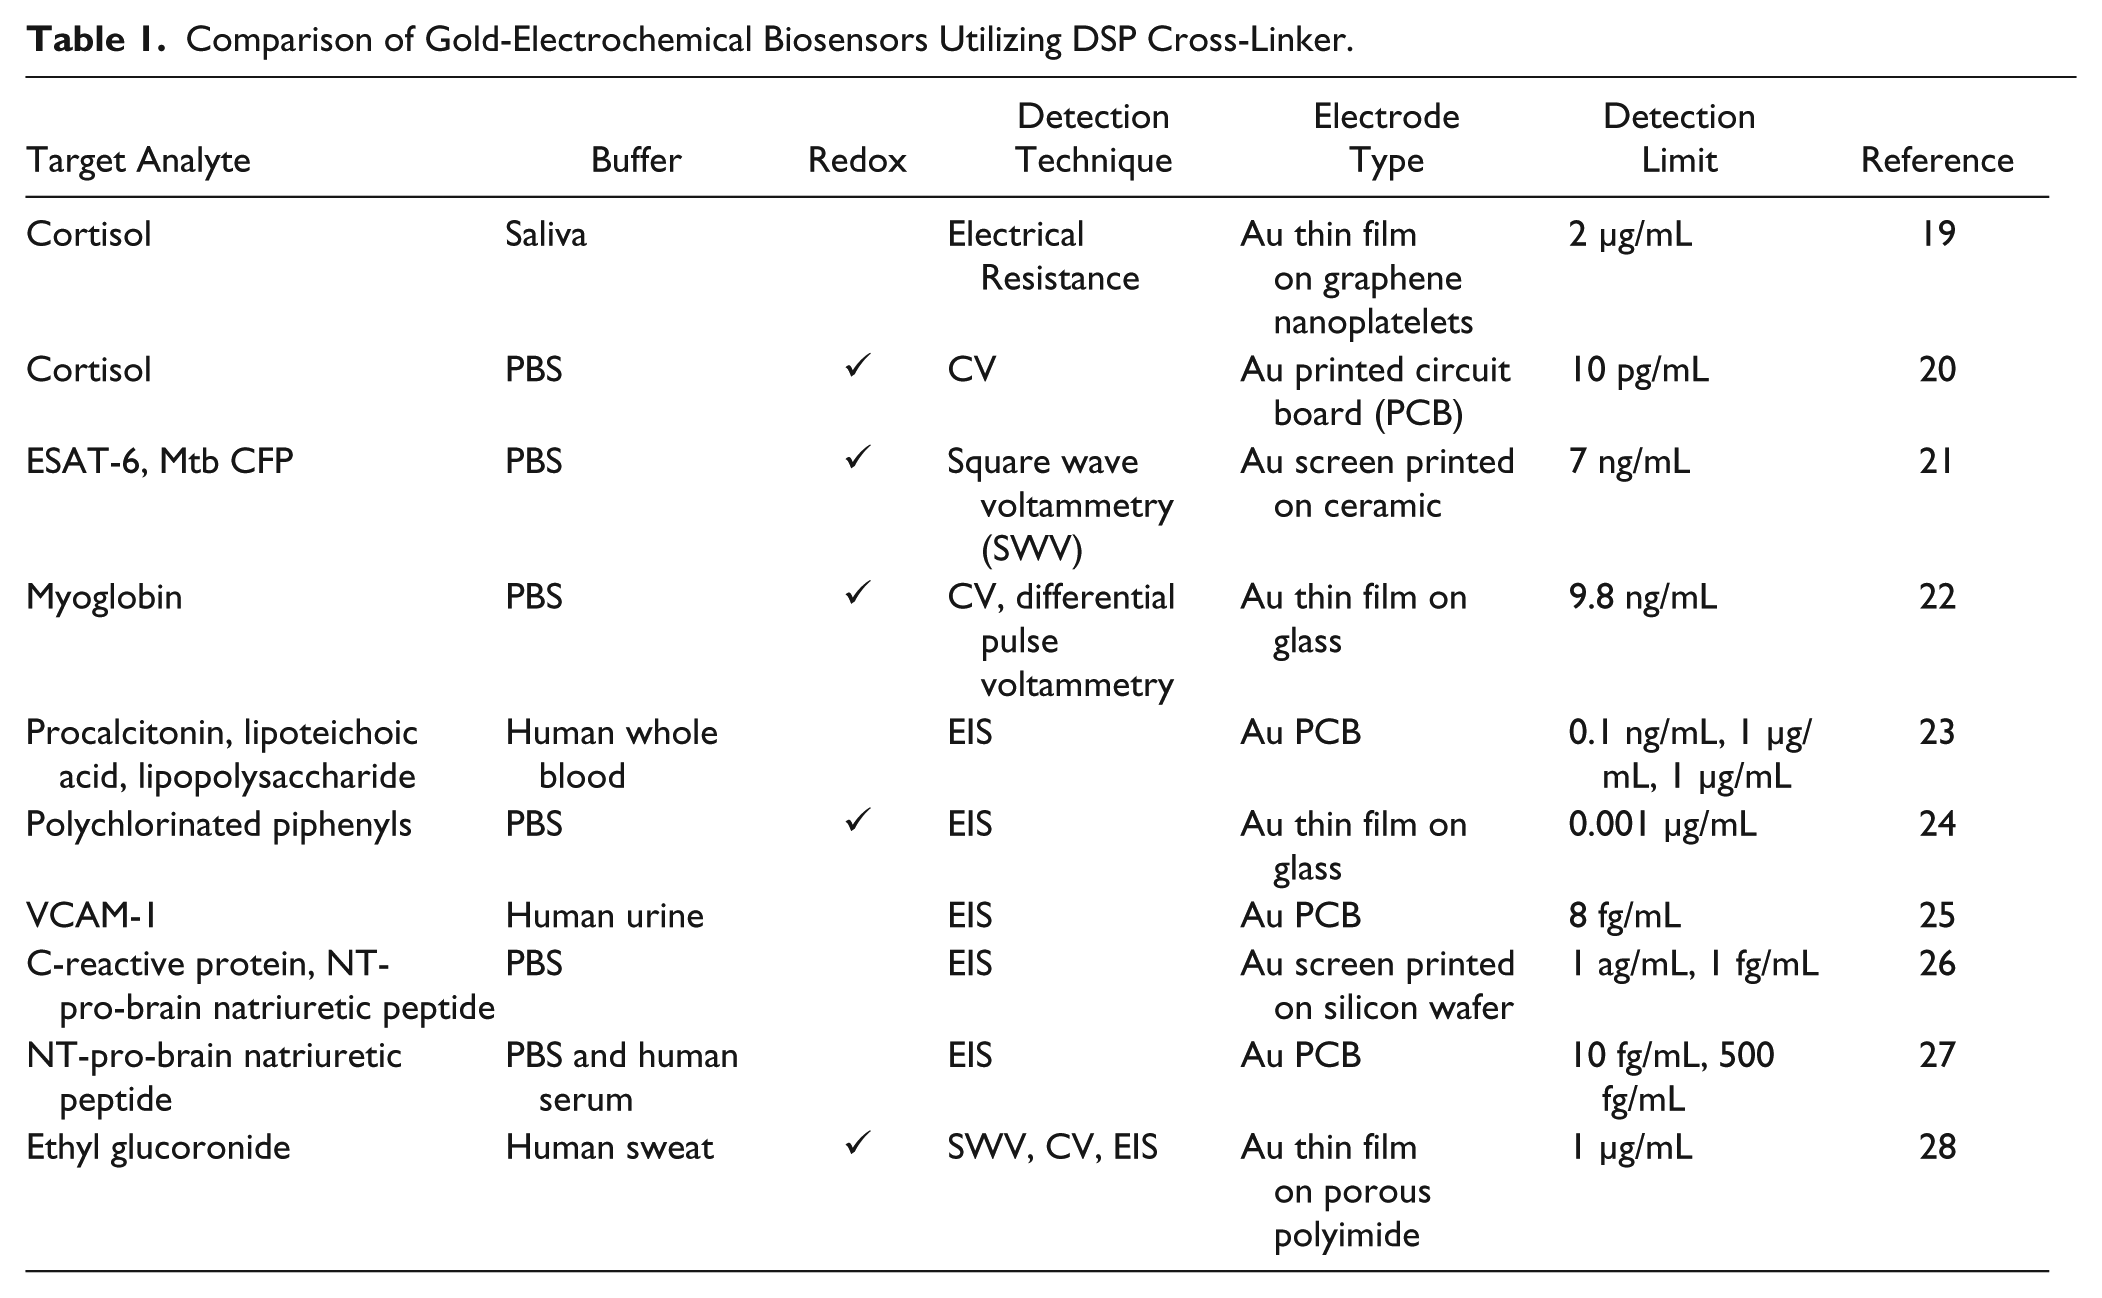
The sensor platform consisted of three coplanar electrodes: a WE, RE, and CE all deposited onto a glass substrate. The CE positioning was varied with respect to a fixed WE and RE at three distinct distances and three distinct angles, for a total of nine iterations, as shown in Figure 1A–C .
Schematic showing each iteration with the CE offset at (
The absolute distances from WE to CE were varied by a fixed amount across the three angles and were numbered from closest CE1 to farthest CE3. Furthermore, the CE positioning angles varied at 135°, 180°, and 225° and were denoted CEX.135, CEX.180, and CEX.225, respectively, where X represents the absolute distance from WE to CE. Across these iterations, the stability and sensitivity of the sensor were evaluated through numerical modeling and electrochemical baseline measurements.
COMSOL Multiphysics
Finite element analysis was performed using COMSOL Multiphysics software to construct a model. The model provided preliminary data from simulations to evaluate sensor performance across every CE placement iteration. These data were used to aid in the downselection of the optimal sensor iteration. The simulation was conducted using the primary current distribution module to visualize both the electrolyte potential and the current distributions within the electrolyte.
To construct the geometric model, the biosensor was reduced to a two-dimensional (2D) cross section at the domains of interest: the three electrodes and the surrounding electrolyte. Electrical properties of gold were assigned to each of the three electrodes, while the conductivity of PBS (1.8 * 10−3 S/m) was assigned to the electrolyte domain. To visualize the physics of interest, a 10 mV potential was applied to the WE to model the input during EIS experiments. Furthermore, the CE was grounded to act as the current carrying electrode. Electrical insulation was assigned to the RE via a von Neumann boundary condition (n. J = 0) to mimic the high-impedance input given by the potentiostat. The electrolyte boundaries were also assigned a von Neumann boundary to confine the electric field within the bounds of the constructed geometric model.
Fabrication and Assembly
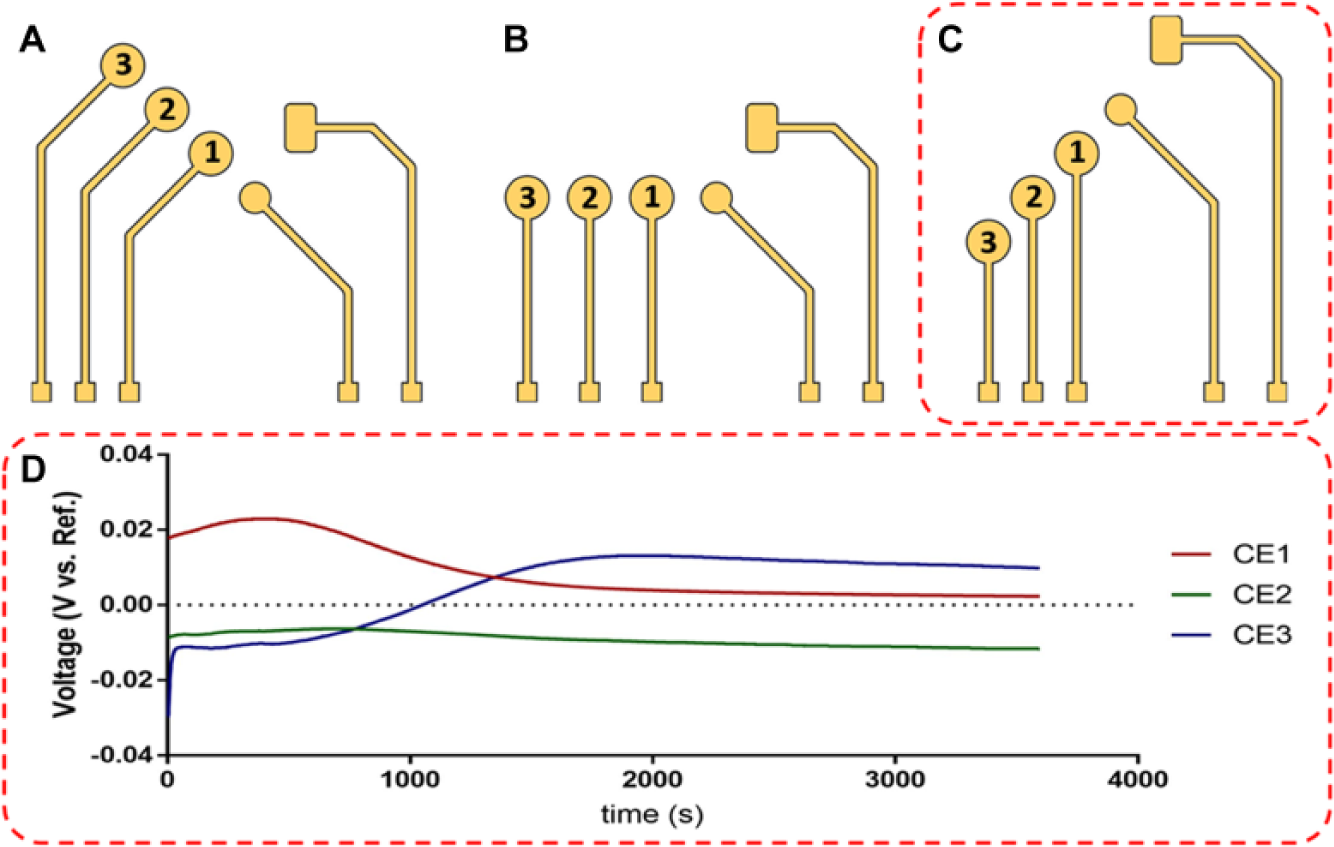
The sensors were fabricated on microscopic glass slides using the e-beam deposition technique. To remove any oils and organic residues, the substrates were rinsed with 70% v/v acetone, followed by 70% v/v isopropanol, and finally deionized water. The glass substrates were then dried with pressurized nitrogen air and stored in a nitrogen desiccator until deposition.
The sensor pattern was achieved using a shadow mask cut using a Spectra-Physics Spirit Laser. The masks were placed flush against the glass substrate, exposing only desired sites for electrode deposition. The electrodes were deposited using electron beam physical vapor deposition at a pressure of 5 * 10−6 torr. The electrode patterns were deposited with 25 nm Cr and 125 nm Au onto the precleaned glass substrate. Figure 2 shows a photograph of the CE1.225 iteration postfabrication with a dime for scale.
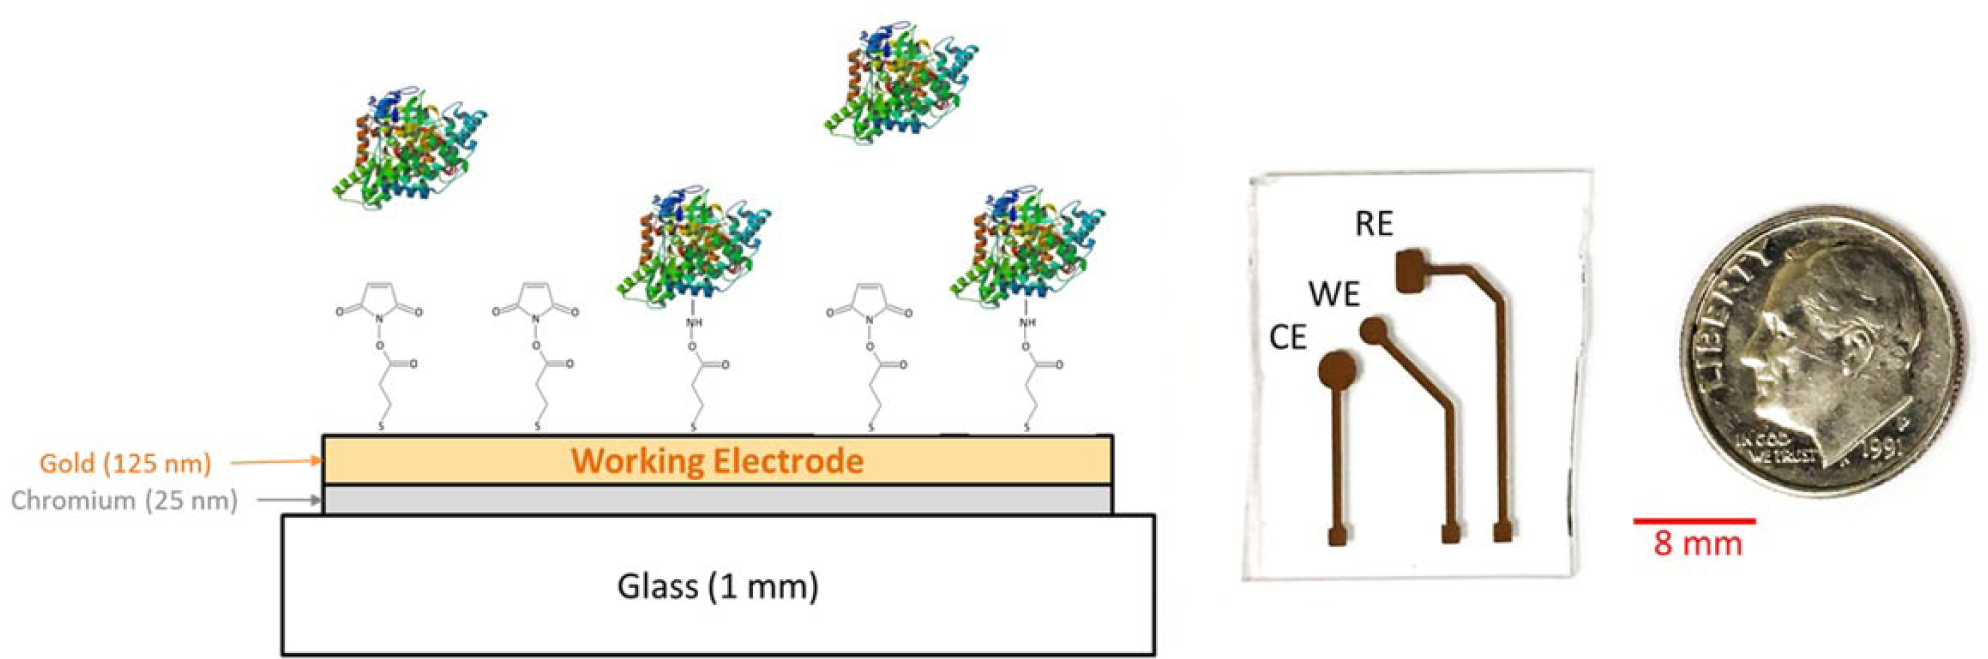
Cartoon schematic of the affinity biosensor. A 25 nm chromium adhesion layer was deposited onto the glass substrate, followed by 125 nm of gold. DSP was used to functionalize the WE surface to capture the BSA proteins diluted in 1× PBS. Insert: Photograph depicting the fabricated CE1.225 sensor iteration with a dime for size comparison.
A polydimethylsiloxane (PDMS) confinement was prepared to restrict the sample fluid in a controlled volume around the site of the three electrodes. The PDMS dimensions were adjusted allowing a 2 mm tolerance beyond the outermost electrode per each design. Furthermore, a thin, uniform passivation layer of silicone glue was applied to the electrode leads, inhibiting their interface with the electrolyte. This passivation reduces data variability attributed to uncontrolled surface area changes in the electrode–electrolyte interface. Wires were epoxied to the sensor leads using a conductive silver epoxy (volume resistivity <0.001 Ω-cm) and then interfaced with the potentiostat.
Experimental Design
The redox probe, ferricyanide, aided in the study of sensor stability in the presence of faradaic charge transfer. Ferricyanide (10 mg) was diluted into 304 μL of PBS, and then a series of 10-fold serial dilutions were performed to achieve a final concentration of 1 mM. The sample volume was held constant at 200 μL across all sensor iterations. Electrochemical studies were performed in both the presence and absence of the ferricyanide molecule to study faradaic and nonfaradaic charge transfer.
In order to evaluate the sensor’s performance as an affinity biosensor, a SAM DSP was used to functionalize the electrode surface. The DSP was dissolved in DMSO at a concentration of 10 mM and incubated on the electrodes for 1 h. The disulfide bond within the DSP molecule readily chemisorbs onto gold surfaces through a gold–thiol interaction. Through this interaction, the molecule reorients itself such that the NHS esters on either end of the DSP molecule are positioned away from the gold surface. NHS esters are highly amine reactive, and are commonly used in protein cross-linking studies. 13 Here, the NHS esters are utilized as a surface modification to determine binding events of proteins at the electrode surface. Figure 2 demonstrates the affinity assay used to functionalize the electrode toward protein detection.
A model protein, BSA is used to determine the nonfaradaic response of the biosensor analogue. The BSA is diluted in PBS, a commonly used isotonic buffer. PBS is devoid of any redox active species; thus, detection is achieved through measuring interfacial capacitive changes due to binding. While PBS is often used in vitro to mimic in vivo conditions, it does not capture the complexity of biofluids commonly utilized in affinity biosensing. Saliva, sweat, serum, and urine are often targeted fluids in biosensing because the collection of these fluids is fast and noninvasive. The composition of these biofluids ranges in iconicity, protein composition, and pH, impacting biosensing. Because of the wide variability in composition, the faradaic response varies from sample to sample. However, using EIS, the faradaic response can be decoupled from the nonfaradaic response. At select frequencies, the system’s capacitance dominates over the resistive effects, which indicate nonfaradaic processes. 14 Within this article, we leveraged the nonfaradaic response looking at capacitive effects due to BSA binding at the electrode surface.
In this study, a comparison of selective functionalization of the WE and nonselective functionalization of all the electrodes was performed. Selective functionalization was achieved by pipetting 4 μL of 10 mM DSP directly onto the WE surface, whereas nonselective functionalization was achieved by pipetting 200 μL of 10 mM DSP to completely cover the sensing region.
Electrochemical Measurements
Electrochemical experiments were carried out using a Gamry Reference 600 potentiostat. OCP, CV, and EIS were employed to study biosensor performance across the nine sensor iterations (see supplementary data) and aid in the downselection of the optimal CE placement. EIS was also used as a measurement technique to quantify the dose-dependent response from BSA binding events for the CE1.225 iteration.
Open-Circuit Potential
The OCP is a thermodynamic parameter that indicates the tendency of the WE to participate in an electrochemical corrosion reaction with the surrounding medium. To measure the OCP, the potential of the WE is measured against the RE using a high-impedance voltmeter to ensure that no current flows between the electrodes. The OCP of each biosensor iteration was measured to establish sensor stability, taken in the presence of 1× PBS for 1 h to ensure steady state.
Cyclic Voltammetry
CV is a common potentiodynamic technique used to study redox active species. Cyclic voltammograms were recorded in the presence of 1 mM ferricyanide with a 1× PBS-supporting electrolyte. In CV, the potential between the WE and RE is ramped linearly versus time. Once the potential reaches a set maximum, it is ramped in the reverse direction until a set minimum is reached. In this article, the potential was scanned from 0 V to a 0.2 V maximum, and then a –0.5 V minimum at 25 mV/s. The measurement was repeated for a total of three cycles, once the voltammogram reached steady state. The current response was plotted as a function of applied potential to inform the reversibility of the redox active species at the WE.
Electrochemical Impedance Spectroscopy
EIS was employed to study changes in the complex electrical impedance. A sinusoidal voltage of 10 mV root mean square was applied across a wide frequency range of 1 Hz to 1 MHz. The resulting current response of the system was measured, and the complex impedance was calculated by taking the ratio of input voltage to measured current. EIS was used to study baseline characteristics across sensor iterations in a blank PBS buffer. Nonfaradaic detection of a model protein, BSA, was also carried out using EIS on the downselected iteration CE1.225.
Results and Discussion
COMSOL Results
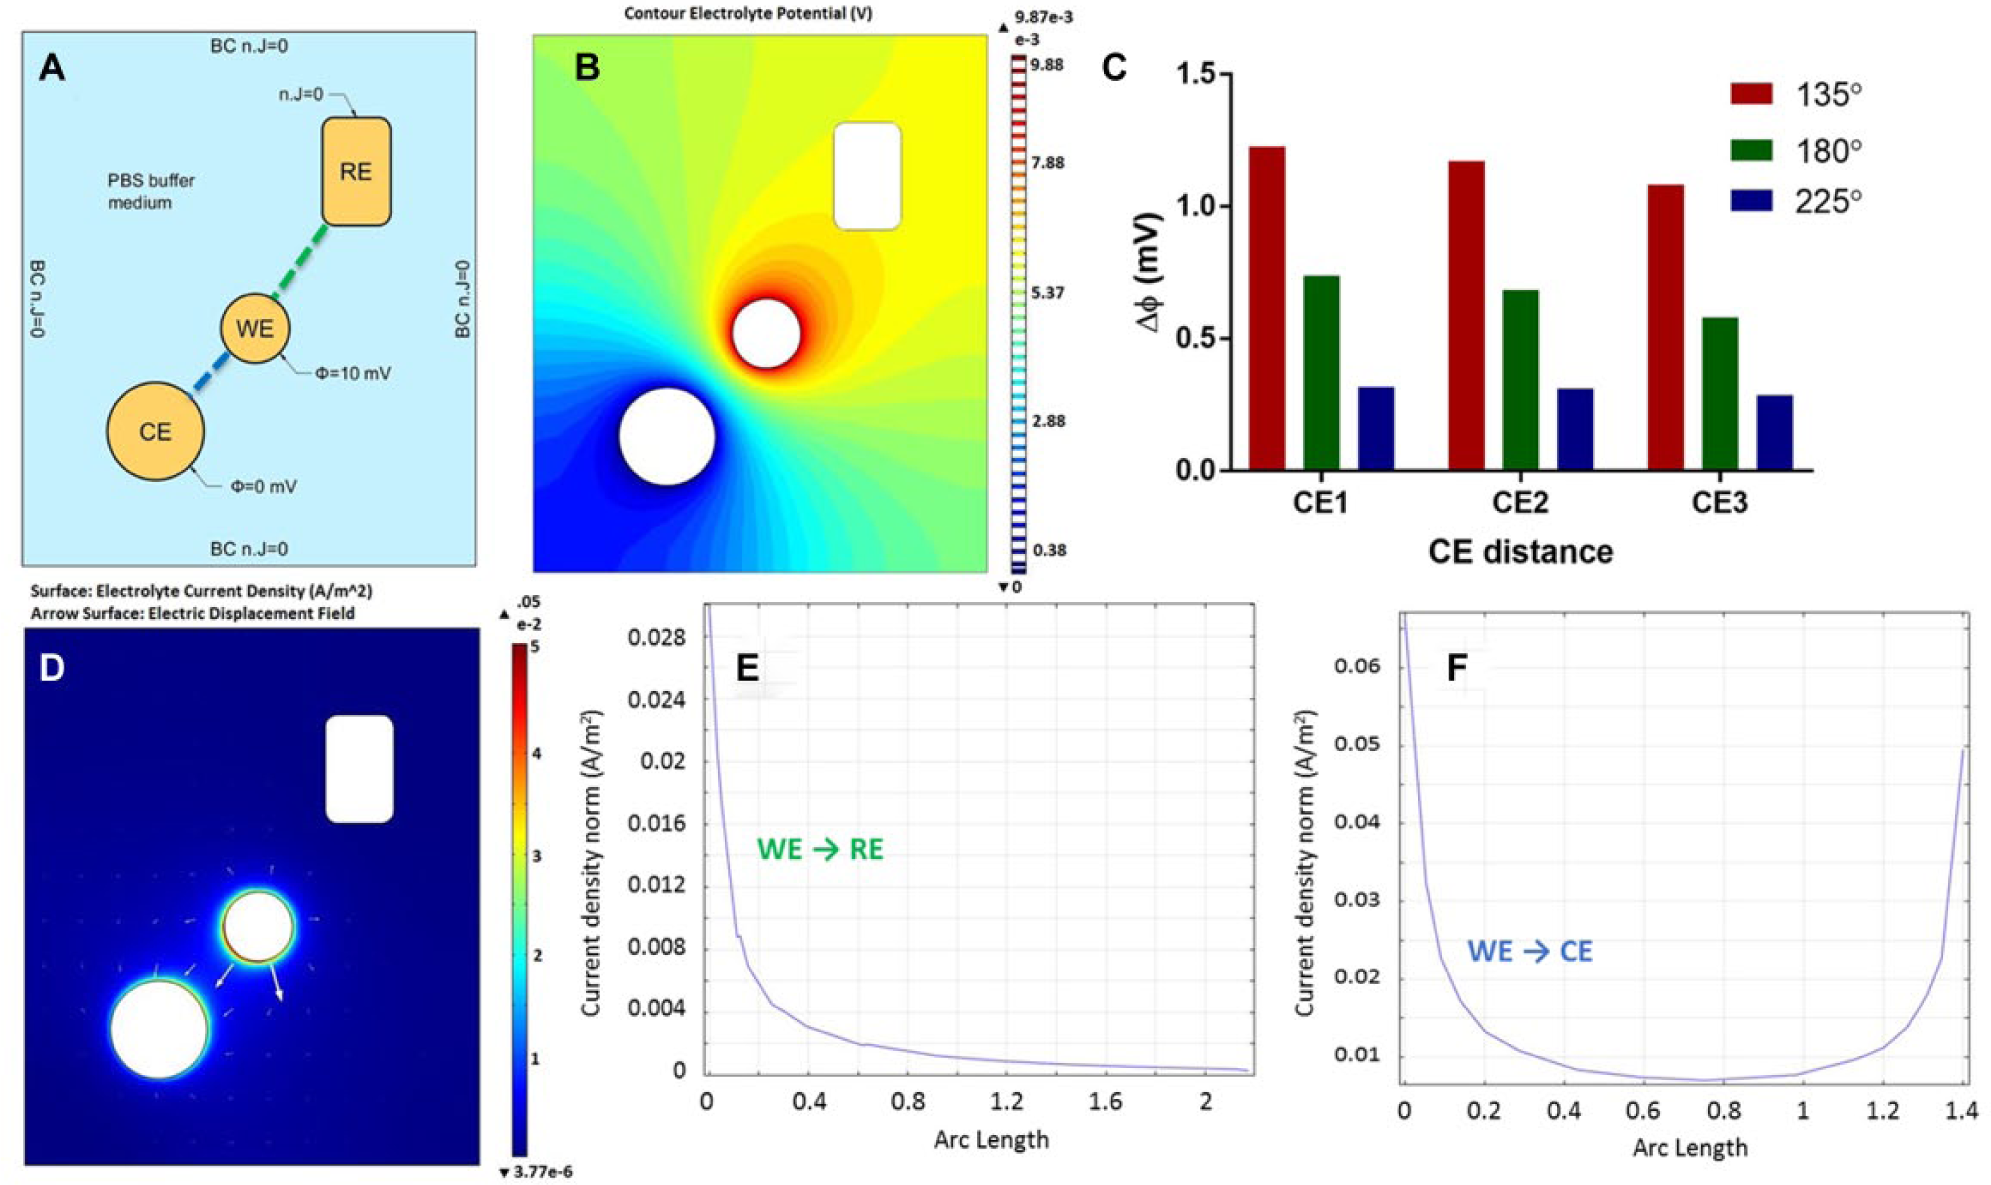
Finite element analysis was performed on each of the nine iterations to downselect the optimal positioning of the CE. For each iteration, both the electrolyte potential and electrolyte current density were analyzed using the primary current distribution module within COMSOL Multiphysics. The electrolyte potential visualizes how the RE surface potential distribution changes when varying the CE positioning, while the current density is used to investigate the variation in charge distribution at the WE. Positioning of the CE should ensure that the applied potential promotes a stable RE potential and uniform current density at the WE.
When modeling primary currents, losses due to solution resistance are considered, while both electrode kinetics and concentration-dependent effects are neglected. Therefore, all charge transfer within the electrolyte is assumed to obey Ohm’s law. This model makes the following assumptions: (1) convection within the electrolyte does not significantly affect current density, (2) the electrolyte is homogeneous, and (3) the potential of the electrolyte–electrode interface does not deviate from its equilibrium value. Based on these assumptions, the following equations govern within the system:


In the above equations, J represents the current density vector (A/m2), which is dependent on σ, the conductivity (S/m), and φ, the electric potential (V). In these equations, the index s denotes the electrode domains, while the l subscript denotes the electrolyte domain. E eq represents the potential difference at the electrode–electrolyte interface. Figure 3A shows a 2D schematic of the geometric model simulated in COMSOL with each domain’s applied boundary conditions.
(
The electrolyte potential is determined through evaluating eq 2 and plotting φl at each point within the electrolyte. A contour plot of the electrolyte potential can be visualized in Figure 3B for the iteration CE1.225. Electrolyte potential plots for the eight remaining iterations can be found in Supplementary Figure S2 . To properly measure half-cell impedance changes between the WE and RE, the RE should lie on a surface with little variation in the electrolyte potential. 12 To find the potential distribution at the RE surface, the minimum RE surface potential was subtracted from the maximum RE surface potential. Figure 3C demonstrates that by offsetting the CE by 225° with respect to the WE, the potential distribution at the RE surface is greatly reduced. This reduction in potential distribution is likely attributed to isolating the distribution of currents from the RE.
The simulated current density within the electrolyte, Jl, is also evaluated using eq 2 and is shown in
Figure 3D
. Current density plots of the remaining eight iterations can be found in
Supplementary Figure S3
. The surface plot indicates the maximal current density that is observed at the WE surface, implying that the output current responses measured in both EIS and CV are from phenomena observed at the WE. The arrow plot in
Figure 3D
indicates the direction of current flow through the electric displacement field. Negligible current flows at the RE, ensuring that it maintains a constant potential throughout the experiment. Line plots in
The COMSOL simulations were used to downselect which sensor iterations placed the RE on an isopotential surface and produced a large, uniform current density at the WE. Placing the RE in an area with a uniform potential distribution reduces error when reporting the half-cell potential.4,11,15 For the CEX.225 iterations, the equipotential surfaces are widely spaced, resulting in a smaller distribution of potentials sampled at the RE. The widely spaced equipotential surfaces also indicate a uniform current density at the RE. The small, uniform current density prevents currents from entering the RE and causing a potential drift.
The current density at the WE shows a uniform distribution for every CEX.225 iteration, ensuring that the electrode polarization is consistent across the entire electrode surface. Furthermore, the maximum current density occurs at the WE surface. The large WE current density indicates that the output current responses measured in EIS are a result of reactions occurring at the WE, and that the measurement of the half-cell potential is between the WE and RE, with little to no interference from the CE. These results suggest that placing the CE at 225° with respect to the WE, when compared with the other investigated iterations, will exhibit the best electrochemical properties during biosensing applications. Placing the CE at this angle demonstrates a uniform current density at the WE and RE surfaces. Furthermore, both the potential distribution and current density observed at the RE are minimum, and the current density at the WE is maximum at 225°. Thus, it is expected that placing the CE at 225° with respect to the WE will reduce distortions in measured impedance spectra.
OCP Results
After ~2000 s, the OCP values reached a steady-state potential for all sensor iterations ( Suppl. Fig. S1 ). Only small variations among the steady-state OCP values existed because the electrodes were neither corroding nor oxidizing throughout the measurement. The corrosion potential of an electrode is dependent on both the metal and the electrolyte. 16 Because both the WE and RE are composed of gold, the corrosion performances of these two electrodes are identical. This results in very small deviations in steady-state values, within 15 mV. The steady-state OCP values were estimated at 2.35 mV for CE1.225, –11.7 mV for CE2.225, and 9.83 mV for CE3.225, as shown in Figure 1D . These measurements signify that the electrodes for each iteration are stable in the presence of the PBS buffer.
CV Results
CV was used to study both sensor stability and faradaic charge transfer kinetics using a ferricyanide redox probe. When the potential is scanned, the ferricyanide molecule participates in a reversible, single-electron redox reaction. The kinetics of this reaction are seen in the cyclic voltammograms in Figure 4 . During the forward scan, oxidation of the ferricyanide resulted in the formation of a cathodic peak current, while the reverse scan reduced the probe, leading to an anodic peak. It can be seen in Figure 4A that the cathodic peak is absent in the first cycle because the ferricyanide molecule must first be reduced to ferrocyanide. In the subsequent two cycles, only minimal differences in the response can be observed, indicating that the system has reached steady state. In CV, the reaction rate, and by extension the current output, is proportional to the WE surface area. 17 Meanwhile, reactions at the CE are less important in determining the current response if the CE conducts current well throughout the experiment. Because the WE surface area was maintained across all iterations, it was expected that the response does not vary significantly.
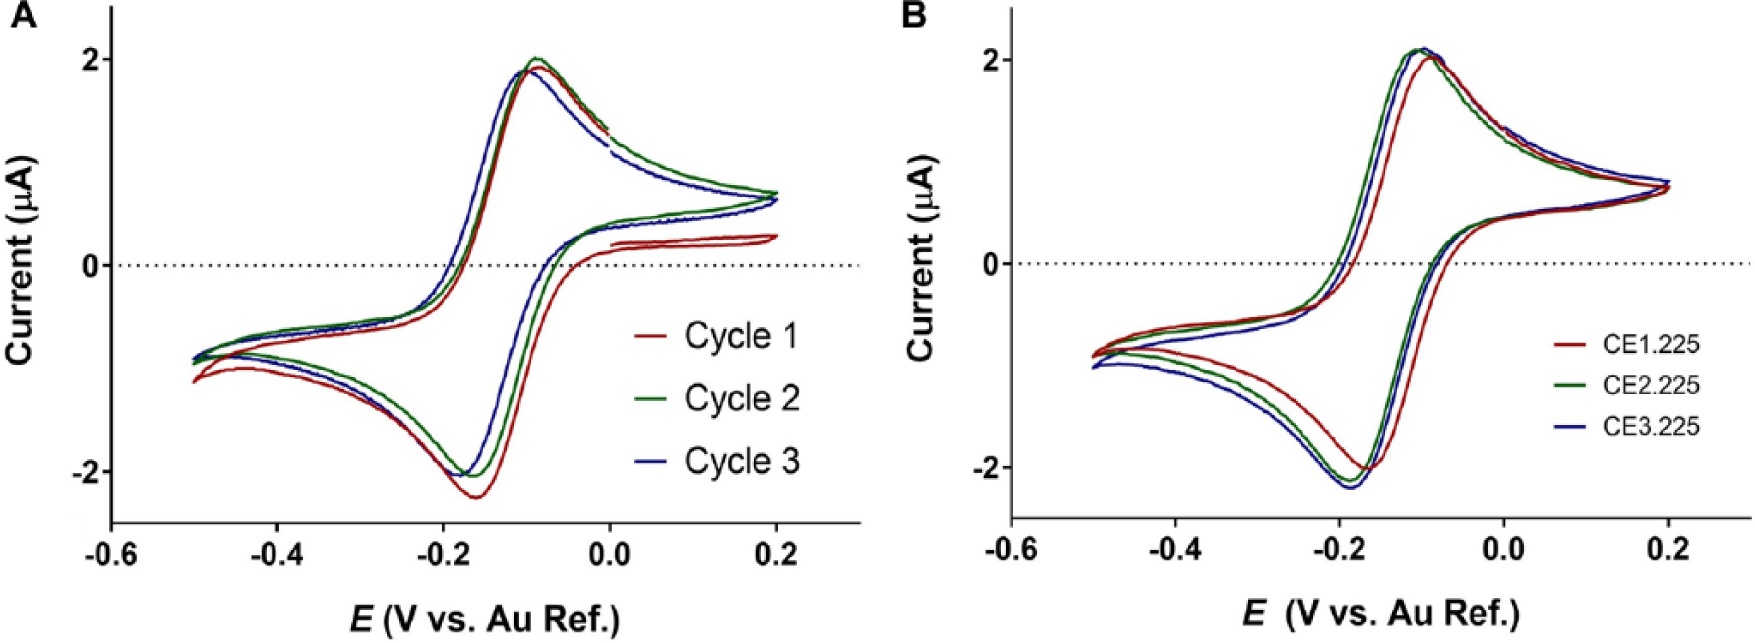
Cyclic voltammogram demonstrating electrode stability in the presence of K3[Fe(CN)6] for the CE1.235 configuration (
Steady-state voltammograms for the 225° configurations are presented in Figure 4B . Across sensor iterations, the peak current ratios of cathodic to anodic peak current were consistent, as shown in Table 2 . A peak current ratio of 1 demonstrates identical diffusion coefficients for the reduced and oxidized forms of the redox probe, and that the charge transfer kinetics are reversible. The CEX.225 iterations all showed peak current ratios very close to 1, implying that the kinetics observed were nearly ideal.
Summary of the Faradaic Response Indicating Reversibility of the System.
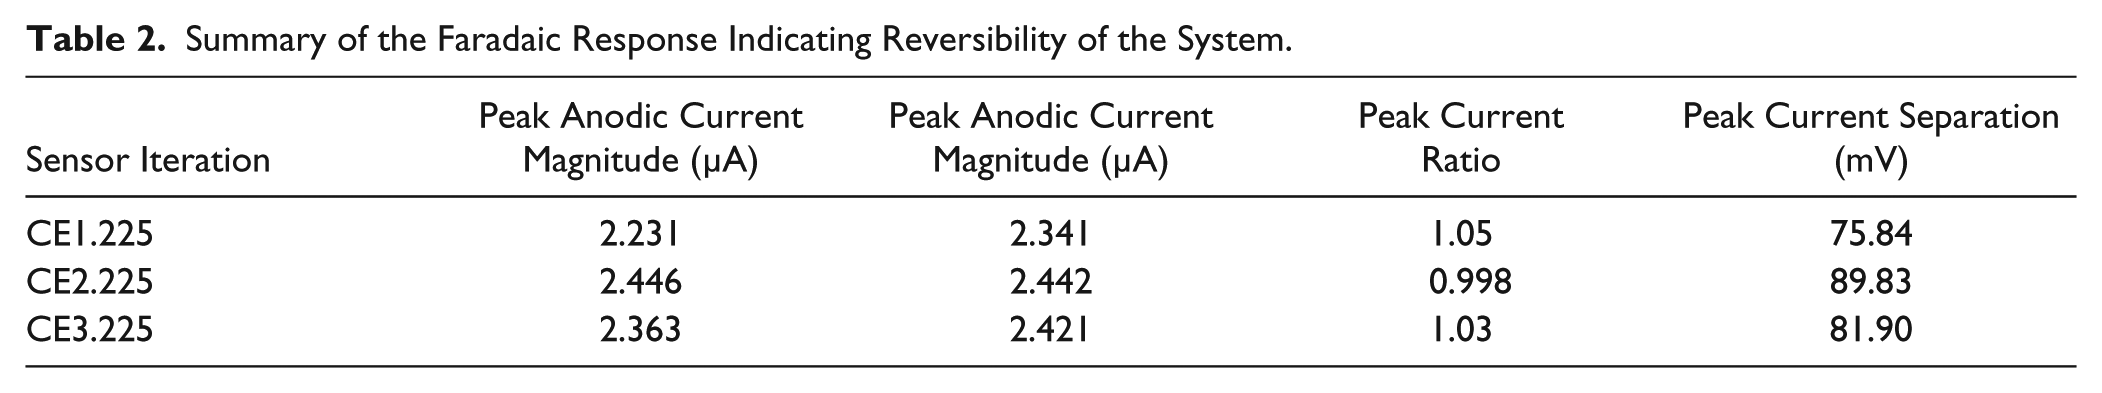
Furthermore, a peak separation of 59 mV for a one-electron reaction indicates ideal heterogeneity in charge transfer. Values larger than 59 mV suggest slower charge transfer kinetics, where values less than 59 mV may result from redox molecules bound to the electrode surface. 17 None of the biosensor iterations showed ideal heterogeneity; however, CE1.225 showed the least deviation, with a peak separation value of 75.84 mV. The CE2.225 and CE3.225 iterations had a peak current separation of 89.83 and 81.9 mV, respectively. When translating from buffer solution to biofluids, the faradaic response should be well characterized to prevent nonspecific charge transfer from interfering with the biosensor’s performance. The CV results indicated near-ideal reversibility for the CEX.225 sensors while demonstrating sensor stability over the duration of the experiment. Little differences in the faradaic response were observed across the CEX.225 sensors.
To make a downselection of the optimal design for the biosensor, the form factor of the biosensor analogue must also be taken into consideration. By placing the CE closer to the WE and RE, the sensing region is also reduced. This shrinking of the sensing region allows for a smaller fluid volume necessary to saturate the sensor. Because the CEX.225 iterations showed no significant differences in their electrical performance, CE1.225 was chosen as the optimal design tested based on both electrical performance and form factor.
EIS Results
In biological systems, EIS is often used to study changes in both bulk properties and surface phenomena.14,18 These properties can be modeled through passive circuit components combined in series and parallel to build an equivalent circuit. The data here were fitted to a Randle’s circuit ( Suppl. Fig. S4A ) to correlate changes in circuit parameters across sensor iterations in the presence of a ferricyanide redox probe. As the angle between the WE and CE increases, the solution resistance (Rs) within the system decreases, with the lowest values at the CEX.225 iterations ( Suppl. Fig. S4C ). The solution resistance should be low enough that it does not contribute significantly to the overall impedance; therefore, the CEX.225 show the most favorable Rs values. No observable changes in either double-layer capacitive or charge transfer resistance were noted across sensor iterations.
EIS was also used to probe dose-dependent impedance changes of BSA binding to DSP at the electrode surface through modulation in the electric double layer (EDL). The sensor leveraged changes in nonfaradaic charging of the double layer because BSA binding events do not produce a measurable change in charge transfer resistance in this setup. The impedance response is represented as Bode and Nyquist plots in Figure 5A and C , respectively. The Nyquist plot displays an incomplete semicircle and the absence of a charge transfer resistance, which both indicate a nonfaradaic response. The frequency 100 Hz was chosen to identify changes in impedance for the calibrated dose–response plot in Figure 5A at 100 Hz; the phase angle is between –84.87° and –83.31°, indicating that the response is capacitive. Therefore, the changes in impedance can be attributed to capacitive binding within the EDL.
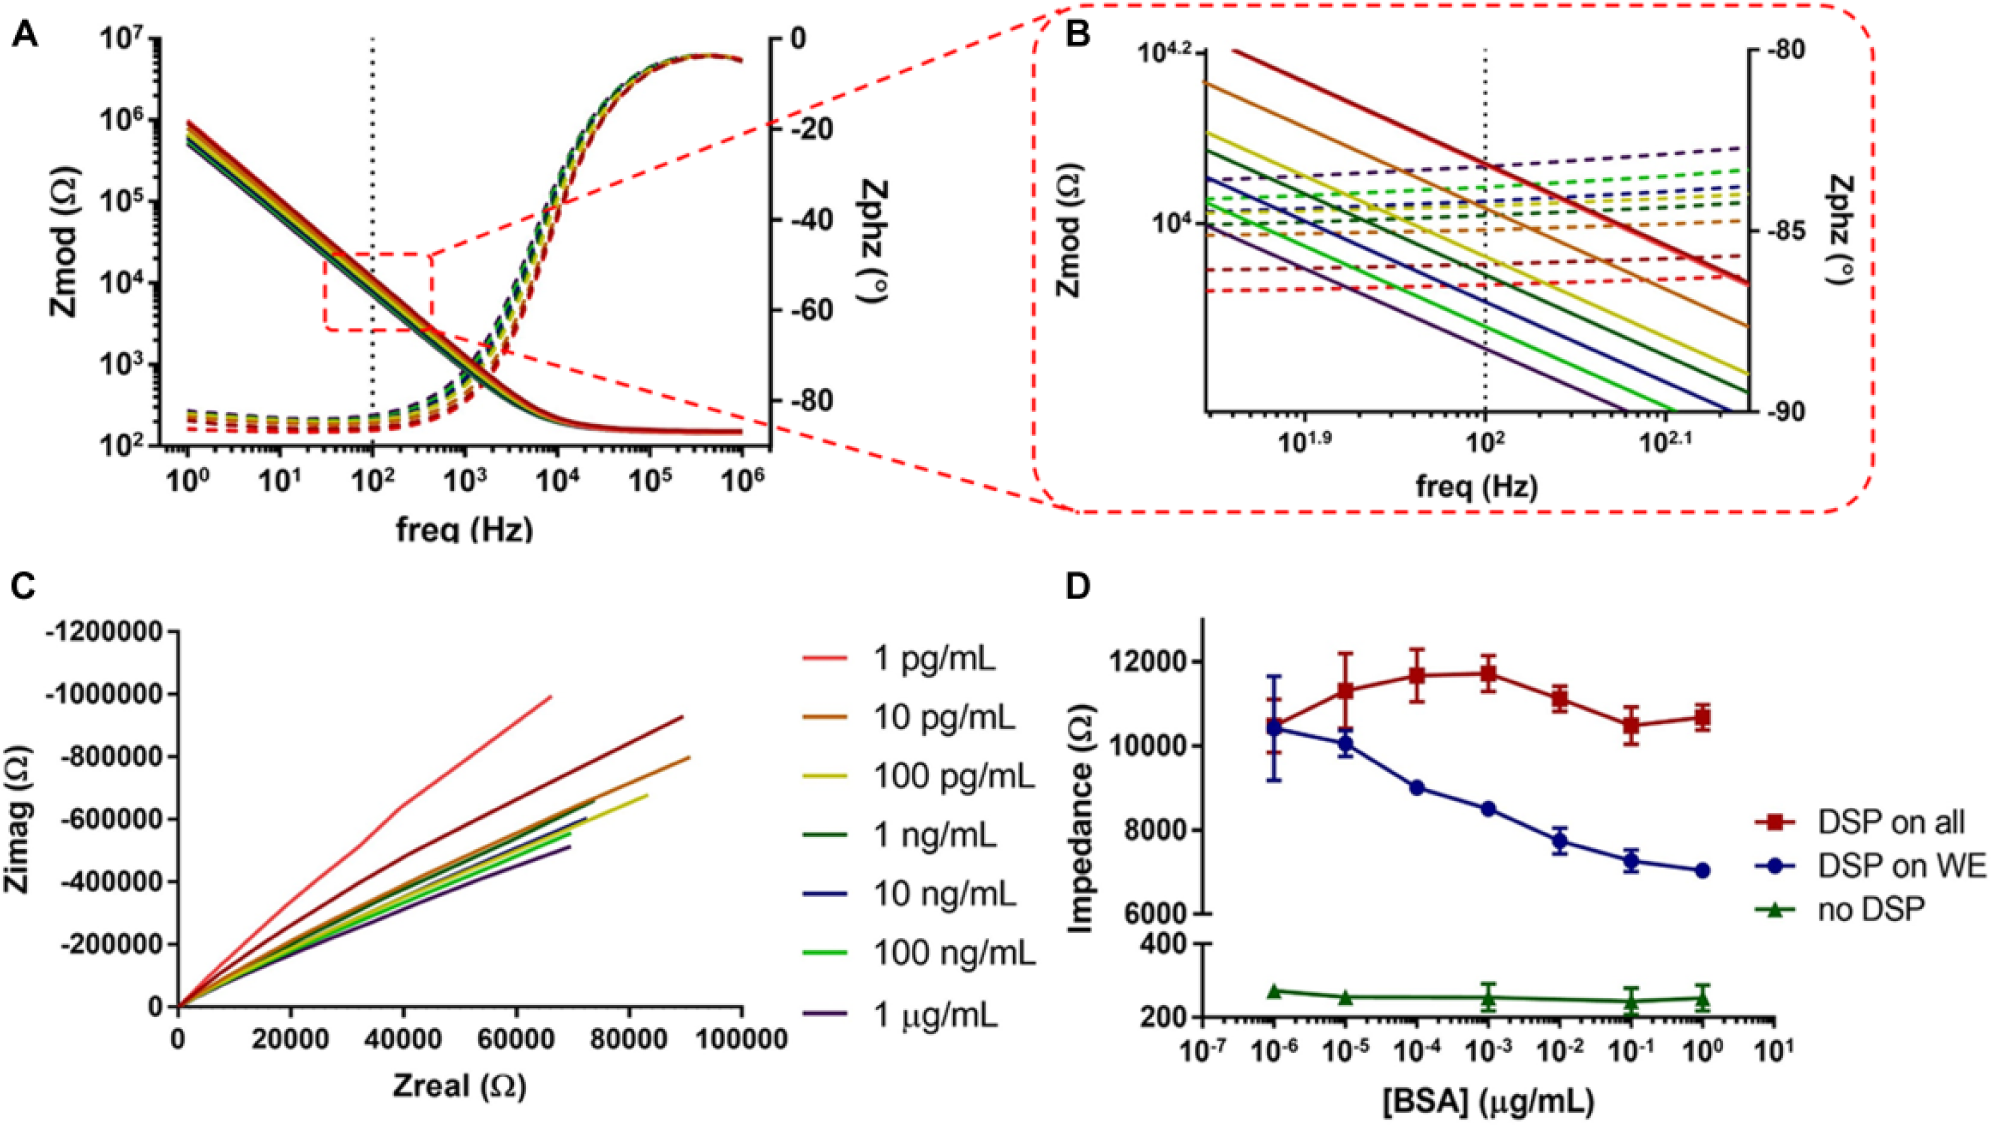
EIS data presented from the CE1.225 iteration. (
It can also be seen in Figure 5B that with selective functionalization of the WE, increasing concentrations of BSA show a decreasing trend in impedance at 100 Hz. As more BSA binds at the surface, charge is stored within the double layer, altering the system’s capacitance. This increase in double-layer capacitance yields a decrease in overall impedance over a wide range of BSA concentrations. The impedance continues to decrease with increased BSA concentrations until saturation at 100 ng/mL. This saturation point corresponds to the maximal concentration of BSA to bind to DSP and produce a quantifiable change in impedance.
When fitting the BSA dose–response data to Randle’s circuit, the charge transfer resistance is omitted ( Suppl. Fig. S4B ) because no faradaic charge transfer is observed without the ferricyanide redox probe. In the Bode plot from Figure 5A , at frequencies of 1000 Hz and below, the impedance response is driven by the capacitive reactance, indicating nonfaradaic charging of the double layer. With increasing concentrations of BSA, increases in constant phase element values were observed ( Suppl. Fig. S4D ). This correlates to larger capacitance values, and thus a decrease in impedance at frequencies where capacitive effects are dominant. Furthermore, the solution resistance does not change across BSA concentrations, supporting the conclusion that changes in the impedance are due to binding events at the electrode surface.
It is shown that selective functionalization of the WE produces better sensitivity than nonselective functionalization in affinity biosensing. By isolating binding events at the WE, it is possible to distinguish between different BSA concentrations. Nonselective functionalization of all three electrodes did not produce the same concentration-dependent changes in impedance. A one-way analysis of variance (ANOVA) determined that no variation in impedance exists across BSA concentrations (p = 0.054) at 100 Hz for the nonselective functionalization. While the number of binding sites increases through nonselective functionalization, binding of BSA at the RE surface modulates its interfacial potential across concentrations and results in an unreliable measurement of the WE-RE half-cell potential. Furthermore, the BSA dose–response was repeated without functionalizing any electrodes to validate that capacitive changes were due to surface binding rather than from physisorption of BSA onto the electrode surfaces. Another one-way ANOVA determined that no variation in impedance exists across BSA concentrations (p = 0.8096) at 100 Hz for the bare electrodes. This demonstrates that physisorption can be neglected at the selected concentrations, as it does not significantly contribute to the signal response.
Conclusion
In this article, we summarize the criteria for optimizing the design of a coplanar, three-electrode biosensor. Our results identified the impact of altering CE positioning on sensor performance for an affinity biosensor analogue. The biosensor was optimized through simulated models, followed by subsequent experimental validation. First, COMSOL analysis identified the sensor design from the perspective of placement of the RE. Based on the COMSOL analysis, it can be concluded that the RE needs to be placed on an isopotential surface and the maximum current density should be obtained at the WE. OCP measurements demonstrate the thermodynamic stability of the system, while CV was used to determine stability in the presence of faradaic charge transfer. The sensitivity was evaluated by measuring impedance changes with EIS. Furthermore, we establish that selective functionalization of the WE yields better results than functionalizing all electrodes. This biosensor analogue will serve as a model for further development as a POC affinity biosensor.
Electrochemical biosensors are an attractive solution for quantitative POC testing due to their rapid biomolecule detection, manufacturing scalability, and low biofluid volume requirements (e.g., saliva, sweat, and tears). However, sensor performance in complex biofluids often suffers due to sample-to-sample variability; unwanted faradaic currents commonly arise due to dissolved redox active species. These currents can pose a challenge when decoupling the nonfaradaic response if the passage of interfacial currents influences the sensor stability. The biosensor analogue used in this article demonstrated a stable electrode–electrolyte interaction in both the presence and absence of faradaic currents. Furthermore, the biosensor analogue was highly sensitive to capacitive binding events, making this an attractive solution for a rapid POC diagnostic biosensor.
This article serves as a template for evaluating design criteria for nonfaradaic gold-electrochemical biosensors. Optimizing the design first ensures a more stable and sensitive sensor output. Here, we demonstrated nonfaradaic sensing toward a model protein with a biosensor analogue. The sensor leveraged the gold–thiol interaction to selectively functionalize the WE through self-assembly of a DSP monolayer. The DSP then served as a nonspecific capture probe to detect the model protein BSA. DSP will react with primary amines on nearly all proteins; thus, the selectivity of an affinity biosensor can be tuned to detect other analytes of interest by first reacting DSP with a selective capture probe, such as an antibody, single-stranded DNA, or enzyme.
When expanding to other bioanalytes of interest, the design parameters may need to be adjusted. Nonfaradaic changes are detected through charge modulation within the EDL, so the analyte size and net charge must also be considered when designing the biosensor. Debye screening in high-ionic-strength biofluids can often limit the detection of very large molecules. In order to leverage capacitive changes within the EDL, the self-assembly of the capture probe must be optimized with the effective Debye screening length in mind. Furthermore, the net charge of the analyte will also dictate the dielectric modulation upon binding. An analyte with a large net charge will produce a larger change in the dielectric constant, thus changing the capacitance. When the net charge does not produce large changes in capacitance, the biosensor geometry can be adjusted to maximize the capacitive contributions from the EDL.
The optimized biosensor design has potential for detecting bioanalytes in complex biofluids, like saliva, urine, and sweat. The design of the biosensor is the first aspect toward rapid detection, so understanding the recipe for designing a coplanar three-electrode biosensor will help drive the development of next-generation POC diagnostics.
Footnotes
Supplementary material is available online with this article.
Author Contributions
H.S., N.R.S., A.P.S., and S.P. conceived the project framework. H.S. performed the modeling and experiments. H.S., N.R.S., A.P.S., and S.P. analyzed and interpreted the data. H.S., N.R.S., and S.P. wrote the paper.
Declaration of Conflicting Interests
The authors declared no potential conflicts of interest with respect to the research, authorship, and/or publication of this article.
Funding
The authors received no financial support for the research, authorship, and/or publication of this article.
References
Supplementary Material
Please find the following supplemental material available below.
For Open Access articles published under a Creative Commons License, all supplemental material carries the same license as the article it is associated with.
For non-Open Access articles published, all supplemental material carries a non-exclusive license, and permission requests for re-use of supplemental material or any part of supplemental material shall be sent directly to the copyright owner as specified in the copyright notice associated with the article.