
Abstract
Norovirus (NoV) is one of the leading causes of acute gastroenteritis, affecting 685 million people per year around the world. The best preventive measure is to screen water for possible NoV contamination, not from infected humans, preferably using rapid and field-deployable diagnostic methods. While enzyme immunoassays (EIAs) can be used for such detection, the low infectious dose as well as the generally inferior sensitivity and low titer of available NoV antibodies render critical challenges in using EIAs toward NoV detection. In this work, we demonstrated smartphone-based Mie scatter detection of NoV with immunoagglutinated latex particles on paper microfluidic chips. Using only three different concentrations of anti-NoV–conjugated particles, we were able to construct a single standard curve that covered seven orders of magnitude of NoV antigen concentrations. Multiple normalization steps and interpolation procedures were developed to estimate the optimum amount of antibody-conjugated particles that matched to the target NoV concentration. A very low detection limit of 10 pg/mL was achieved without using any concentration or enrichment steps. This method can also be adapted for detection of any other virus pathogens whose antibodies possess low sensitivity and low antibody titer.
Introduction
Norovirus (NoV) is the leading cause of illness and outbreaks from contaminated food and water around the world. According to the U.S. Centers for Disease Control and Prevention, NoV causes 19 to 21 million cases of acute gastroenteritis annually in the United States and 685 million cases globally. NoV is extremely contagious, with an infectious dose as few as 18 viral particles 1 or 1 × 10² copies/mL. 2
The standard diagnostic methods are (1) detection of viral RNA by reverse transcription–polymerase chain reaction (RT-PCR) or (2) detection of viral antigens by enzyme immunoassays (EIAs), including enzyme-linked immunosorbent assay (ELISA). While RT-PCR provides excellent sensitivity with a detection limit of <102 copies/mL, 3 this technique is time-consuming, laborious, and requires expensive equipment and reagents that may not be readily available. Although EIAs are inferior to RT-PCR in their sensitivity and detection limits, they provide rapid results and serve as a preliminary detection method to meet acute gastroenteritis outbreak analysis demands. Thus, many commercial EIA kits are available. For example, RIDASCREEN Norovirus 3rd Generation EIA has been cleared by the U.S. Food and Drug Administration. However, its intended use is limited to NoV detection in human stool from ill patients (thus not requiring low detection limit) and RT-PCR validation is still recommended. To be used as a preventive measure especially for water samples, high sensitivity and very low detection limit are necessary. Unfortunately, most antibodies to NoV show low reactivity with specific NoV strains, leading to a very high detection limit (i.e., >106 virus particles per gram of feces). 4 In addition, most currently available NoV antibodies (anti-NoV) have a significantly low antibody titer (or ELISA titer). This leads to an extremely narrow linear range of detection, thus rendering the assay less useful for NoV quantification. All of these complications are more or less associated with the uncultivable nature of NoV. 5
Because of these limitations, NoV has been detected from stool samples from progressively ill human subjects, where NoV concentrations are very high. To develop a preventive diagnostic tool for acute gastroenteritis outbreaks, potentially contaminated water sources must be tested. Towards this end, there is a need to improve NoV EIAs toward (1) very low detection limit and (2) a much wider concentration range, enabling rapid, sensitive, and easily quantifiable assays. There have been several recent studies to improve NoV EIAs through alternative sensing modalities or sample enrichment (i.e., concentration methods). These recent studies are summarized in Table 1 , where detection limits were indeed reduced by various means. However, these methods require additional steps that are complicated and time consuming, including sample purification/enrichment,2,6,7 use of NoV virus-like particles (VLPs),7 –11 or the use of RT-PCR, 11 thus forgoing the true merits of EIAs over RT-PCR.
Summary of NoV Assays Reported in Recent Literature. a
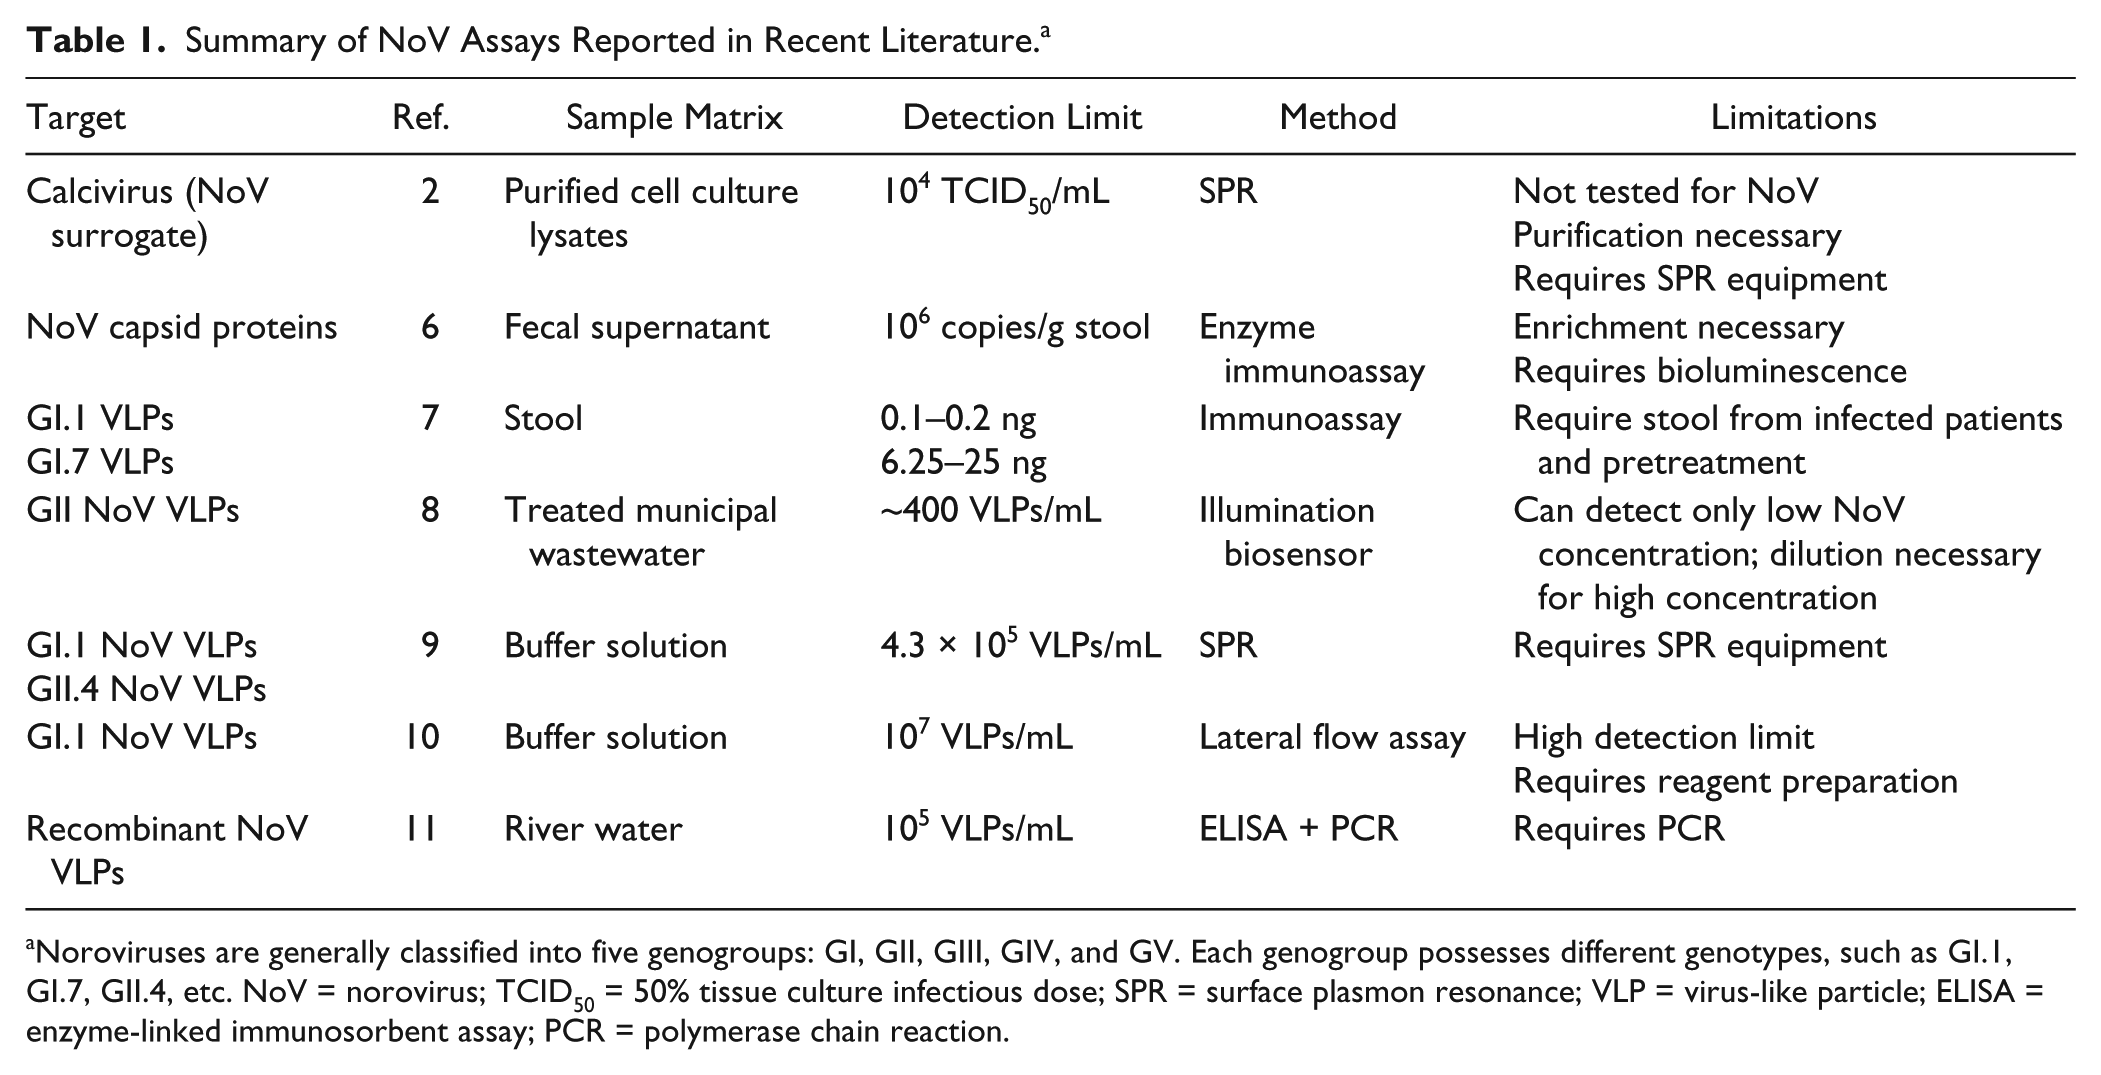
Noroviruses are generally classified into five genogroups: GI, GII, GIII, GIV, and GV. Each genogroup possesses different genotypes, such as GI.1, GI.7, GII.4, etc. NoV = norovirus; TCID50 = 50% tissue culture infectious dose; SPR = surface plasmon resonance; VLP = virus-like particle; ELISA = enzyme-linked immunosorbent assay; PCR = polymerase chain reaction.
Our group has previously demonstrated a particle immunoagglutination assay coupled with angle-specific Mie scatter detection on various microfluidic platforms for assaying various pathogens.12 –17 In this assay, antibody-conjugated latex particles immunologically agglutinate in the presence of target antigens, thus increasing the effective particle diameter. Monitoring Mie scatter at an angle optimized for such agglutination allows the detection and quantification of target antigens. In addition, particle immunoagglutination has been demonstrated on simple and low-cost paper microfluidic platforms.14,15 More importantly, paper platforms provide an additional advantage in providing intrinsic filtration capabilities with the fibrous pores, as previously demonstrated. 18 Incorporating smartphone-based detection with paper microfluidics has allowed momentous strides toward field-deployable, affordable, and easy-to-use assays. 17
Our previous studies demonstrated low detection limits using Mie scatter detection of immunoagglutinated latex particles on paper microfluidic platforms. This principle worked successfully with commercially available antibodies that have high ELISA titer (e.g., 1:17,000 of antibody to Escherichia coli [anti-E. coli]). However, such methods are limited with low ELISA titer antibodies, such as anti-NoV (1:2000). In fact, preliminary studies performed in our laboratory showed a mere one order of magnitude linear range for a Mie scatter immunoagglutination NoV assay.
In this work, we demonstrated a particle immunoagglutination assay of the capsid proteins from NoV using smartphone-based Mie scatter detection. Wax printing was used as a simpler means for fabricating paper microfluidic channels, which has recently gained wide popularity in the microfluidics area.19 –21 Capsid proteins from the viral coat of NoV were used as a realistic surrogate without risking use of actual infectious samples. Positive signals were normalized following previously performed methods. 15 Three different concentrations of anti-NoV–conjugated latex particles were introduced to three different channels of a single paper microfluidic chip. Through interpolation analysis, we demonstrated the linear range of assay over seven orders of magnitude, which has not been demonstrated previously. In addition, we also demonstrated extremely low detection limits, down to 10 pg/mL, which has not yet been demonstrated for NoV EIAs in a rapid assay platform. Such enhancements in sensitivity and broad assay range will provide a strong promise for the EIAs with weak antibodies toward efficiently determining the contamination source and preventing epidemics.
Materials and Method
Fabrication of Paper Microfluidic Chips
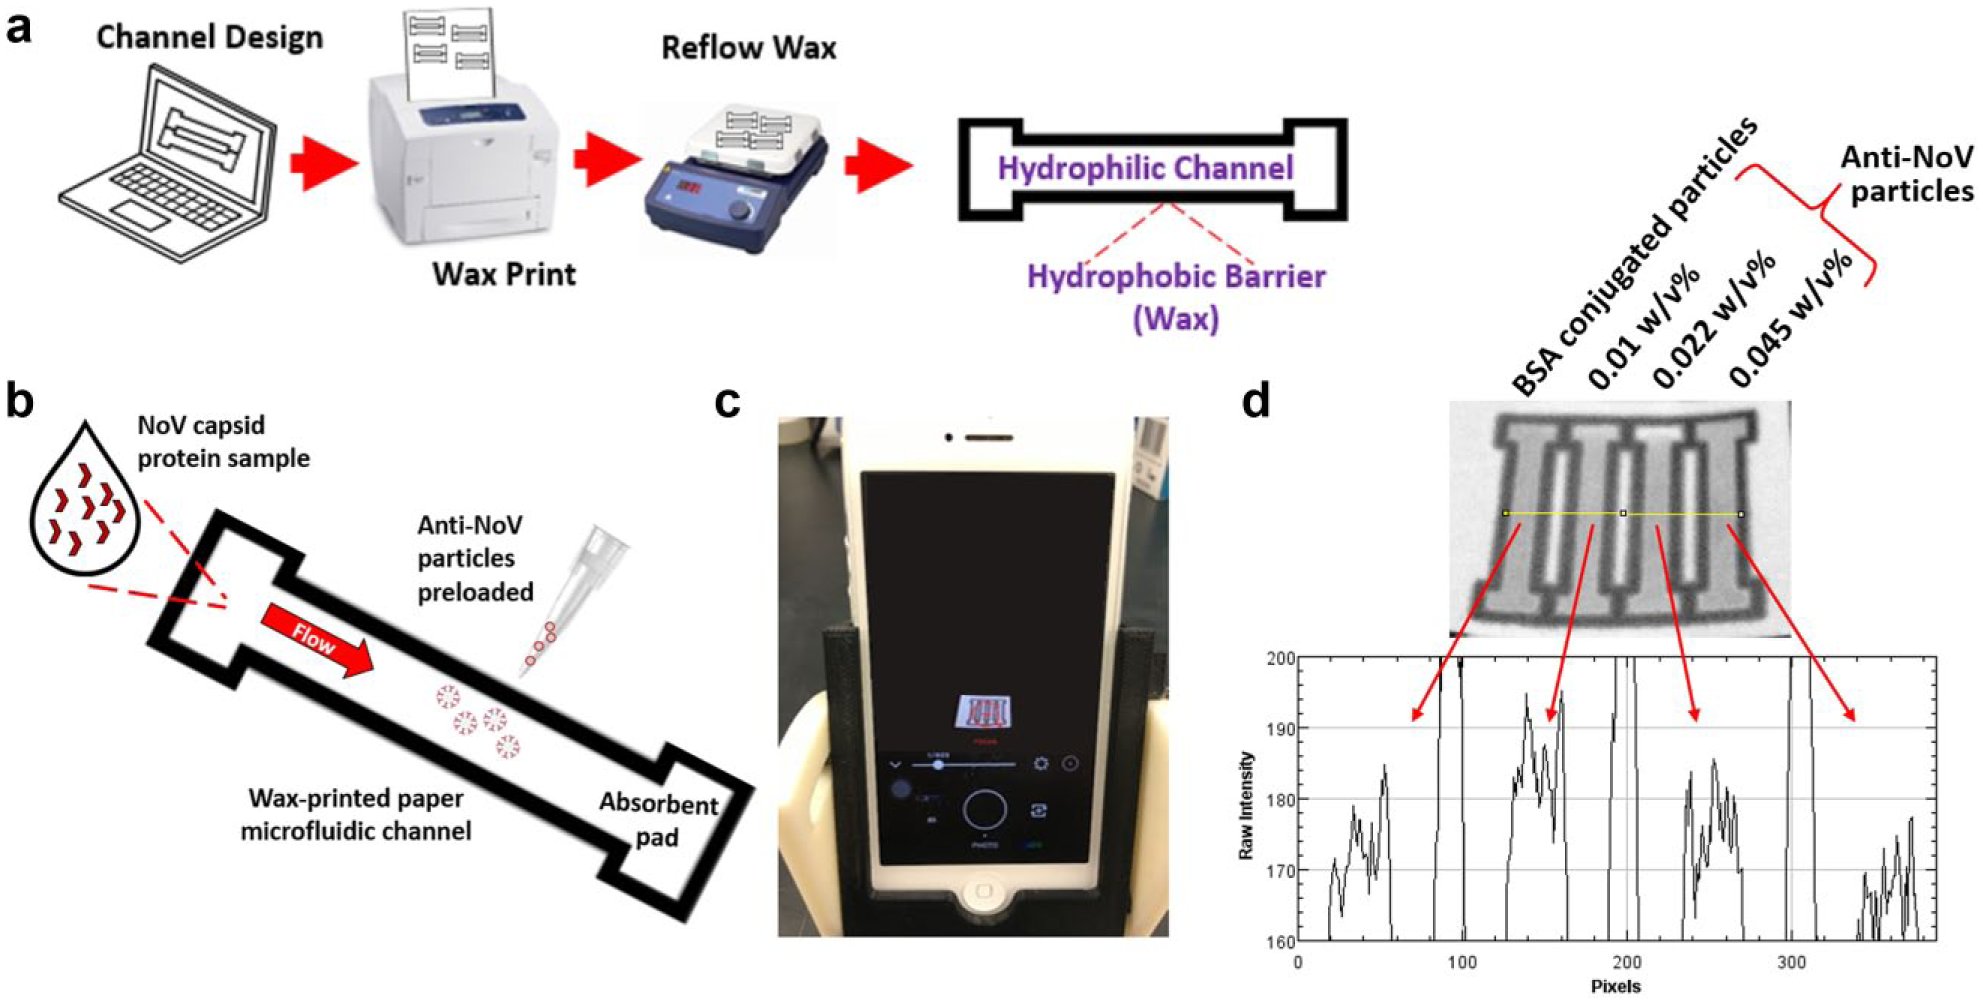
Fabrication of paper microfluidic chips using a wax printer is demonstrated in Figure 1 . Paper microfluidic chips with multiple parallel channels were loaded with different amounts of antibody-conjugated or bovine serum albumin (BSA)–conjugated latex particles. Chips were designed using SolidWorks (Dassault Systemes, SolidWorks Corporation, Waltham, MA, USA) with inlet and absorbent pad dimensions of 4-mm wide and 2-mm long and channel dimensions of 2-mm wide and 14.5-mm long. Chip designs were printed with solid ink on cellulose chromatography paper (GE Healthcare, Maidstone, Kent, UK) using a wax printer (ColorQube 8580, Xerox, Wilsonville, OR, USA). Individual chips were cut out and placed on a hot plate at 100 °C for <100 s to melt the wax through the entire paper. Chips were stored in sealed, dry, and dark conditions if not used immediately.
Assay procedure. (
Conjugation of Anti-NoV to Latex Particles
Polystyrene latex particles (Magsphere, Pasadena, CA, USA) of 920-nm diameter were covalently conjugated with polyclonal antibodies to norovirus capsid protein (anti-NoV; Abcam, Cambridge, MA, USA) or BSA (Sigma-Aldrich) following the protocol described in Cho et al. 15 The concentrations of conjugated particle suspensions were calibrated by the method detailed in Park et al. 17 and You et al. 12 to yield varying particle concentrations (w/v%) from 0.01%, 0.022%, and 0.045%, for both anti-NoV–conjugated particles and BSA-conjugated particles. These particles were stored in deionized (DI) water at 4 °C.
Sample Preparation
Positive samples consisted of recombinant NoV capsid protein antigens (MyBioSource, San Diego, CA, USA) diluted in sterilized DI water. Dilutions were made to the following concentrations: 10 pg/mL, 100 pg/mL, 1 ng/mL, 10 ng/mL, 100 ng/mL, 1 µg/mL, and 10 µg/mL. DI water without the presence of NoV antigens was used as a blank sample.
Smartphone-Based Immunoassay Procedure
A smartphone (iPhone 5, Apple, Cupertino, CA, USA) was positioned in a three-dimensional–printed angled holder described in Cho et al. 15 The smartphone was angled 25° and 9 cm vertically from the paper microfluidic chip ( Fig. 1c ), where the Mie scatter simulation showed the greatest change in scattering intensity as the particle size increased. The smartphone app VSCO (Visual Supply Company, Oakland, CA, USA) was used to lock white balance and focus to the channel center, and images were taken with a shutter speed of 1/600 s on average ( Fig. 1c ). All experiments were performed under a normal ambient lighting condition (fluorescent lamps).
A volume of 1.7 µL of anti-NoV–conjugated particles or BSA-conjugated particles was preloaded on the center of each positive channel or negative channel, respectively. Paper chips were subsequently dried at room temperature. Seven microliters of sample (with varying NoV concentration) was added to the positive channel (with anti-NoV–conjugated particles preloaded), as well as the negative channel (with BSA-conjugated particles preloaded). Identical particle concentrations (anti-NoV– or BSA-conjugated) were used when comparing the positive to the negative channel results.
Two image acquisitions were performed for normalization purposes. The first image was taken after the preloaded particles were dried ( Fig. 1c ). The second image was taken after the loaded samples entered the absorbent pad ( Fig. 1d ). Triplicate sets of experiments were performed for each particle concentration (a total of three concentrations) and each target NoV concentration (a total of eight concentrations including a blank) each time using a new microfluidic chip with different samples.
The extent of particle immunoagglutination was measured at the channel center. RGB images were split into their green channel components using ImageJ software (National Institutes of Health, Bethesda, MD, USA). Scatter intensities were recorded from the microfluidic channel centers in these green channel images, which have previously enabled maximum change in scatter intensity under ambient lighting. 18 Upon immunoagglutination, the effective size of particles is expected to increase, causing an increase in scatter intensity at the optimized detection angle. This increase can be quantified from the (green) pixel intensities taken from the central area of each channel. A sample intensity plot is shown in Figure 1d , where the channel preloaded with 0.01 w/v% anti-NoV particles shows the maximum pixel intensities with 1 ng/mL NoV sample.
Data Normalization
After obtaining signal intensities, double normalization was done similar to the previously detailed method in Cho et al. 15 The first step is background normalization by dividing the green scatter intensity from the central channel region with that from the background. This step accounts for the channel-to-channel variation and the effects of different ambient lighting conditions of individual channels. The second step is blank normalization by dividing the background-normalized value from the positive channel (preloaded with anti-NoV–conjugated particles) with the same from the negative channel (preloaded with BSA-conjugated particles). All channels were loaded with the same amount of anti-NoV– and BSA-conjugated particles. This step accounts for any variations arising from the extent of nonspecific aggregation of anti-NoV particles, in reference to the nonaggregated BSA-conjugated particles, prior to performing immunoagglutination assays.
Construction of Standard Curve through Data Interpolation
After double normalization, three double-normalized intensities per particle concentration were available for each NoV concentration. An equivalent amount of antibody-conjugated particles was obtained for each NoV concentration through interpolating these raw data, which is described in the Results and Discussion section. This equivalent amount of antibody-conjugated particles was plotted against NoV concentration to construct a standard curve. Analysis of variance (ANOVA) of this standard curve was performed by Stata/IC 12.0. 22
Results and Discussion
Double-normalized intensities were obtained from the particle immunoagglutination assays on the paper microfluidic chips using a smartphone. Figure 2a shows the results of NoV assays with varying concentrations of preloaded anti-NoV particles. While seven orders of magnitude of NoV concentrations were evaluated in this work, the linear range of assay appeared limited, covering just a few orders of magnitude followed by a decrease in double-normalized scatter intensities, for the given amount of anti-NoV–conjugated particles. This can be explained by the inferior sensitivity and very low ELISA titer of anti-NoV used in this study.
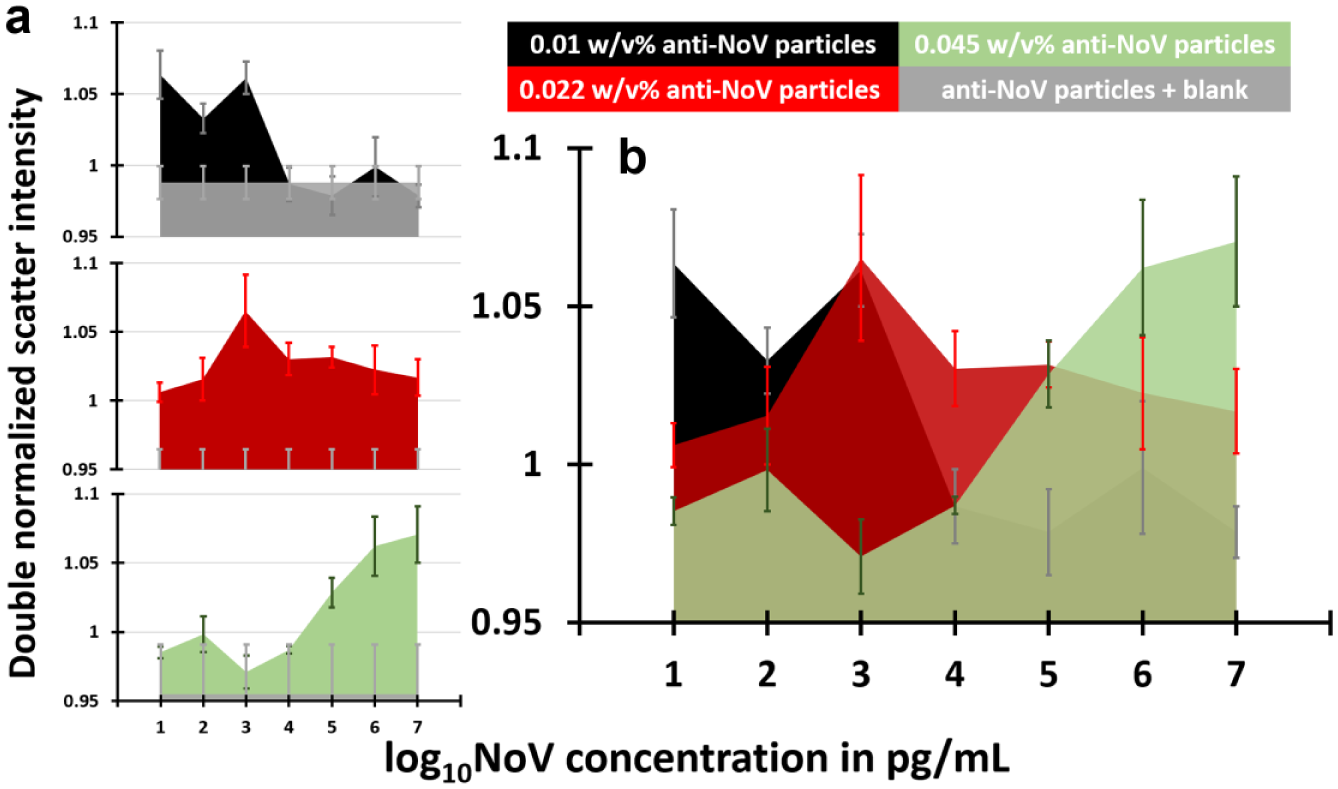
Results of particle immunoagglutination assay with smartphone-based Mie scatter detection from paper microfluidic chips. All data were normalized to those from a negative channel, where the same amount of bovine serum albumin–conjugated particles were preloaded. Data represent an average of three different experiments, each time using a different paper microfluidic chip. Error bars represent standard errors. (
However, a noticeable trend can be observed from the entire data set. It is possible to find the optimum anti-NoV particle concentration for detecting specific NoV concentration through stacking the three individual plots ( Fig. 2b ). For 101 pg/mL, the double-normalized intensity was maximized with 0.01% anti-NoV particles. This maximum intensity seemed to gradually shift to the channel with 0.022% anti-NoV particles as NoV concentration increased up to 10 ng/mL (=104 pg/mL). A further shift was observed with the 0.045% anti-NoV particles as NoV concentration increased to 1 µg/mL (=106 pg/mL) and 10 µg/mL (=107 pg/mL). Apparently, an optimum amount of anti-NoV–conjugated particles, and thus an antibody amount, seemed to exist for the given concentration of NoV capsid proteins. Such antibody amounts were calculated through interpolating the raw data set shown in Figure 2 .
The interpolated value of anti-NoV–conjugated particles for the given NoV concentration was calculated in the following manner ( Fig. 3 ): First, three double-normalized intensities were divided by the lowest double-normalized intensity (i.e., normalization to the minimum intensity), then multiplied by 100. Second, these intensities were divided by the sum of all intensities obtained in the first step. For example, the 10 pg/mL data can be represented as 60% with the 0.01% anti-NoV particles, 40% with the 0.022% anti-NoV particles, and 0% with the 0.045% anti-NoV particles (the last is the minimum intensity). Therefore, the matching amount of anti-NoV particles should be between 0.01% and 0.022%, with 60% close to 0.01% and 40% close to 0.022%. To obtain the interpolated amount of anti-NoV particles, the particle concentration was multiplied with the rendered percentage and added together (e.g., 0.01% × 0.6 + 0.022% × 0.4 = 0.015% for the 10 pg/mL data set). This number indicates the estimated particle concentration that optimally matches to the given NoV concentration. Through repeating this calculation for individual trials, it is also possible to obtain standard errors for the estimated particle concentrations.
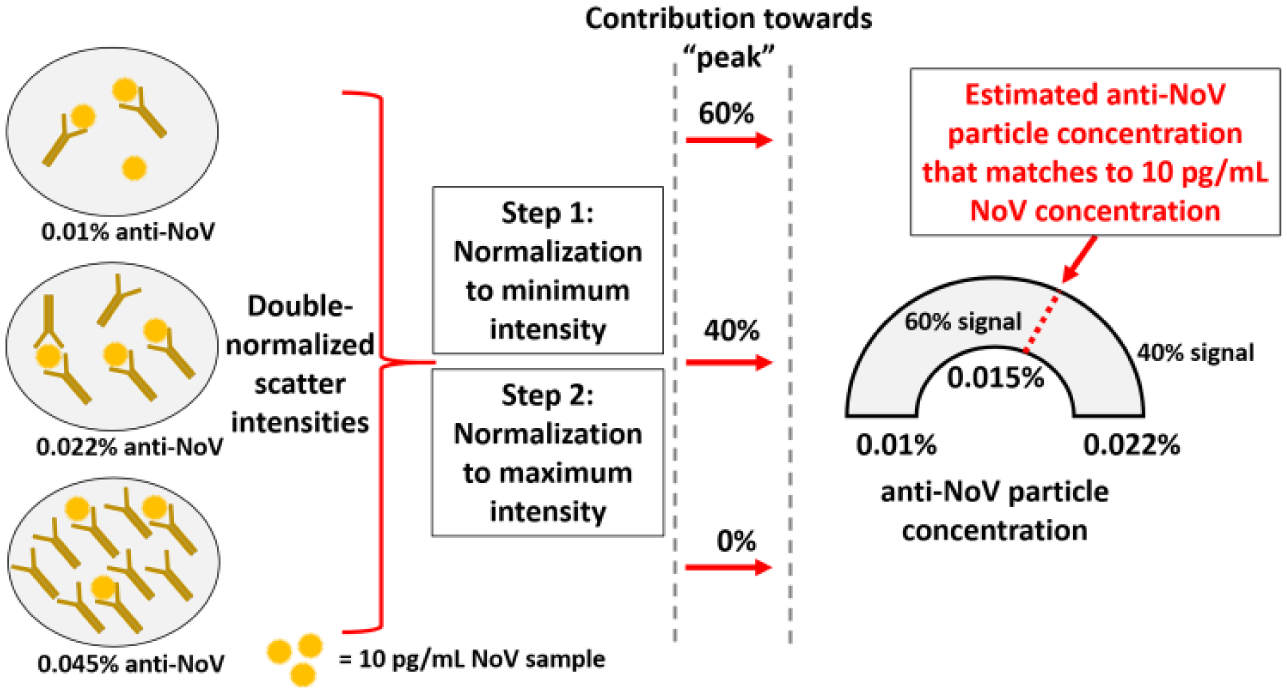
Graphical illustration for estimating the interpolated value of anti-norovirus (NoV) particle concentration for the given NoV concentration (in this case, 10 pg/mL).
The interpolated anti-NoV particle concentrations were plotted against the NoV concentrations to construct a single standard curve, and the result is shown in Figure 4 . The curve yielded a generally increasing trend, with a linear equation of y = 0.0052x + 0.0043 and R 2 value of 0.94. This linear equation can be used to determine NoV concentration from three double-normalized intensities from a single chip. A positive correlation between the anti-NoV particle concentration and the log10 NoV concentration was observed and determined statistically significant by ANOVA (p < 0.001). In addition, all of the interpolated data points showed a 99% confidence interval (mean ± 2.58 × standard error) higher than the reference point 0, indicating successful detection over all seven orders of magnitude of NoV concentrations. Overall, this original interpolation method supports that the optimum antibody amounts must be determined for NoV detection in future sensing applications.
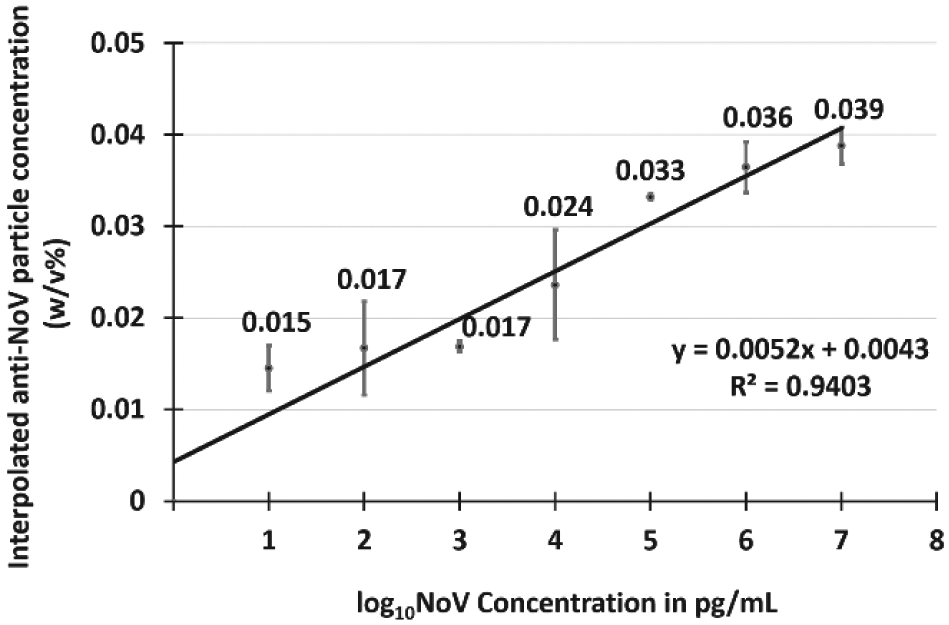
The interpolated anti-norovirus (NoV) particle concentrations were plotted against log10 NoV concentration in pg/mL. Each data point was obtained from nine different experiments (three different anti-NoV particle concentrations, each replicated three times). Error bars represent standard errors. The 99% confidence intervals (mean ± 2.58 × standard error) for all data points were higher than 0, indicating all data points are statistically different from the blank with 99% confidence.
A rapid, simple, and sensitive method of detecting NoV antigens from water samples is demonstrated in this work that can be used toward a precautionary measure to prevent acute gastroenteritis outbreaks. While EIAs are a suitable rapid detection method for NoV, they suffer inherent limitations arising from inferior sensitivity and low ELISA titer of available antibodies to NoV. Due to these limitations, most NoV EIAs are for analyzing human stool samples from already infected subjects, whose NoV concentrations are sufficiently high (at least a few ng/mL). Other complementary methods have been attempted to overcome these limitations but have typically made the assay substantially slower and laborious, for example, adding an additional step of PCR. 11 The innovative approach used in this work was able to demonstrate a very low detection limit (10 pg/mL) without adding additional steps. Moreover, this method achieved an extremely wide linear range of assay (seven orders of magnitude), through simply using three different concentrations of anti-NoV–conjugated particles. This method can also be adapted to any other virus pathogen whose antibodies are less sensitive and have low ELISA titer. Ultimately, this novel method may enhance the preventive power of EIAs toward efficient determination of contaminated water sources to prevent epidemics.
Footnotes
Acknowledgements
Ms. Jamie L. Hernandez at the University of Arizona (currently at University of Washington) assisted with running the assays; Mr. Collin A. Gilchrist at the University of Arizona assisted the fabrication of paper microfluidic chips and preparation of reagents.
Declaration of Conflicting Interests
The authors declared no potential conflicts of interest with respect to the research, authorship, and/or publication of this article.
Funding
The authors disclosed receipt of the following financial support for the research, authorship, and/or publication of this article: Funding for this research was provided by the Water and Environmental Technology (WET) Center and BIO5 Institute at the University of Arizona, as well as Tucson Water.