
Abstract
Paper-based systems have been widely investigated for developing point-of-care devices because of their simplicity, affordability, and ease of use. Recent advances have resulted in paper systems that have progressed beyond the historical “single-strip” format and allow for a larger range of functions. This review provides a summary of the advances that have been made to improve the utility of paper-based diagnostic tests for biosensing. Specifically, techniques for designing paper devices, including different geometries and chemical patterning to control fluid flow, are discussed. This review also examines novel approaches to improve paper-based assay sensitivities, such as sample preconcentration, signal amplification at the detection zone, and electrochemical methods.
Introduction
Infectious diseases are the second leading cause of death worldwide. 1 Therefore, there is an ever-growing need for rapid, simple diagnostic tools to detect diseases. While the economically developed world has access to the many medical tools, trained personnel, and resources to perform diagnostic tests for a plethora of diseases, these same resources are not as accessible in developing countries. Unfortunately, however, it is in many of these same developing countries where the need for rapid and accurate diagnosis of diseases is the greatest. In these countries, many disease-related deaths occur due to the lack of early diagnosis. Many of these deaths would have been preventable if the disease had been diagnosed earlier and treatment administered soon thereafter. Moreover, the ability to perform early diagnoses can help reduce the chance of disease outbreaks. As such, the World Health Organization has developed the ASSURED criteria as a benchmark for designing ideal diagnostic tools to best cater to the medical needs in Third World countries. These point-of-care (POC) diagnostics should be the following: Affordable, Sensitive, Specific, User-friendly, Rapid and robust, Equipment free, and Deliverable to end users. 2
To this end, many research groups have considered the use of paper as the material for designing rapid, POC diagnostics. Paper is a readily accessible and inexpensive material, and the mass production of paper-based diagnostics would be relatively low in cost. Because paper has been widely used in analytical chemistry, many techniques for paper functionalization have already been established and can be exploited or augmented in paper-based diagnostic design. Lastly, paper is also inherently able to transport fluids via capillary flow, thus removing or reducing the need for pumps and other external equipment to drive fluid flow. 3
Given these advantages of using paper in a diagnostic design, some basic paper assays have been well developed and characterized. One such paper-based test is the lateral-flow immunoassay (LFA). Although they come in various configurations, most commercially available LFAs are constructed with nitrocellulose membranes, due to their optimal performance for many types of bioassay needs. 4 Two types of commonly performed tests on LFA strips are the competition and sandwich assays. For both types of assays, reporter probes conjugated with an antibody for the target biomolecule are used to capture the analyte. In the competition assay, secondary antibodies are immobilized on the control line, and the target biomolecule is printed on the test line. The appearance of a control line is required to indicate that fluid has flowed up the strip and that the test is valid. When no analyte is present in the sample, a negative test is indicated by the appearance of both the control and the test lines. This occurs because unbound antibodies can bind to the target biomolecule at the test line and the secondary antibodies at the control line. A positive test is represented by the appearance of only the control line, since the saturated antibodies on the detector probes will flow past the test line and only bind to the control line. 5 In a sandwich assay, antibodies for the analyte are printed on the test line, and an antibody-binding protein is immobilized on the control line. The appearance of just a control line is indicative of a negative test as there is no analyte to bind to the test line. A positive test is shown by the appearance of two lines caused by the binding of the target biomolecule to its antibody. 6
Over the past three decades, the lateral-flow immunoassay has dominated the market of rapid diagnostic testing and has been used for a variety of applications. One of the more successful and common uses for the LFA is the pregnancy test, such the ClearBlue Digital (Geneva, Switzerland) and the First Response Early Result Pregnancy Tests (Ewing, NJ). Although the push to further improve LFAs was initiated more recently, the precursors to these assays and techniques used to develop them date back to the 20th century. The first paper-based diabetes dipstick test to measure glucose levels in urine was proposed in the 1950s, and the lateral-flow test was introduced to the market in the 1960s. By the 1980s, the pregnancy test made its way to the market. 7 Since then, the continued improvement of the LFA technology has led to advances in its complexity and range of functionality. Moreover, in recent years, there has been a significant interest in developing novel approaches to fabricate paper-based devices and to extend the bounds of what can be achieved in paper systems ( Fig. 1 ).
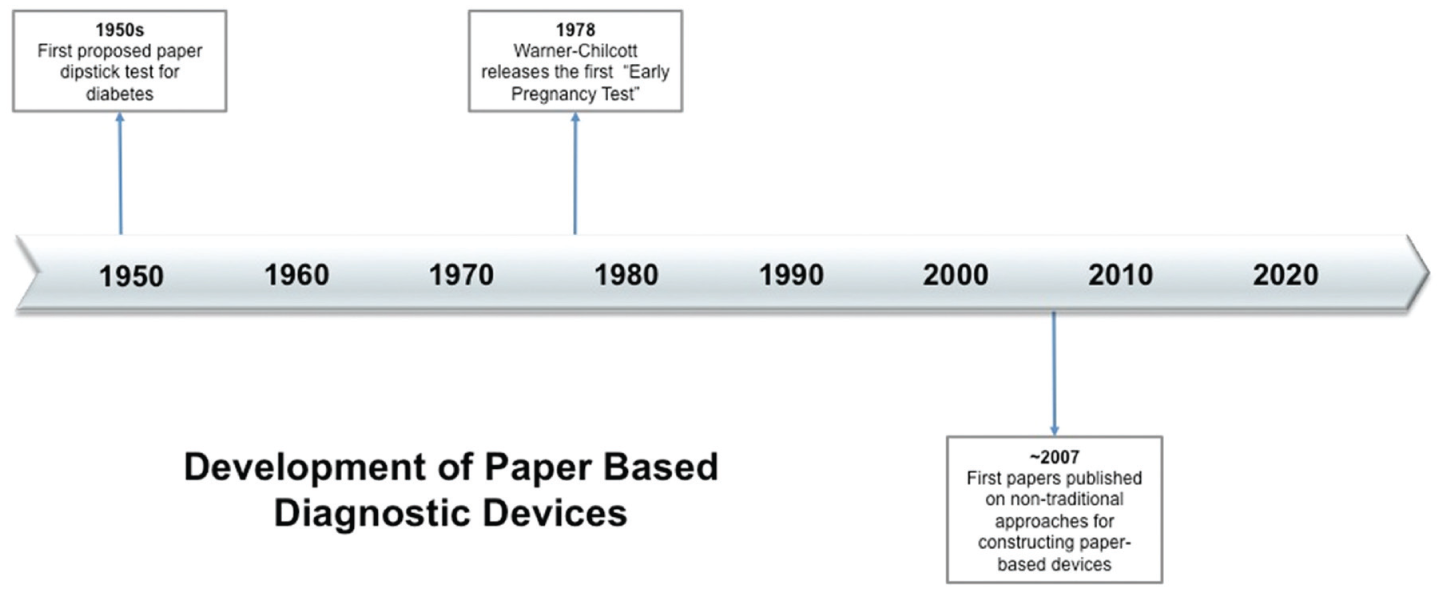
A timeline of the development of paper-based diagnostics.
Amid the expansion of the paper diagnostic field, several key challenges in paper device fabrication have been identified. One of the main challenges lies in the difficulty of controlling fluid transport and flow. Although fluid transport is conveniently achieved via capillary flow, the fluid movement is often difficult to channel or redirect in a specific path. In addition, the sensitivity of the paper-based assay to detect the presence of an analyte is often an issue. This review highlights some of the novel methods that have been developed in the recent years for addressing these two challenges in the design of paper-based devices and diagnostics.
Control of Fluid Transport
Physical Shaping of Geometries
2D Paper Networks
In paper-based devices, capillary flow is the main method of fluid transport. This is one of the most advantageous properties in developing paper-based, POC diagnostics, since no pump equipment is necessary to facilitate fluid movement. However, the drawback of this characteristic is that it is often challenging to manipulate the flow rate and specify when the fluid reaches a certain site in the paper device. Furthermore, unlike traditional microfluidic devices with valves that can be easily opened and closed, manipulating the fluid samples to follow a desired flow path can also be difficult to achieve. This ability to control fluid flow would be relevant for cases where two reagents are introduced in a paper device, but should not mix until they reach a specific region on the paper at a specific time after the diagnostic test has been initiated. Therefore, there is a need for simple methods to control when and how reagents should come into contact with a desired region in paper systems.
One of the ways to facilitate control of fluid flow on paper involves altering the physical geometry of the paper. While basic paper devices such as the lateral-flow immunoassay have traditionally used simple, rectangular paper strips, the Yager group pioneered methods of controlling fluid flow by cutting and shaping devices into various other geometries—also known as 2D paper networks (2DPNs). The authors first tested the flow rate and behavior in rectangular paper strips whose width increased downstream. As expected, in sections of the paper that were narrow, the fluid front was observed to travel faster than in sections that were wider ( Fig. 2 ). Similarly, the fluid front reached a designated end point faster in a narrower paper segment than in a wider paper segment within a given time interval. Thus, the Yager group demonstrated that the transport time of the fluid front within a paper segment could be varied by adjusting the width of the paper strip. This ability to tune the speed of fluid flow in each section would be useful in instances when increased fluid flow may be required to decrease transport time in one section but must be slowed in a different section to allow more time for mixing/binding with elements on the paper. 8
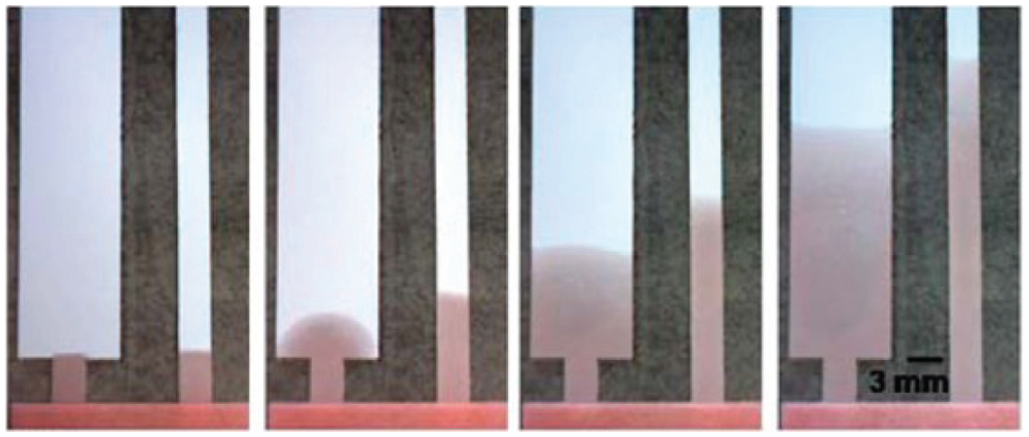
Time sequence images comparing fluid movement on two rectangular strips with varying widths. Reproduced from Fu, E.; Lutz, B.; Kauffman, P.; et al. Controlled Reagent Transport in Disposable 2D Paper Networks. Lab Chip
Similarly, the Yager group investigated the use of a three-inlet device in which the inlet geometries were tailored to sequentially introduce various reagents into a main fluid channel. Each inlet had a different path length—decreasing in length from left to right—to the detection region. In addition, each inlet was attached to an absorbent pad designed to hold decreasing volumes of reagent, from left to right. The reagent loaded into shortest inlet path reached the detection site first, while the fluid with the longest path and the largest absorbent pad volume took the longest time to reach the detection region and ran out last. With this device, the authors demonstrated that the physical shaping of a paper network could be used to dictate fluid movement and perform timed delivery of reagents to a desired detection site. 8 In 2012, the Yager group used a similar three-inlet paper network to design a portable device for detection of a malaria antigen. 9
The Yager group also expanded this idea of controlling the arrival time of different reagents by developing a system that could be used to control the “shut-off” time for each reagent. In this setup, a device with inlets of various lengths was dipped into a single shared well containing the fluid source. Each inlet would contain a dried reagent or chemical that would be rehydrated and transported upon contact with the fluid source. At the beginning, all the inlets were in contact with the fluid source, allowing all the inlets to wick fluid from the shared well. As the fluid level in the well dropped, however, the shorter inlets would no longer contact the fluid source, resulting in a “disconnection” of that inlet from the fluid source ( Fig. 3 ). Thus, the sequence of the disconnects corresponded to the length of the inlets and also depended on the depletion rate of the source. Both of these contributing factors can therefore be manipulated in the future to fine-tune the progression of each reagent. 10 Alternatively, the Yager group later also developed a device with paper architecture components that can be used as tunable-delay shunts to build devices with timed delivery of reagents. 11
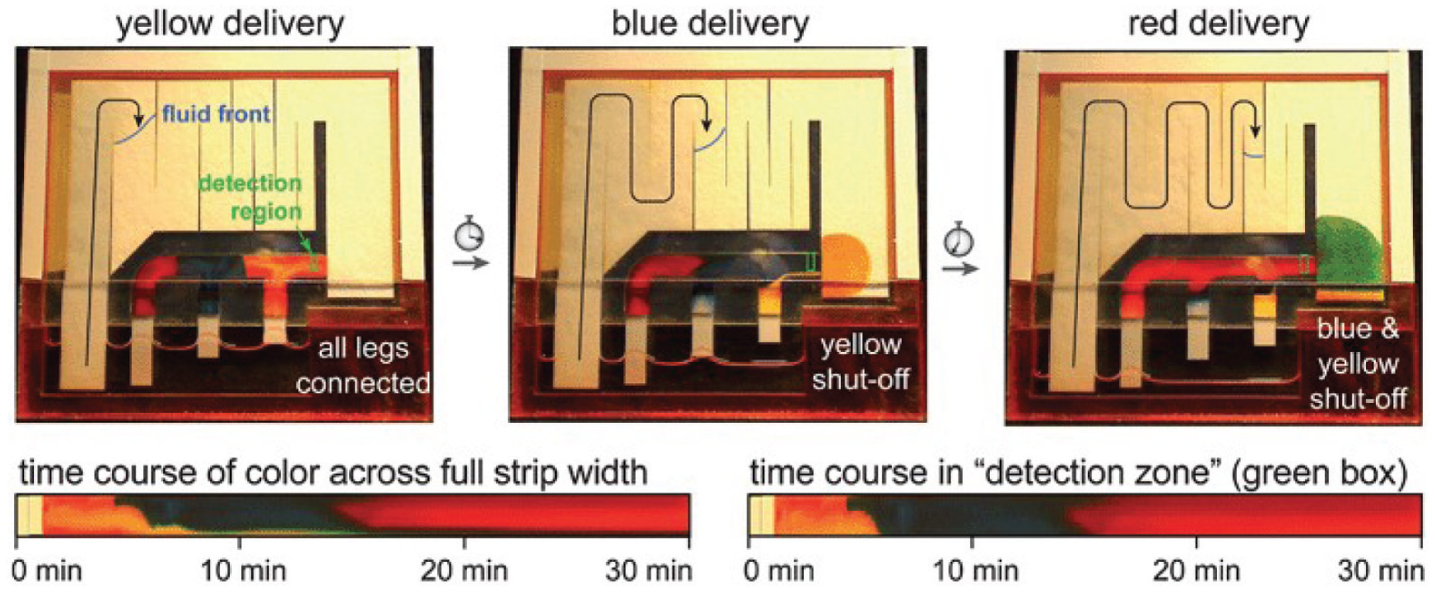
Sequential delivery of reagents using programmable disconnects. The yellow reagent (right-most and closest to the detection region) is delivered to the detection region first. As the fluid level in the source well drops, the yellow reagent pad is disconnected from the fluid source, resulting in the “shut-off” of the yellow reagent. This is followed by the delivery of the blue reagent. As the fluid level continues to drop, the shut-off of the blue reagent ensues. The red reagent is delivered last. Reproduced from Toley, B. J.; McKenzie, B.; Liang, T.; et al. Tunable-Delay Shunts for Paper Microfluidic Devices. Anal. Chem.
Aside from performing time delays in paper, there has also been a growing interest in designing paper devices with capability for more complex functions commonly found in microfluidic devices. The Yager group expanded on the idea of controlling fluid flow with paper geometry to incorporate paper-based analogs of microfluidic functions, such as micro-mixing and hydrodynamic focusing. The ability to perform these complex functions in paper extended the capabilities and applications of paper devices, allowing tests that could traditionally only be performed in a microfluidic device to be transitioned to an inexpensive, simple, paper test alternative.
Interdiffusion experiments were performed in a 2DPN Y device ( Fig. 4 ), where a different reagent was loaded onto a source pad sitting on each fork. The source pads could be positioned anywhere along the length of each fork. The distance of the reagent source pad from the central stream could be varied to alter the flow pattern and interface of the two reagents. The flow rate of each reagent could also be calculated by Darcy’s law for each inlet, which relates the flow rate to the distance between the fluid source in the fork and the central channel. Moreover, the 2DPN Y device achieved a stable interface between two reagents, demonstrating its utility in performing interdiffusion studies in paper, without the need for pumps to keep the interface between the two streams stable. 12
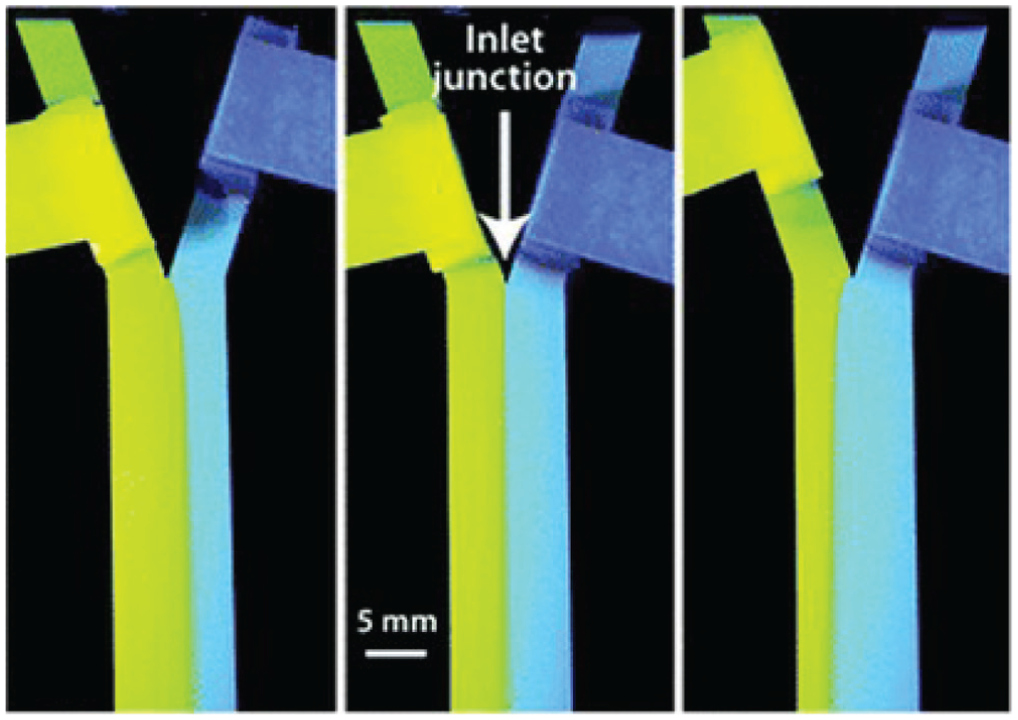
Three 2D paper network (2DPN) Y devices. The locations of the blue and yellow source pads affect the flow pattern and interface of the two reagents downstream. Reproduced from Osborn, J. L.; Lutz, B.; Fu, E.; et al. Microfluidics without Pumps: Reinventing the T-Sensor and H-Filter in Paper Networks. Lab Chip
The Yager group was also able to perform hydrodynamic focusing with a three-inlet device that resembled a three-pronged fork. Again, source pads containing reagents were placed—one on each fork—and could be positioned to adjust the flow pattern and interfaces between the reagent streams when they meet in the central channel. In this setup, the center flow stream was “pinched” between two sheath streams on each side, thereby shrinking the core stream width. This focusing method accelerated the flow rate of the narrowed core stream and also doubled the area of the interface for diffusion, thus maximizing mass transfer. Using similar concepts, the Yager group also reported achieving sized-based extraction and separation of molecules from complex mixtures, as well as rapid mixing. 12 The ability to effectively and reproducibly perform microfluidic device functions in paper systems broadens the range of tasks that can be executed in paper-based assays.
3D µPADs
While the paper devices previously discussed primarily involved fluid flow on 2D paper strips, a separate branch of paper-based devices developed by the Whitesides group makes use of 3D geometry. In 2008, the group introduced the first 3D microfluidic paper-based analytical devices—also referred to as µPADs. 13 Much like 2D paper networks, µPADs are able to incorporate more complex microfluidic paths than the original 1D lateral-flow systems. Moreover, each device can be used to measure more than one analyte. This would be useful for diagnostics in which more than one analyte needs to be simultaneously tested to give a comprehensive diagnosis.
The µPADs were assembled as a stack consisting of multiple layers of paper and water-impermeable double-sided tape. The paper layers were treated with hydrophobic polymers to channel fluid within the layers of paper, whereas holes were cut in the tape layers to facilitate the vertical flow of fluid. The alignment of each layer could be modified to allow for differing paths of fluid flow. The authors demonstrated several configurations where fluid channels were designed to cross one another multiple times in a basket-weave pattern. The µPADs allowed for the distribution of fluid both vertically and laterally, and the streams were able to cross one another without mixing ( Fig. 5 ). The average time needed for a fluid sample to wick through the device was 5 min or less. This fabrication technique allows researchers to build devices in which two or more assays can be run simultaneously and efficiently on the same µPAD and results analyzed side by side. 13
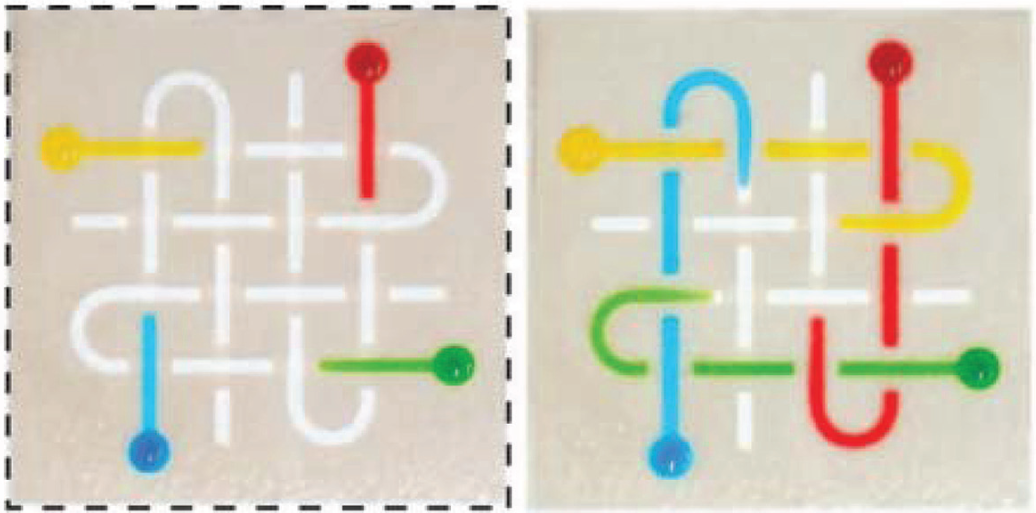
(Top) Addition of four different dyes. (Bottom) Movement of dyes through channels without mixing. Figure was obtained from Martinez, A. W.; Phillips, S. T.; Whitesides, G. M. Three-Dimensional Microfluidic Devices Fabricated in Layered Paper and Tape. Proc. Natl. Acad. Sci. U. S. A.
Having designed the µPADs to hold several assays in one, the Whitesides group also sought ways to allow users to specifically select which of the available assays to run when the sample is loaded onto the µPAD. 14 This was accomplished by using the inherent 3D structure of the µPAD, as well as single-use “buttons” incorporated into the architecture of the µPAD. As before, the µPAD consisted of alternating layers of double-sided tape and paper with photoresist-patterned channels on them. Holes punched in the tape layers created gaps between the paper layers, separating two pieces of paper from each other and keeping the fluid in the paper above from contacting and flowing into the paper below. These gaps were strategically positioned in specific points such that when the area above the gaps was compressed, the channels in the paper above the gap were forced to contact the channels in the paper below. This gap served as an architectural “button” that could connect or separate the channels and fluid flow in a vertical manner ( Fig. 6 ). However, these buttons could only be used once, since the fluid sample would wick through the selected channels completely when the button was compressed. When not compressed, the gaps successfully prevented fluid from wicking from one channel to another within a 10-min time frame. The authors used this strategy to build several configurations of channels in µPADs, which could selectively fill with the fluid sample via a system of buttons. 14
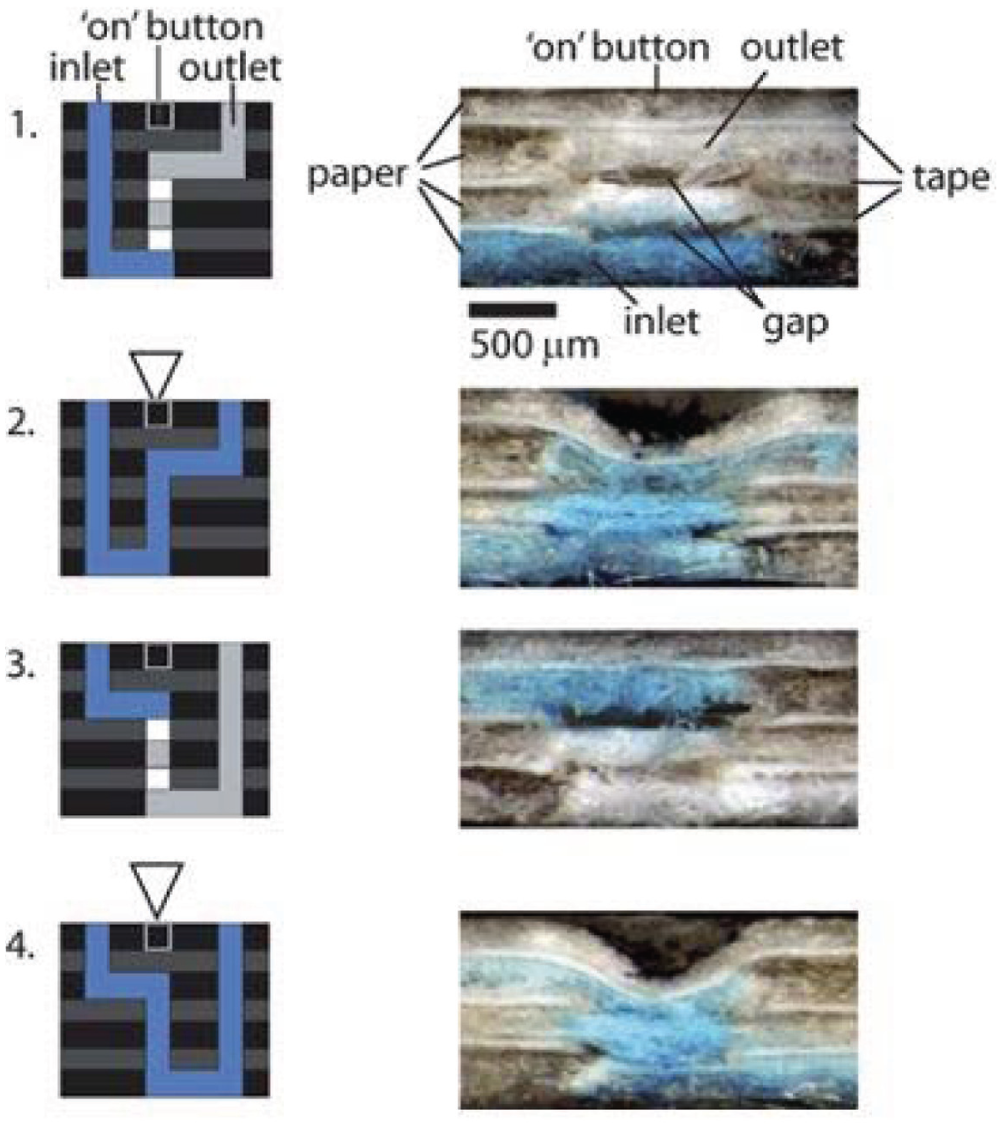
Schematic of inlet and outlet configurations incorporated with a “button,” along with the corresponding cross-sectional images of the µPAD. Reproduced from Martinez, A. W.; Phillips, S. T.; Nie, Z.; et al. Programmable Diagnostic Devices Made from Paper and Tape. Lab Chip
Chemical Patterning
Aside from altering the paper geometry in paper devices, the paper material can be patterned or treated with chemicals and reagents to give the overall paper device enhanced functions and more complex capabilities. Just as appropriate paper geometries can be designed to perform multistep assays and tunable fluid flow delays, dissolvable barriers can alternatively be patterned directly onto the paper strip to accomplish the same goals. In 2010, the Yager group demonstrated the use of dissolvable trehalose barriers and determined that wider trehalose barriers (consisting of more trehalose) resulted in a greater time delay in fluid movement. Once the barriers dissolved, however, the fluid moved freely into the region beyond, continuing at its original flow rate. 8 Similar experiments with sugar solutions ranging from 10% to 70% of saturation rendered a wide range of time delays appropriate for POC assays. 15 These time delays can be incorporated to perform multistep assays, where the timing of when one reagent is allowed to react with a second reagent is vital to the success of the assay.
As the capabilities of paper networks continued to expand, the interest in developing paper systems with complex channels to more closely mimic microfluidic devices also grew. Thus arose the need for simple, low-cost, and efficient fabrication methods to accomplish these goals. Photolithography was one of the most common, traditional ways to pattern paper for microfluidic use. In the process, paper is impregnated with photoresist and selectively polymerized by exposure to UV light to create patterned channels on the paper. Once unexposed photoresist is removed by washing with organic solvents, solutions can flow through the channels. Any hydrophobic remnants on the paper are removed through oxygen plasma treatment, ultimately rendering a hydrophilic surface. Photolithography has been demonstrated to yield good resolution, with edge roughness measurements around 15 µm, and capable of printing channel widths of ~200 µm. 3
Despite the attractive qualities of photolithography, it also possesses a number of disadvantages. Fabrication is slower than other methods and needs multiple steps. In addition, the hardened photoresist is susceptible to damages due to bending and folding, making it difficult to create shapes that are not flat. Furthermore, photolithography often requires expensive equipment and extremely clean conditions for fabrication. 12 To improve upon the concept of photolithography for prototyping paper, the Whitesides group developed FLASH (Fast Lithographic Activation of SHeets)—a photolithography-based method that requires only a UV lamp and hot plate for printing and no other conventional photolithography equipment. This method rendered channels in paper with resolutions comparable to that of traditional photolithography. Moreover, printing a sheet of paper with this method is rapid (approximately 20 min) and inexpensive (~$1.60 per sheet of paper 8.5 × 11 in.). 16
In 2009, wax printing arose as a novel patterning alternative, with the advantage of being significantly less labor intensive and much more feasible for mass production of devices. The Whitesides group first demonstrated the utility of wax printing for µPADs using a Xerox Phaser 8560N color printer to print a wax-based ink that consisted of hydrophobic carbamates, hydrocarbons, and dyes that melted around 120 °C. The wax droplets were between 50 and 60 µm in diameter when melted on the surface of the paper. Upon cooling, the wax solidified and prevented further spreading. A heating element, such as a digital hot plate, oven, or heat gun, could be used to melt the wax, such that the wax permeated through the full thickness of the paper. The melted wax could be used to form hydrophobic barriers that defined the hydrophilic channels, reservoirs, and reaction sites in the paper devices. When the printed channels and barriers were tested with solutions of acids, bases, and glycerol (pure or in solution), the fluid samples successfully wicked along the hydrophilic channels without crossing the hydrophobic wax barriers, even with a large excess of fluid. However, it should be noted that the wax barriers were not compatible with organic solvents, and therefore, these properties should be considered accordingly to fit the needs of the experimental assays. Although the resolution of the wax printing was limited in part by the porosity, thickness, and orientation of the paper fibers, it was successful in sufficiently preventing unwanted mixing or spreading of the fluid sample. 17 The Whitesides group used these wax patterning techniques to later fabricate a paper device to detect biomarkers for liver function in blood samples and later followed this study with methods to attain quantitative information from the colorimetric assays in the device.18,19 The utility of wax printing was further expanded when the group incorporated it into a novel stamping method that could be used to bring two different reagents together at a localized position to form a precipitate that could be stored on the paper. This fabrication technique offered a potential solution for the storage of metals, enzymes, or other materials for use in assays directly in paper systems. 20
Using similar wax patterning methods, the Garcia group developed a µPAD to test for periodontitis. This diagnostic quantified the levels of nitrite—a potential marker of periodontitis—in saliva by incorporating the use of the Greiss reaction. The Garcia group wax-patterned a µPAD with four arms; each arm connected a lower, circular, uptake zone to an upper, circular testing/detection zone further up the arm. Because previous experiments had indicated that the degradation of the Griess reagent during storage was a concern, the Garcia group designed the µPAD so that two of the components—sulfanilamide and N-naphthylethylenediamine dihydrochloride (NED)—that compete for reaction with nitrite could be kept separate on the µPAD until the sample contacted the µPAD. After the reagents were spotted and dried, the main channel was brought into vertical contact with the sample fluid. The separation of sulfanilamide and NED significantly minimized degradation of the Greiss reagent and allowed the sample to sequentially come into contact with each reagent, thereby ensuring the formation of the azo dye specifically in the test zone. 21
The Ratner group separately demonstrated alternative ways to chemically functionalize paper. 22 Although nitrocellulose paper is often the material selected for use in paper devices, the Ratner group recognized its limited ability to capture nucleic acids, carbohydrates, and other small molecules. Hence, to expand the range of paper functionality, the Ratner group developed a simple method for covalent immobilization on cellulose paper using divinyl sulfone (DVS) chemistry. Since DVS is a homobifunctional molecule with two electrophilic vinyl groups that exhibit cross-linking activity with nucleophiles, it can be used to facilitate covalent modification with the nucleophilic functional groups of biomolecules. To activate the cellulose paper, the cellulose papers were immersed in 10% DVS solution for 2 h and subsequently rinsed and dried. Various solutions of biomolecules, such as free reducing sugars, glycoproteins, and oligonucleotides, were then spotted onto the DVS-activated membranes. In comparing the activated to the unactivated cellulose papers, the Ratner group reported that the activated papers covalently bonded with carbohydrates experienced improved binding to lectins, while papers bonded to oligonucleotides exhibited improved binding to complementary nucleotides. The mechanical properties, such as the tensile strength, of the modified cellulose remained mostly unchanged from the unmodified papers, thus requiring no significant changes in paper handling or printing. Moreover, the modified paper was observed to retain significant bioactivity up to 30 days when stored under ambient conditions. Thus, this method broadened the spectrum of paper functionalizations possible and increased the potential applications of paper systems for molecular detection in research and diagnostics. 22 More recently, the Fu group also reported an alternative method to modifying paper surfaces. Using dynamic mask photo-curing, the Fu group presented a new way to design µPADs with different hydrophobic barrier materials. 23
Apart from patterning paper materials with necessary reagents and components, the Whitesides group also pioneered ways to treat paper to give it unique properties. 24 In 2014, the group introduced a method for developing a paper that is impermeable to water and organic liquids. Paper materials were exposed to commercially available organosilane reagents (RSiCl3) in a vacuum oven at 95 °C and 30 mbar. The alkyl trichlorosilanes were reacted with the hydroxyl-rich cellulose paper surfaces for 5 min. Using these papers, which had a 45% to 78% void volume fraction, alkyl trichlorosilane treatment yielded an omniphobic material that retained the paper’s original mechanical flexibility and low resistance to transport of gas. 24
Papers that were reacted with fluorinated alkyl trichlorosilanes were called “fluoroalkylated paper” or “RF” paper. The authors found that RF papers had an increased ability to resist wetting by low surface tension liquids (<27 mN m−1). Paper surfaces were also similarly treated with nonfluorinated alkyl trichlorosilanes to form “nonfluorinated paper” or “RH paper,” which resisted wetting by liquids with surface tensions >54 mN m−1. However, both fluorinated and nonfluorinated paper surfaces exhibited similar apparent static contact angles with water (
Papers with these omniphobic properties are desirable to combat the issue of sample retention in porous cellulose papers. In papers that do not have omniphobic properties, more than 50% of the total volume within the device is retained in the paper structure and does not reach the detection site. Although many paper devices discussed thus far rely on capillary flow for fluid transport, some processes may be incompatible with capillary flow and may be negatively affected by the high-volume retention in paper pores. Processes such as multiphase flows and/or flows of complex fluids (i.e., whole blood, colloidal suspensions that contain particulates) can thus be appropriately accommodated with devices made of omniphobic paper. 25 Most recently, the Whitesides group combined their paper silanization techniques with a novel embossing and stacking method to create 3D channels in µPADs. 26 This fabrication process was used to design systems for laminar flow, a T-device for droplet generation, or a multilayer device to facilitate 3D flow. This method essentially allowed researchers to re-create channel architectures that were commonly found in etched PDMS microfluidic devices. 26
Origami Paper Devices
Apart from the 3D µPADs pioneered by the Whitesides group, origami-folding approaches have recently emerged as a novel method to build 3D paper diagnostics. Using only one piece of paper, Liu and Crooks 27 designed a 3D microfluidic device to test for bovine serum albumin (BSA) and glucose. In their design, shown in Figure 7 , Liu and Crooks patterned paper with a frame for folding, along with reservoirs and channels for assays that line up once the device is assembled. An aluminum clamp holds the folded device together, and four separate samples can be loaded into the four different injection ports at the top of the folded device. Various solutions of dyes were loaded into the device and demonstrated to enter and travel through their designated channels without mixing. This design is advantageous in that it does not require tedious layering of paper. Rather, a single sheet can be folded by hand without special equipment and also easily unfolded to visualize results in parallel. Unlike the µPAD, it also does not require tape, thus minimizing contamination and the possibility of nonspecific adsorption. 27
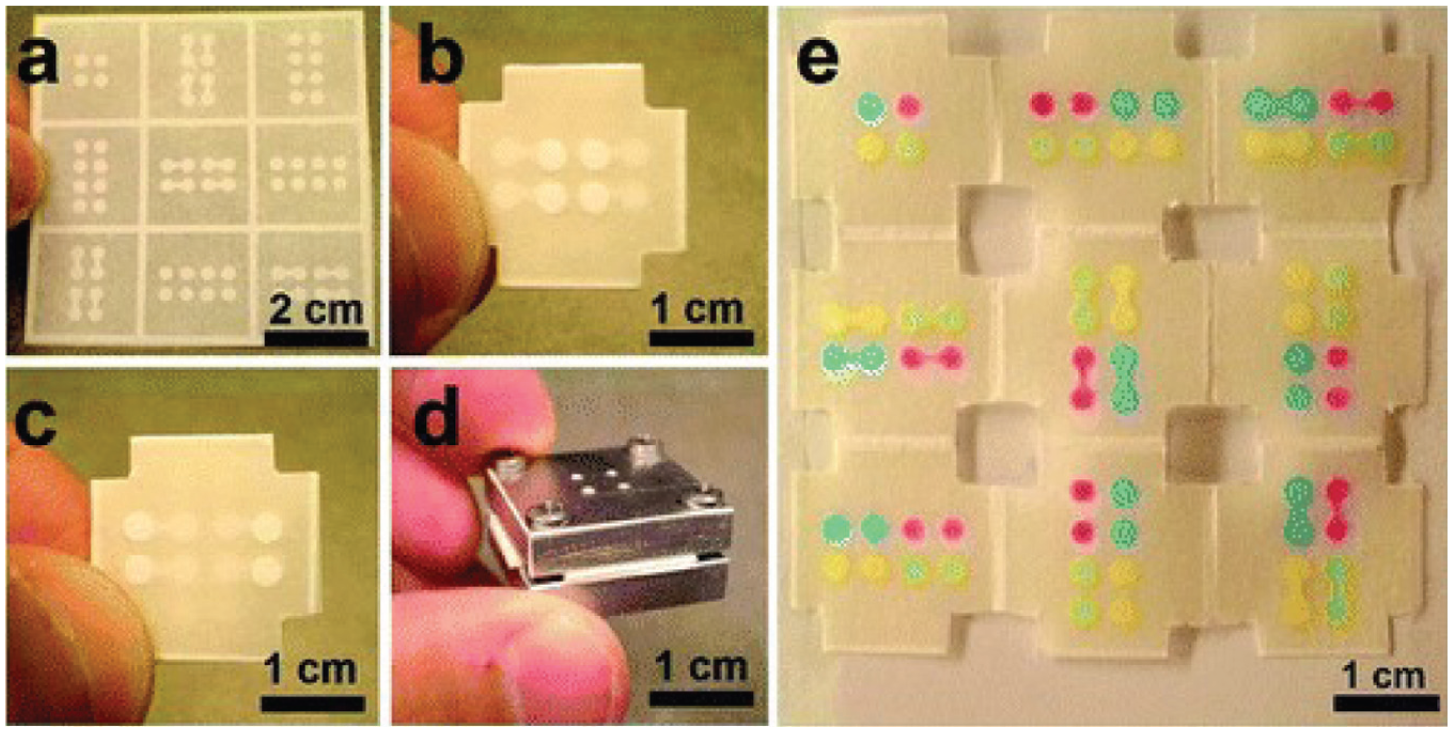
(
Similarly, the Yu group created a chemiluminescence (CL), origami-based, 3D microfluidic device to test for cancer. 28 Whole blood was mixed with a solution of antigen D to initiate agglutination. The whole-blood mixture was then added to the filter tab to separate the coagulated blood, while the rest of the sample flowed down to the test pad, which contained tests for four markers of cancer: r-fetoprotein (AFP), carcinoma antigen 153, carcinoma antigen 199, and carcinoembryonic antigen (CEA). A solution of AgNp-luminol probes that bind to the biomarkers was added to the test zones. Excess solution was removed by simply running buffer over the test pad; meanwhile, a waste tab folded underneath the test pad captured excess waste fluid and was subsequently torn off and discarded. Hydrogen peroxide was then loaded into the reagent tab adjacent to the test pad. Upon folding the reagent tab onto the test pad, the hydrogen peroxide reacted with the AgNp-luminol labels to indicate the presence of the cancer biomarkers. 28 These novel origami paper systems present a promising alternative that is compatible with multistep assays but requires minimal complex fabrication processes.
Improving Assay Sensitivity in Paper
Concentration of Biomolecules
One of the challenges in designing paper-based diagnostics is making the assay sensitive for the analyte it is trying to detect. This is especially true for detecting the presence or absence of a disease-associated biomarker that is present at low concentrations in bodily fluids. A major weakness of the LFA is that it lacks sensitivity compared with common laboratory techniques such as the enzyme-linked immunoassay (ELISA). While LFA can be applied to identify acute and chronic diseases, the lack of sensitivity prevents its widespread use for early disease detection. If the LFA is not sensitive enough and has a high detection limit, it can yield numerous false negatives. Often, the low sensitivity is a product of the concentration of the biomarkers in a sample fluid being too low, making it a challenge to detect the biomarkers. Therefore, one potential way to improve LFA sensitivity involves concentrating the biomarkers in the sample prior to LFA detection.
The Kamei group has explored the concentration of biomarkers using aqueous two-phase systems (ATPS). 29 In 2008, the Kamei group became the first to concentrate genomic DNA using a micellar ATPS. This micellar ATPS consisted of phosphate-buffered saline (PBS) and Triton X-114, a nonionic surfactant that forms cylindrical micelles in solution. Since an ATPS is used in a liquid-liquid extraction format, this concentration method is scalable and can be used with small volumes, which is ideal for POC devices. Both phases of an ATPS are also predominantly composed of water, and therefore, unlike typical oil-water solvents, each phase provides a mild environment for the biomolecules. When the temperature of a homogeneous micellar ATPS solution is increased, phase separation is induced to form microscopic micelle-poor and micelle-rich domains. These domains then coalesce and move to their respective macroscopic phases, and a schematic of a micellar ATPS is shown in Figure 8 . The Kamei group demonstrated that genomic DNA added to a micellar ATPS solution partitioned extremely to the top, macroscopic, micelle-poor phase due to experiencing greater repulsive, steric, excluded-volume interactions with the larger and more abundant micelles in the bottom, macroscopic, micelle-rich phase. The authors derived a theoretical expression for DNA partitioning that reasonably predicted the measured partitioning behavior. Since extreme partitioning behavior was observed, they were able to concentrate DNA in a predictive manner by varying the volume of the top phase divided by that of the bottom phase, or the volume ratio. Specifically, when a volume ratio of 1:9 was used, the top phase (where the DNA wants to exist within) became 1/10 of the initial volume, and DNA became concentrated by approximately 10-fold in that phase. 29
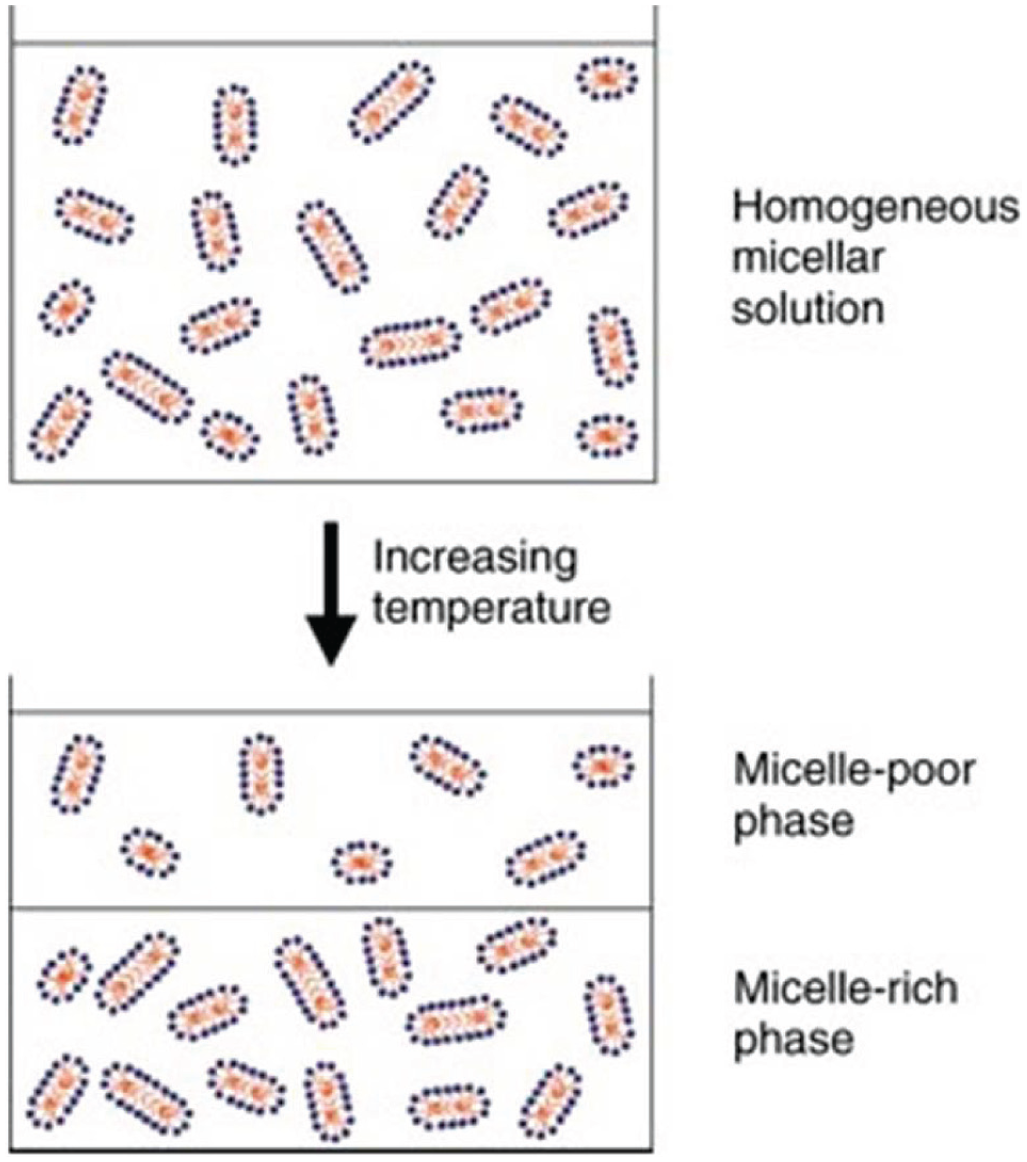
Phase separation in a micellar aqueous two-phase system (ATPS) solution. Reproduced from Mashayekhi, F.; Meyer, A. S.; Shiigi, S. A.; et al. Concentration of Mammalian Genomic DNA Using Two-Phase Aqueous Micellar Systems. Biotechnol. Bioeng.
In 2010, the Kamei group became the first to combine the technologies of ATPS and LFA. 30 Using the Triton X-114 micellar ATPS system and bacteriophage M13, they demonstrated that M13 was similarly concentrated by 10-fold into the top phase of a 1:9 volume ratio micellar ATPS. When the top phase was extracted and run on an LFA strip, this led to a 10-fold improvement in the detection limit of LFA compared with that obtained without the ATPS concentration step. 30
The micellar ATPS was then used to concentrate the model protein transferrin (Tf) and improve its detection limit. However, due to the relatively small size of the protein, Tf partitioned relatively evenly between the two phases. Therefore, to concentrate Tf in the top phase of the micellar ATPS, gold nanoparticles conjugated with antibodies, or gold nanoprobes (GNPs), were used to first capture Tf. Since the GNPs partitioned extremely into the micelle-poor phase due to experiencing greater excluded-volume interactions with the larger and more abundant micelles in the micelle-rich phase, the GNP-Tf complexes partitioned extremely into the top, micelle-poor phase. The top phase was then extracted and applied to LFA. The Kamei laboratory demonstrated with this approach that a 1:9 volume ratio could be used to improve the detection limit of Tf by 10-fold. 31
Although the results from combining the micellar ATPS and LFA were promising, the 1:9 volume ratio for the micellar ATPS takes many hours to form, rendering it inappropriate for a POC application. The Kamei group therefore investigated the polyethylene glycol (PEG)–potassium phosphate salt ATPS system. Unlike the micellar ATPS, the authors found that the phase containing the target could be extracted within 30 min for a 9:1 volume ratio, even though macroscopic phase separation equilibrium for this system was achieved after approximately 2 h. Note that a 9:1 volume ratio was used because the PEG-poor phase, which is analogous to the micelle-poor phase, is on the bottom of the PEG-salt ATPS; this is in contrast to the micelle-poor phase being on top of the Triton X-114 micellar ATPS. With a 9:1 volume ratio, M13 was concentrated 10-fold in the PEG-poor phase. Since the PEG-poor phase has a high concentration of salt, the GNPs needed to be conjugated to PEG for colloidal stability prior to mixing with the PEG-poor phase and applying to LFA. Upon performing LFA, the authors demonstrated that the 10-fold concentration translated into a 10-fold improvement in the detection limit. 32
In the case of improving the LFA detection limit of Tf with the PEG-salt ATPS, the PEG-conjugated GNPs could not be used to “fish” the Tf into the PEG-poor phase as the PEG on the GNPs experienced favorable PEG-PEG interactions with the more abundant PEG molecules in the PEG-rich phase. Accordingly, for concentrating Tf, another polymer needed to be used to impart colloidal stability to the GNPs during the phase separation process. This was not an issue for the M13 experiments as the GNPs were added after the PEG-poor phase was extracted. For these Tf partitioning experiments in the PEG-salt ATPS, dextran-coated GNPs were used as dextran provided steric stability and also favored the PEG-poor phase as dextran is more hydrophilic than PEG. Moreover, dextran had another advantage of doubling as a reducing agent in the GNP production process. Thus, GNP production—which is commonly accomplished using a citrate reduction method 33 —could be simplified by just conjugating dextran to the GNPs. When placed into the PEG-salt ATPS solution, the dextran-coated GNPs (DGNPs) partitioned extremely into the bottom, PEG-poor phase due to experiencing greater excluded-volume interactions with the greater number of PEG molecules in the top, PEG-rich phase. Just as in the micellar ATPS system, this phenomenon allowed the Kamei group to use a 9:1 volume ratio to concentrate DGNP-Tf complexes, which led to a 10-fold improvement in the limit of detection of Tf using LFA. 34
While using the PEG-salt ATPS reduced the concentration time to 30 min, it still is an additional 30 min that one would need to wait in addition to the time required for the LFA step. Moreover, another main drawback is that the concentrated sample must be extracted from the phase-separated ATPS solution with a pipette and separately applied onto LFA for detection. In an attempt to reduce the extraction time as well as user interaction, the Kamei group investigated combining the two processes directly in paper. 35 Using the PEG-salt ATPS, the authors applied a well-mixed ATPS solution containing the DGNPs and Tf directly onto a paper strip. The authors experimented with both 1:1 and 9:1 volume ratios; as before, the Tf-bound DGNPs partitioned into the PEG-poor phase. It was observed that the PEG-poor domains were able to move quickly up the strip, whereas the PEG-rich domains appeared to be held back. Although the reason for this phenomenon is unclear, it is plausible that (1) the less viscous PEG-poor domains move ahead and coalesce quickly while the more viscous PEG-rich domains remain behind and coalesce, and (2) the PEG molecules of the PEG-rich phase may have favorable interactions with the fibers of the paper, which further act to slow down the PEG-rich domains. 35
While the 1:1 solution showed noticeable separation on the paper strip, the phase separation for the 9:1 solution was less distinct. To further improve the phase separation, the authors implemented a 3D paper well consisting of layers of stacked paper ( Fig. 9 ). When the ATPS solutions were applied to the top of the 3D well, this increased the cross-sectional area normal to the fluid flow, which, in turn, would enhance the coalescing of microscopic domains. Moreover, the 3D well design allowed gravity to aid the phase separation process and also accommodated greater volumes. A marked increase in the retention of the PEG-rich phase in the top layers of the paper well and the subsequent concentration of the PEG-poor phase in the paper strip below indicated that the 3D well efficiently enhanced the phase separation procedure. In fact, macroscopic phase separation equilibrium that was achieved in approximately 2 h in a test tube for a 9:1 volume ratio was now being observed in only 6.5 min. In addition to this dramatic decrease in phase separation time, this technology removes the need for having trained personnel to extract the PEG-poor phase from the ATPS solution to apply it to LFA. This all-in-one device allows the phase separation, concentration, and detection to simultaneously and seamlessly occur on paper, and this device was demonstrated to be able to achieve a 10-fold improvement in the detection limit of Tf in less than 25 min. 35
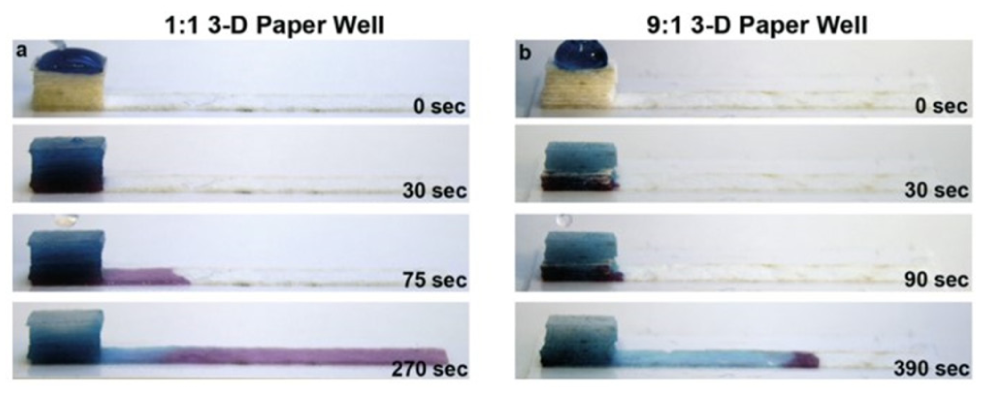
Phase separation using 3D paper wells with a (
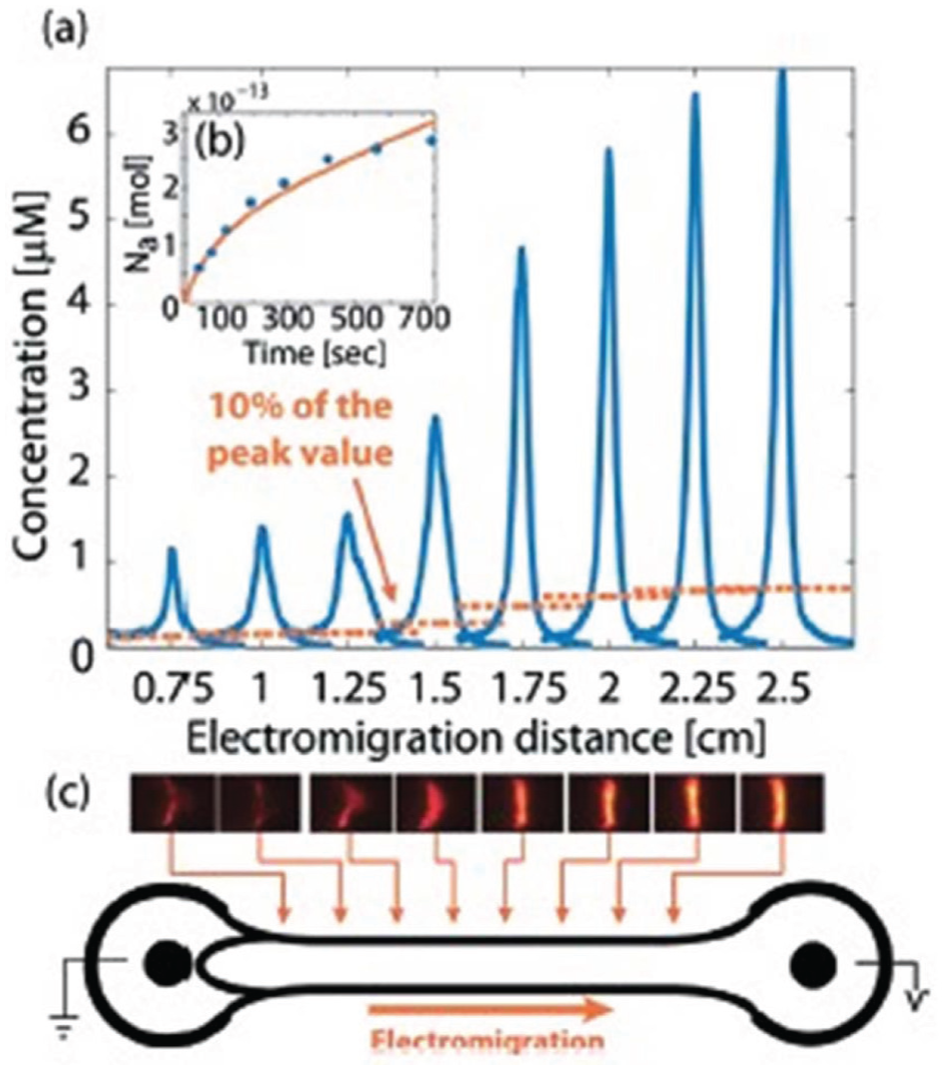
Aside from using an ATPS to concentrate biomolecules, other efforts have been made to develop electrochemical methods to concentrate analytes in paper. For instance, Rosenfeld and Bercovici 36 combined isotachophoresis (ITP) with assay-based diagnostic micropads to increase sensitivity. ITP is performed using a discontinuous buffer system, in which the sample ions migrate between a high electrophoretic mobility leading electrolyte (LE) and low electrophoretic mobility trailing electrolyte (TE). Each component of the sample solution is thus focused according to their electrophoretic mobilities on the electric field formed between the LE and TE, resulting in the simultaneous separation and preconcentration of the sample. Rosenfeld and Bercovici proposed a novel isotachophoresis µPAD, which does not need special enclosures or cooling mechanisms, and allows for 1000-fold enhancement. In this design, the LE was placed in the right reservoir and the TE in the left reservoir. Then, 200 V was applied across the channels to initiate ITP. Experiments with continuous ITP focusing were performed with a fluorescent dye in a filter paper channel. Results demonstrated that the total accumulated sample at each station of the device could be calculated by integrating all the values above 10% of the peak concentration value and multiplying by the width, depth, and porosity of the channel ( Fig. 10 ). Since the full width of each profile was established at 10% of the maximum value, the width average concentration was calculated by averaging all concentrations greater than 10% of the maximum. Using these calculations, paper-based ITP was observed to provide a 200-fold average concentration enhancement. The peak concentration—the highest concentration in a spike—was observed to increase 1000-fold with this ITP technique. 36
Results from continuous isotachophoresis (ITP) focusing of a fluorescent dye in a filter paper channel. (
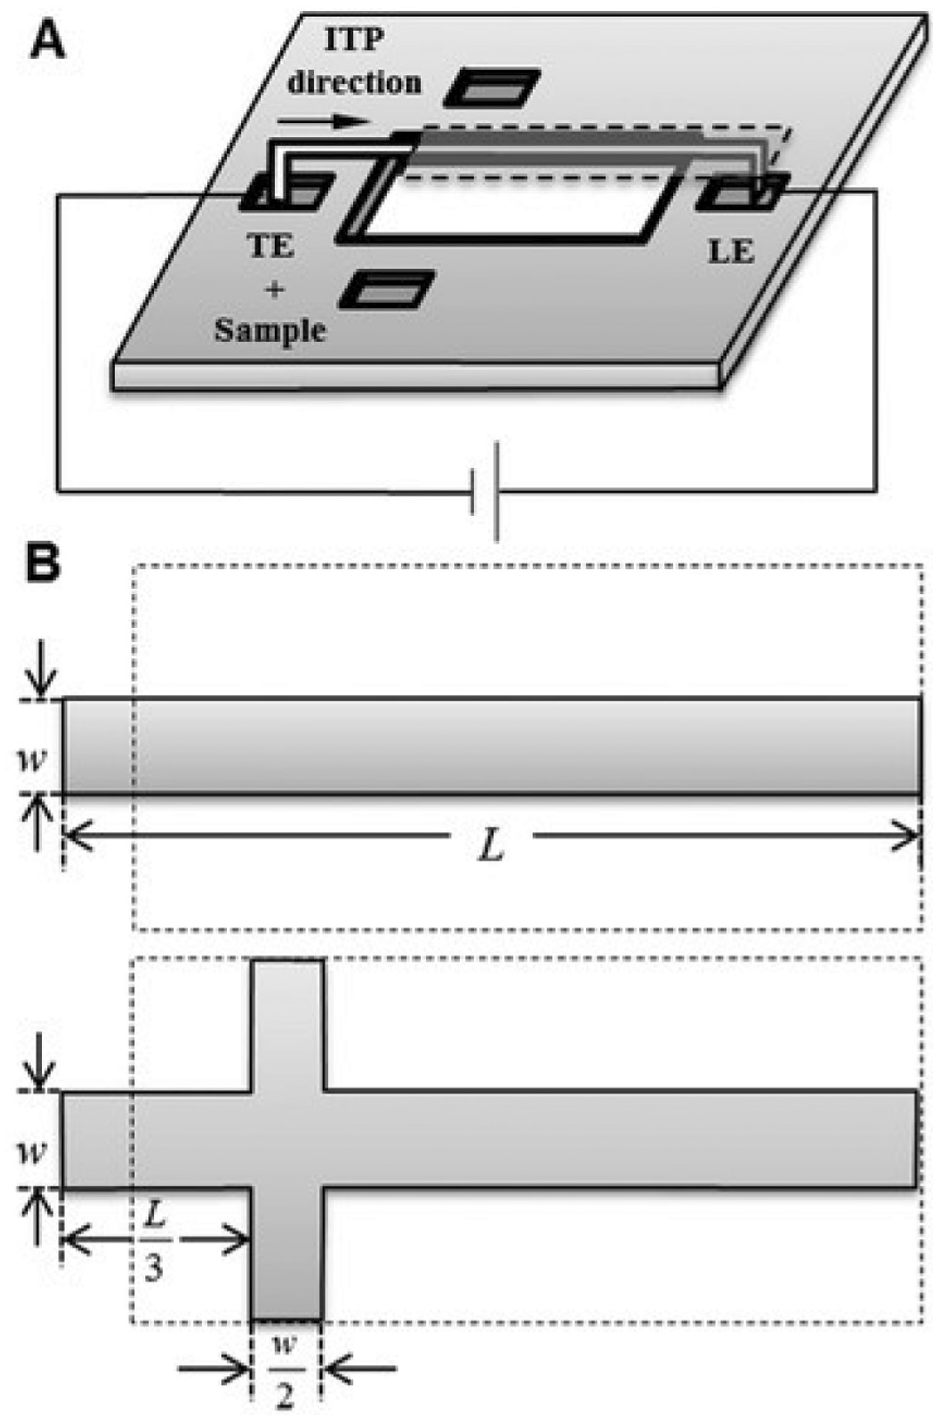
Similarly, the Posner group used isotachophoresis as a pretreatment method to preconcentrate and separate a variety of ionic compounds. 37 In this procedure, sample ions were focused between the LE (consisting of HCl in Tris buffer) and the TE (consisting of HEPES in Tris buffer), which have lower effective electrophoretic mobilities than sample ions. The solutions comprising the TE and LE electrolytes were chosen so as to maximize the range of effective mobilities, and the ion movement was due to electro-osmotic flow and moved from TE (left) to LE (right). When a voltage was applied, sample ions accumulated and were preconcentrated by electrophoresis in contiguous zones arranged in order of mobilities. The ions could then be focused using ITP in plateau or peak mode. Since plateau mode is more commonly used for high initial sample concentrations and longer focusing times, the Posner group chose to use peak mode to demonstrate focusing abilities for samples with trace levels of the analyte. A stacking ratio—the ratio of the sample concentration in the plug to its initial concentration—was used to quantify the sample concentration. The stacking ratio was found to be inversely proportional to the TE concentration due to the lower conductivity and higher electric field; however, LE concentration did not have a significant effect on the stacking ratio. In testing various TE concentrations, experiments demonstrated that ITP could not be successfully performed with TE concentrations below 1.25 mM, as this generated a high electric field in the TE zone and burned the membrane. Thus, to optimize the system for the lowest heat generation and the highest sample preconcentration, the Posner group chose an LE composition of 40 mM HCl and 80 mM Tris and TE composition of 2.5 mM HEPES and 5 mM Tris. 37
Joule heating from the generated electric fields also introduced other limiting factors to the paper ITP system. For instance, while the time required to complete the ITP can be reduced by applying a higher current, increasing the current can lead to uneven Joule heating and result in inhomogeneous physical and chemical properties on the paper membrane. Moreover, the additional heat can lead to the evaporation of the fluid sample. To combat these challenges, the authors demonstrated that a cross-shaped membrane—in which the “wings” were added and placed closer to the TE zone to minimize evaporation in that area—allowed the ITP to be performed with the current set at 1 mA and resulted in a 900-fold stacking ratio ( Fig. 11 ). Wetting the membrane through “the wings” allowed for a maintained hydration level that prevented Joule heating. The authors demonstrated that this paper ITP system could be incorporated into a POC device for effective preconcentration and could be minimally powered by a small battery. 37
Paper device design for isotachophoresis (ITP), incorporating a cross shape to minimize evaporation. Reprinted with permission from Moghadam, B. Y.; Connelly, K. T.; Posner, J. D. Isotachophoretic Preconcenetration on Paper-Based Microfluidic Devices. Anal. Chem. 2014, 86, 5829–5837. Copyright 2014 American Chemical Society.
Signal Amplification
An alternative approach to improve sensitivity of paper assays involves signal amplification. Since results of assays performed on paper are often interpreted visually with colorimetric indicators, it is imperative that the signal given is within a detectable range, whether by eye or by an external sensor. In many colorimetric assays, however, the signal may not be strong enough. Therefore, rather than increasing the concentration of the analyte in a sample solution to improve sensitivity, an alternative approach is to amplify the signal at the detection site of the paper device.
In LFA, among other immunoassays, the visualization of results is often accomplished by colorimetric indicators—such as quantum dots or blue latex beads. These colorimetric indicators are often conjugated with probes that detect the analyte. One of the most commonly used colored particles is gold nanoparticles due to their optical properties, biocompatibility, and easily modifiable surface chemistry. Gold nanoparticles that are used for diagnostic purposes usually appear red due to their surface plasmon resonance, which is the collective oscillation of electrons at the surface of a material that is stimulated by light. Small changes in the diameter of the nanoparticles lead to a shift in the wavelength of the absorbed and reflected light that affects the color of the particles. As in many LFAs, these gold nanoparticles are often incorporated into the paper device as the component that binds to a location or test line in the detection site of the device. The coloration that appears at the detection site is indicative of the presence or binding of the particles to the detection region.
Many different methods with gold nanoparticles have been explored to improve LFA sensitivity. Since the overall intensity of the test line is dependent on the number of gold nanoparticles in the area, the Kim group designed their LFA with two sets of gold nanoparticles on two separate conjugation pads to increase the concentration of gold nanoparticles at the test line. 38 The first was a gold nanoparticle that was conjugated with BSA and an anti–troponin I antibody. The second gold nanoparticle was designed to bind to the BSA on the first nanoparticle and was used to enhance the signal. This was accomplished by placing a conjugate pad containing the second type of gold nanoparticle at a position upstream of another conjugate pad containing the first type of gold nanoparticle. Figure 12 demonstrates how these two sets of nanoparticles interact with each other and the LFA. After optimization, the Kim group determined the most effective size for the gold nanoparticles to be 10 nm for the first type and 40 nm for the second type. This system was able to detect troponin at a 0.01-ng/mL concentration, which is notably lower than the 1-ng/mL detection limit achieved by conventional LFA methods. This system would be useful for testing troponin levels ranging from 0.1 to 14.27 ng/mL, which is the relevant range for patients afflicted with myocardial infarction. Unlike other amplification procedures that may require additional steps, the positioning of two conjugate pads with two types of gold nanoparticles on the LFA strip to achieve amplification retains the “one step to detection” feature that is normally associated with the LFA. 38
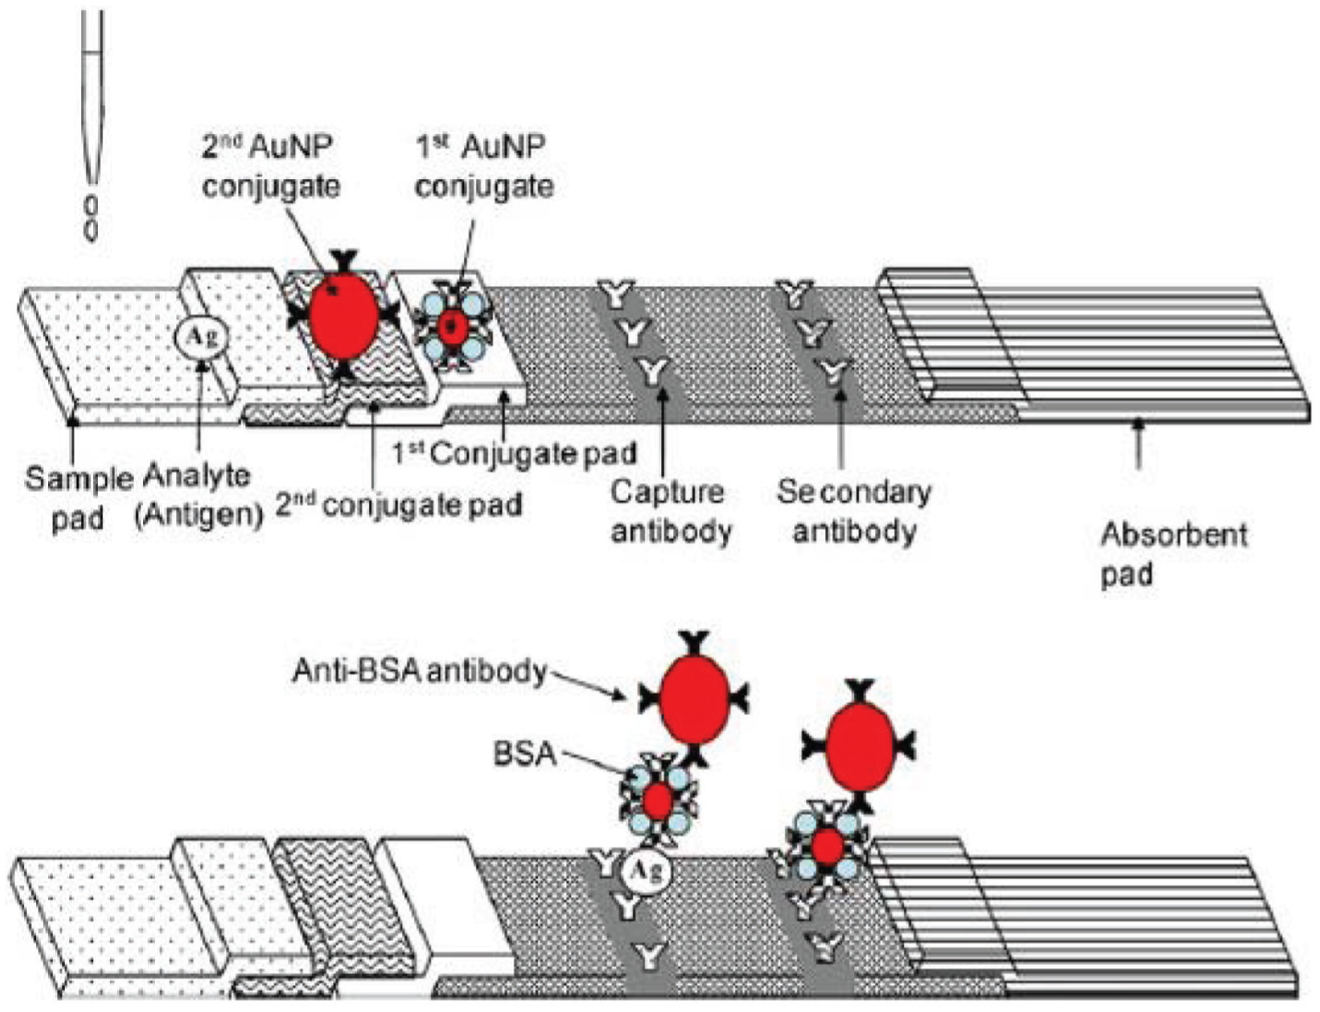
An illustration of a dual gold nanoprobe (AuNP) conjugate-based lateral-flow assay (LFA) method in the Kim study. The antigen binds to the antibody on the surface of the first AuNP conjugate before binding to the test line. In addition to the antibody, the first AuNP also has bovine serum albumin (BSA) bound to it. The first conjugate also binds to the control line. The second AuNP binds to the first conjugate at the control and test line due to the anti-BSA antibody conjugate on its surface. Reprinted from Choi, D. H.; Lee, S. K.; Oh, Y. K.; et al. A Dual Gold Nanoparticle Conjugate-Based LFA Method for the Analysis of Troponin I. Biosens. Bioelectron.
Another common way to amplify the signal is to increase the size of the gold nanoparticles that are bound to the test line. One technique to do this is through immunogold silver staining (IGSS), in which the gold nanoparticles allow for the transfer of electrons from the reducing agent to silver. This leads to the addition of silver onto the surfaces of gold nanoparticles and results in the increase of the particle diameter. The Paek group made use of this method to test for the model analyte cardiactroponin I (cTnI), a specific biomarker for acute myocardial infarction. 39 The Paek group determined that gold nanoparticles with a 5-nm diameter were optimal for IGSS, as it had the shortest reaction time with the silver solution. A cross-flow system was employed, which allowed the analyte to flow vertically and the silver-enhancing solution to flow horizontally on the LFA strip. Through the use of cross flow, the Paek group was able to improve the detection limit by about 50-fold from 0.82 ng/mL using only gold particles to 0.016 ng/mL. 39 The Tang group similarly demonstrated that silver enhancement was very effective in improving the detection of ricin from 50 ng/mL to 100 pg/mL. 40
In addition to silver, gold can also be reduced onto the surfaces of gold nanoparticles to increase their optical extinction. The Richards-Kortum group found that both silver and gold metals improved the signal-to-background ratio (SBR). 41 However, gold enhancement was specifically more effective in detecting RNA. It increased the SBR by 25% while silver enhancement only yielded a 15% improvement. 41 Similarly, the Yager group found that the use of gold enhancement solution increased the intensity of test lines from 10-fold to 46-fold. 42
The surface plasmon resonance of gold nanoparticles not only provides the particles with their color but also allows them to generate heat when exposed to optical stimulation. The light causes oscillations of free electrons at the metal-dielectric interface, and heat is generated as the electrons relax and transition from an excited to ground state. 43 The Bischof group used this property to improve the sensitivity of the LFA through thermal contrast. 44 Using a laser (0.5 W, 532 nm), they increased the temperature of the gold nanoparticles from 26.2 °C to 37 °C. This allowed the particles to be more easily visualized and improved the limit of detection of cryptococcal, which causes cryptococcal meningitis, by 32-fold. The authors believed this was especially beneficial compared to fluorescent beads, since the gold nanoparticles would not experience bleaching from continuous exposure. Bischof and coworkers also hypothesized that, by increasing the power of the laser, they could further decrease the detection limit. 44 Similarly, the Richards-Kortum group showed that performing the LFA on a heat block at 37 °C prevented nonspecific binding of the gold nanoparticles and increased contrast. 41
Another advantageous property of gold is that its surface properties can be easily modified. Researchers have used this characteristic to conjugate fluorescent probes, antibodies, and colorimetric enzymes, among others. For example, the Liu group showed that their gold nanoparticles were capable of detecting DNA concentrations on the order of nM; however, upon conjugating horseradish peroxidase (HRP) to the gold nanoparticles, a detection limit of 0.01 pM for DNA was achieved. 45 This two-step process required the addition of the substrates 3-amino-9-ethylcarbazole and H2O2, once the GNPs had reached the test line. A significant increase in color intensity was observed once the substrates were added. Furthermore, the Liu group demonstrated that conjugation of sodium dodecyl sulfate (SDS) onto the gold nanoparticles prevented particle aggregation and resulted in even greater color intensity. 45 Likewise, Chen and Wu 46 demonstrated that by creating a conjugate with multiple fluorescent dyes, the limit of detection for Cry1Ab—a type of toxic insecticidal protein in genetically modified organisms—could be significantly reduced. Other groups have similarly constructed conjugates for signal amplification to improve the limit of detection of analytes47,48 or improve uniformity of colorimetric readouts. 48
Besides amplifying the signal of test lines produced from gold nanoparticles, research is also being conducted to find other detector probes that are more sensitive than gold nanoparticles to further lower the detection limit. Other metallic nanoparticles have similar properties to gold nanoparticles and thus can also be used for LFA tests. For instance, silica nanoparticles are generally stable and can be loaded with fluorescent markers to visualize them at the test line. 49 HRP can also be conjugated to particles to further improve detection. 50 Another alternative is iron oxide (Fe3O4) nanoparticles, which have a molar absorption coefficient similar to gold nanoparticles. Unlike gold nanoparticles, however, the absorption spectrum of Fe3O4 nanoparticles does not contain any significant features and instead spans the entire visible spectrum. The absorption at all wavelengths in the visible region results in the brown color of the particles. The Gao group studied the effect of aggregated and nonaggregated magnetic Fe3O4 nanoparticles on the detection limit of paraoxon methyl for LFA. 51 The Fe3O4 nanoparticles were PEG modified and cross-linked with polylysine, which resulted in a desired aggregation behavior. Dynamic light-scattering images showed that the aggregates behaved in a relatively monodisperse manner, indicating that the aggregation could be finely controlled. The Gao group showed that the aggregated Fe3O4 nanoparticles achieved a detection limit of 1.7 ng/mL, compared to the original Fe3O4, which yielded a detection limit of 69.2 ng/mL. This corresponded to a 40-fold improvement. 51 Carbon black nanoparticles have similarly been demonstrated as another attractive option. 52
Similar to the concept of concentrating biomarkers to improve detection, the successful detection of Chlamydia trachomatis (CT) from urine samples requires amplification of DNA. To this end, the Klapperich group developed a paper-based diagnostic test for CT that performs cell lysis, cell and DNA separation, and DNA amplification all in one format. To construct this diagnostic, 3MM CHR chromatography paper was cut into 0.8 × 0.8 × 1.24–cm triangles, rolled up, and subsequently compressed into 200-µL pipette tips. These pipette tips were placed in an in-house manufactured pressure manifold. Subsequently, porous polymer monoliths (PPMs) were made using a 1.5:1 ratio of ethylene dimethacrylate cross-linker to butylmethacrylate monomer, as well as dodecanol, which acted as a porogen. The molecule 2,2′-azobis(2-methylpropionitrile) was added to initiate the free-radical polymerization of the PPM. The final solution was mixed, and 25 µL of the prepolymer solution was aliquotted into each pipette tip. These were dried for 18 h in a vacuum oven at 60 °C. Then, 600 µL of 100% methanol followed by 600 µL of 100% ethanol was used to rinse the PPMs at 20 psi to remove any unpolymerized PPMs. 53
To perform the entire sample-to-answer procedure, 10 µL of sample (serial dilutions of CT cells from 105 to 101 cells in synthetic urine) was added to 190 µL of the lysis and extraction solution consisting of 2.6 M guanidinium thiocyanate, 300 mM sodium chloride, 35% v/v 1-butanol, and 45 µg glycoblue coprecipitant. Then, 100 µL of the sample cell solution was loaded into each of the pipette tips. Under an applied pressure of 20 psi, the sample flowed through the pipette tip, while the glycogen and DNA coprecipitated onto the paper or polymer supports. In samples containing 105 cells, it was determined that, on average, 4.4% of the total DNA was collected in the initial flowthrough (range, 0%–11%). 53
Following cell lysis and filtration, isothermal helicase-dependent amplification (tHDA) was also performed in pipette tips. For this procedure, the bases of the pipette tips were first sealed with waterproof adhesive. Subsequently, 25 µL tHDA master mix solution was added to the captured cells and overlaid with mineral oil. The tips were sandwiched between two toe warmers, and the entire setup was housed in a Styrofoam cup. After 35 min, the tips were removed and placed onto ice to end the reaction. To release the amplified samples, the adhesive was removed from the bottom of the tip, and the samples were pushed through the paper support at 20 psi and collected in a separate tube. This electricity-free setup yielded amplification results comparable to that achieved with a set of amplifications performed in parallel on a 65 °C dry-block heater. Then, 10 µL of the collected solution containing the tHDA amplicons was applied to lateral-flow detection (LFD) strips with antibodies against FAM and biotin, followed by the addition of 200 µL of the manufacturer-supplied buffer solution. Detection lines on the LFD strips were visible by eye after a 10-min incubation period at room temperature. A schematic of the assembly and detection process of the diagnostic is shown in Figure 13 . 53
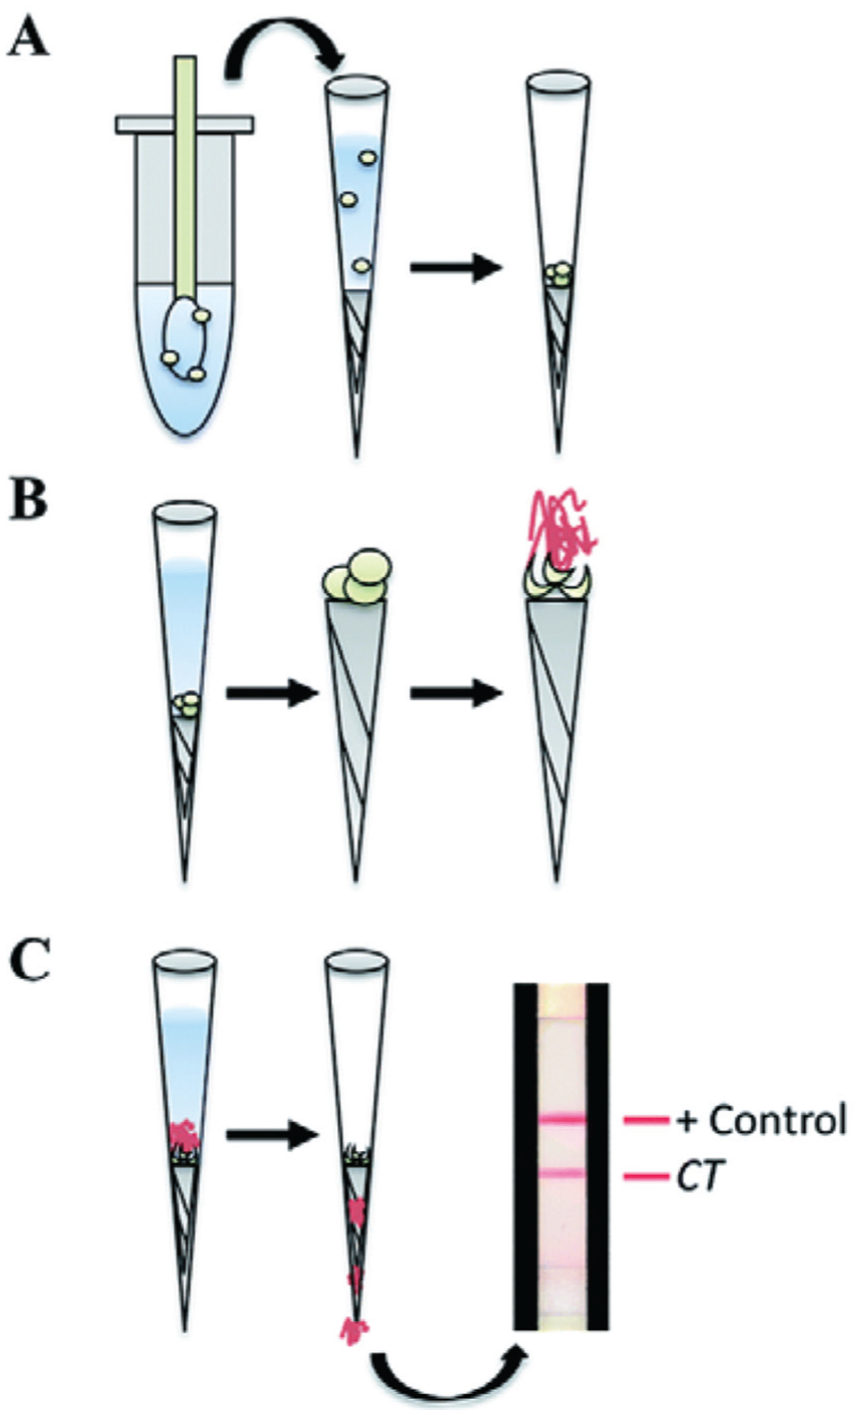
Schematic of the assembly process and method of detection. (
This entire sample-to-answer process could be performed within 50 min and required only 325 µL of liquid. The band intensities were quantified using a Versadoc Gel Imager (Hercules, CA) and ImageJ analysis. The Klapperich group demonstrated that their system was able to amplify and detect whole CT cells from samples with as few as 50 cells per 0.2-mL tube. 53 Using amplified flowthrough samples, a detection limit of 10,000 cells was observed via lateral-flow detection. This corresponds to a diagnostic that has a detection limit that is 100 times more sensitive than current rapid immunoassay diagnostics for CT. With this setup, the Klapperich group demonstrated an electricity-free paper-based CT assay that could be used to extract and amplify CT cells with only chromatography paper, pipette tips, a positive pressure supply, and heat source. 53
Electrochemical Devices
Although most colorimetric assays performed on paper-based devices now use cameras to record the color intensity of the results and perform quantitative analysis, the camera images are easily affected by lighting and therefore still lack proper sensitivity and selectivity. To address this problem, the Henry group proposed the use of electrochemical detection (ECD). 54 The advantages of ECD include its small size, low cost, and high selectivity and sensitivity. In addition, it only requires minimal instrumentation and low electrical power for in-field use. The Henry group used an ECD system to determine the levels of glucose, lactate, and uric acid on paper. Using photolithography, carbon ink was printed to form the working electrode (WE) and the counter electrode (CE), while silver/silver chloride ink was printed to form the reference electrode (RE) and conductive pads ( Fig. 14 ). The working electrode and the reference electrodes were designed as similarly as possible to reduce the effect of uncompensated resistance between the two. The counter electrode was designed to be larger to allow unlimited current transfer in the circuit. All electrodes were printed so that the working part of the electrode was on the hydrophilic portion of the paper. To simultaneously test for lactate, uric acid, and glucose, three sets of these electrodes were connected via hydrophilic channels. Solutions of the enzymes lactate oxidase, uricase, and glucose oxidase were spotted into their reaction areas to catalyze the oxidation of lactate, uric acid, and glucose, respectively. To perform the analysis of a sample solution, 5 µL of the sample solution was dropped on the center of the paper device and flowed to each test zone. Each analyte reacted with its respective enzyme to produce hydrogen peroxide. The H2O2 produced was then measured with direct current chronoamperometry via the cathodic reduction of H2O at the screen-printed carbon Prussian blue–mediated electrodes. 54
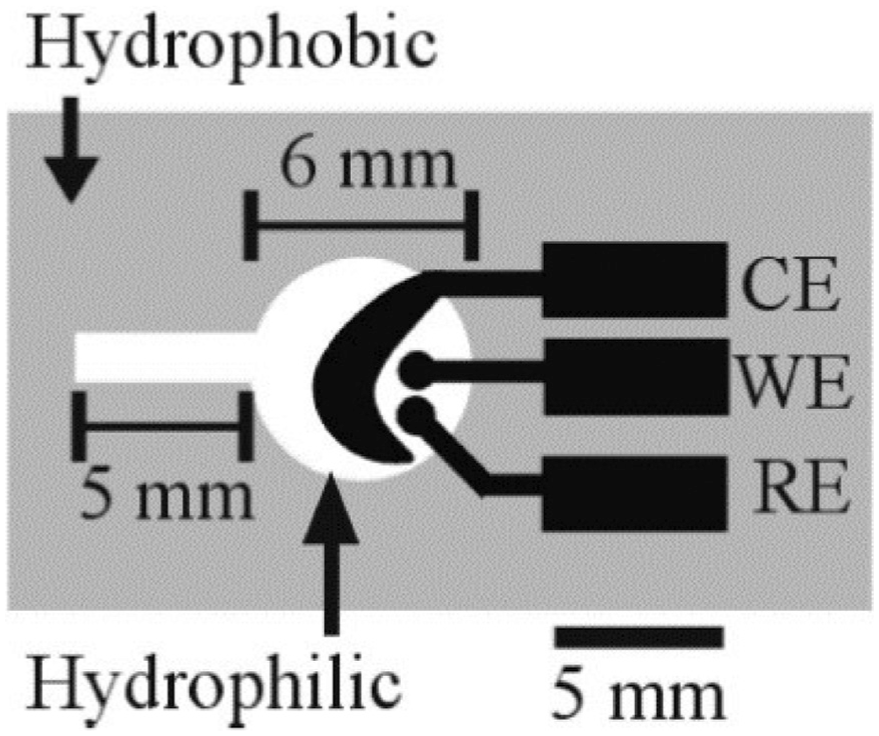
The basic design for an electrochemical cell used by the Henry group to test for glucose levels. CE, counter electrode; WE, working electrode; RE, reference electrode. Reprinted with permission from Dungchai, W.; Chailapakul, O.; Henry, C. S. Electrochemical Detection for Paper-Based Microfluidics. Anal. Chem.
The Henry group established a linear calibration curve between the H2O2 concentration and the anodic current. 54 This was used to determine a working range for peroxide detection and define the relationship of the anodic current to the concentration of the three analytes within the concentration range of 0 to 100 mM. The limit of detection (LOD) for glucose was determined to be 0.21 mM, which was notably lower than the camera-detected LOD of 0.5 mM. The LOD of lactate and uric acid was 0.36 mM and 1.38 mM, respectively. Although the LODs for lactate and uric acid were higher than those detected by other conventional assays, these values were within the range for where normal levels of lactate and uric acid lie in blood and urine, respectively. The results demonstrate the potential for paper-based electrodes to be incorporated to improve quantitative biosensing in paper systems. 54 One of the downfalls of electrochemical detection, however, is that it may not be able to detect all the species present in a complex sample. To help combat this issue, the Henry group later also designed a paper device that combined the previously designed electrochemical detection system with colorimetric analysis to screen multianalyte solutions. 55 Other groups have more specifically designed a multianalyte detection system for analyzing urine samples.56,57 Alternative methods for electrochemical device fabrication, design, and application have also been suggested.58,59
Improving Sensitivity for Blood Sample Analysis
Detection of diseases in blood samples has been a common and primary diagnostic scheme in hospitals and clinics. Therefore, there has also been an interest in making equipment-free paper systems that are specifically compatible for performing various functions and tests with blood samples. However, paper-based devices for evaluating blood samples can similarly suffer from issues with poor sensitivity that render it ineffective for making quantitative measurements. The Steckl group developed a simple LFA for measuring anticoagulation efficacy in patients with cardiovascular disease. 60 When human blood leaves the vascular system, it clots within 2 to 6 min via a coagulation cascade that depends on free Ca2+ ions. Thus, the Steckl group’s device sought to improve quantitative detection of blood coagulation by expanding the linear range of Ca2+ concentration measured in LFA. In these experiments, various amounts of CaCl2 were added to noncoagulating rabbit blood containing citrate to investigate the coagulation process. The more calcium that was added, the slower the blood proceeded up the LFA strip, while the plasma traveled much faster and was generally unaffected by the calcium ions. The same experiments were also performed with dextran to show that the clotting process was unique to the blood, and the viscosity of other fluids remained unaffected. Using the CoaData 2000 Fibrintimer, (Durham, NC) the authors determined that, between 200 and 250 mM of CaCl2, the plasma starts to experience significant clotting. Below these concentrations, the plasma does not clot or takes longer than the detectable clotting time (16 min). In contrast, the red blood cells (RBCs) experience a linear-dependent clotting behavior for CaCl2 concentrations between 0 and 250 mM and clot within 100 to 200 s. The Steckl group thus demonstrated that they were able to achieve a linear response for coagulation diagnosis and a wider detection range compared with that of conventional plasma clotting measurements. 60
Since paper-based assays often have colorimetric readouts, it is also important that the coloration of the blood sample does not interfere with the readout results. Accordingly, the separation of plasma from the RBCs is necessary, because the intense color of RBCs can affect the colorimetric assay results, particularly those that use indicators that are colored red or pink. Conventional methods for separating plasma from whole blood involve the use of centrifugation or magnetic separation, which, although effective, requires an additional user step. A common way to separate blood on paper is through filters. The properties of healthy RBCs cause them to be extremely deformable. Therefore, to properly block RBC passage, the pores must be less than 2.5 µm in diameter. However, this may also hinder the plasma flow through the pores and decrease plasma separation efficiency. Due to this problem, the Shevkoplyas group decided to separate plasma from whole blood using agglutinating anti-A,B monoclonal antibodies. 61 The antibodies caused RBCs of type A and B to aggregate and prevented them from passing through the filters while the plasma continued to flow down the strip via capillary flow. To determine the plasma separation efficiency, defined as the ratio of the width of the plasma band to the diameter of the RBC aggregate, whole-blood samples were mixed with different concentrations of antibodies. It was found that the highest concentration of antibody (1:64 titer solution supplied by the manufacturer) achieved the highest ratio. The Shevkoplyas group then fabricated a µPAD device, shown in Figure 15 , that had agglutinating antibodies in the center and colorimetric assays for glucose in three of the readout zones. In the colorimetric assay, glucose oxidase caused the oxidation of glucose to hydrogen peroxide, and then horseradish peroxidase catalyzed the reaction of hydrogen peroxide with potassium iodide to yield a brown color. The fourth zone served as the control, which was only treated with PBS. The device only required 7 µL of whole blood—the volume that can be obtained from a finger prick—and the plasma in the sample filled the entire device. The color obtained from the three readout zones was compared to the control using a scanner and MATLAB program. The concentration of glucose in whole blood was determined to be 89.5 ± 4.7 mg/dL, which was comparable to the 82.5 mg/dL measured by a spectrophotometer. Although this device has the potential to be a stand-alone diagnostic device, one caveat of this current design was its inability to agglutinate type O blood, which accounts for about 44% of the population. 61 In 2013, the Shevkoplyas group later also developed µPAD devices to test for sickle cell disease (SCD) and sickle cell trait (SCT) carriers, 62 as well as anemia. 63
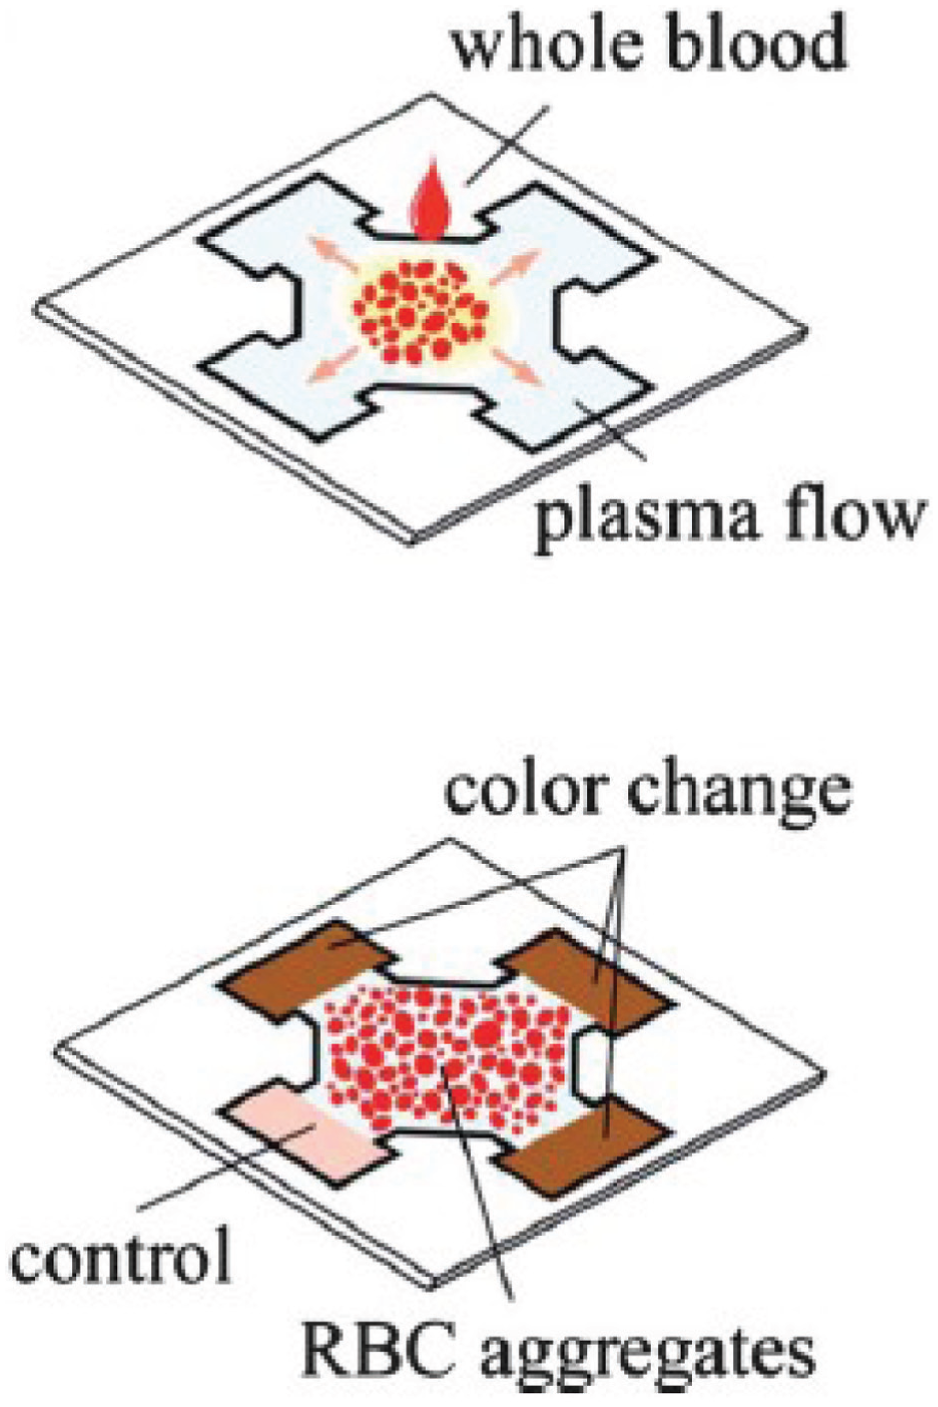
A schematic of the Shevkoplyas device is shown here. In total, 7 µL of whole blood was added to the center of the device. The plasma flowed to the three readout zones, where a colorimetric assay determined the concentration of glucose. This was then compared with the color intensity in the control zone, which was treated only with phosphate-buffered saline. Reproduced from Yang, X.; Forouzan, O.; Brown, T. P.; et al. Integrated Separation of Blood Plasma from Whole Blood for Microfluidic Paper-Based Analytical Devices. Lab Chip
In conclusion, the development of paper-based diagnostics has great potential in reshaping and expanding the capabilities of point-of-care diagnostics. With the ever-increasing demand for rapid and inexpensive diagnostics to detect infectious diseases, environmental toxins, biowarfare agents, and several other types of compounds, there is a burgeoning need to develop fabrication techniques to design paper-based technologies with the necessary functions to achieve these purposes. Much progress has been made in advancing paper diagnostics. Physical paper shaping and chemical patterning approaches to control fluid flow in 2D paper networks and 3D µPAD systems have yielded capabilities that were once restricted to microfluidic devices. As these fabrication techniques advance, tests that were previously reserved for microfluidic devices could be performed more inexpensively in paper-based analogs. Challenges with low assay sensitivity in paper systems are also being overcome.
Novel methods to concentrate analytes—ranging from incorporating aqueous two-phase systems to concentrate samples prior to LFA detection to performing isotachophoretic focusing of ions directly on paper—have been used to improve the limits of detection. Alternatively, signal amplification has also been demonstrated to improve assay sensitivity. Notable research efforts have been directed toward amplifying colorimetric signals with various types of nanoparticles and conjugates. Electrochemical devices have also been introduced to improve limits of detection and extract quantitative information from colorimetric assays. The development of these fabrication techniques and novel paper device designs shows great promise for the continued growth and expansion of paper diagnostic utility and capabilities in the future.
Footnotes
Declaration of Conflicting Interests
The authors declared no potential conflicts of interest with respect to the research, authorship, and/or publication of this article.
Funding
The authors received no financial support for the research, authorship, and/or publication of this article.