
Abstract
Malignant tumors are complex tissues composed of malignant cells, vascular cells, structural mesenchymal cells including pericytes and carcinoma-associated fibroblasts, infiltrating immune cells, and others, collectively called the tumor stroma. The number of stromal cells in a tumor is often much greater than the number of malignant cells. The physical associations among all these cell types are critical to tumor growth, survival, and response to therapy. Most cell-based screens for cancer drug discovery and precision medicine validation use malignant cells in isolation as monolayers, embedded in a matrix, or as spheroids in suspension. Medium- and high-throughput screening with multiple cell lines requires a scalable, reproducible, robust cell-based assay. Complex spheroids include malignant cells and two normal cell types, human umbilical vein endothelial cells and highly plastic mesenchymal stem cells, which rapidly adapt to the malignant cell microenvironment. The patient-derived pancreatic adenocarcinoma cell line, K24384-001-R, was used to explore complex spheroid structure and response to anticancer agents in a 96-well format. We describe the development of the complex spheroid assay as well as the growth and structure of complex spheroids over time. Subsequently, we demonstrate successful assay miniaturization to a 384-well format and robust performance in a high-throughput screen. Implementation of the complex spheroid assay was further demonstrated with 10 well-established pancreatic cell lines. By incorporating both human stromal and tumor components, complex spheroids might provide an improved model for tumor response in vivo.
Keywords
Introduction
Pancreatic cancer is currently the third deadliest cancer in the United States 1 and is anticipated to become the second leading cause of cancer-related deaths in Western countries within this decade. 2 Among the cancers reported by the American Cancer Society, pancreatic cancer has the lowest 5-year relative survival rate at 8%. 3 First-line therapies for metastatic pancreatic cancer include gemcitabine, nab-paclitaxel with gemcitabine, or FOLFIRINOX, but second-line therapies are eventually necessary. 4 New therapeutics are required that can overcome the resistance of pancreatic cancer to current treatment regimens. Between 2006 and 2015, only 5.1% of oncology drugs progressed from phase I to U.S. Food and Drug Administration (FDA) approval (n = 3163), primarily due to a lack of safety or efficacy. 5 This emphasizes the need for improved preclinical tumor models with a greater capacity to predict safety and efficacy in patients. Monolayer assays with malignant cell lines are well suited for high-throughput screening (HTS) and have provided critical mechanistic insights to cancer biology and the mechanism of action for anticancer agents. 6 However, growing malignant cells as monolayers alters their growth kinetics, metabolic rate, 7 gene expression,8–10 and protein expression. 11 Also, responses to pharmacological agents are influenced by factors at the cellular and environmental levels.12–16 The interactions of malignant cells with nonmalignant cells and extracellular components that comprise the stroma are referred to as the tumor microenvironment, 17 which is considered a hallmark of cancer biology. 18 While the stroma appears to counteract the progression of tumors, it also impairs drug delivery to the tumor and provides an immunosuppressive environment, protecting the tumor from immunotherapy agents. Therapeutic strategies are under investigation for pancreatic cancer that exploit the stroma to enhance drug delivery to the tumor.4,19–21 Therefore, the tumor microenvironment influences the efficacy of chemotherapeutics and should be considered during the early preclinical stage of development. Indeed, the underutilization of preclinical models incorporating clinically relevant tumor–microenvironment interactions has been attributed to the limited success in translating preclinical efficacy studies to the clinic.22–24
Tumor spheroid models are three-dimensional clusters of malignant cells that have been used for decades to incorporate more of the complexity of tumors, including physiological features such as cell heterogeneity and cell–cell interactions, as well as cellular characteristics such as metabolism and gene expression into a model useful for drug testing.24–26 Therefore, tumor spheroid models combine the throughput advantages of an in vitro model with characteristics that better approximate in vivo tumors than do monolayer cultures of malignant cells, including the cellular organizational structure, hypoxia, and nutrient gradients. 7 Simple spheroids, grown using cancer cell lines, have morphologies that can vary widely from compact to diffuse depending on the characteristics of the cell line.27–29 Heterotypic or complex spheroids can also be grown from multiple cell types.30–36 The incorporation of stromal cells into tumor models has been shown to affect the proliferation, intracellular signaling, and gene expression of the malignant cells.25,33,37,38 Including stromal cells in the tumor spheroid model increased malignant cell survival and resistance to anticancer agents,30–32 which may reflect more physiologically relevant pharmacological responses. Here we describe the development, optimization, and validation of a complex tumor spheroid assay, incorporating both human malignant and stromal cell components, for HTS. Assay development and validation focus on the patient-derived cell line K24384-001-R, an adenocarcinoma of the pancreas obtained from a metastatic site in the liver. Human umbilical vein endothelial cells (HUVECs) and human mesenchymal stromal cells (hMSCs) are also incorporated into the model to establish a stromal component. The use of this robust assay is further demonstrated with a variety of other pancreatic malignant cell lines. More broadly, the assay methodology described here can be adapted for use with malignant cell lines derived from other solid tumor types and might serve as an improved model of in vivo tumor responses.
Materials and Methods
Cell Lines
The patient-derived pancreatic adenocarcinoma cell line K24384-001-R was received from the National Cancer Institute (NCI) Patient-Derived Models Repository (PDMR https://pdmr.cancer.gov). The cancer cell lines AsPC-1 (ATCC cat. CRL-1682, RRID:CVCL_0152), BxPC-3 (ATCC cat. CRL-1687, RRID:CVCL_0186), Capan-1 (ATCC cat. HTB-79, RRID:CVCL_0237), Capan-2 (ATCC cat. HTB-80, RRID:CVCL_0026), CFPAC-1 (ATCC cat. CRL-1918, RRID:CVCL_1119), HPAC (ATCC cat. CRL-2119, RRID:CVCL_3517), HPAF-II (ATCC cat. CRL-1997, RRID:CVCL_0313), MIA PaCa-2 (ATCC cat. CRL-1420, RRID:CVCL_0428), PANC-1 (ATCC cat. CRL-1469, RRID:CVCL_0480), and SU.86.86 (ATCC cat. CRL-1837, RRID:CVCL_3881) were purchased from the American Type Culture Collection (ATCC, Manassas, VA). HUVECs, pooled donor (Lonza cat. CC-2519), hMSCs (Lonza cat. PT-2501), and their corresponding recommended media EGM-2 Endothelial Cell Growth Medium-2 BulletKit (Lonza cat. CC-3162) and MSCGM Mesenchymal Stem Cell Growth Medium BulletKit (Lonza cat. PT-3001) were purchased from Lonza (Walkersville, MD). Green fluorescent protein–expressing human umbilical vein endothelial cells (GFP-HUVECs; Neuromics cat. GF01) and red fluorescent protein–expressing human bone marrow–derived mesenchymal cells (RFP-hMSCs; Angio-Proteomie cat. cAP-0050RFP) were purchased from Neuromics (Edina, MN) and Angio-Proteomie (Boston, MA), respectively.
Compounds
The compounds afatinib (NSC750691), AMG-232 (NSC781515), ceritinib (NSC776422), cobimetinib (NSC768068), erlotinib (NSC718781), gemcitabine (NSC613327), GSK-525762 (NSC774829), lapatinib (NSC745750), LY-2835219 (NSC768073), MK-1775 (NSC754352), navitoclax (NSC759659), osimertinib (NSC779217), R-428 (NSC824183), rucaparib (NSC756644), staurosporine (NSC755774), and vinorelbine (NSC608210) were obtained from the Developmental Therapeutics Program, NCI. FDA-approved anticancer drugs are available from the NCI at http://dtp.nci.nih.gov/branches/dscb/oncology_drugset_explanation.html. The drugs used in this study were demonstrated to be >95% pure by proton nuclear magnetic resonance (NMR) and liquid chromatography/mass spectrometry (LC/MS). Stock solutions were prepared at 400× in DMSO, stored at −70 °C, and diluted in fresh medium prior to their use. The final concentration of DMSO never exceeded 0.25% (v/v).
Cell Culture
All cells were maintained in an incubator at 37 °C and 5% CO2 with 95% humidity. The patient-derived K24384-001-R pancreatic cancer cell line was maintained in DMEM Complete medium (DC medium): Dulbecco’s modified Eagle’s medium (DMEM)/F12 (Invitrogen, Waltham, MA, cat. 12634-010) supplemented with 5% fetal bovine serum (FBS) (Hyclone Laboratories Inc., Logan, UT, cat. SH30071.03 heat inactivated), 2 mM L-glutamine (Invitrogen cat. 25030-081), 100 U/mL penicillin and 100 µg/mL streptomycin (Invitrogen cat. 15141022), 0.4 µg/mL hydrocortisone (Sigma-Aldrich, St. Louis, MO, cat. H4001), 10 ng/mL epidermal growth factor (EGF) recombinant human protein (Invitrogen, Gibco cat. PHG0313), 24 µg/mL adenine (Sigma-Aldrich cat. A2786), and 0.1 mg/mL primocin (InvivoGen, San Diego, CA, cat. ant-pm-2). During recovery from frozen stock vials, K24384-001-R was cultured in the same medium containing 10 µM Y-27632 (Tocris Bioscience, Bristol, United Kingdom, cat. 1254). The cancer cell lines AsPC-1, BxPC-3, and Su86.86 were maintained in RPMI-1640 (Invitrogen cat. 22400-105) with 10% FBS (Hyclone cat. SH30070.03). Capan-1 was maintained in Iscove’s modified Dulbecco’s medium (IMDM) (Lonza cat. 12-722F) with 20% FBS (Hyclone cat. SH30070.03). Capan-2 was maintained in McCoy’s 5A modified media (Invitrogen cat. 16600-108) with 10% FBS (Hyclone cat. SH30070.03). CFPAC-1 was maintained in IMDM with 10% FBS (Hyclone cat. SH30070.03). HPAC was maintained in DMEM/F-12, HEPES (Life Technologies Corporation, Grand Island, NY, cat. 11330-032) with 5% FBS (Hyclone cat. SH30070.03), 2.0 mM L-glutamine (Invitrogen cat. 25030-081), 5 µg/mL ITS Premix Universal Culture Supplement (Corning Inc., Corning, NY, cat. 354350), 10 nM hydrocortisone (Sigma-Aldrich cat. H6909), and 10 nM β-estradiol (Sigma-Aldrich cat. E2257). HPAF-II was maintained in Eagle’s minimum essential medium (EMEM) (ATCC cat. 30-2003) with 10% FBS (Hyclone cat. SH30070.03). The cancer cell line MIA PaCa-2 was maintained in DMEM (Invitrogen cat. 11965-118) with 10% FBS (Hyclone cat. SH30070.03) and 2.5% horse serum (Invitrogen cat. 16050-130). PANC-1 was maintained in DMEM with 10% FBS (Hyclone cat. SH30070.03). HUVECs and GFP-expressing HUVECs were maintained in EGM-2 Endothelial Cell Growth Medium-2 BulletKit (Lonza cat. CC-3162) while hMSCs and RFP-expressing hMSCs were cultured in MSCGM Mesenchymal Stem Cell Growth Medium BulletKit (Lonza cat. PT-3001). For all experiments, primary human cells were used up to passage 5, and K24384-001-R cells were used up to passage 10. Short tandem repeat (STR) profiling of K24384-001-R cells was performed by the NCI PDMR. Mycoplasma testing was routinely performed with all cell lines using the MycoAlert Mycoplasma Detection Kit (Lonza cat. LT07-218).
Optimization of Cell Seeding Densities and Viability Studies in a 96-Well Format
All cells were maintained as described above. Exponentially growing K24384-001-R pancreatic cells were harvested using TrypLE Express (Invitrogen, Gibco cat. 12605036). The cells were resuspended in fresh DC medium and counted using trypan blue and a hemocytometer. To determine plating densities and doubling times for simple monolayers and spheroids, 120 µL medium containing 500, 750, 1000, 1500, or 2000 cells were dispensed into the wells of 96-well flat clear-bottom black polystyrene TC-treated microplates (Corning cat. 3904) for simple monolayers or 96-well black/clear round-bottom ultra-low attachment (ULA) surface spheroid microplates (Corning cat. 4520) for simple spheroids. Technical triplicates were included for each condition tested. For complex monolayers and spheroids, 60% K24384-001-R pancreatic cells were combined with 25% HUVECs and 15% hMSCs in 60% DC medium with 25% EGM-2 and 15% MSCGM media (v/v/v). One thousand total cells in 120 µL were dispensed into each well of a 96-well flat clear-bottom black polystyrene TC-treated microplate (complex monolayers) or a 96-well black/clear round-bottom ULA surface spheroid microplate (complex spheroids). The microplates were maintained at 37 °C and 5% CO2 with 95% humidity.
Luminescence was measured as a surrogate indicator of cell viability on days 0, 4, 6, and 7 following the addition of 50 µL CellTiter-Glo One Solution (Promega, Madison, WI, cat. G8461) to each well of flat-bottom microplates and 50 µL CellTiter-Glo 3D (Promega cat. G9681) to each well of round-bottom ULA microplates. Both the cell inoculation and addition of CellTiter-Glo were performed manually using a multichannel pipettor. The microplates were then agitated on a shaker for 5 min and incubated for an additional 25 min on a rocking platform before luminescence was measured using a Tecan Infinite M200 microplate reader (Tecan, Männedorf, Switzerland).
The cell viability for simple and complex spheroids was also evaluated using the LIVE/DEAD Viability/Cytotoxicity Kit (Invitrogen cat. L3224). This assay discriminates live from dead cells by simultaneously staining with green fluorescent calcein-AM to indicate intracellular esterase activity (live cells) and red fluorescent ethidium homodimer 1 to indicate the loss of plasma membrane integrity (dead cells). The spheroids were prepared as described above in 96-well black/clear round-bottom ULA surface spheroid microplates (Corning cat. 4520). Seven days after inoculation into 96-well microplates, the spheroids were incubated with the two reagents for 30 min as per the manufacturer’s protocol. Images were collected using a Leica DMi8 microscope (Leica Biosystems, Buffalo Grove, IL).
Preparation of Simple and Complex Monolayer Cultures in Chamber Slides for Immunohistochemistry and the Epithelial–Mesenchymal Transition Immunofluorescence Assay
For the immunohistochemistry staining of monolayer cultures, 500 µL FBS (Hyclone cat. SH30071.03 heat inactivated) were added to each of the four chambers of Thermo Scientific Nunc Lab-Tek II Chamber Slide Systems (Thermo Fisher Scientific, Waltham, MA, cat. 154526), and the slides were incubated at 37 °C and 5% CO2 with 95% humidity for 30 min to enhance the attachment of cells onto the glass slides. The serum was aspirated from each well prior to cell seeding. For simple monolayers, 500 µL containing 5000 K24384-001-R pancreatic cells and DC media were dispensed into each of the four slide chambers. For complex monolayers, 500 µL containing 5000 cells including 60% K24384-001-R pancreatic cells, 25% HUVECs, and 15% hMSCs with their respective media (v/v/v) were dispensed into each of the four slide chambers. The chambered slides were incubated at 37 °C and 5% CO2 with 95% humidity. Seven days after inoculation, the media were aspirated, and the cells were fixed with 4% neutral buffered formalin. After incubation at room temperature for 30 min, the cells were washed twice with Dulbecco’s phosphate-buffered saline (DPBS) and stored in DPBS at 4 °C until cell staining.
Preparation of Simple and Complex Spheroid Cultures for Immunohistochemistry and the Epithelial–Mesenchymal Transition Immunofluorescence Assay
Pancreatic patient-derived K24384-001-R adenocarcinoma cells were cultured in DC medium for simple spheroids or 60% DC medium with 25% EGM-2 and 15% MSCGM media for complex spheroids as described above for optimization of cell seeding densities and viability studies in a 96-well format. After 7 days of incubation at 37 °C and 5% CO2 with 95% humidity, the simple and complex spheroids were formalin fixed within the wells of 96-well microplates by the addition of 30 µL containing 40% neutral buffered formalin. Simple and complex spheroids were removed from each well using wide-bore 200-µL tips. The spheroids were harvested from 60 wells of 8 to 10 microplates (approximately 600 wells total) and collected in a 50-mL conical tube. Subsequently, the spheroids were washed gently with phosphate-buffered saline (PBS) and stored in 70% ethanol at 4 °C.
Immunohistochemistry
Formalin-fixed, paraffin-embedded simple and complex spheroids were cut into 5-µm sections, placed on slides, and deparaffinized. Prior to Ki-67 staining, antigen retrieval was performed in citrate buffer at 100 °C for 10 min. Staining of deparaffinized simple and complex spheroids was performed in a BOND-MAX automated immunohistochemistry stainer (Leica Biosystems). Staining of simple and complex monolayers in the Thermo Scientific Nunc Lab-Tek II Chamber Slide Systems was performed manually and the primary antibodies were prepared in PBS with 0.1% bovine serum albumin (BSA), while Tris-buffered saline was used as the wash buffer.
The slides were stained with Optik Hematoxylin Type 2 (Avantik, Pine Brook, NJ, cat. RS4364-A) to reveal nuclear details and Eosin Y (Thermo Fisher Scientific, cat. 41810-450) for the cytoplasmic component of cells. The coverslips were mounted using Tissue-Tek Glas Mounting Medium (Sakura Finetek USA, Inc., Torrance, CA, cat. 6419). For Ki-67 staining, the anti–Ki-67 rabbit monoclonal antibody, clone D2H10 (Cell Signaling Technology, Danvers, MA, cat. 9027, RRID:AB_2636984), was used at a 1:200 dilution for 30 min followed by detection using the BOND Polymer Refine Detection system (Leica Biosystems cat. DS9800). The slides were dehydrated and mounted using Tissue-Tek Glas Mounting Medium (Sakura Finetek USA, cat. 6419). For epidermal growth factor receptor (EGFR) staining, the EGFR pharmDx kit (Agilent Technologies, Santa Clara, CA, cat. K149489-2) was used as per the manufacturer’s instructions and was adapted for use with the BOND-MAX automated immunohistochemistry stainer. The EGFR pharmDx kit includes the monoclonal anti-EGFR antibody, clone 2-18C19, that does not cross-react with HER2, HER3, or HER4. Coverslips were mounted using Permount mounting medium (Thermo Fisher Scientific cat. SP15-100). Bright-field image acquisition was performed using an Aperio Digital Whole Slide Scanner (Leica Biosystems).
Epithelial–Mesenchymal Transition Immunofluorescence Assay
Simple and complex monolayers and spheroids were prepared for the epithelial–mesenchymal transition immunofluorescence assay as described above, and the assay was performed as described previously. 39 Formalin-fixed, paraffin-embedded simple and complex spheroids were cut into 5-µm sections, placed on slides, and deparaffinized. Heat-induced antigen retrieval was performed in citrate buffer at pH 6.0 and 100 °C for 10 min. Staining of deparaffinized simple and complex spheroids was performed in a BOND-MAX automated immunohistochemistry stainer (Leica Biosystems). Staining of simple and complex monolayers in the Thermo Scientific Nunc Lab-Tek II Chamber Slide Systems was performed manually, and the primary antibodies were prepared in PBS with 0.1% BSA, while Tris-buffered saline was used as the wash buffer.
The Alexa Fluor 488 mouse anti–E-cadherin clone 36 monoclonal antibody (BD Biosciences cat. 560061, RRID:AB_1645347) was purchased from BD Biosciences (Franklin Lakes, NJ) and used for staining at a concentration of 2 µg/mL for 60 min. The rabbit anti–β-catenin monoclonal antibody, unconjugated, clone E247 (Abcam, Cambridge, United Kingdom, cat. ab32572, RRID:AB_725966), was directly custom conjugated to Alexa Fluor 546 dye by Life Technologies. Staining for β-catenin was performed with a concentration of 5 µg/mL anti–β-catenin antibody for 60 min. The anti-vimentin mouse monoclonal antibody, clone V9 (Santa Cruz Biotechnology, Inc., Dallas, TX, cat. sc-6260, RRID:AB_628437), was conjugated to Alexa Fluor 647 (AF647) and used for staining at a concentration of 4 µg/mL for 60 min. Nuclei were stained with 4′, 6-diamidino-2-phenylindole, dihydrochloride (DAPI) FluoroPure grade (Invitrogen cat. D21490) at 0.25 µg/mL. Fluorescent images were captured using an Aperio FL Scanner and Spectrum Analysis software.
Growth Inhibition Assay in a 96-Well Format
Exponentially growing K24384-001-R pancreatic cells were harvested as described above, and 110 µL containing 1000 cells and DC media were dispensed into each well of a 96-well flat clear-bottom black polystyrene TC-treated microplate (Corning cat. 3904) for simple monolayers or a 96-well black/clear round-bottom ULA surface spheroid microplate (Corning cat. 4520) for simple spheroids. For complex monolayers and spheroids, 60% malignant cells were combined with 25% HUVECs and 15% hMSCs in their respective media (v/v/v) and 110 µL containing 1000 cells were dispensed into each well of a 96-well flat clear-bottom black polystyrene TC-treated microplate (complex monolayers) or a 96-well black/clear round-bottom ULA surface spheroid microplate (complex spheroids). The microplates were maintained at 37 °C and 5% CO2 with 95% humidity. After 72 h, 10 µL containing media and an EGFR inhibitor (diluted to a 12-fold concentration from the 400× stock solution) or vehicle control were manually added to the appropriate wells using a multichannel pipettor to achieve the indicated final concentrations with triplicate technical replicates. After 96 h of drug exposure under incubation conditions, 50 µL CellTiter-Glo One Solution (Promega cat. G8461) were added to each well of flat-bottom microplates, and 50 µL CellTiter-Glo 3D (Promega cat. G9683) were added to ULA microplates using a multichannel pipettor. The microplates were agitated on a shaker for 5 min and incubated for an additional 25 min on a rocking platform. Luminescence was measured using a Tecan Infinite M200 microplate reader. Luminescence values from cells treated with test compounds were expressed as a percentage of luminescence values from cells treated with vehicle, and the half-maximal inhibitory concentration (IC50) was calculated by interpolation.
Spheroids and Hypoxia
The Hypoxia Probe Solution LOX-1 (MBL International Corporation, Woburn, MA, cat. LOX-1S) was used to measure hypoxia in simple and complex spheroids at day 7. The probe is a cell-permeable phosphorescent light-emitting iridium complex that is quenched by oxygen. While the probe’s signal is reversible, low levels of oxygen result in a red fluorescence that can be measured by microscopy. Simple and complex spheroids were inoculated by dispensing 100 µL containing 1000 total cells into each well of a 96-well black/clear round-bottom ULA surface spheroid microplate (Corning cat. 4520). After 6 days in culture at 37 °C and 5% CO2 with 95% humidity, a 20-µM working solution of LOX-1 was prepared in cell culture media, and 10 µL were dispensed into each well of the 96-well microplate for a final probe concentration of 1.8 µM. The simple and complex spheroids were maintained at 37 °C and 5% CO2 with 95% humidity for an additional 12 h, and images were acquired on day 7 using a Leica DMi8 microscope (Leica Biosystems).
Localization of HUVECs and hMSCs
Culturing of the cell lines was performed as described above. To determine the localization of HUVECs and hMSCs in complex spheroids, 25% GFP-labeled HUVECs (Neuromics cat. GF01) and 15% RFP-labeled hMSCs (Angio-Proteomie cat. cAP-0050RFP) were combined with 60% unlabeled K24384-001-R pancreatic adenocarcinoma cells in their respective media (v/v/v), and 120 µL containing 1000 total cells were dispensed into the wells of 96-well black/clear round-bottom ULA surface spheroid microplates (Corning cat. 4520). The cells were maintained at 37 °C and 5% CO2 with 95% humidity. Images were acquired on the day of inoculation and at several time points thereafter using a Leica DMi8 microscope.
Optimization of Cell Seeding Densities for HTS in a 384-Well Format
The HUVEC, hMSC, and K24384-001-R pancreatic cells were removed from T flasks using TrypLE Express (Invitrogen, Gibco cat. 12605036) and harvested by centrifugation for 5 min at 233 × g. Following removal of the supernatant, the cells were resuspended in fresh medium and counted using a Cellometer cell counter (Nexcelom, Lawrence, MA) and trypan blue to distinguish viable cells. A suspension containing 104,000 K24384-001-R cells/mL malignant, 26,000 HUVEC cells/mL, and 15,600 hMSC cells/mL was serially diluted twofold for a total of nine cell densities. For each cell density, 48 µL were dispensed into each of 24 wells in 384-well black/clear round-bottom ULA spheroid microplates (Corning cat. 3830). The microplates were subsequently transferred to a Cytomat 10 incubator (Thermo Fisher Scientific, Waltham, MA) and maintained at 37 °C and 5% CO2 with 95% humidity. Four, 7, and 10 days after inoculation, growth of the spheroids was measured by bright-field imaging with an Opera Phenix (PerkinElmer, Waltham, MA). Viability was also assessed at these three time points by measuring luminescence with a PHERAstar FSX (BMG LABTECH, Cary, NC) after dispensing 20 µL CellTiter-Glo 3D (Promega cat. G9683) into each well of the microplate, shaking the microplates for 5 min, and incubating the microplates for an additional 25 min.
Complex Spheroid Assay in a 384-Well Format
Harvesting and counting of malignant, HUVEC, and hMSC cells were performed as described above. In total, 42 µL per well of cell suspension were dispensed into the wells of 384-well black/clear round-bottom ULA spheroid microplates (Corning cat. 3830). Suspensions with malignant cell lines K24384-001-R, Capan-1, Capan-2, CFPAC-1, HPAC, PANC-1, or SU.86.86 contained 14,900 malignant cells/mL, 3700 HUVEC cells/mL, and 2240 hMSC cells/mL. Suspensions containing malignant cell lines BxPC-3 and HPAF-II contained 29,800 malignant cells/mL, 7450 HUVEC cells/mL, and 4480 hMSC cells/mL. AsPC-1 was suspended at 7450 cells/mL with 1860 HUVEC cells/mL and 1120 hMSC cells/mL. MIA PaCa-2 was suspended at 4760 cells/mL with 1190 HUVEC cells/mL and 710 hMSC cells/mL. Following inoculation, the microplates were transferred to a Cytomat 10 incubator (Thermo Fisher Scientific) and maintained at 37 °C and 5% CO2 with 95% humidity. After 3 days of incubation, test compounds or controls were delivered to the assay microplates. The 400× DMSO stock solutions were diluted 50-fold in media, and 6 µL were subsequently transferred to the appropriate wells of microplates using a Tecan Freedom Evo liquid handler for a final 400-fold dilution. Approved and investigational anticancer agents were tested in quadruplicate. Sixteen replicates of the DMSO vehicle control were included in each microplate and 20 replicates of the total kill cocktail (1 µM staurosporine and 3 µM gemcitabine). Following compound transfer, the microplates were returned to the incubator. After 7 days of drug exposure, 20 µL CellTiter-Glo 3D (Promega cat. G9683) were added to each well, and the microplates were placed on a microplate shaker for 5 min. After 25 min of incubation at room temperature, luminescence was measured with a PHERAstar FSX multimode microplate reader (BMG LABTECH). Samples of the cell lines were collected at regular intervals throughout the screening process for STR profiling and mycoplasma testing by Labcorp (Laboratory Corporation of America Holdings, Burlington, NC, formerly known as Genetica DNA Laboratories) to confirm their authenticity and integrity.
Data Analysis
All data were analyzed and graphed using GraphPad Prism version 8.0.0 for Windows (GraphPad Software, San Diego, CA). Drug combination data were analyzed using Combenefit software. 40
Results
Characterization of Simple and Complex Monolayers and Spheroids as In Vitro Pancreatic Tumor Models
Cultures of the conditionally reprogrammed patient-derived pancreatic adenocarcinoma cell line K24384-001-R were grown as monolayers and spheroids in 96-well microplates, both alone (simple) and with HUVECs and hMSCs (complex). Immunohistochemical staining with hematoxylin and eosin (H&E) stain revealed similar morphologies between the simple and complex monolayers ( Fig. 1A , top left). The structures of simple spheroids, containing only K24384-001-R cells, appeared compact and dense. In addition to malignant cells, the complex spheroids incorporated HUVECs and hMSCs as a stromal component, which resulted in larger structures that were less compact ( Fig. 1A , top right). The staining of Ki-67 in the nuclei of simple and complex monolayers was comparable, indicating similar proliferation rates of the two populations ( Fig. 1A , middle left). Compared to the simple spheroids, the complex spheroids had a greater fraction of proliferative cells as indicated by increased Ki-67 nuclear staining ( Fig. 1A , middle right). Expression of EGFR by the four cell culture models was indicated by staining throughout the simple and complex monolayers and spheroids ( Fig. 1A , bottom). Further characterization of the epithelial and mesenchymal properties of the various cell culture models was performed by immunofluorescence (IF) to reveal the expression patterns of E-cadherin, β-catenin, and vimentin ( Fig. 1B ). The four models displayed similar localization patterns of E-cadherin at the plasma membrane, a glycoprotein that mediates intercellular adhesion. Similarly, the IF staining of β-catenin, a mediator of intercellular adhesion and Wnt signal transduction, localized at the plasma membrane among cells of the monolayers and spheroids. The staining of E-cadherin and β-catenin revealed clear differences between the morphologies of the simple and complex monolayers that were not as prominent in the H&E staining patterns ( Fig. 1B , left). Compared to the simple monolayers, cytoplasmic localization of β-catenin appeared greater in complex monolayers. In simple and complex spheroids, the staining patterns of E-cadherin and β-catenin were comparable and further revealed the structural differences between the two, with the simple spheroids being smaller and more compact than the complex spheroids ( Fig. 1B , right). Both HUVECs and hMSCs showed negligible staining of E-cadherin when cultured individually, but β-catenin was clearly detected. Also, IF staining of vimentin, a type III intermediate filament protein expressed in nonepithelial cells, particularly mesenchymal cells, was observed in HUVECs and hMSCs ( Supplementary Fig. S1 ). While vimentin staining was clearly observed in complex monolayers containing HUVECs and hMSCs, it was not detected in simple monolayers consisting of only K24384-001-R pancreatic cells ( Fig. 1B , bottom left). Interestingly, vimentin staining was observed in both simple and complex spheroids with a similar overall fluorescence intensity ( Fig. 1B , bottom right).
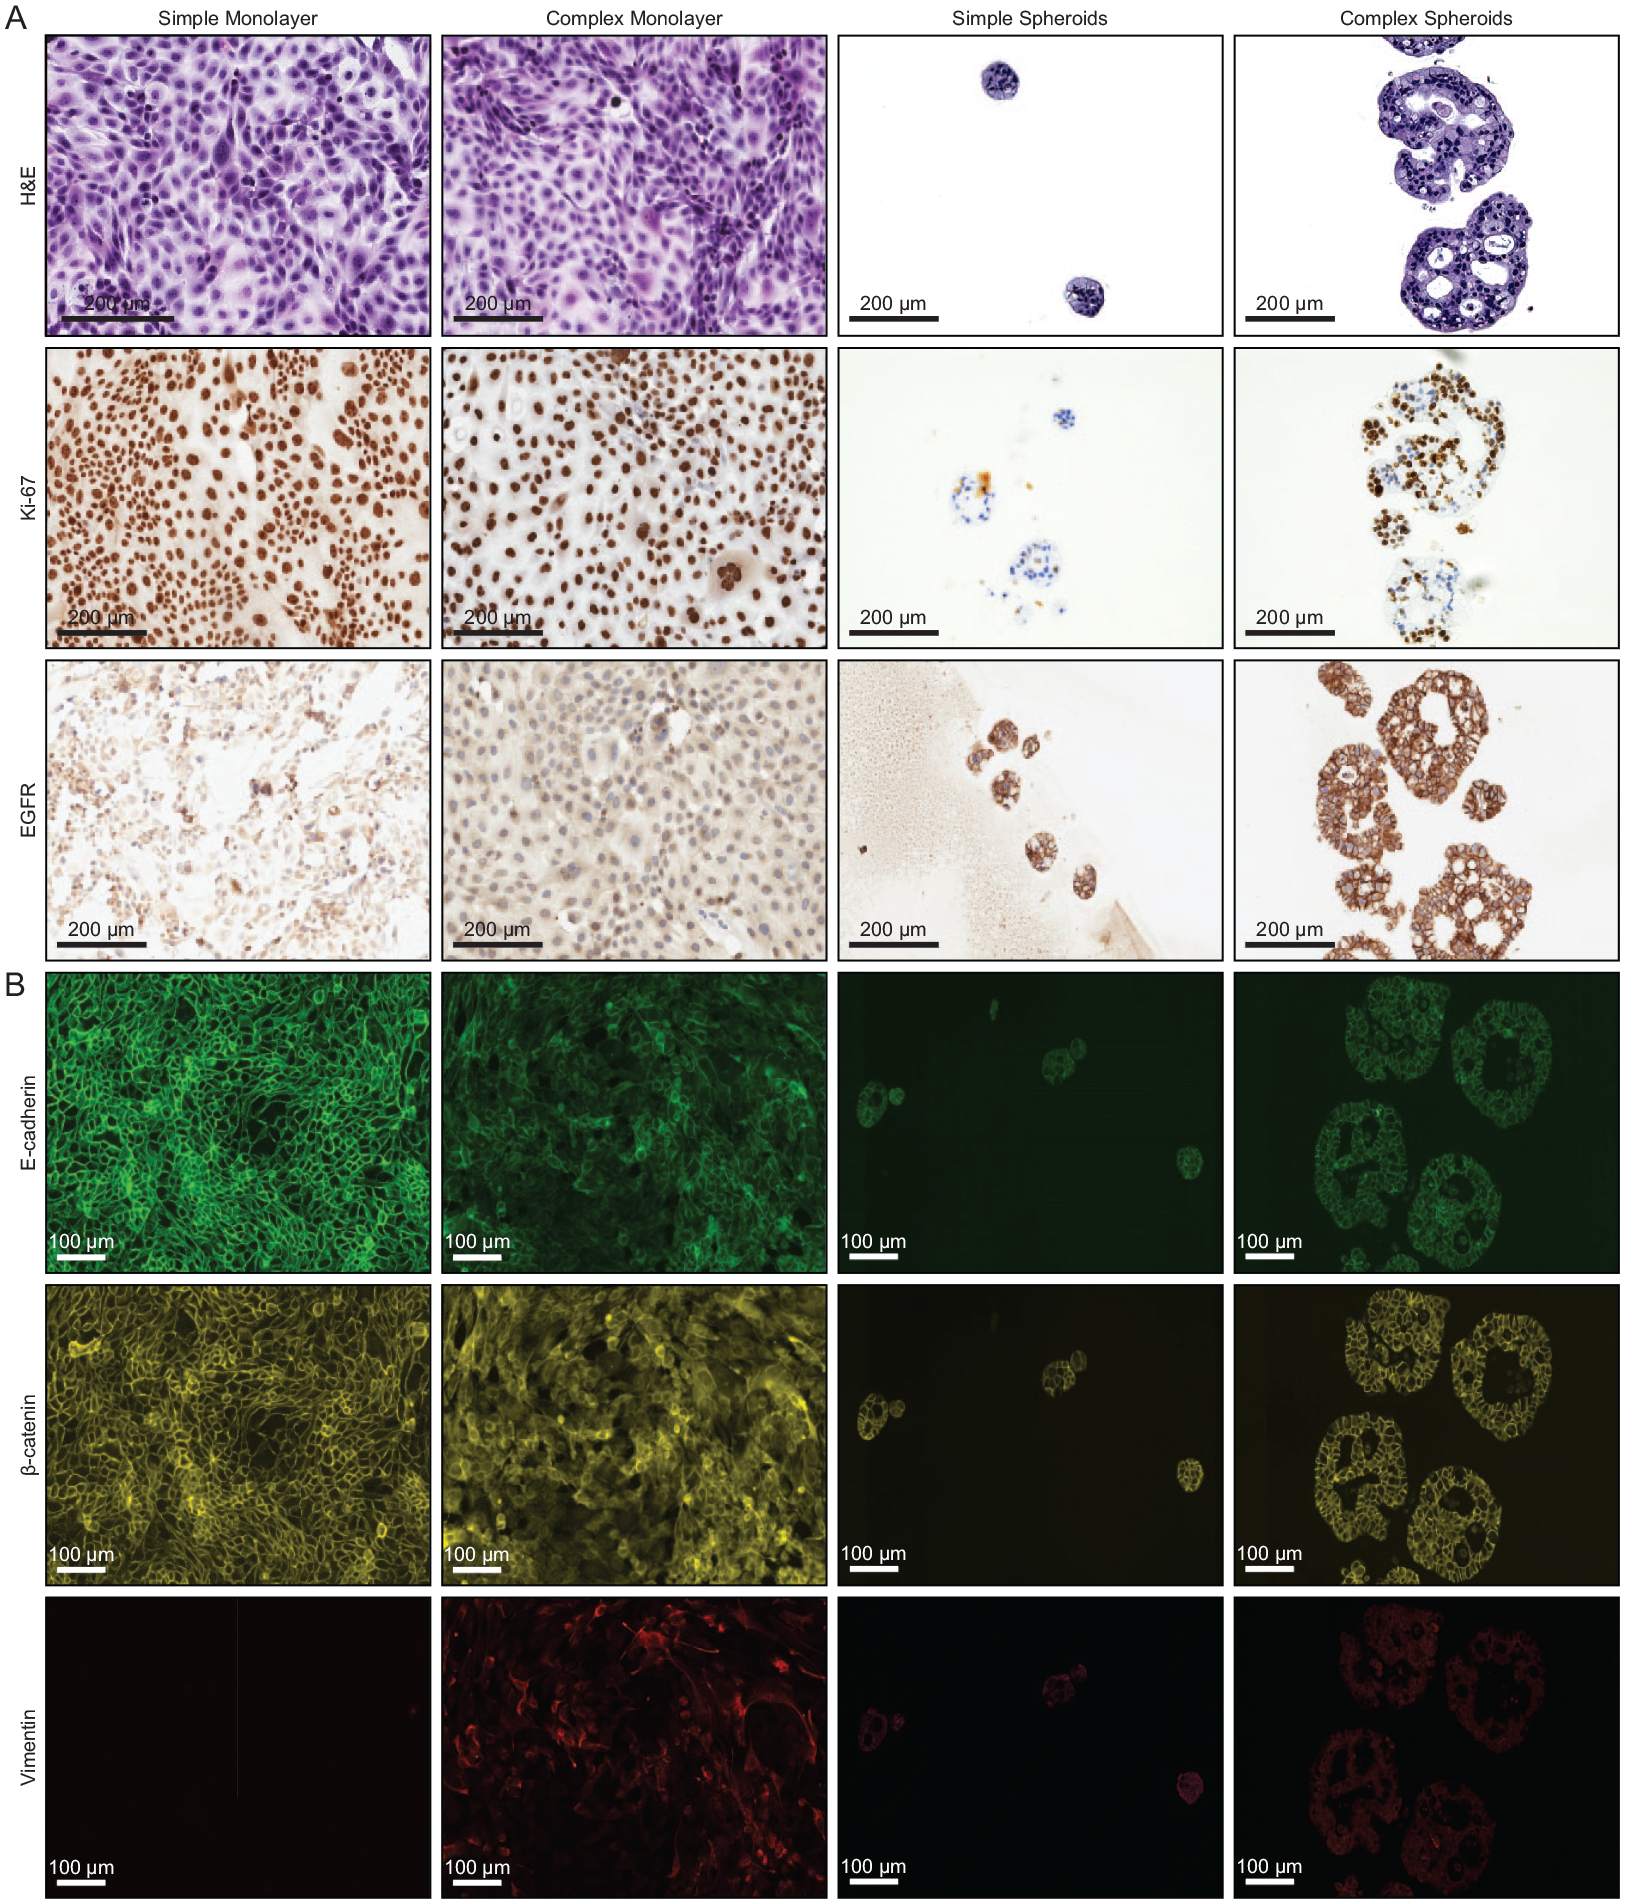
Characterization of K24384-001-R pancreatic adenocarcinoma cells after growth in culture for 7 days as monolayers and spheroids both alone (simple) and with human umbilical vein endothelial cells (HUVECs) and human mesenchymal stromal cells (hMSCs) (complex). Monolayer cultures were inoculated with 5000 total cells per chamber in Thermo Scientific Nunc Lab-Tek II chamber slide systems, while spheroid cultures were inoculated with 1000 total cells per well in Corning 96-well black/clear round-bottom ultra-low attachment surface spheroid microplates. Prior to staining, the spheroids were harvested, formalin fixed, and paraffin embedded, after which the paraffin blocks were cut into 5-µm sections, placed on slides, and deparaffinized as described in the Materials and Methods section. (
To develop in vitro tumor models for drug sensitivity testing, K24384-001-R cells were inoculated into the wells of 96-well microplates at seeding densities ranging from 2000 to 500 cells per well. The cells inoculated into flat-bottom 96-well microplates grew simple monolayers while those inoculated into 96-well round-bottom ULA microplates grew simple spheroids. The growth of monolayers was evaluated by CellTiter-Glo (CTG) while the growth of spheroids was assessed by CellTiter-Glo 3D (CTG3D), both of which quantify ATP with a luminescence end-point measurement that serves as a surrogate for cell viability. During a period of 7 days, substantial increases in luminescence values indicated continued growth of monolayers at all seeding densities tested ( Fig. 2A ). In comparison, the growth of simple spheroids over the 7-day period was less apparent ( Fig. 2B ). In all cases, reduced luminescence values corresponded with reductions in cell seeding densities as expected. From these data, a seeding density of 1000 cells per well was selected to enable the initiation of monolayer and spheroid culture models from a common starting point. When seeded at 1000 cells per well, simple and complex monolayers showed continuous growth throughout 7 days ( Fig. 2C ) with nearly identical doubling times ( Table 1 ). By contrast, the simple and complex spheroids, also seeded at 1000 cells per well, showed modest growth during the 7-day period and substantially greater, but comparable, doubling times. At every time point, the luminescence values were slightly lower for simple spheroids than complex spheroids. Compared to the two types of spheroids, the doubling times for the two types of monolayers were approximately 5-fold and 15-fold shorter at 3 days and 7 days, respectively ( Table 1 ).
Growth Characteristics of K24384-001-R Pancreatic Adenocarcinoma Cell Culture Models Seeded with 1000 Cells per Well in a 96-Well Microplate after 3, 6, and 7 Days in Culture.
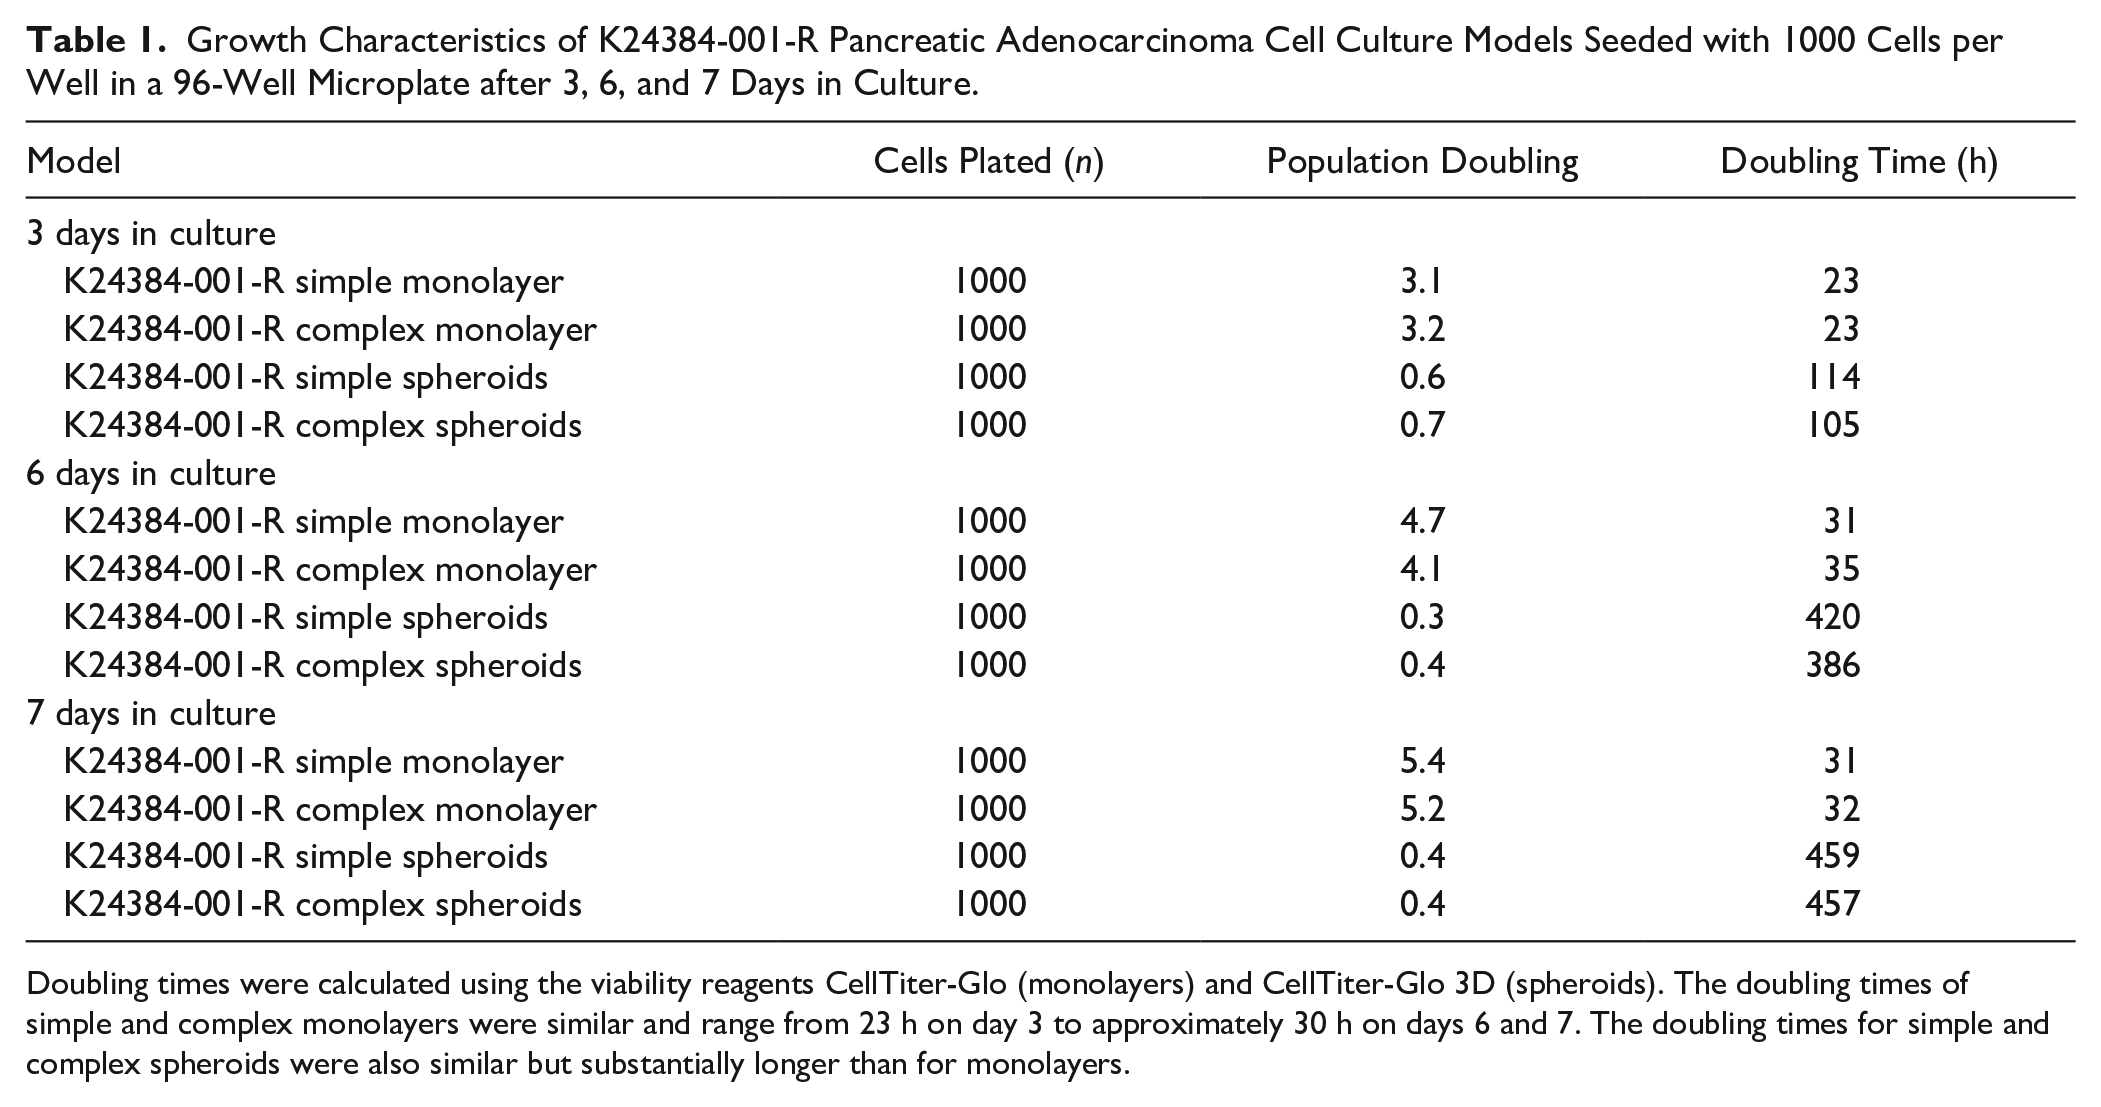
Doubling times were calculated using the viability reagents CellTiter-Glo (monolayers) and CellTiter-Glo 3D (spheroids). The doubling times of simple and complex monolayers were similar and range from 23 h on day 3 to approximately 30 h on days 6 and 7. The doubling times for simple and complex spheroids were also similar but substantially longer than for monolayers.
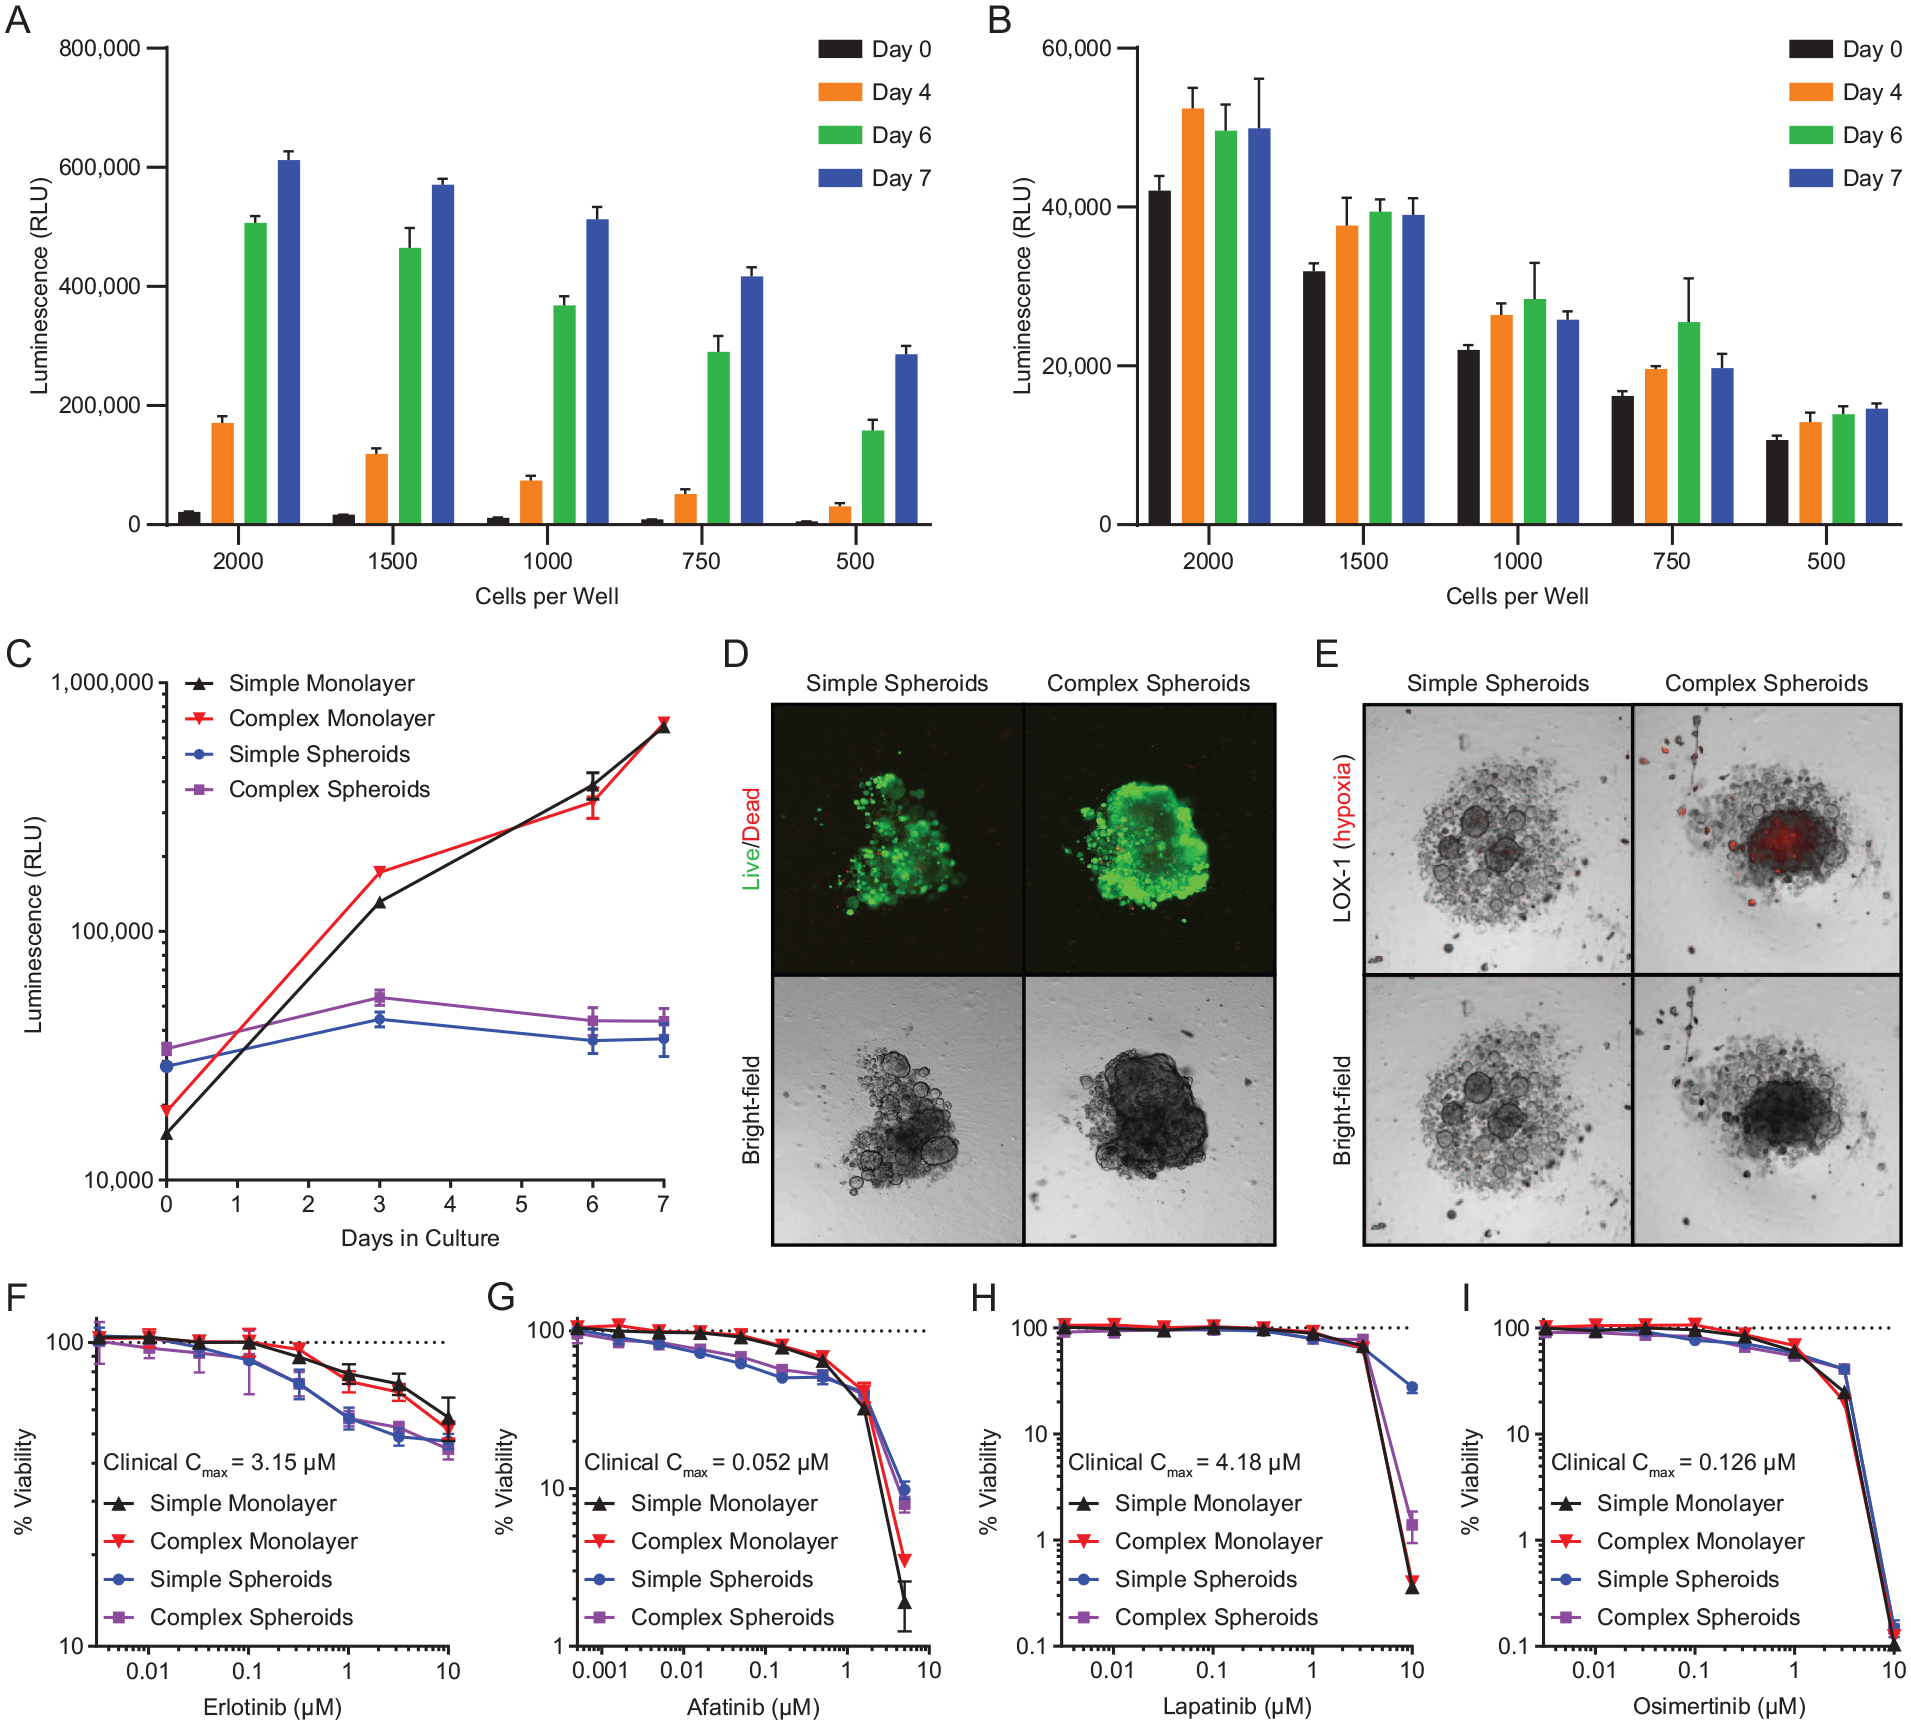
Characterization of patient-derived K24384-001-R pancreatic adenocarcinoma in vitro models and assay development in a 96-well format. Simple monolayers (
Despite modest growth during the 7-day period ( Fig. 2C ), negligible cell death was observed in either simple or complex spheroids as indicated by ethidium homodimer 1 fluorescence, which reveals the loss of plasma membrane integrity. Likewise, viability among cells in the two spheroid types was confirmed by calcein-AM, a fluorescent reporter of intracellular esterase activity and calcium concentration ( Fig. 2D ). While the viability among cells within both spheroid types appeared similar, a hypoxic core was observed within complex spheroids, but not simple spheroids, as demonstrated by the probe LOX-1 ( Fig. 2E , top). LOX-1 is a phosphorescent light-emitting iridium complex that is quenched by oxygen. 41 Bright-field images revealed that the hypoxic core exists within a highly cell-dense region of the complex spheroids, which is not observed in simple spheroids ( Fig. 2E , bottom). Three areas of higher density within the K24384-001-R simple spheroid show a very low LOX-1 signal, indicating minimal hypoxia.
Drug sensitivities of the K24384-001-R pancreatic adenocarcinoma cells grown as simple and complex monolayers and spheroids were evaluated following 96 h of exposure to each of four anticancer agents at a range of concentrations. Simple and complex spheroids had greater sensitivities to the EGFR inhibitor erlotinib (IC50 = 2.7 µM and IC50 = 4.6 µM, respectively) than the simple and complex monolayers (IC50 = 14 µM and IC50 = 11.1 µM, respectively) ( Fig. 2F ). Similarly, simple and complex spheroids were also more sensitive to the pan-HER inhibitor afatinib (IC50 = 0.6 µM) than the simple and complex monolayers (IC50 = 0.9 µM and IC50 = 1.1 µM, respectively) ( Fig. 2G ); however, there was a greater loss of viability at the highest afatinib concentration for the monolayer cultures than the spheroids. The simple and complex monolayers showed sensitivities to the EGFR and HER2 dual kinase inhibitor lapatinib (IC50 = 4.3 µM and IC50 = 4.1 µM, respectively) that were comparable to those of the simple and complex spheroids (IC50 = 5.1 µM and IC50 = 4.9 µM, respectively) with losses of viability mostly limited to the highest lapatinib concentration ( Fig. 2H ). Interestingly, this concentration resulted in a greater loss of viability for complex spheroids than for simple spheroids. Against the EGFR inhibitor osimertinib, the simple and complex monolayers (IC50 = 1.4 µM and IC50 = 1.6 µM, respectively) and spheroids (IC50 = 1.8 µM and IC50 = 1.5 µM, respectively) all showed very similar sensitivities and losses in viability at the highest drug concentration ( Fig. 2I ).
Development of a Robust Complex Spheroid Assay with the K24384-001-R Pancreatic Adenocarcinoma Cell Line in a 384-Well Format
The culture conditions described above were incorporated into the development of a complex spheroid assay with the K24384-001-R pancreatic adenocarcinoma cell line that is suitable for HTS. A mixture of 60% malignant cells, 25% HUVECs, and 15% hMSCs was inoculated into the wells of 384-well round-bottom ULA microplates, and spheroids were allowed to grow at 37 °C and 5% CO2 with 95% humidity. After 3 days of incubation, the spheroids were treated with anticancer agents, total kill cocktail (1 µM staurosporine and 3 µM gemcitabine), or vehicle (DMSO). Seven days after exposure to anticancer agents, CTG3D was added to each well and luminescence measured as a readout of cell viability ( Fig. 3A ). The structure of the stromal component within the complex spheroids was assessed over a 7-day period with green fluorescent protein–labeled HUVECs and red fluorescent protein–labeled hMSCs ( Fig. 3B ). The hMSCs migrated toward the spheroid center within 24 h and primarily remained in that region. The HUVECs colocalized with hMSCs in the spheroid center but showed distinct localization near the periphery throughout the 7 days. A series of z slices collected on day 7 further revealed the centralized localization of the hMSCs within the spheroid as well as the peripheral locations of HUVECs ( Supplementary Fig. S4–S5 ). To determine the appropriate number of cells for inoculation, nine densities were examined ranging from 20 to 5000 K24384-001-R cells per well. This corresponds to 5 HUVECs and 3 hMSCs with 20 K24384-001-R cells at the lowest density (approximately 30 total cells per well) to 1250 HUVECs and 750 hMSCs with 5000 K24384-001-R cells at the highest density (approximately 7000 total cells per well). Viability measurements of the complex spheroids were examined at 4, 7, and 10 days after inoculation by the addition of CTG3D, which showed corresponding decreased luminescence values for spheroids seeded with lower cell numbers ( Fig. 3C ). In addition, the luminescence values increased with the duration in culture, as would be expected for growing spheroids. Bright-field images of the complex spheroids at days 7 and 10 showed that the sizes of the spheroids varied proportionally with the inoculation densities, with the largest spheroids associated with the highest cell number plated ( Fig. 3C ). Based on the CTG3D and imaging analyses, inoculation with 625 K24384-001-R cells, 156 HUVECs, and 94 hMSCs was selected for the assay (approximately 880 cells per well). The rationale for selecting this density was to limit the cell production requirements yet achieve a sufficient assay window for HTS.
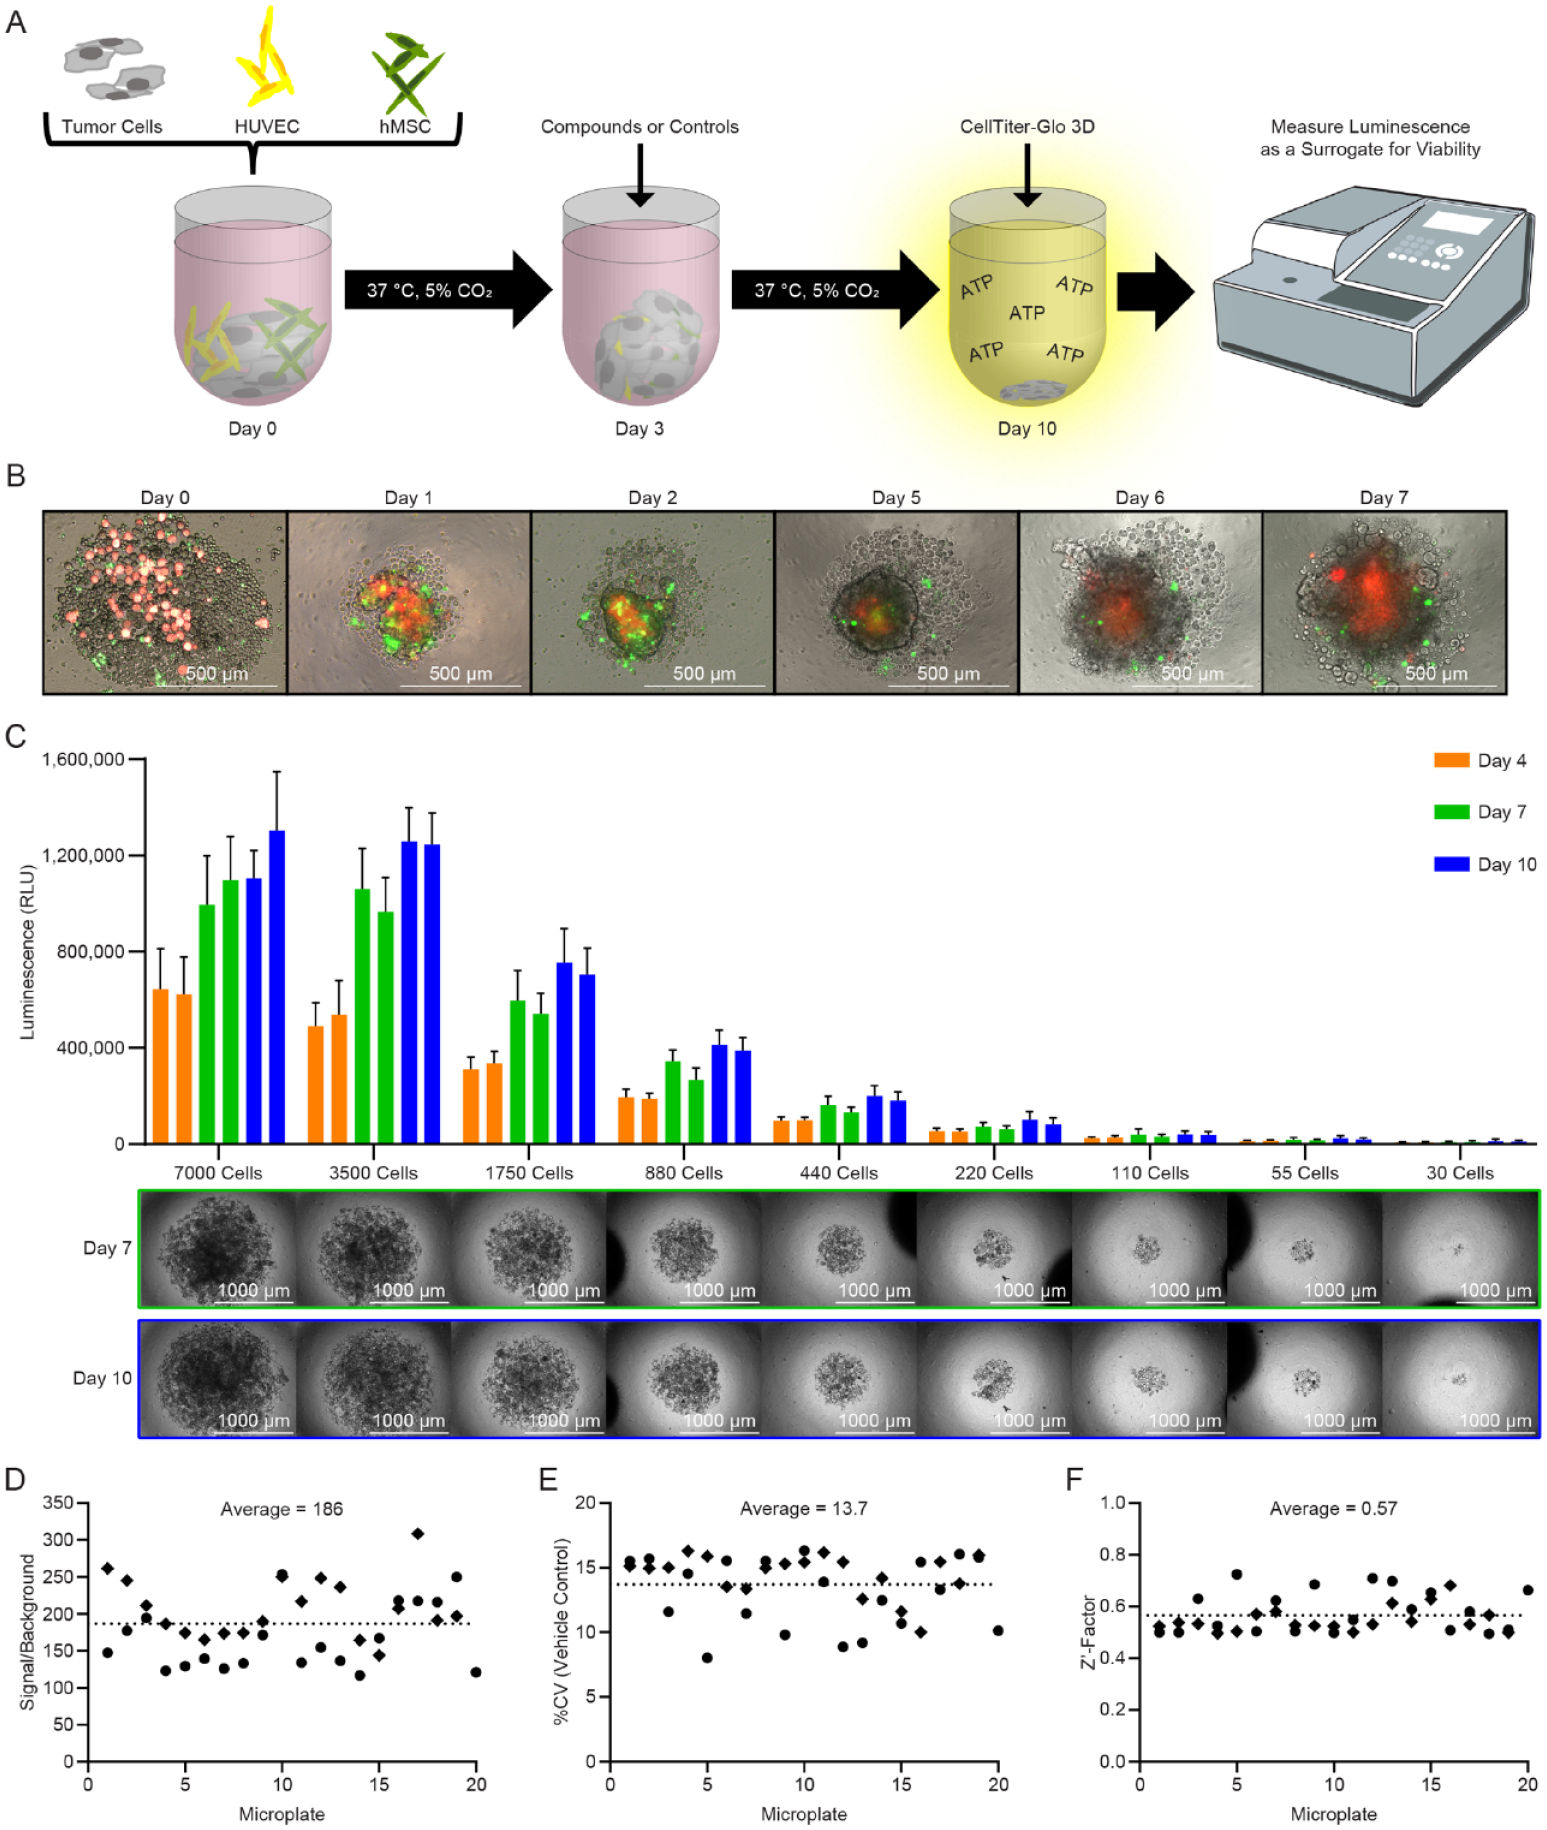
A high-throughput screening assay for complex tumor spheroids in a 384-well format. (
The assay signal-to-background was calculated from the luminescence values of the vehicle control (high control, n = 16 wells) and the total kill cocktail (low control, n = 20 wells). Signal-to-background values of individual assay microplates ranged between 117 and 308, with an average of 186 among two independent experiments with 20 and 19 microplates, respectively (
Fig. 3D
). With an average signal-to-background of 166, the first experiment was slightly lower than the second experiment, which had an average value of 208. Variability among replicates of the vehicle control wells was relatively low, with an average coefficient of variation (CV) of 13% among 20 microplates in the first experiment and 14% in the second (
HTS with the Optimized Complex Spheroid Assay
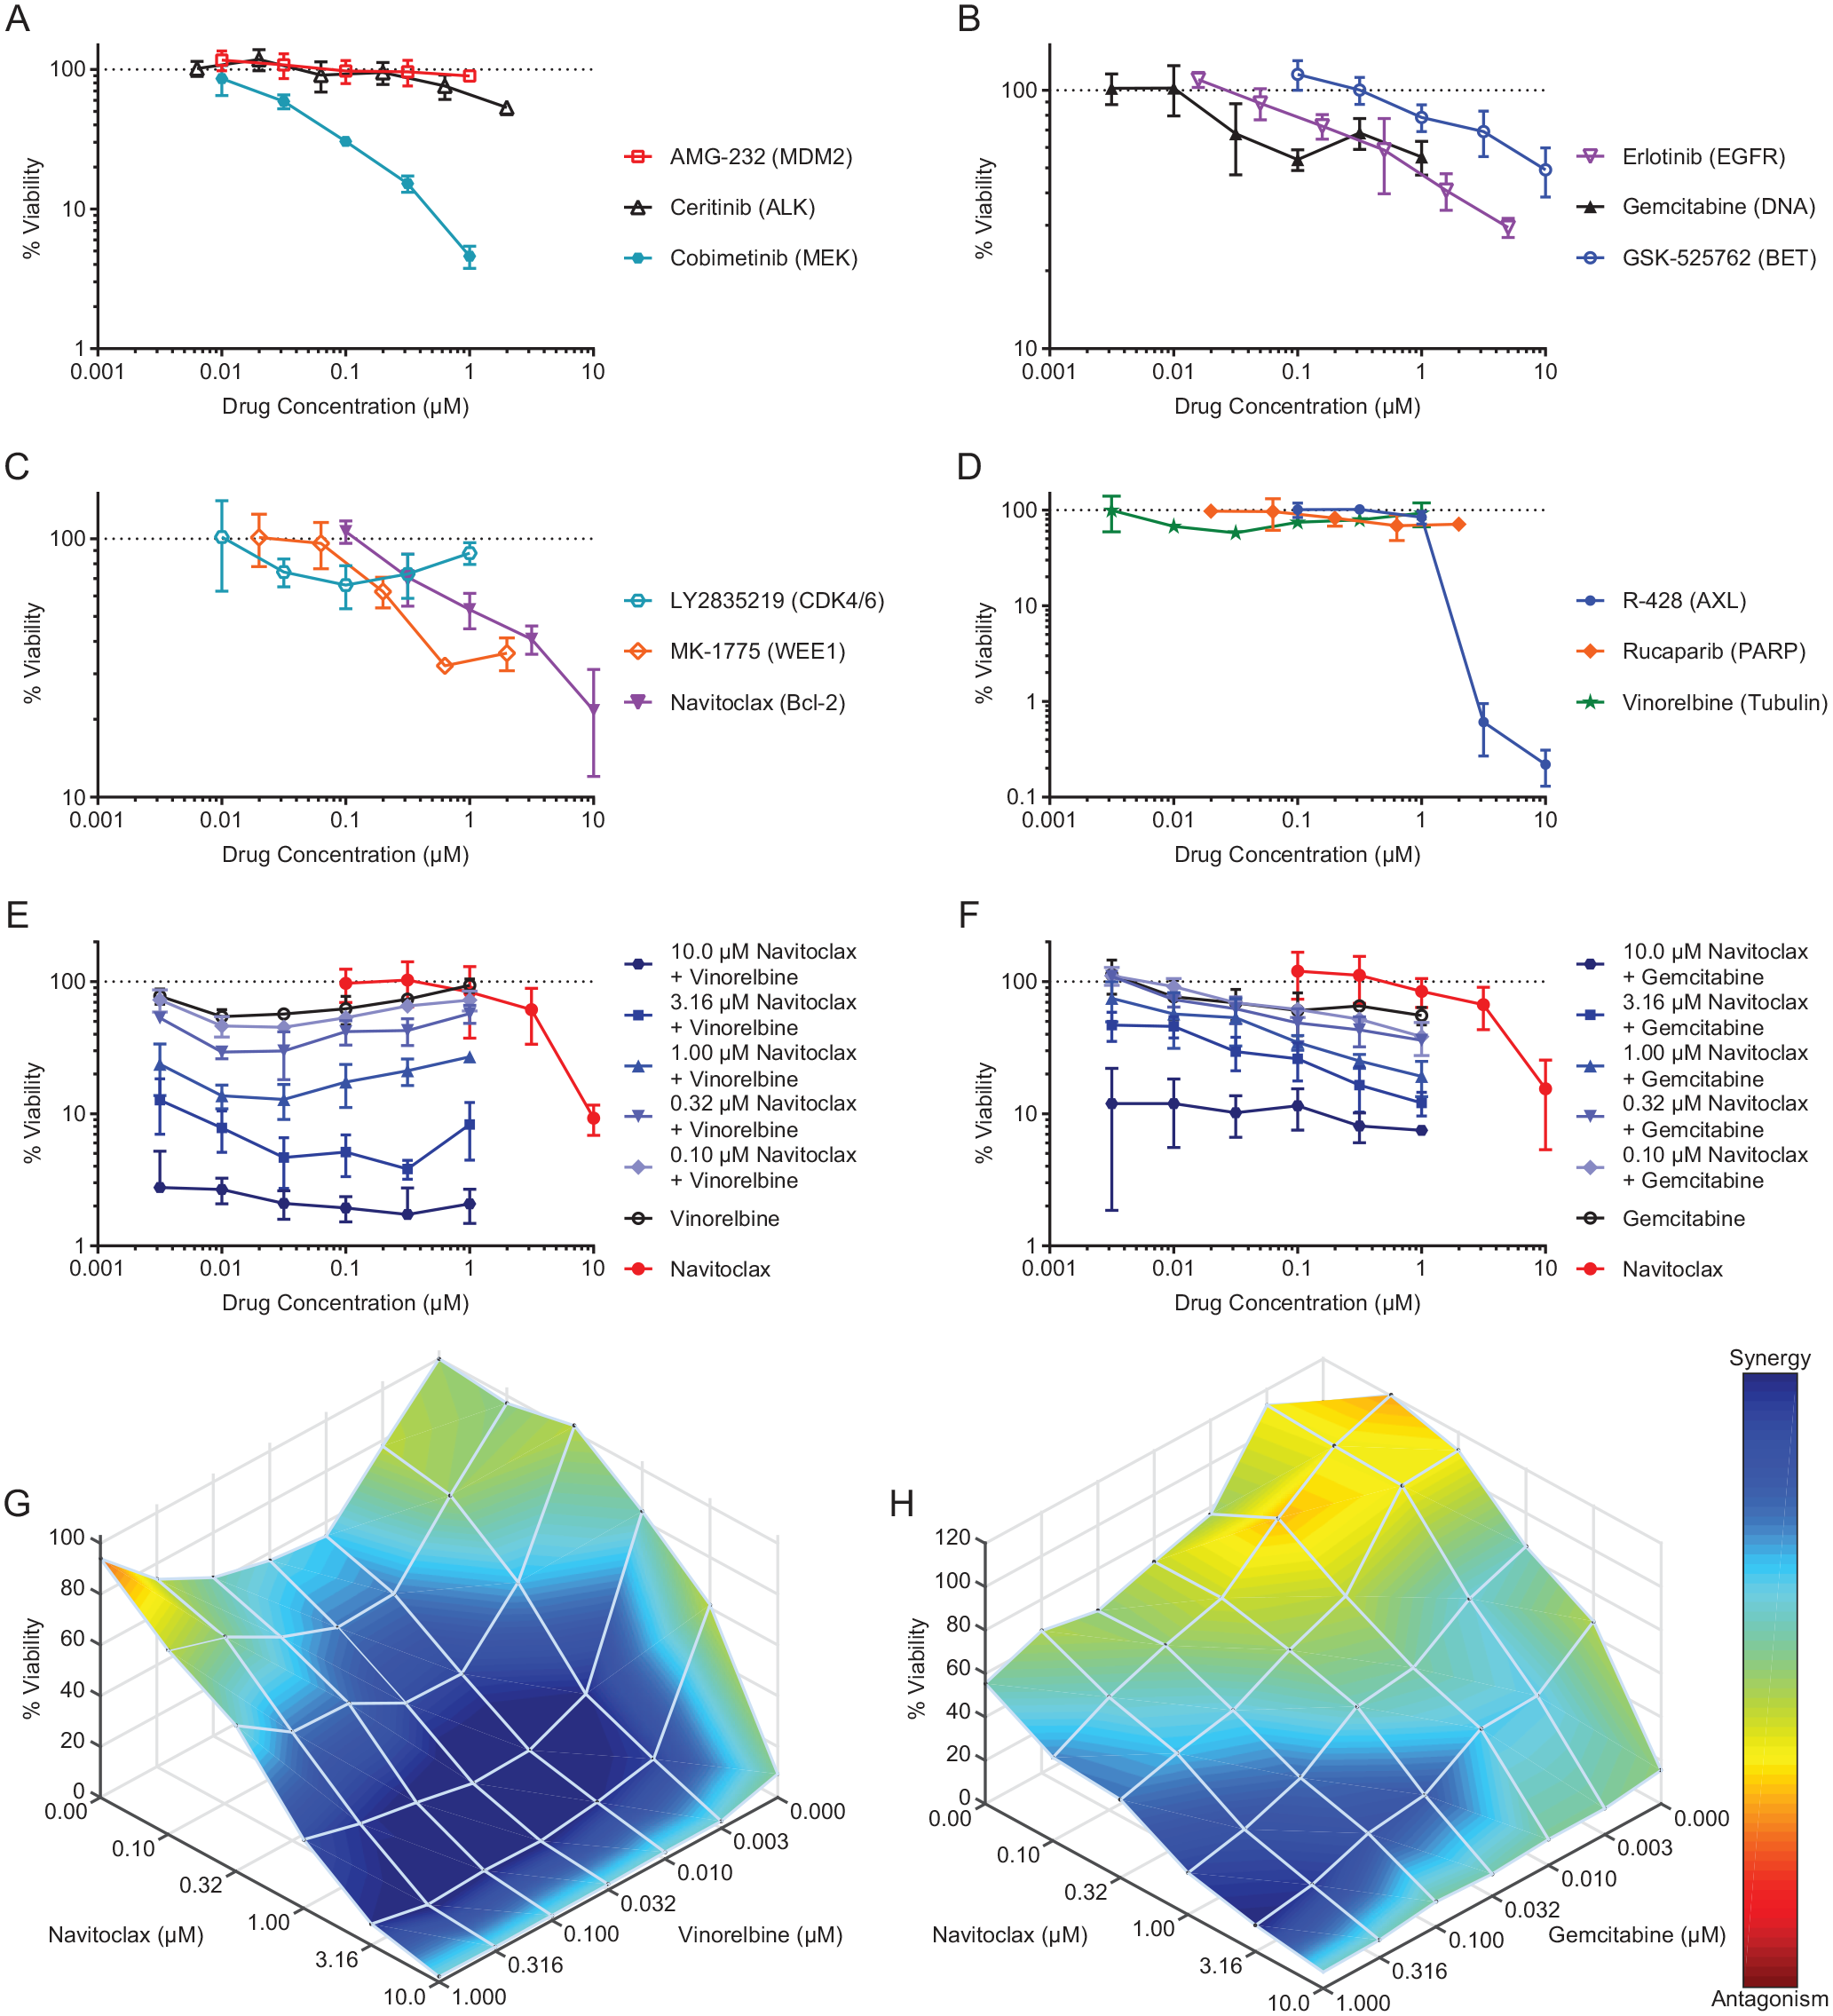
The complex spheroid assay, optimized with the K24384-001-R pancreatic adenocarcinoma cell line, was implemented to evaluate the activity of anticancer agents, as single agents and in combinations ( Fig. 4 ). Among the 12 single agents tested, the percent viability was reduced by more than 1 log for the MEK inhibitor cobimetinib ( Fig. 4A ), whereas most single agents reduced the percent viability by less than 1 log ( Fig. 4A–D ). The K24384-001-R complex spheroids demonstrated the greatest sensitivity to the AXL kinase inhibitor, R-428, which resulted in a nearly 3-log reduction in percent viability at the highest concentration ( Fig. 4D ). Although demonstrating modest to no activity as single agents, combinations of the tubulin binder vinorelbine and the Bcl-2/Bcl-xL/Bcl-w inhibitor navitoclax resulted in greater than additive activity against K24384-001-R complex spheroids, reducing the percent viability by nearly 2 logs at the highest concentration of navitoclax ( Fig. 4E ). Similarly, limited responses were observed with the DNA synthesis inhibitor gemcitabine as a single agent ( Fig. 4B ), whereas greater than additive responses were observed when gemcitabine was combined with navitoclax, reducing the percent viability by more than 1 log at the highest concentration of navitoclax ( Fig. 4F ). Analyses with the Loewe model using Combenefit software 40 indicated greater than additive activities for combinations of navitoclax with vinorelbine ( Fig. 4G ) or gemcitabine ( Fig. 4H ). These data were also analyzed by the Bliss model of Combenefit software with similar results for combinations of navitoclax with vinorelbine ( Supplementary Fig. S6A ) or gemcitabine ( Supplementary Fig. S6B ).
Differential sensitivities of K24384-001-R complex spheroids to approved and investigational anticancer agents. (
Implementation of the Complex Spheroid Assay with Various Pancreatic Lines
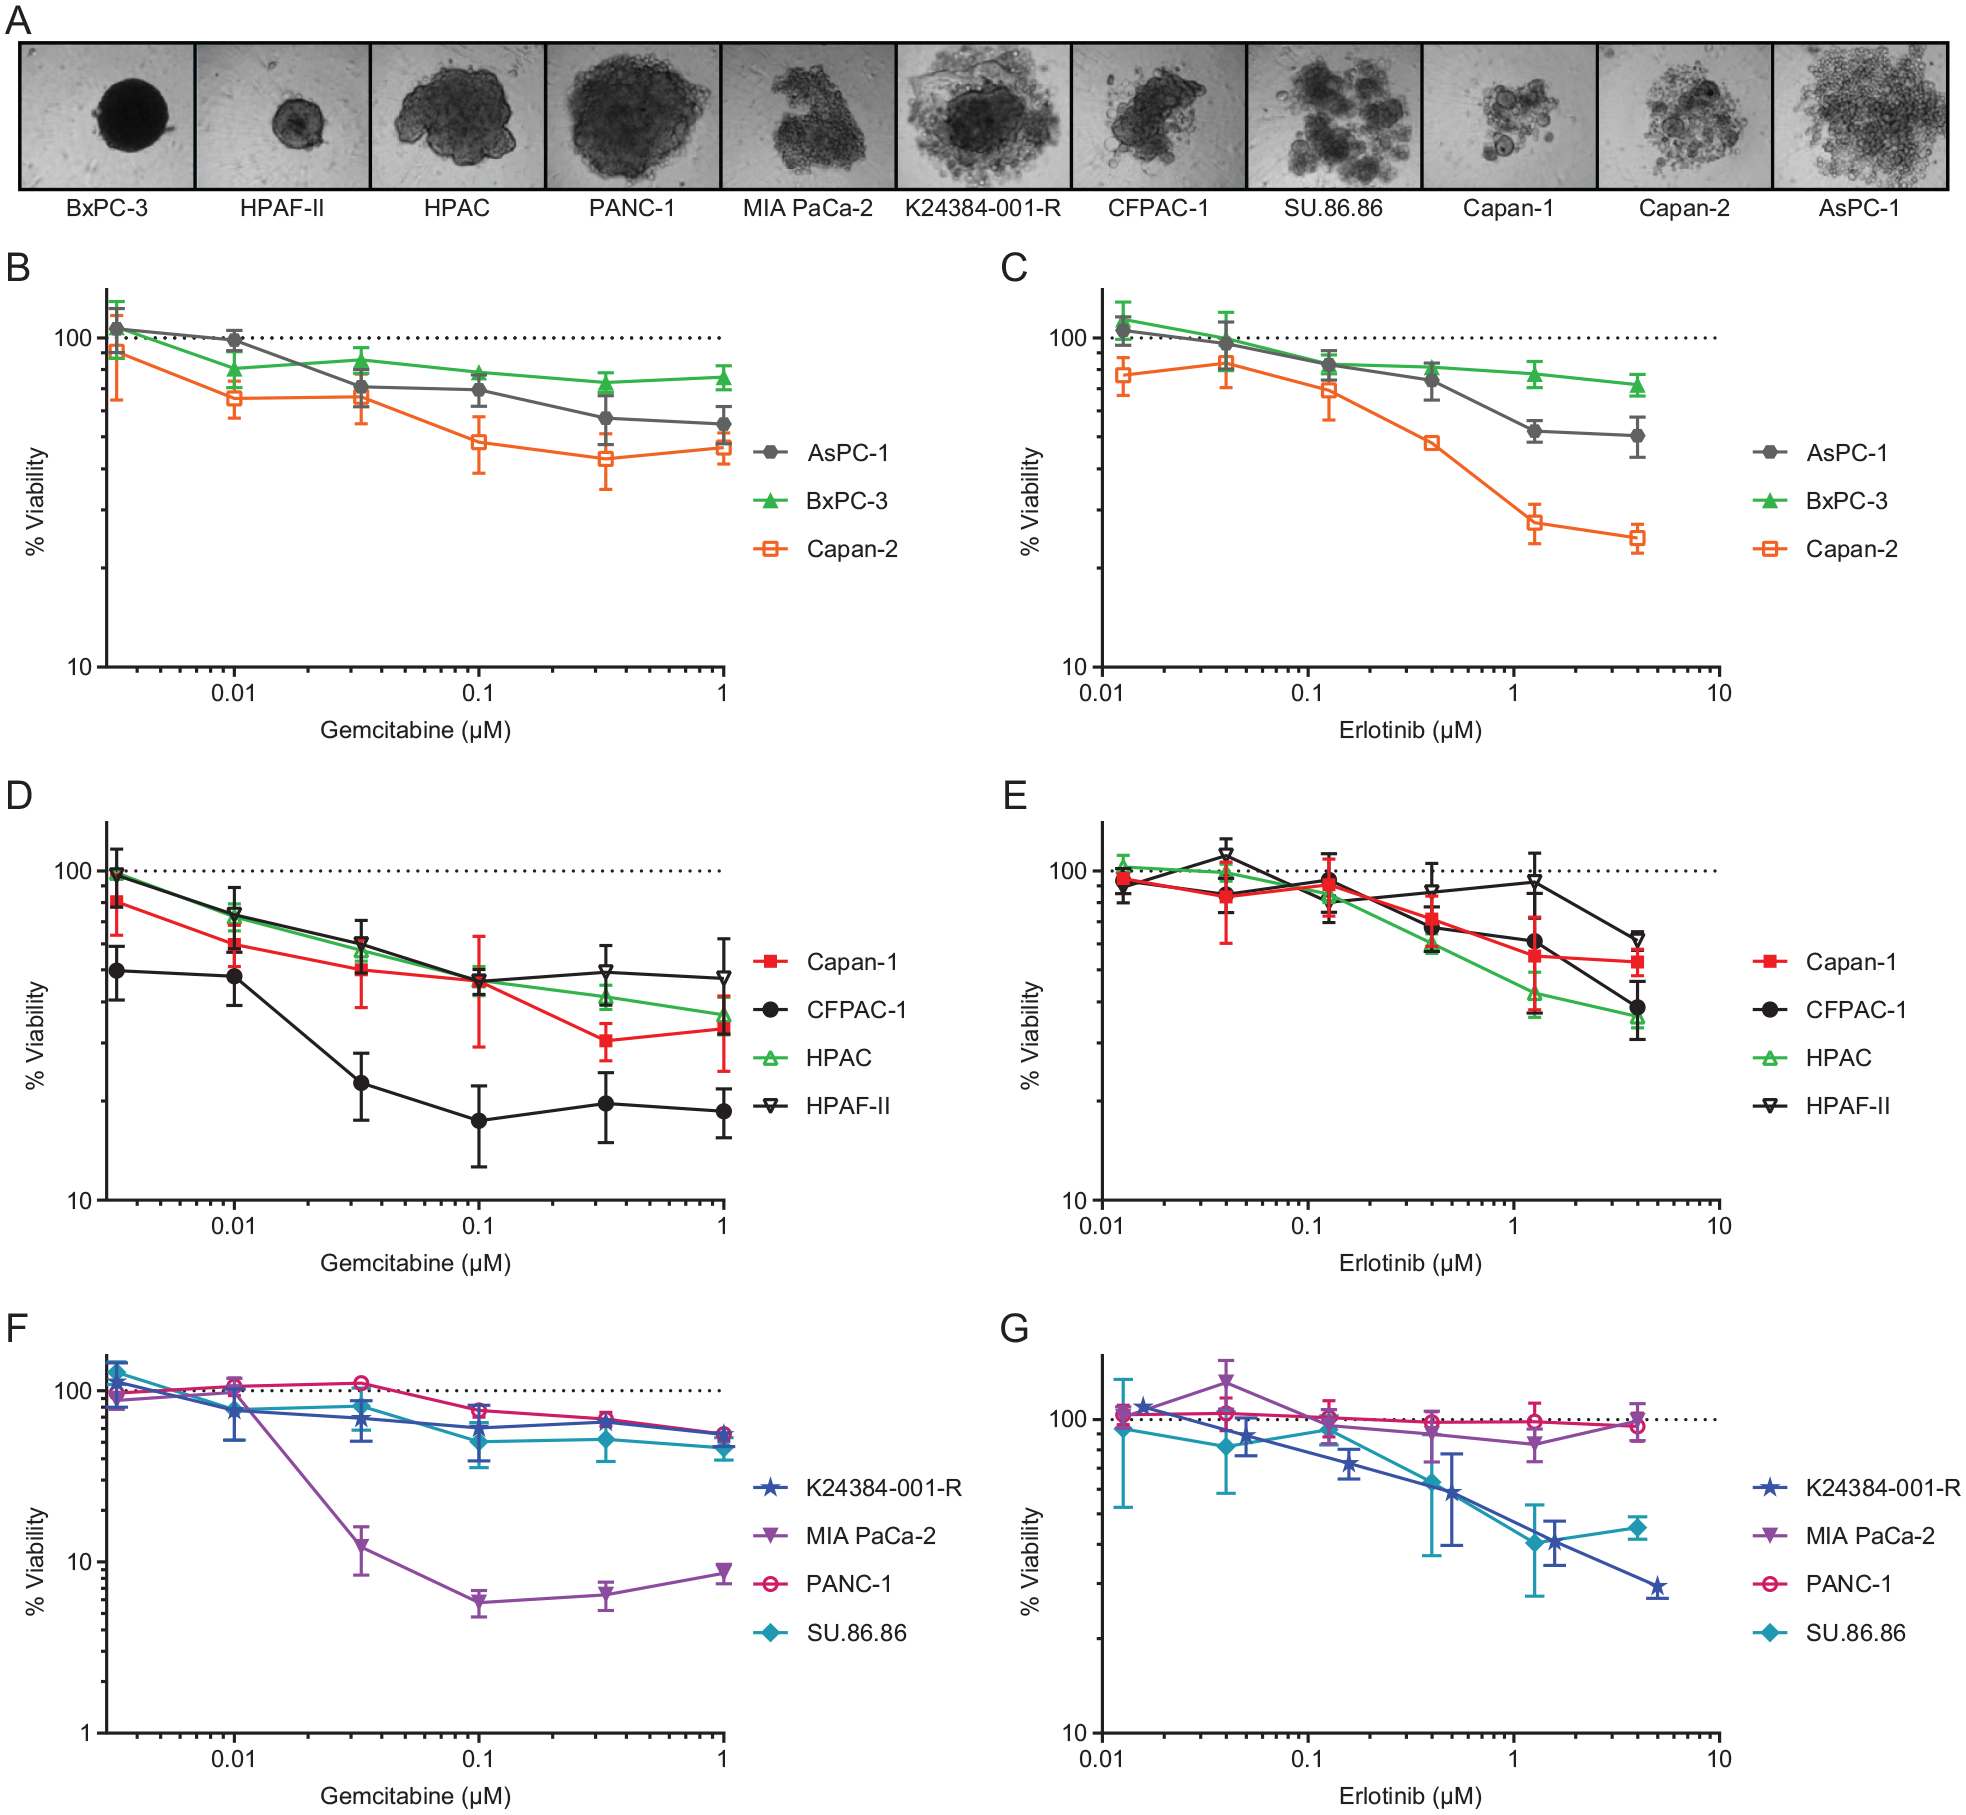
To demonstrate the extension of the complex spheroid assay for use with other cell types, the assay was performed with 10 well-established pancreatic cell lines, including AsPC-1, BxPC-3, Capan-1, Capan-2, CFPAC-1, HPAC, HPAF-II, MIA PaCa-2, PANC-1, and SU.86.86. Bright-field imaging demonstrated that the morphologies of complex spheroids vary substantially among 11 pancreatic cancer cell lines, ranging from highly condensed and spherical for BxPC-3 to the loose aggregates observed with AsPC-1 ( Fig. 5A ). However, most of these complex spheroids had higher-density regions that might coincide with hypoxic conditions. Complex spheroids containing either K24384-001-R or one of the other 10 pancreatic cancer lines were exposed to each of two anticancer agents ( Fig. 5B–G ). Among the 11 complex spheroids, MIA PaCa-2 spheroids were most sensitive to gemcitabine, with the percent viability reduced by more than 1 log at multiple concentrations ( Fig. 5F ). Complex spheroids containing HPAF-II were the second most sensitive to gemcitabine, with the percent viability reduced by nearly 1 log ( Fig. 5D ). The responses of all 11 pancreatic spheroid types to erlotinib were modest with less than 1-log reductions in percent viability ( Fig. 5C , E , G ); however, the Capan-2 and K24384-001-R complex spheroids had greater responses to erlotinib than to gemcitabine and were the most responsive models to erlotinib ( Fig. 5C , G ).
Extension of the complex spheroid assay for use with other well-established pancreatic cell lines. (
Discussion
This report describes the development and implementation of an in vitro HTS-compatible assay that can serve as a physiologically relevant model of human solid tumors by including human stromal cells. Recently, Weydert and colleagues 30 described an HTS-compatible heterotypic multicellular tumor spheroid assay incorporating the pancreatic malignant cell line PANC1 and NIH3T3 fibroblasts as stromal cells that allows discrimination of drug activity against stromal compared to malignant cells. The use of mouse fibroblasts as stromal cells was intended to mimic a xenotransplantation model. In contrast, the assay described here is intended to serve as a model of human tumors.
Development and validation of the complex spheroid assay were performed with the patient-derived K24384-001-R pancreatic adenocarcinoma cell line. Compared to simple spheroids composed of only K24384-001-R cells, the complex spheroids, including HUVECs and hMSCs as a stromal component, were substantially larger and contained visible glandular structures that were not observed in the condensed simple spheroids ( Fig. 1 ). While the proliferation of K24384-001-R grown as either simple or complex monolayers was steady over a period of 7 days, growth as either simple or complex spheroids was markedly reduced ( Fig. 2A–C , Table 1 ), which might reflect the physiology of the three-dimensional spheroid structures with both quiescent and growing subpopulations of cells. While the cells within simple and complex spheroids were viable ( Fig. 2D ), a hypoxic core was identified within the complex spheroids ( Fig. 2E , right) that might be associated with lower ATP concentrations. The development of a hypoxic core within the complex spheroids is consistent with the physiological features of solid tumors in patients. 7 A similar hypoxic core was not identified within the simple spheroids; however, multiple regions containing higher cell densities had detectible levels of hypoxia, indicating some similarities ( Fig. 2E , left). The multiple spherical regions of higher density in simple spheroids correspond to the structures observed in Figure 1 , whereas the single dense area of the complex spheroid is clearly larger, as was observed in Figure 1 . Despite the notable size differences in the dense spherical regions, wells with both the simple and complex spheroids contained smaller spherical structures and diffuse cell aggregates, resulting in a similar overall quantity of cells. This additional material likely accounts for the modest differences observed among the luminescence values between simple and complex spheroids at the different time points ( Fig. 2C ), despite their markedly different sizes in Figure 1 . Over a period of 7 days, the translocation of hMSCs toward the center of spheroids was observed in a dense region that included HUVECs and malignant cells ( Fig. 3B , Supplementary Figs. S4–S5 ). The localization of stromal cells toward the center of spheroids during development has also been observed by other groups.30,35,36,42
The epithelial-to-mesenchymal transition (EMT) causes malignant cells to become more invasive and is associated with increased metastasis. Indeed, the EMT status has been shown to be an important prognostic factor for pancreatic cancer. 43 The process of EMT is characterized by a loss of epithelial markers (including E-cadherin and β-catenin) and increased expression of mesenchymal markers (including vimentin). 44 Recently, an EMT immunofluorescence assay (EMT-IFA) was reported that incorporates β-catenin detection and cellular morphology to distinguish carcinoma from stromal cells and quantifies individual and colocalized expression of E-cadherin and vimentin. The validated assay identified EMT phenotypes in core-needle biopsies from patients with various advanced metastatic carcinomas. Xenograft studies with the EMT-IFA indicated that EMT confers a phenotypic plasticity on carcinoma cells that enables a rapid adaptation to cytotoxic or targeted therapeutics that might create a transient type of acquired drug resistance. 39 Both simple and complex spheroids containing K24384-001-R cells expressed epithelial and mesenchymal markers ( Fig. 1B ). Although vimentin staining was not observed in K24384-001-R simple monolayers, it was observed in simple spheroids, which indicates a transition of some cells across phenotypes. The ability to evaluate EMT phenotypes with the complex spheroid model might enable in vitro mechanistic studies of tumor resistance mechanisms following exposure to cytotoxic or targeted therapeutics as well as the discovery of effective therapeutic combinations.
When comparing the sensitivities of simple and complex monolayers and spheroids to four anticancer drugs in a 96-well assay format, the results were dependent on the drug and concentration tested ( Fig. 2F–I ). The simple and complex spheroids were more sensitive than monolayers at all erlotinib concentrations tested ( Fig. 2F ). The same results were observed at lower concentrations of afatinib; however, the simple and complex monolayers showed greater sensitivity at the highest concentration tested ( Fig. 2G ). The responses of simple and complex monolayers to lapatinib were nearly identical, although complex spheroids demonstrated a greater sensitivity than simple spheroids at the highest concentration tested ( Fig. 2H ). Essentially no differences were observed among the responses of all four cell culture models to osimertinib. Notably, all of the IC50 values observed from these experiments either matched or exceeded the clinical Cmax values, which is the maximum achievable concentration of the drug in patients. Therefore, none of these four drugs would be expected to have activity in patients with tumors like K24384-001-R based on these results.
Following the initial assay development in a 96-well format, the K24384-001-R pancreatic adenocarcinoma complex spheroid assay was successfully miniaturized to a 384-well format ( Fig. 3 ). Independent experiments demonstrated excellent assay performance with average Z′-factor values of 0.58 and 0.55, with runs of twenty and nineteen 384-well microplates, respectively ( Fig. 3F ). High-throughput screening was performed to evaluate the sensitivities of K24384-001-R complex spheroids to anticancer agents as single agents and combinations over a range of concentrations. Among 12 single agents tested, only 2, the MEK inhibitor cobimetinib and the AXL kinase inhibitor R-428, reduced the cell viability beyond 1 log ( Fig. 4A , D ). However, several combinations were identified that showed greater than additive activities. One example was the combination of the Bcl-2/Bcl-xL/Bcl-w inhibitor navitoclax with the tubulin binder vinorelbine that reduced cell viability by nearly 2 logs at the highest concentration of navitoclax ( Fig. 4E ). Navitoclax also demonstrated greater than additive activities when combined with the DNA synthesis inhibitor gemcitabine, reducing cell viability by approximately 1 log at the highest navitoclax concentration ( Fig. 4F ). Altogether, these data demonstrate successful applications of the K24384-001-R pancreatic adenocarcinoma complex spheroid assay from multiple screens.
To demonstrate the extension of the complex spheroid assay to additional cell types, 10 other pancreatic malignant cell lines were incorporated into the HTS assay and tested with gemcitabine and erlotinib ( Fig. 5 ). The results demonstrated various sensitivities of the models to the anticancer drugs. Although this report is focused on pancreatic cell lines, the authors have successfully applied the complex spheroid assay to many other types of malignant cell lines from patient-derived solid tumors.
Currently, there is a critical need for improved preclinical in vitro tumor models that correlate with patient responses. Such assays could accelerate the development of new cancer therapies and reduce the number of experimental therapies that fail in clinical trials for a lack of safety or efficacy. In addition, the assays could support personalized medicine applications. Spheroid assays have been implemented for decades as an in vitro model that incorporates many features of solid tumors that are missing from monolayer cultures. In support of their improved physiological relevance, a recent prospective study demonstrated the use of a patient-derived breast cancer spheroid model to predict responses of breast cancer patients to neoadjuvant therapy. 37 While historically, spheroid assays were more challenging to implement, recent advancements in microfluidics, in vitro cell culturing technologies, and methodologies, as well as the increasing availability of patient-derived cells, position spheroid assays as a physiologically relevant tumor model that is amenable to HTS. The combination of human malignant and stromal cells into complex spheroids, as described in this report, might serve as an improved in vitro model to predict tumor responses in vivo.
Supplemental Material
sj-pdf-1-jbx-10.1177_24725552211038362 – Supplemental material for Complex Tumor Spheroids, a Tissue-Mimicking Tumor Model, for Drug Discovery and Precision Medicine
Supplemental material, sj-pdf-1-jbx-10.1177_24725552211038362 for Complex Tumor Spheroids, a Tissue-Mimicking Tumor Model, for Drug Discovery and Precision Medicine by Gurmeet Kaur, David M. Evans, Beverly A. Teicher and Nathan P. Coussens in SLAS Discovery
Supplemental Material
sj-pdf-2-jbx-10.1177_24725552211038362 – Supplemental material for Complex Tumor Spheroids, a Tissue-Mimicking Tumor Model, for Drug Discovery and Precision Medicine
Supplemental material, sj-pdf-2-jbx-10.1177_24725552211038362 for Complex Tumor Spheroids, a Tissue-Mimicking Tumor Model, for Drug Discovery and Precision Medicine by Gurmeet Kaur, David M. Evans, Beverly A. Teicher and Nathan P. Coussens in SLAS Discovery
Footnotes
Declaration of Conflicting Interests
The author(s) declared no potential conflicts of interest with respect to the research, authorship, and/or publication of this article.
Funding
The author(s) disclosed receipt of the following financial support for the research, authorship, and/or publication of this article: This project was funded in whole or in part with federal funds from the National Cancer Institute, National Institutes of Health, under contract HHSN261201500003I. The content of this publication does not necessarily reflect the views or policies of the Department of Health and Human Services, nor does mention of trade names, commercial products, or organizations imply endorsement by the U.S. government. This research was supported in part by the Developmental Therapeutics Program in the Division of Cancer Treatment and Diagnosis of the National Cancer Institute.
Supplemental material is available online with this article.
References
Supplementary Material
Please find the following supplemental material available below.
For Open Access articles published under a Creative Commons License, all supplemental material carries the same license as the article it is associated with.
For non-Open Access articles published, all supplemental material carries a non-exclusive license, and permission requests for re-use of supplemental material or any part of supplemental material shall be sent directly to the copyright owner as specified in the copyright notice associated with the article.