
Abstract
Acoustic droplet ejection (ADE)–open port interface (OPI)–mass spectrometry (MS) has recently been introduced as a versatile analytical method that combines fast and contactless acoustic sampling with sensitive and accurate electrospray ionization (ESI)–MS-based analyte detection. The potential of the technology to provide label-free measurements in subsecond analytical cycle times makes it an attractive option for high-throughput screening (HTS). Here, we report the first implementation of ADE-OPI-MS in a fully automated HTS environment, based on the example of a biochemical assay aiming at the identification of small-molecule inhibitors of the cyclic guanosine monophosphate–adenosine monophosphate (GMP-AMP) synthase (cGAS). First, we describe the optimization of the method to enable sensitive and accurate determination of enzyme activity and inhibition in miniaturized 1536-well microtiter plate format. Then we show both results from a validation single-concentration screen using a test set of 5500 compounds, and the subsequent concentration–response testing of selected hits in direct comparison with a previously established matrix-assisted laser desorption/ionization time-of-flight (MALDI-TOF) readout. Finally, we present the development of an in-line OPI cleaning procedure aiming to match the instrument robustness required for large-scale HTS campaigns. Overall, this work points to critical method development parameters and provides guidance for the establishment of integrated ADE-OPI-MS as HTS-compatible technology for early drug discovery.
Keywords
Introduction
Modern drug discovery relies on the identification and optimization of molecules that specifically modulate the activity of individual enzymes or receptors, typically named drug targets. To this end, assays enabling efficient screening of large compound numbers are required, with the choice of an appropriate readout technology being an important key to success. Along these lines, mass spectrometry (MS) has become a popular option because it provides fast analysis of enzymatic activities by direct quantification of product formation enabled by mass-to-charge (m/z) differences between substrate and product. Compared with more traditional readouts, like fluorescence and UV absorbance, label-free MS is generally considered to feature close to universal applicability while being less prone to common interferences inherent to optical methods. It further enables the multiplexed measurement of physiologically relevant biomolecules without requiring the use of artificial probes or tailored antibodies.1,2 In this way, MS facilitates fast target enablement via label-free quantification of relevant analytes from matrices as close to native conditions as possible. Until recently, however, the time efficiency of optical methods was not met by MS, rendering this technology inadequate for processing high-throughput demanding applications. During the past two decades, technical improvements in MS instrumentation have resulted in a significant increase in scanning speeds, which consequently has raised the interest to use this technology for applications requiring fast analysis cycle times, like high-throughput screening (HTS). While modern mass spectrometers can acquire data at multiple hertz and up to kilohertz (Hz-kHz) frequencies, the introduction of discrete samples into the ion source of the device currently poses as a rate-limiting step during MS analysis. For true HTS capability, subsecond analysis cycle times are generally desired as permitted by optical methods. Several attempts to fill this technological gap have been reported, from which some have evolved into commercialized products, while others remain experimental for the time being. 3
One successful and commercialized technique is matrix-assisted laser desorption/ionization time-of-flight (MALDI-TOF) MS, which has been shown by our group to feature HTS-compatible analysis cycle times of 0.4 s/sample by combining parallelized sample deposition in highly condensed formats with fast and precise sample stage mechanics and high-frequency laser optics. 4 The feasibility of MALDI-TOF MS as a readout strategy for HTS has already been demonstrated by different groups for a diverse set of biological targets and beyond the 1-million-compound library scale.5–12 As a result, MALDI-TOF MS has been widely adapted in academic and industrial HTS laboratories, and the scope of successful HTS applications is expanding beyond the generic enzyme activity readout.13–15 To further broaden the accessible analyte and target space for high-throughput analysis, sampling interfaces that enable comparable throughputs in combination with electrospray ionization (ESI)-based MS would be desired.
A commercially available technology in this field is Agilent’s RapidFire (RF; Santa Clara, CA) system that combines in-line solid-phase extraction (SPE) for sample purification and enrichment with MS-based flow injection analysis. Although the method is widely applied in bioanalysis and compound profiling due to its sensitivity and robustness, achievable throughputs of 6–10 s/sample render this technology less attractive for performing large-scale HTS campaigns.16–19 Bretschneider et al. recently reported an alternative RF operation mode, termed BLAZE-Mode, which omits the SPE cartridge and thereby reduces cycle times down to 2.5 s/sample, effectively making the time needed for baseline peak separation the rate-limiting step. 20 However, the sample introduction step during RF-MS still requires mechanical sample aspiration and injection in the microliter volume range, limiting the speed to considerably above 1 s/sample. To enable contactless sample transfer of nanoliter volumes and increase throughput, the use of an acoustic-based sampling interface, enabling sample ejection directly from microtiter plate wells toward the MS, has been proposed and termed acoustic ejection MS. Recently, two distinct methods based on this concept have been introduced: acoustic mist ionization (AMI) and acoustic droplet ejection (ADE) combined with an open port interface (OPI).
In AMI, precisely timed acoustic impulses and a charging cone positioned above the source plate well are utilized to form a mist of charged picoliter sample droplets, which is then aspirated into a heated transfer tube and transferred to the MS, eventually yielding gas-phase ions generated by inductive charging. 21 In this way, robust HTS capability and fast cycle times of 0.3 s/sample have been demonstrated in the context of a large-scale screening campaign comprising about 2 million compounds performed in an offline AMI-MS setup. 22 Initially developed by a collaboration between researchers from AstraZeneca, Labcyte, and Waters, AMI has recently been adopted by other groups, although the lack of commercial instrument availability hampers its broader applicability.23,24
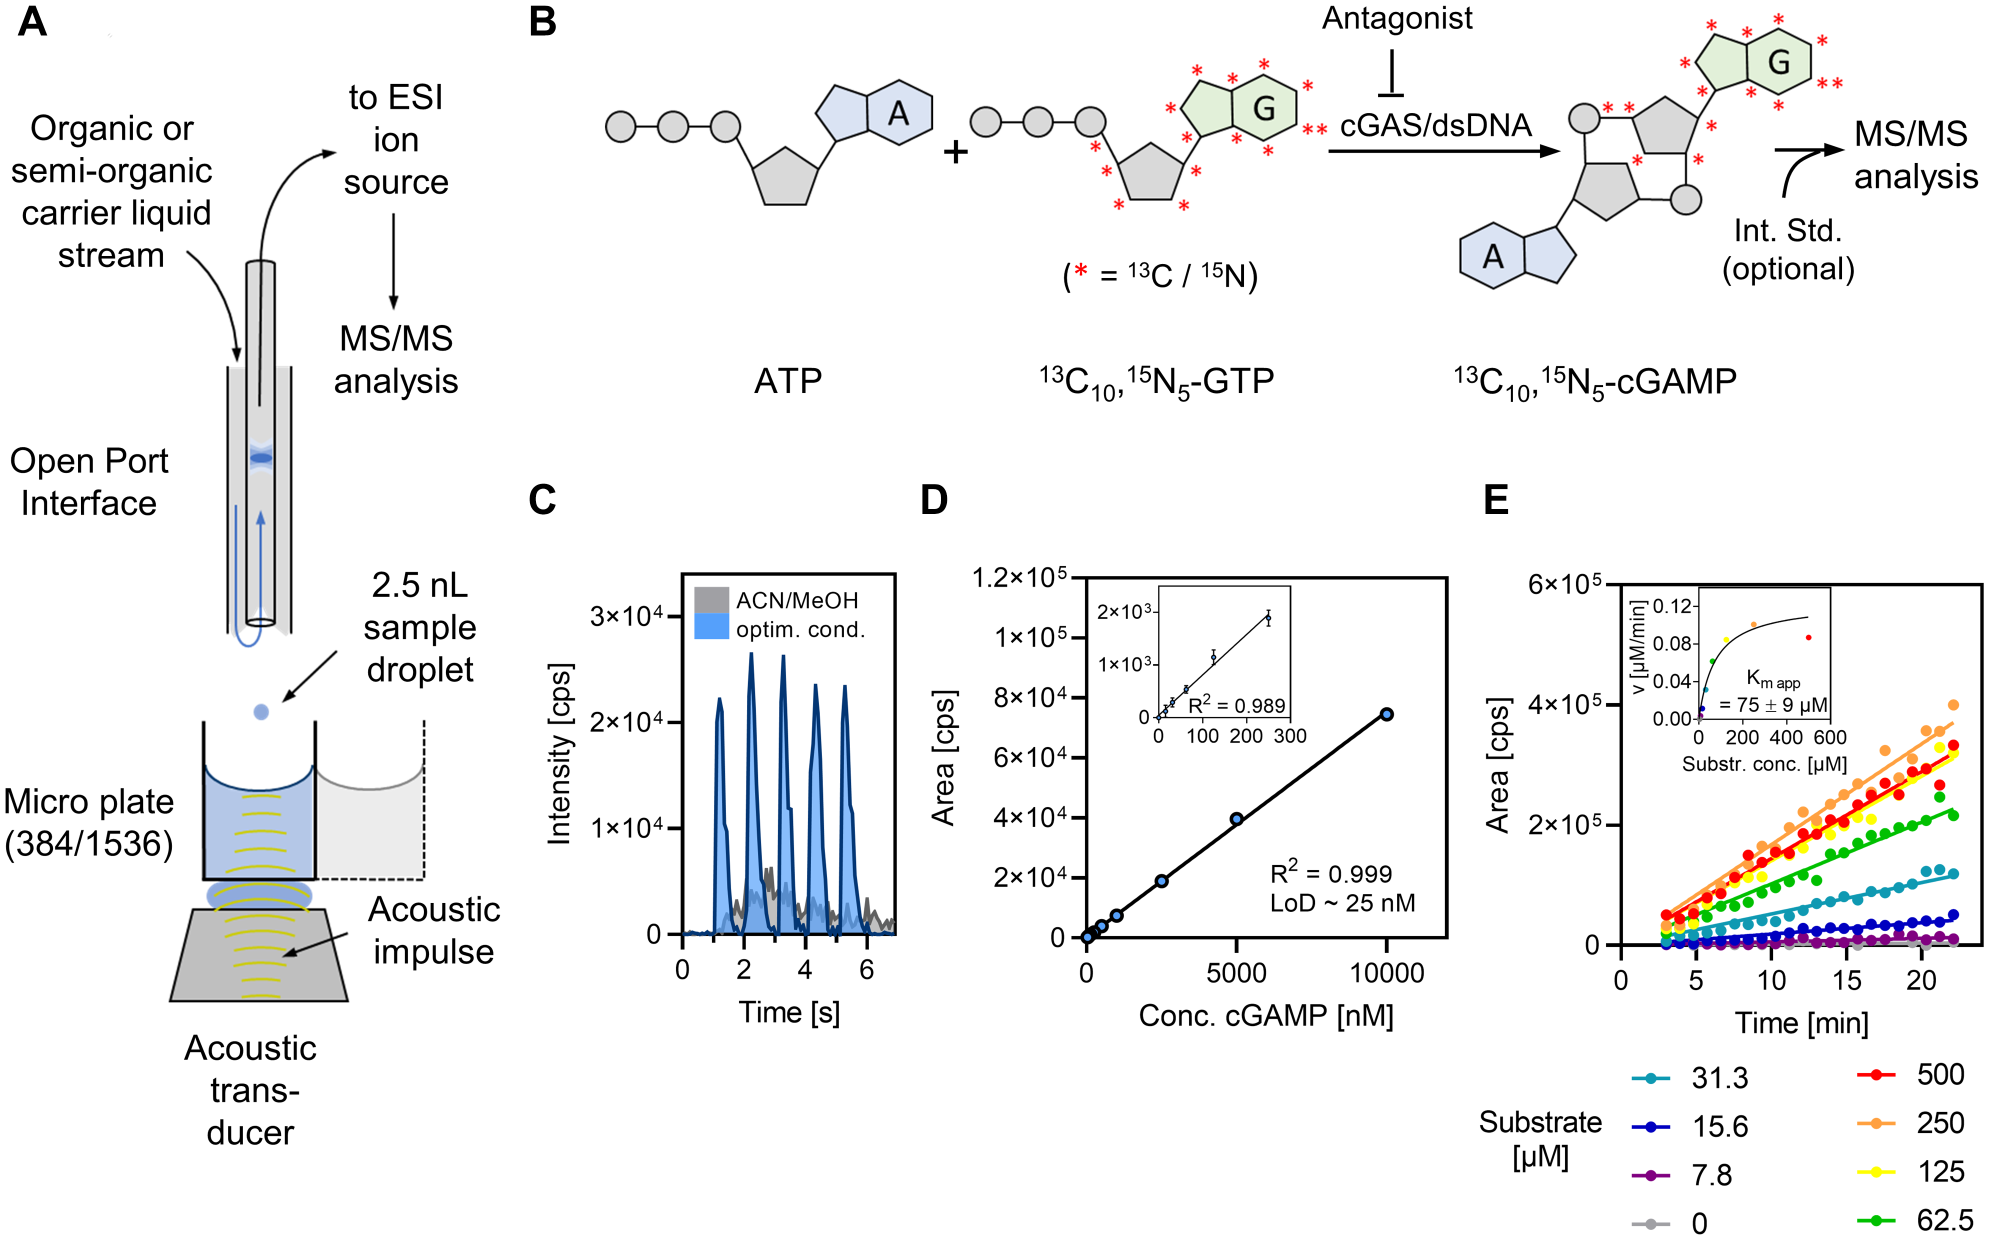
In parallel to AMI, ADE-OPI has been established as a noncontact acoustic-based sample transfer option. Here, discrete and precise nanoliter droplets are generated from individual acoustic impulses and vertically ejected from the sample meniscus surface toward an OPI where droplets are captured in a stream of carrier liquid and transported to the ESI ion source via a transfer capillary ( Fig. 1A ).25,26 The concept has recently been investigated by different groups for applicability in the fields of bioanalysis, HTS, parallel organic synthesis, and compound quality control.27–30 Technical modifications on a prototype system resulted in analytical throughputs of 3 samples/s tracking a single analyte and up to 6 samples/s for different analytes measured from adjacent wells. 31 However, reports to date are limited to small-scale feasibility studies, and a demonstration of HTS capability related to system robustness and automation is still elusive.
cGAS ADE-OPI-MS assay development. (
In this report, we describe the establishment of ADE-OPI-MS, enabled by the recently commercialized Echo-MS (Sciex) device, as an in-line readout strategy for HTS using the nucleotidyltransferase cyclic guanosine monophosphate–adenosine monophosphate (GMP-AMP) synthase (cGAS) as a model target. This pattern recognition receptor is activated by cytosolic DNA and catalyzes the cyclization of ATP and GTP into cyclic GMP-AMP [G(2′,5′)pA(3′,5 ′)p], further referred to as 2′,3′-cGAMP ( Fig. 1B ). 32 In this way, cGAS activity stimulates the innate immune response via induction of the stimulator of interferon genes (STING) pathway, and chemical cGAS inhibition has in turn been suggested as a therapeutic strategy for several inflammation-driven pathologies. 33 However, tracking 2′,3′-cGAMP with conventional readout methods has proven to be challenging due to its unselective spectrophotometric properties and lack of suitable label attachment sites, necessitating the use of tailored antibodies. 34 In this regard, label-free MS provides an unbiased approach for direct assessment of enzymatic activity independent on the availability of additional signal mediators.
In the context of this validated target, optimization of critical ADE-OPI-MS method parameters is presented to enable subsecond assessment of enzymatic activity directly from incubation mixtures in 1536-well format. Screening data from a test set of 5500 compounds show high data quality independent of the presence of internal standard. A comparison of assay results from single-concentration testing and concentration–response analysis to MALDI-TOF MS data demonstrates high correlation between the two analytical methods. We further report the assembly of the first fully automated ADE-OPI-MS-based HTS platform by integrating Echo-MS into the Boehringer Ingelheim (BI) HTS infrastructure. Finally, we describe the assessment of system robustness by measuring 65,000 DMSO-containing wells to simulate a daily HTS duty cycle and provide guidance on how to improve system stability by implementing an interposed washing procedure that does not interfere with total analytical throughput. In conclusion, the presented data establish ADE-OPI-MS as an HTS-compatible and automatable label-free readout technology.
Materials and Methods
Materials
Echo-MS-compatible 384-well (no. 001-14555) and 1536-well (no. C52621) assay plates were purchased from Beckman Coulter (Brea, CA); 1536-well PE plates (no. 782101) were obtained from Greiner Bio-One (Frickenhausen, Germany). HTS MALDI disposable target plates (no. 1847006) and HTS MALDI Adapter (no. 8283496) were purchased from Bruker Daltonics (Billerica, MA). Recombinant human cGAS (cGAS-2-522-N-His-SUMO-BV) was produced in High Five insect cells in-house at BI, as previously described. 10 α-Cyano-4-hydroxycinnamic acid (4-HCCA; no. 70990), acetic acid (no. 5.33001), acetonitrile (no. 1.00029), ammonia solution 25% (no. 5.33003), ammonium acetate (no. 73594), 13 C10, 15 N5-GTP (no. 645680), 2′,3′-cGAMP (no. SML1229), dextromethorphan (DXM; no. D9684), D3-dextrorphan (D3-DEX, no. D-041), DMSO (no. D5879), 45 bp DNA oligos (custom synthesis), formic acid (no. 33015), isopropanol (no. 34863), and methanol (no. 1.06035) were obtained from Sigma Aldrich (St. Louis, MO). ATP (no. V915B) substrate was purchased from Promega (Madison, WI). Citric acid (no. 7624.1), Tween 20 (no. 9127.1), and trifluoroacetic acid (TFA; no. 6957) were purchased from Carl Roth (Karlsruhe, Germany). Bovine serum albumin (BSA; no. 11945.03) and dithiothreitol (DTT; no. 20710.04) were obtained from Serva (Heidelberg, Germany). Tris (no. 108382), and MgCl2·6 H2O (no. 105833) were obtained from Merck Millipore (Burlington, MA). A 2 M KCl solution (no. AM9640G) was purchased from Thermo Fisher Scientific (Waltham, MA).
Biochemical cGAS Assay
The cGAS biochemical assay was performed as described previously. 10 In short, enzymatic reactions were set up in assay buffer containing 10 mM Tris (pH 7.5), 10 mM KCl, 5 mM MgCl2, 1 mM DTT, 0.01% BSA, and 0.001% Tween 20. A 2.5-fold concentrated intermediate mixture of cGAS enzyme and double-stranded DNA (12 nM and 0.32 µM final concentrations, respectively) was added to assay plate wells (384-/1536-well) containing either test compounds dissolved in DMSO (5 µg/mL, 1% DMSO final concentrations) or pure DMSO. The plates were then incubated for 10 min in a humidified chamber at 24 °C. Subsequently, a 1.67-fold concentrated equimolar ATP/13C10, 15 N5-GTP mixture (60 µM final concentration each) was added to each well and the plates were incubated for 1.5 h at 24 °C. Final assay volumes were 25 µL for 384-well and 5 µL for 1536-well plates, respectively. After incubation, the enzymatic reaction was stopped by adding 0.2 volume equivalents of 0.6% formic acid (v/v) containing the 2′,3′-cGAMP internal standard (1 µM final concentration). Each assay plate contained high (DMSO) and low (DMSO; assay buffer instead of enzyme/dsDNA mixture) controls to follow the enzymatic reaction. For dose–response experiments, 8-point semilogarithmic serial dilutions of compound were prepared in DMSO starting from 10 mM stock solutions (100 µM final concentration).
ADE-OPI-MS-Based Assay Readout
For ADE-OPI-MS-based sample acquisition, an Echo-MS device (Sciex, Concord, ON, Canada) was used, controlled by SciexOS software (v1.6.10) and operated in multiple-reaction monitoring (MRM) mode. The optimized carrier liquid comprised acetonitrile/methanol (1:1, v/v) + 30 mM NH4Ac (pH 9.5) + 0.05 mM citric acid at a flow rate of 550 µL/min to yield a stable vortex at the OPI inlet in combination with optimum signal performance. For contactless sampling, a total volume of 10 nL was ejected in 2.5 nL increments directly from sample containing microtiter plate wells into the carrier liquid vortex of the OPI. The well-to-well sampling frequency was 1.2 Hz (0.85 s/sample). The ESI source of the triple quadrupole MS instrument was operated in positive ionization mode with nebulizer gas (GS1) set to 90 psi and heater gas (GS2) set to 70 psi. Curtain gas and CAD gas were set to 25 psi and 10 units, respectively. The following MS parameters were used for analyte measurements: ion source temperature, 300 °C; spray voltage, 5000 V; dwell time, 35 ms; pause time, 5 ms; Q1 and Q3 operating at unit resolution. The following analyte-specific settings were used for the Q1 to Q3 transition (Q1 → Q3 [Da]), declustering potential (DP), collision energy (CE), and collision cell exit potential (CXP): DXM (Q1 272.4 → Q3 215.1, DP 75, CE 33, CXP 11), D3-DEX (Q1 261.2 → Q3 157.1, DP 126, CE 51, CXP 15), 2′,3′-cGAMP (Q1 675.1 → Q3 524.1, DP 100, CE 33, CXP 34), 13 C10, 15 N5-2′,3′-cGAMP (Q1 690.1 → Q3 529.1, DP 100, CE 33, CXP 34). After sample batch acquisition, data processing was performed within the SciexOS software using the following signal integration parameters: signal-to-noise ratio (S/N) threshold, 0; Gaussian smooth width, 0.6 points; summation window, 0.8 s; noise percent of baseline, 0%; recentering, 0.2 s. Endpoints were adjusted to local minima. The expected retention time was set to the minimum of 0.01 min for all analytes.
MALDI-TOF-Based cGAS Assay Readout
The spotting of samples onto MALDI target plates and the MALDI-TOF MS analysis were performed as described previously. 10 Briefly, 100 nL of matrix solution (saturated HCCA solution in acetonitrile/water [1:1, v/v] + 0.05% TFA) was spotted onto plain steel MALDI target plates employing a CyBio Well vario liquid handling system (Analytik Jena, Germany) equipped with ceramic tips and operated in 1536-well format and dried in a vacuum chamber. Subsequently, 100 nL of matrix solution and 100 nL of sample were aspirated successively from the matrix reservoir and the assay plate, respectively, and dispensed together onto the dried matrix spots. The MALDI target plate was then dried under vacuum and stored until analysis. Mass spectra were acquired with a rapifleX MALDI-TOF/TOF instrument (Bruker Daltonics). FlexControl (v4.0), FlexAnalysis (v4.0), and MALDI PharmaPulse (v2.0) software (all Bruker Daltonics) were used for MS acquisition and data analysis. Target plates were automatically inserted into the MALDI-TOF device, and 1000 laser shots per sample spot were subsequently accumulated in negative ionization mode to follow the m/z signals of internal standard ([M-H]– = 673.0916) and the product of the enzymatic assay ([M-H]– = 688.1103).
Data Analysis
Data, processed with SciexOS (ADE-OPI-MS) or MALDI Pharma Pulse (MALDI-TOF MS), were exported as a text (.txt) file or comma-separated values (.csv) file. Data sets were further processed with either GraphPad Prism (v9.00, GraphPad Software, La Jolla, CA) or in-house laboratory information management system software. cGAS activity was tracked by analyzing the signal area values (ADE-OPI-MS) or signal intensity values (MALDI-TOF MS) of the enzymatic product ( 13 C10, 15 N5-2′,3′-cGAMP) as well as for the corresponding unlabeled internal standard (2′,3′-cGAMP) and/or the ejection control DXM. The signal ratio of the reaction product to the respective standard was calculated to diminish variations ascribed to the sampling procedure or the MS readouts. The average of relevant values was calculated for high controls and low controls, respectively, for every assay plate. Generated sample data were then normalized against high controls (100%) and low controls (0%) and expressed as percentage of control (PoC) values. IC50 calculation was performed using MegaLab software by fitting the data to a four-parameter logistical equation. GraphPad Prism was utilized for graphical representation of the data. The assignment of compounds to the corresponding measurements was achieved by software-aided deconvolution of every 1536-well assay plate to the corresponding 384-well substance plates during data analysis, as described before. 4
Results and Discussion
HTS requires robust, sensitive, and fast readout strategies to cope with large sample numbers while preserving data quality for efficient hit identification. ADE-OPI-MS has the potential to fill a current technological gap in the field of label-free MS-based readout technologies by combining ESI with an HTS-capable and contactless sampling interface. However, reports on relevant HTS aspects of this innovative technology are so far limited to prototypic devices and model analytes comprising low molecular weight, balanced lipophilicity, and favorable ionization behavior during ESI.27,31 To conduct a detailed evaluation of ADE-OPI-MS for HTS, we have undertaken an assessment of the recently commercialized Echo-MS system for HTS suitability and selected the innate inducer of immune response cGAS as a target.
We have previously reported the conduction and results of a large-scale screening campaign against this validated target using automated MALDI-TOF MS as a label-free readout. 10 In that study, the intrinsic MALDI-TOF signal variability was compensated by employing unlabeled 2′,3′-cGAMP as an internal standard, in turn allowing the use of 13C10, 15 N5-GTP as an enzyme substrate to eventually generate 13C10, 15 N5-2′,3′-cGAMP as the enzymatic reaction product ( Fig. 1B ). These assay conditions were readily adapted for ADE-OPI-MS analysis, which allowed us to use the established MALDI-TOF readout as a reference method for data comparison.
CGAS ADE-OPI-MS Assay Development
ADE-OPI-MS is expected to be more robust against ion suppression by matrix constituents compared with conventional direct flow injection ESI-MS because of the sample dilution effect that occurs in the carrier liquid solvent stream running from the OPI to the ion source. 25 This translates into a potential advantage of the technique, especially for HTS applications where samples are prepared in highly condensed formats and sample dilution prior measurement is not feasible without additional liquid handling and sample transfer steps. The highly polar 2′,3′-cGAMP enzyme reaction product is a challenging analyte in this context, as its two phosphodiester linkages are prone to alkali adduct formation and metal ion complexation, potentially decreasing ESI efficiency and therefore analytical sensitivity of the method.
To assess the matrix tolerance of ADE-OPI-MS for 2′,3′-cGAMP measurements, we recorded ion traces of analyte spiked into pure water or into undiluted cGAS assay buffer and compared the results to the reference analyte DXM. A mixture of acetonitrile/methanol (1:1, v/v) served as carrier liquid, resulting in stable vortex formation at a carrier liquid flow rate of 550 µL/min. When 2′,3′-cGAMP was diluted in assay buffer (1 µM), no quantifiable signals were obtained ( Fig. 1C ). Recording full scans (Q1) in the mass range m/z 300–820 revealed substantial formation of multiple sodium adducts and a prominent decrease of the [M+H]+ ion species (m/z 675.1), which could be partially restored upon the addition of an ammonium salt to the carrier liquid ( Suppl. Fig. S1 ). To investigate this effect, the impact of increasing NH4Ac concentrations (5-30 mM) on 2′,3′-cGAMP (10 µM) and DXM (250 nM) signal performance was investigated. For 2′,3′-cGAMP, increased signals (mean area = 5.3 × 10⁵ and 1.1 × 10⁵ cps for analyte in H2O or assay buffer, respectively) with acceptable peak shape were obtained when 5 mM NH4Ac was added to the carrier liquid ( Suppl. Fig. S2 ). Signal area values decreased by up to 20% upon further increasing the NH4Ac concentration. Contrarily, the S/N increased due to a reduction in MRM signal noise (mean S/N = 80 at 5 mM NH4Ac and mean S/N = 143 at 30 mM NH4Ac). The observed signal suppression was about 80% for all NH4Ac concentrations as estimated by comparing signal areas of 2′,3′-cGAMP diluted in water or assay buffer ( Suppl. Fig. S2 ). DXM was mainly unaffected by the carrier liquid additive, and quantifiable DXM signals were acquired under all tested conditions with signal suppression in the range of 50%−60%. In conclusion, best results in terms of sensitivity and peak performance were obtained for 2′,3′-cGAMP in assay buffer using 30 mM NH4Ac added to the carrier liquid as indicated by S/N and full peak width at half maximum (FWHM) values ( Suppl. Fig. S2 ). Peak shape was further improved by the addition of citric acid (0.05 mM) as a chelating agent and adjustment of the carrier liquid pH (pH 9.5). These modifications were effective in avoiding minor peak tailing, presumably caused by interaction of 2′,3′-cGAMP with metal parts of the ESI electrode.
Use of optimized carrier liquid conditions eventually enabled the direct measurement of 2′,3′-cGAMP in assay buffer with baseline peak separation at 1 Hz ejection frequency ( Fig. 1C ). A serial dilution of 2′,3′-cGAMP in assay buffer covering a concentration range of almost four orders of magnitude (0.02–10 µM) revealed high linearity based on signal area values (R2 = 0.999) and a limit of detection (LoD) of 25 nM, demonstrating sensitive analyte detection and high dynamic range of the analytical method ( Fig. 1D ). Although ion suppression, alkali adduct formation, and other oppressive effects arising from analyte matrix constituents can pose a challenge for adequate analyte detection and quantification from undiluted samples, the presented data imply that sufficient analytical sensitivity can be achieved by optimization of the carrier liquid composition, which therefore should be considered as an integral part of ADE-OPI-MS assay development.
The Echo-MS device can eject discrete 2.5 nL droplets at frequencies up to 475 Hz. To assess if analytical sensitivity could be further improved by ejecting larger cumulative volumes per measurement, the ejection volume was varied between 2.5 and 80 nL for 2′,3′-cGAMP diluted in either water or assay buffer. A linear signal area increase for up to 40 nL ejection volume was found for 2′,3′-cGAMP in water, which is consistent with previous reports, 26 whereas nonlinear behavior was observed when assay buffer was the sample matrix ( Suppl. Fig. S3 ). This could be explained by progressively growing signal suppression caused by the buffer components, which was not entirely counterbalanced by the elevated amount of analyte ejected. However, for HTS applications, where the sample volume and analyte matrix are consistent throughout measurements, a nonlinear sample volume to readout signal relationship is acceptable. In such cases, a suitable compromise between analytical sensitivity, sample consumption, and measurement speed needs to be found. Based on these considerations, we selected 10 nL as optimal sample volume for cGAS inhibitor screening.
ADE-OPI-MS enables fast sampling rates directly from assay plates with requiring only nanoliter sample consumption. It therefore provides an attractive approach for performing time-resolved experiments by continuous sampling from individual wells. To assess the ability of the method to acquire time-dependent data sets from a single well and thereby enable enzyme kinetics experiments with low sample consumption, the Km app value of cGAS for an equimolar mixture of the two substrates ATP and 13C10, 15 N5-GTP was determined by incubating 48 nM enzyme with a serial dilution of substrates and monitoring the reaction progress for 25 min by repetitive ADE-OPI-MS measurements ( Fig. 1E ). The Km app value of 75 µM is within the range of values reported in the literature (22–190 µM) 32 and was acquired from just 10 wells in less than 30 min. The method was equally efficient in monitoring the reaction progress for up to 2 h using final assay conditions, which revealed a linear signal increase over time indicated by signal area and area ratio values ( Suppl. Fig. S4 ). The independence of ADE-OPI-MS on the availability of a chemically identical internal standard for accurate quantification is a beneficial feature that adds flexibility to assay development and early project phases where the availability of suitable internal standards can be limited. Further, the ability to acquire kinetic data in situ from single incubations is reagent saving and poses a compelling advantage over methods requiring additional sample preparation steps, which emphasizes the versatility of this method.
HTS-Relevant Performance Characteristics of ADE-OPI-MS
With optimized carrier liquid composition and proven analytical sensitivity, we focused on aspects related to sample throughput and assay miniaturization. To this end, assay plates containing DMSO controls were prepared and measured at sampling frequencies ranging from 1.5 to 0.6 s/sample. Stable Z′ and signal area coefficient of variation (CV) values were obtained for analytical cycle times above 0.75 s/sample ( Suppl. Fig. S5A ). Based on these results, we selected 0.85 s/sample as a suitable sampling interval, which translated into total analysis times of 5.44 min and 21.76 min for 384-well and 1536-well plates, respectively.
Next, we transferred the assay to the 1536-well format and performed a screen of 5500 compounds containing representatives of our in-house small-molecule library. A typical extracted ion chromatogram (XIC) of a 1536-well plate with enlargements of peak cohorts is depicted in Figure 2A . The Echo-MS device uses short sample sequences from a control well at the beginning and end of every run to enable the alignment of the acoustic unit time stamp with acquisition data coming from the MS instrument. 26 This adds, together with a short equilibration time before and after sample acquisition, an additional lag time of about 1.7 min to the total acquisition time of an assay plate. A stable S/N of 60 was achieved for DMSO controls, with 11 data points across peaks and mean full width at 5% height of 782 ms, ensuring accurate quantification and adequate peak separation at subsecond sampling speed. Robust Z′ values above a predefined quality threshold of 0.5 were assessed for 1536-well plates of the test set (n = 5) employing area values (Z′ = 0.76) or ratio values (Z′= 0.69) for data processing ( Fig. 2B ) and results fitted to a Gaussian distribution (R2 = 0.998), with reasonable hit rates depending on statistical thresholds ( Fig. 2C ).
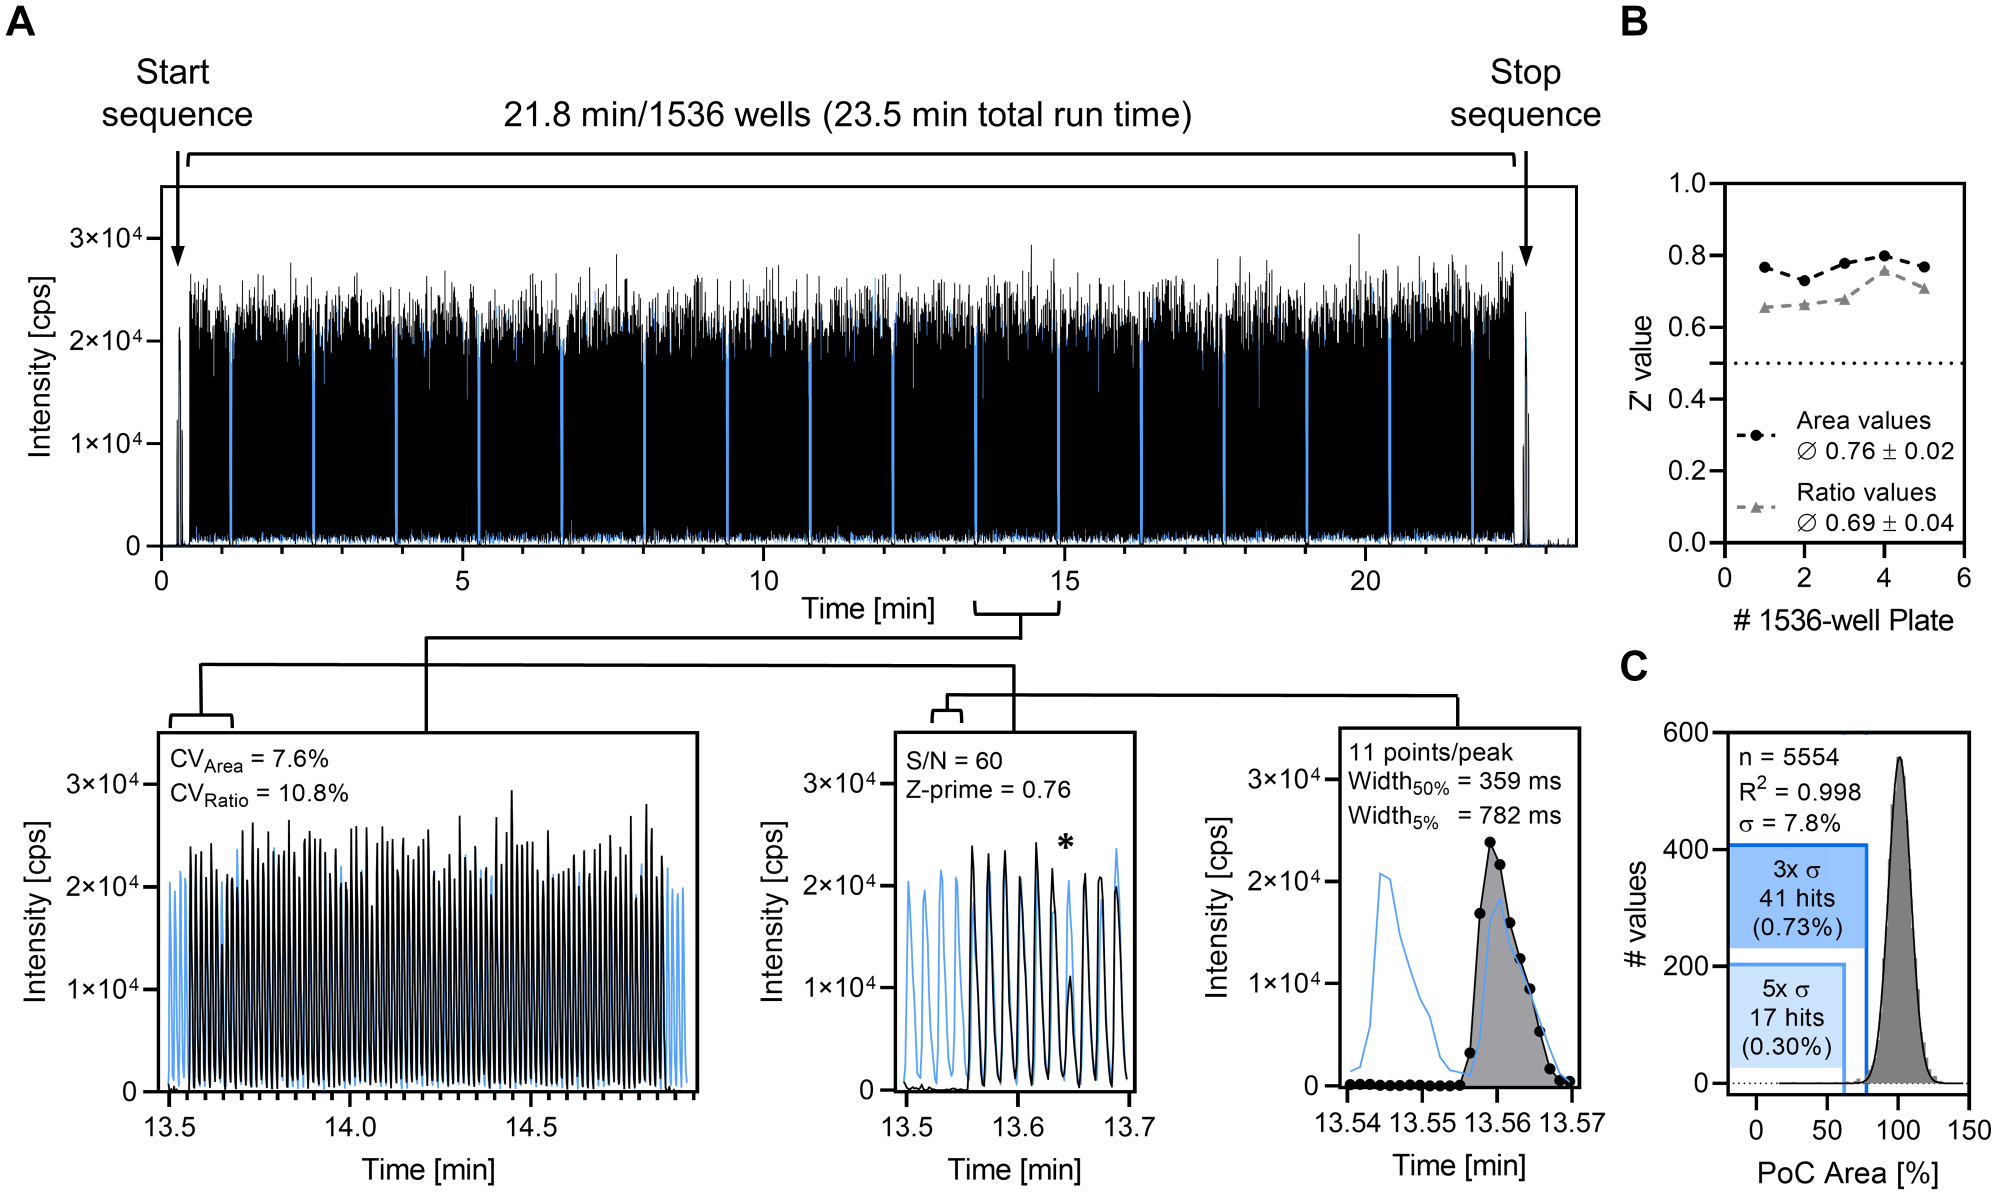
Performance characteristics of ADE-OPI-MS. (
The average signal variability in DMSO controls was found to be lower for area values (CV = 7.6%) compared with ratio values (CV = 10.8%) when internal standard was added at a concentration that equals the amount of product formed in the course of the enzymatic reaction. We hypothesize that this is because of the relatively low overall ion counts of 13C10, 15 N5-2′,3′-cGAMP (mean signal area = 8.1 × 10³ cps; n = 320) and internal standard signals, which resulted in minor discrepancies in the peak integration procedure, ultimately yielding higher variability for relative quantification. A similar effect at decreased concentrations was observable for DXM and its internal standard D3-DEX when comparing measurements at 100 nM (mean signal area DXM = 4.1 × 10⁴ cps; CV area DXM = 5.3%; CV ratio DXM/D3-DEX = 5.6%; n = 30) and 15 nM (mean signal area DXM = 6.9 × 10³ cps; CV area DXM = 6.1%; CV ratio DXM/D3-DEX = 10%; n = 30) concentrations. This suggests that the observed effect is dependent on the concentration and the ionization efficiency of respective analyte. In the case of the presented cGAS assay, data evaluation based on area values was preferred, although assay statistics well above the quality threshold (Z′ > 0.5) were demonstrated for both processing methods. Along these lines, these results emphasize that good data quality for ADE-OPI-MS does not rely on the internal standard for quantitative studies, enabling the assay when an adequate standard is hard to obtain or the inclusion of an internal standard is not desired.
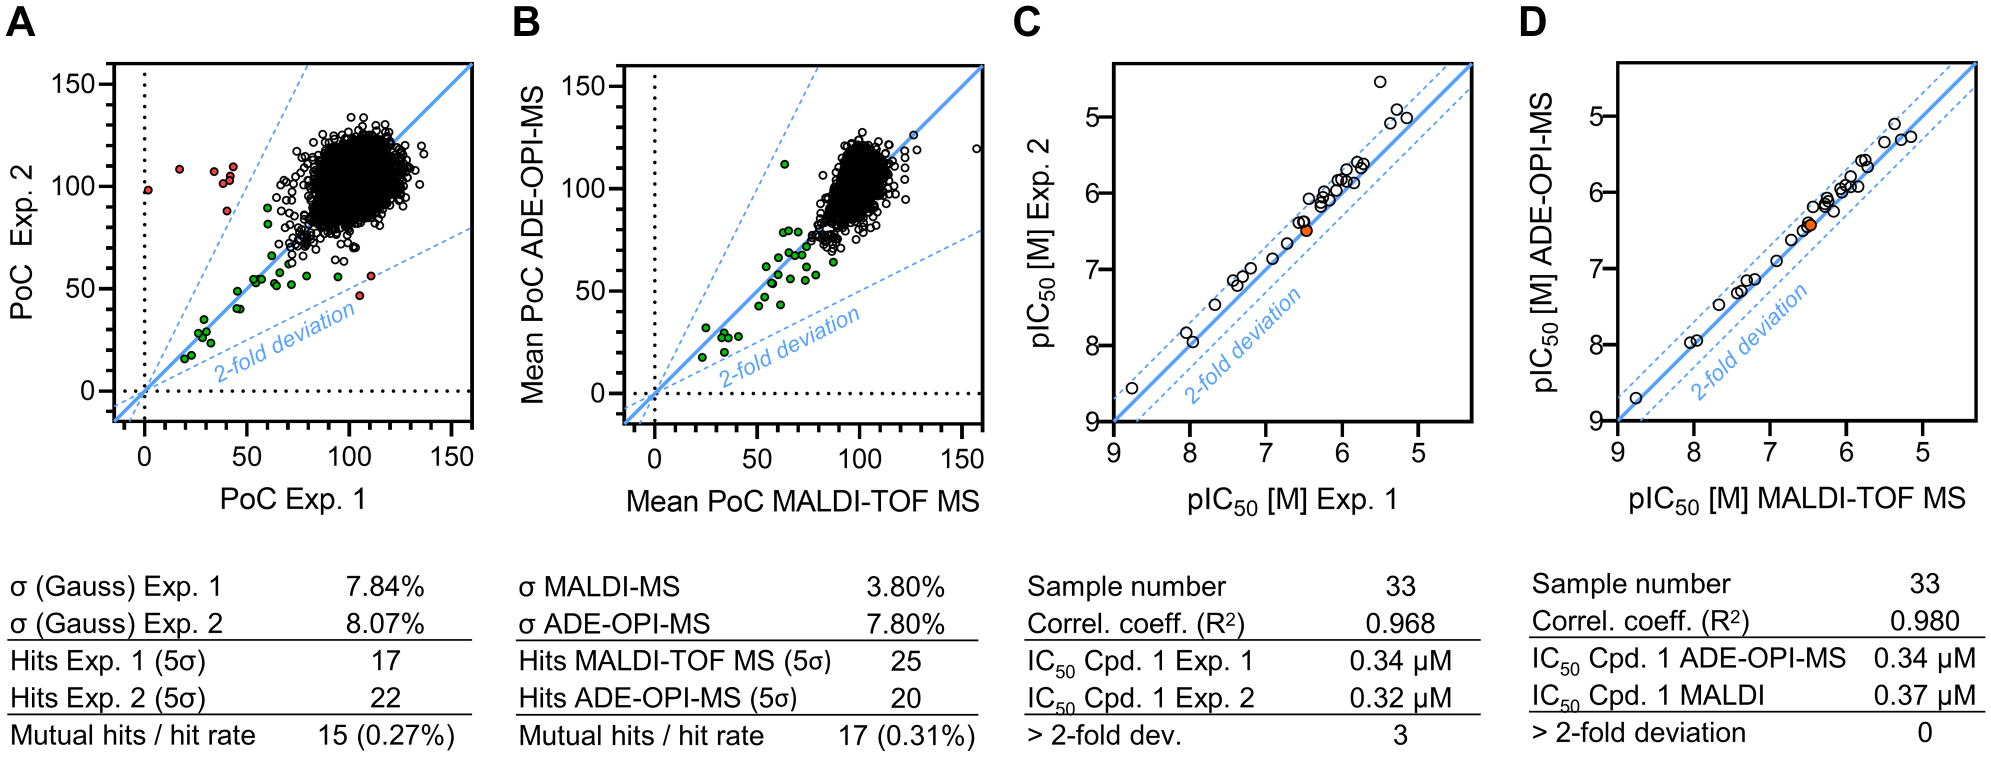
Comparing the results of two independent test runs showed high concordance of primary screening data, confirming the reproducible identification of assay hits ( Fig. 3A ). When the data analysis was performed based on signal area values, a small set of PoC values were observed (10/5554; 0.18%) that deviate by more than a factor of 2 between individual replicates. We speculate that these deviations are caused via slightly misdirected sample ejection from respective source wells, resulting in incomplete sample capture by the OPI since decreases in peak area values were similarly observed for 13C10, 15 N5-2′,3′-cGAMP and internal standard and the acoustic unit log file continuously confirmed successful sample ejection. When data analysis was performed on signal area ratio values, no outliers (>2-fold deviation) were observable ( Suppl. Fig. S5B ). Further, the hit sets generated by both processing methods were in full agreement, and no consistent internal standard signal deviation (>3× SD, n = 5554) was found in both experiments, thereby excluding ion suppression by the test compound (at 10 µM concentration) as a possible reason for signal reduction. This suggests that the use of an ejection control should be considered during HTS if data analysis based on area values is desired, either by adding a generic standard or by monitoring a reaction substrate. Based on the data acquired for the presented project, the incidence of such sampling errors is about 0.1% (10/11,108 sampling events), which translates into one additional 1536-well plate to remeasure outliers from a 1-million-compound screen. Alternatively, since sample consumption during ADE-OPI-MS measurements is negligible, individual samples could be readily remeasured in case of incomplete sample transfer without the need of additional sample generation.
Intra- and intermethod comparison of analytical performance. (
To further validate the identified hit set, we compared ADE-OPI-MS data to results of the same test set separately analyzed using MALDI-TOF MS as a readout. Again, good correlation between PoC values and a hit set overlap of 85% were found in the intertechnology comparison, demonstrating the suitability of ADE-OPI-MS for HTS. The same observations were made when comparing concentration–response data of a set of 33 small molecules, including the published reference inhibitor compound 1 ( Suppl. Fig. S5C ), 34 blocking cGAS activity with IC50 values spanning about four orders of magnitude. Good data correlation was found for the intratechnology (R2 = 0.968) ( Fig. 3C ) and intertechnology (R2 = 0.980) ( Fig. 3D ) comparison, underscoring the fidelity of the method and the comparability of ADE-OPI-MS with the selected reference method MALDI-TOF MS.
Integration of ADE-OPI-MS into an Automated HTS Platform
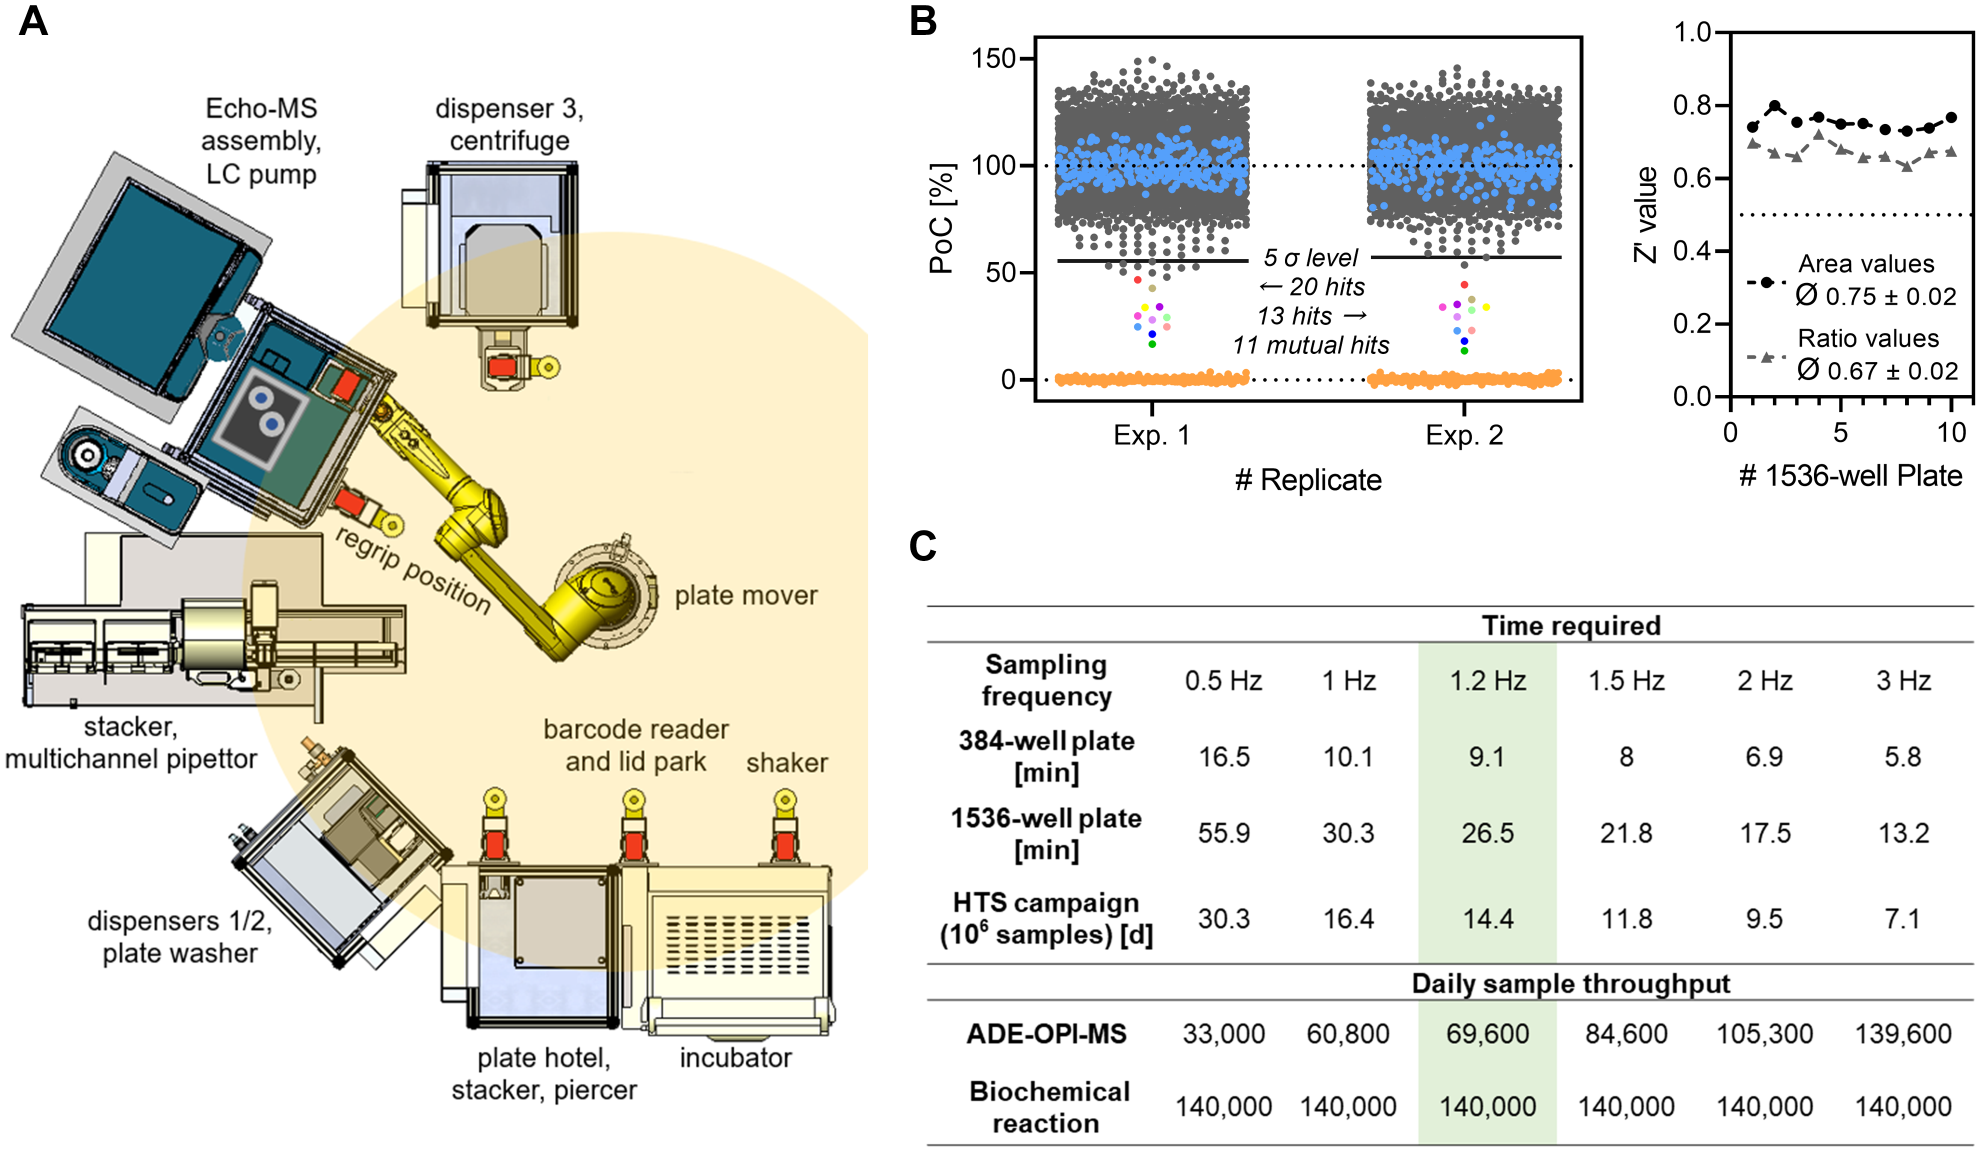
To enable the unattended generation and processing of large sample numbers, we integrated the Echo-MS device into BI’s HTS infrastructure, which provides capabilities for fully automated liquid handling, plate movement, and plate processing. The platform is controlled by Momentum laboratory automation software (Thermo Fisher Scientific) for individual instrument control and process scheduling. A custom driver software was used for Echo-MS integration that allowed for software-controlled sample plate (un-)loading, batch file transfer, and data acquisition. In this way, Echo-MS was merged with assay automation into a versatile HTS platform enabling an in-line ADE-OPI-MS assay readout without the need for manual intervention. A schematic illustration of the technology platform with descriptions of compiled devices is depicted in
Figure 4A
. Maintained assay performance and quality were confirmed by performing two consecutive screens of the 5500-member compound set using this fully automated setup (
Assay and ADE-OPI-MS readout automation platform. (
With the presented automation platform, up to 140,000 biochemical reactions can be generated per day, which makes the maximum achievable throughput dependent on the acquisition speed of the ADE-OPI-MS device. Under the conditions described in this report using the Echo-MS system with a sampling rate at 0.85 s/sample (1.2 Hz), 69,600 samples can be processed unattended based on a regular 20 h assay day in 1536-well format, which enables the conduction of a large-scale screening campaign (1 million data points) in less than 15 days. Although this throughput unambiguously qualifies for HTS applicability, it does not yet match the speed of established HTS readouts and does not fully exploit the capacity of the biochemical reaction automation. Multiplexing the analysis of biochemical reactions using substrates featuring different heavy isotope patterns could help in increasing the maximum throughput. 35 Alternatively, Häbe et al. recently outlined the optimization of critical ADE-OPI-MS hardware components to enable sample cycle times in the range of 3 samples/s, effectively increasing the maximum throughput to more than 139,000 samples/day and thereby matching the capacity of the biochemical reaction. 31 This demonstrates space for improvement of upcoming generations of the Echo-MS device and conclusively emphasizes the promising potential of ADE-OPI-MS as an HTS readout. For better comparison of achievable throughput, estimations of theoretical capacities and cycle times of the presented assay platform for a range of sampling frequencies are tabulated in Figure 4C . In its current state, the presented technology platform fits fully automated and HTS-compatible assay capabilities with a versatile in-line ADE-OPI-MS-based readout, further expanding the label-free HTS technology portfolio.
Assessment and Considerations of System Robustness
So far, we have described the optimization of critical process parameters and analytical throughput. An additional crucial prerequisite to qualify an analytical technology for HTS compatibility is its robustness. Insufficient robustness of the analytical method and the employed devices results in inconsistent data quality and laborious maintenance cycles that cause instrument down time, resulting in extended project timelines, additional costs, and increased demand for manual intervention. We have previously reported on the problem of cumulative OPI contamination after repetitive ejection of DXM containing samples with challenging matrices (crude plasma, high salt buffer). 31 To assess the robustness of the Echo-MS device and the ADE-OPI-MS cGAS assay readout under HTS conditions, we simulated a full screening day by repetitive measurement of ten 384-well assay plates containing full enzyme reactions to cumulatively acquire 65,000 samples within 24 h, which is close to the calculated maximum daily throughput (69,600 samples) ( Fig. 4C ) of the automation platform for this assay. As we have demonstrated that 13C10, 15 N5-2′,3′-cGAMP signal area values show acceptable variability (CV < 10%), we replaced the internal standard by 50 nM DXM as a generic ejection control to allow for the comparison of these chemically diverse analytes with respect to their ADE-OPI-MS response throughout the course of the screening day simulation ( Fig. 5A ). We observed stable assay performance for 70 consecutively measured assay plates (26,880 samples), which then declined until the acceptance criteria of Z′ > 0.5 was violated after measuring 120 plates (46,080 samples). Remarkably, the decrease in assay quality was fully attributable to a progressive increase in 13C10, 15 N5-2′,3′-cGAMP signal variability indicated by CV values, while DXM was not affected. In turn, calculating the signal area ratio of the 13C10, 15 N5-2′,3′-cGAMP analyte and the DXM ejection control was insufficient for reestablishing assay quality and ratio values progressed similarly to analyte area values.
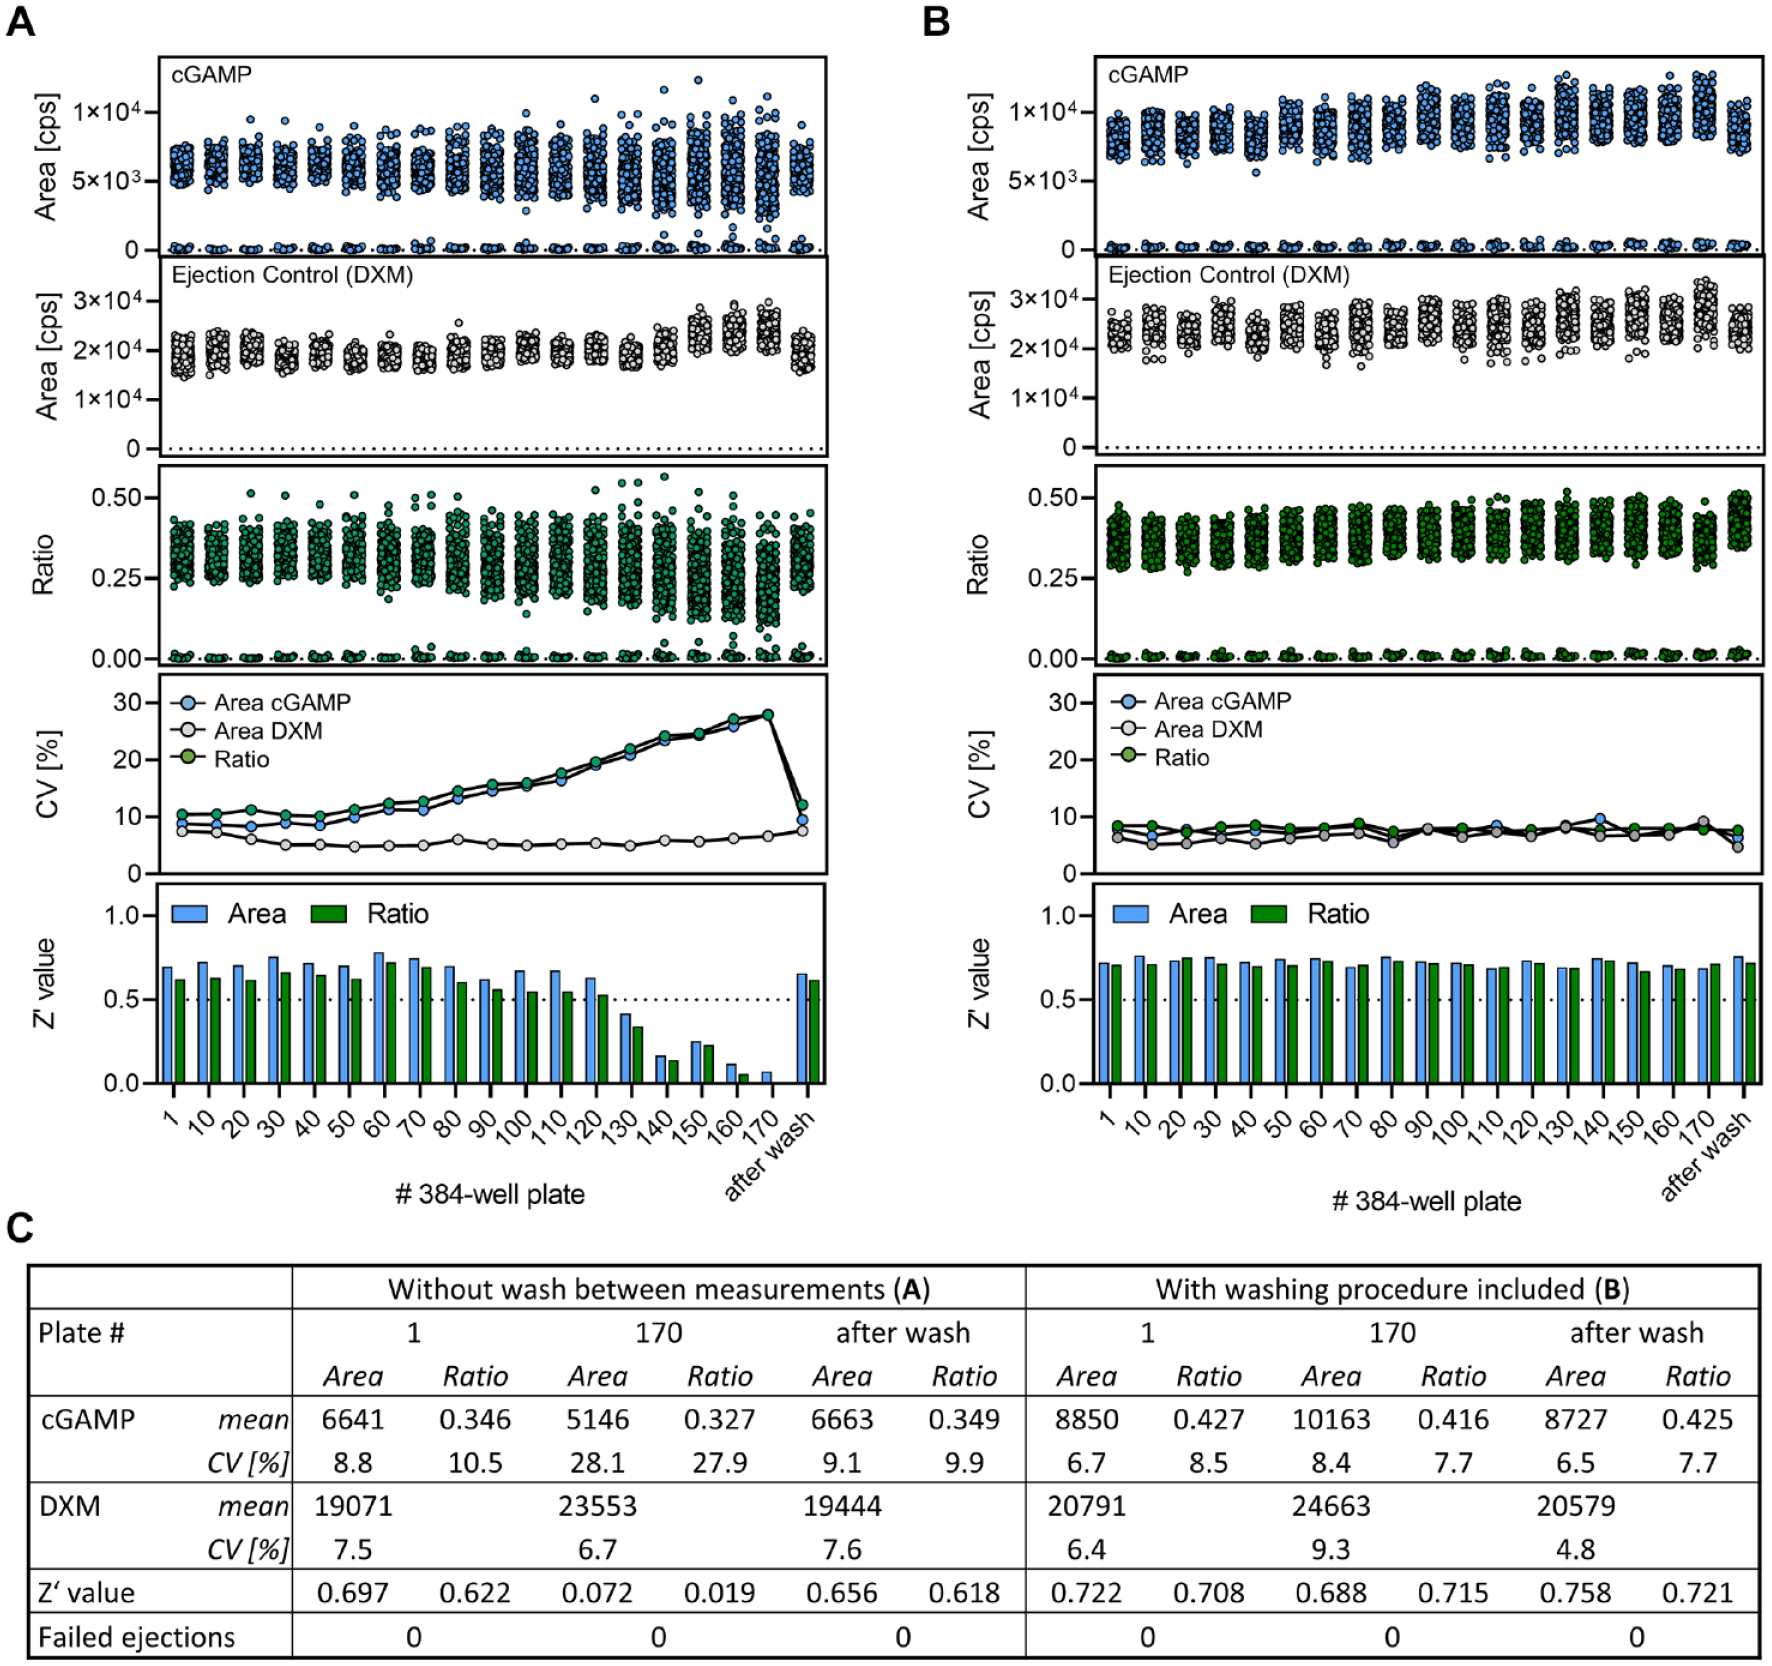
Assessment of system robustness of the ADE-OPI-MS-based cGAS assay readout. (
Visual inspection of the OPI after injecting 65,000 samples revealed minor salt depositions, suggesting insufficient self-cleaning capability of the transfer capillary and the ESI electrode as a possible reason for diminished analytical performance. In addition, a substantial increase in MRM trace background was observable when comparing XIC traces of the first and last assay plates of the experiment (
Flushing of the OPI and transfer capillary with a washing fluid to maintain analytical performance proved to be straightforward and effective, for which reason it was appealing to integrate this procedure into the automation protocol. However, the built-in single-line gear pump of the Echo-MS does not allow for fast and automated switching between different liquids and creates a dead volume of several milliliters, resulting in extensive purge durations. We therefore bypassed the internal gear pump and instead connected an external binary liquid chromatography (LC) pump (1290 high-speed binary pump) via the pump’s internal 6-port valve directly to the OPI ( Suppl. Fig. S7B ). The LC pump enables immediate alternation between standard carrier liquid and washing liquid and features a total dead volume below 300 µL, thereby delivering the respective liquid to the ESI ion source in less than 1 min using OPI-compatible flow rates. A short 2 min washing cycle using a water/methanol mixture (7:3, v/v) supplemented with 0.1% acetic acid was scheduled after the acquisition of every assay plate and controlled by Momentum automation software. Because the washing procedure aligns with the idle instrument time of the Echo-MS, required for plate movement and loading, it does not interfere with the overall throughput of the system and can be seamlessly integrated into the automation process.
With this in-line cleaning option the HTS screening day simulation was repeated, and now consistent assay quality and robustness were obtained across 170 processed 384-well plates (65,000 samples) ( Fig. 5B ). Compared with the experiment devoid of an integrated cleaning step, consistent CV and Z′ values were determined for both processing methods based on signal area or area ratio values, respectively. An additional prolonged washing of the OPI after measurements did not result in any further improvement of assay quality ( Fig. 5B , see label “after wash”). The established cleaning procedure can therefore be considered effective in increasing the system robustness to match HTS requirements. The screening day simulation results with and without the integrated washing procedure were tabulated for comparison in Figure 5C .
Overall, we have demonstrated the requirement of an in-line OPI cleaning option to achieve HTS-capable method robustness for the automated ADE-OPI-MS-based assessment of cGAS activity. This caveat was addressed by integrating an external LC pump into the system, enabling fast switching of carrier liquid composition and allowing for active OPI cleaning between assay plate acquisitions. Although the need for an active cleaning option may depend on the chemical nature of the analyte, the composition of the sample matrix, and the employed carrier liquid, the adaptation described herein expands the overall applicability and increases the instrument robustness of our ADE-OPI-MS assay platform.
In conclusion, we have established ADE-OPI-MS as a large-scale HTS-capable assay readout by its integration into our HTS automation portfolio. Carrier liquid optimization was identified as a critical assay development parameter that enabled the sensitive and accurate detection of cGAMP from unprocessed samples in 1536-well format with subsecond analysis cycle times. A screen of 5500 compounds in single-concentration incubations and 33 concentration–response curves showed high reproducibility and analytical performance comparable to the established MALDI-TOF MS readout. System robustness was assessed to be a limiting parameter hampering the HTS compatibility in case of the selected model project. This hurdle was overcome by scheduling short cleaning cycles after the acquisition of every plate. Comparing the results of individual screening day simulations comprising 65,000 samples demonstrated the effectiveness of this approach in maintaining system robustness and analytic performance.
Altogether, the established ADE-OPI-MS platform fills in a current technological gap by adding ESI-based MS to the label-free high-throughput readout portfolio. Technical improvements related to the transfer capillary length and maximum nebulizer gas flow, as suggested by our previous report, will help to further increase sample throughput toward cycle times achievable with alternative methods, like MALDI-TOF. ADE-OPI-MS features targeted ESI-based analysis and are less dependent on the availability of suitable internal standards and sample preparation steps, which eases sample processing and enables data acquisition in real time. The synergy that is created by the availability of HTS-compatible MS readouts featuring different ionization strategies and operational modes will aid in further expanding the analyte and target accessibility for direct label-free analysis in high-throughput applications.
Supplemental Material
sj-pdf-1-jbx-10.1177_24725552211028135 – Supplemental material for Acoustic Ejection Mass Spectrometry: A Fully Automatable Technology for High-Throughput Screening in Drug Discovery
Supplemental material, sj-pdf-1-jbx-10.1177_24725552211028135 for Acoustic Ejection Mass Spectrometry: A Fully Automatable Technology for High-Throughput Screening in Drug Discovery by Roman P. Simon, Tim T. Häbe, Robert Ries, Martin Winter, Yuting Wang, Amaury Fernández-Montalván, Daniel Bischoff, Frank Runge, Wolfgang Reindl, Andreas H. Luippold and Frank H. Büttner in SLAS Discovery
Footnotes
Acknowledgements
We thank Tamara Halder and Helga Bronner for their valuable support in conducting and automating the biochemical assay. We further thank Chang Liu and Tom Covey (AB Sciex) for very fruitful discussion and guidance on the technical aspects of ADE-OPI-MS. In addition, we would like to thank Dean Mulyk and Snjezana Bundalo (Thermo Fisher Scientific) for developing and providing the customized Thermo Momentum Echo-MS driver software. Also, we thank Gisela Schnapp (Boehringer Ingelheim, Department of Medicinal Chemistry) for providing the cGAS protein.
Declaration of Conflicting Interests
The authors declared the following potential conflicts of interest with respect to the research, authorship, and/or publication of this article: All authors are employees of Boehringer Ingelheim Pharma GmbH & Co. KG and completed this work within the scope of their employment.
Funding
The authors disclosed receipt of the following financial support for the research, authorship, and/or publication of this article: All work was completed as work-for-hire for the employer Boehringer Ingelheim Pharma GmbH & Co. KG.
Supplemental material is available online with this article.
References
Supplementary Material
Please find the following supplemental material available below.
For Open Access articles published under a Creative Commons License, all supplemental material carries the same license as the article it is associated with.
For non-Open Access articles published, all supplemental material carries a non-exclusive license, and permission requests for re-use of supplemental material or any part of supplemental material shall be sent directly to the copyright owner as specified in the copyright notice associated with the article.