
Abstract
A core aspect of epithelial cell function is barrier integrity. A loss of barrier integrity is a feature of a number of respiratory diseases, including asthma, allergic rhinitis, and chronic obstructive pulmonary disease. Restoration of barrier integrity is a target for respiratory disease drug discovery. Traditional methods for assessing barrier integrity have their limitations. Transepithelial electrical resistance (TEER) and dextran permeability methods can give poor in vitro assay robustness. Traditional junctional complex imaging approaches are labor-intensive and tend to be qualitative but not quantitative. To provide a robust and quantitative assessment of barrier integrity, high-content imaging of junctional complexes was combined with TEER. A scalable immunofluorescent high-content imaging technique, with automated quantification of junctional complex proteins zonula occludens-1 and occludin, was established in 3D pseudostratified primary human bronchial epithelial cells cultured at an air–liquid interface. Ionic permeability was measured using TEER on the same culture wells.
The improvements to current technologies include the design of a novel 24-well holder to enable scalable in situ confocal cell imaging without Transwell membrane excision, the development of image analysis pipelines to quantify in-focus junctional complex structures in each plane of a Z stack, and the enhancement of the TEER data analysis process to enable statistical evaluation of treatment effects on barrier integrity. This novel approach was validated by demonstrating measurable changes in barrier integrity in cells grown under conditions known to perturb epithelial cell function.
Keywords
Introduction
Epithelial barriers provide the first line of defense, protecting internal organs from the external environment. An intact and functional epithelial barrier is important for maintaining key biological functions of the respiratory epithelium.1,2 These functions include epithelial cell proliferation, differentiation, permeability, and the production of pro-inflammatory mediators that modulate the respiratory airway’s immune response. 3 Airway epithelial barrier polarity and permeability are controlled by protein complexes that form tight junctions, adherens junctions, and desmosomes between adjoining cells. 1 Tight junction complexes are located at the apical aspect of epithelium and control paracellular transport pathways between adjacent cells. They consist of scaffolding zonula occludens (ZO) proteins that connect transmembrane tight junction proteins, such as occludin and claudins, to the actin cytoskeleton, and junctional adhesion molecules. Adherens junctions, located lower in the epithelium, are formed by the transmembrane protein E-cadherin and catenin family proteins. Adherens junctions are key for cell–cell adhesion; they maintain cell polarization and regulate epithelial–mesenchymal transition (EMT). Desmosomes are located on the basolateral surface of the epithelium and connect to intermediate filaments. 1
Epithelial barrier dysfunction is thought to play a significant role in several chronic respiratory illnesses, including asthma,2,4 allergic rhinitis,5,6 and chronic obstructive pulmonary disease (COPD). 7 In asthma and allergic rhinitis, a defective epithelial barrier develops; in COPD, epithelial damage is caused by exposure to external irritants, such as cigarette smoke. Robust methods for assessing the formation and function of the epithelial barrier are needed for developing novel therapeutics for respiratory disorders.
Preclinical respiratory research primarily utilizes a 3D in vitro Transwell model consisting of primary human bronchial epithelial cells (HBECs) cultured at an air–liquid interface (ALI) on a semipermeable membrane. This model is currently regarded as the gold-standard in vitro model for studies of respiratory epithelium, with high predictive and face validity when compared with submerged HBEC or cell line-based ALI models, which lack key features of the respiratory tract in vivo. 8 HBECs are cultured to confluency in Transwell inserts before the media is removed from the apical surface of the cells, exposing the cells to air. The cells are cultured over a period of 4–6 weeks, during which they undergo mucociliary differentiation into goblet, club, and ciliated cell phenotypes, forming a pseudostratified 3D epithelium. The formation of junctional complexes between adjacent cells in this model forms an in vitro epithelial barrier.
Several techniques have been developed to qualitatively or quantitatively characterize epithelial barrier integrity in ALI cultures. These include tight junction complex protein visualization by microscopy; macromolecular permeability using labeled large-molecular-weight molecules, such as fluorescein isothiocyanate (FITC)-labeled dextrans; and ionic permeability by transepithelial or transendothelial electrical resistance (TEER).9,10 In this study, to achieve a combined approach to profiling epithelial barrier integrity, TEER and imaging of junctional complex proteins were selected as methodologies that could be used to generate complementary data from the same HBEC ALI culture well.
TEER is a noninvasive, real-time quantitative method for measuring barrier integrity in Transwell culture models. The two main techniques typically used to measure TEER in in vitro models are the Ohm’s law electrical resistance method and impedance spectroscopy.9,11 A number of factors can affect assay robustness of TEER measurements, including temperature, cell seeding density and culture time, media composition, and shear stress. 9 When performing the Ohm’s law method using a voltohmmeter with a handheld “chopstick” electrode pair, variation can also be introduced by the positioning of the electrodes in the apical and basolateral compartments of a Transwell epithelial cell culture and by the potential for the electrodes to cause damage to the cell layer during measurement. All these factors need to be well controlled to minimize assay variability. 9
Immunofluorescent imaging has also been used extensively in HBEC ALI cultures to determine ciliation and formation of junctional complexes.12–14 ALI culture methodology has experienced some level of automation and scalability in recent years, such as incorporation of bioreactor culture mechanisms. 15 The fluorescent imaging methods used to evaluate in vitro ALI models remain labor-intensive and lack automated image analyses to enable batch quantification. As a result, they offer poor scalability, which has limited use in target validation studies and higher-throughput drug discovery. High-magnification fluorescent microscopy protocols for 3D respiratory epithelium ALI cultures typically involve several manual steps. Cells are fixed, blocked, and permeabilized within the Transwell insert. Then the insert membranes are manually excised, prior to in situ immunolabeling of junctional complex proteins. Finally, the inserts are individually inverted and mounted onto coverslips for imaging. This method is required to allow visualization of cells growing at ALI with the high-magnification lenses needed to image cilia or junctional complex proteins. Imaging of the 3D epithelium formed in HBEC ALI cultures can also be a challenging and time-consuming process because it requires layered, Z-plane confocal imaging to enable quantification.
We present a validated, systematic, and scalable 3D quantitative immunofluorescent imaging technique to assess barrier integrity in situ within Transwell inserts via the evaluation of junctional complex proteins (ZO-1 and occludin). For this purpose, a novel 3D-printed 24-well Transwell holder was designed to enable scalable, in situ, high-magnification confocal imaging of Transwell ALI cultures, without the need for membranes to be excised and mounted. Cultures were imaged as a Z stack and automated image analysis pipelines were established to identify and quantify junctional complexes from in-focus planes of the 3D cultures.
We also present an improved data analysis process to evaluate changes in ionic permeability measured by TEER. We applied log10 transformation and calculated changes in barrier integrity as the change in log10(mean TEER) from basal or unstimulated control samples. This method enabled data analysis to be performed without the requirement of a blank well correction.
To validate this methodology, we performed two case studies. In the first, we reduced epithelial barrier integrity by culturing cells at a lowered seeding density and treated these epithelial layers with transforming growth factor beta-1 (TGF-β1) to cause EMT, characterized by loss of cell–cell junctions.16,17 In the second study, epithelial layers were treated with the divalent cation chelator ethylenediaminetetraacetic acid (EDTA), which causes loss of cell–cell adhesion, via disruption of adherens junctions. 18
This body of work improved the widely used immunofluorescent imaging and TEER methodologies to form a powerful analytical toolbox for epithelial barrier integrity analysis in Transwell cultures. Combining measurement of paracellular ionic permeability with our imaging pipeline to assess junctional complex proteins enables quantitative profiling of multiple barrier integrity parameters from the same HBEC ALI cultures. Our scalable method provides a valuable tool for respiratory drug discovery target validation studies.
Materials and Methods
Materials
All reagents were from Sigma-Aldrich (Gillingham, Dorset, UK), unless otherwise stated. UltraPure 0.5 M EDTA, pH 8.0 (Invitrogen 15575), was from Thermo Fisher Scientific (Waltham, MA). TGF-β1 (HZ1011; Proteintech, Rosemont, IL) was prepared as a 5 µg/mL stock in MilliQ water containing 0.1% low endotoxin human serum albumin (A5843) and 4 mM HCl.
Cell Culture
The human biological samples used for this project were sourced ethically, and their research use was in accordance with the terms of the informed consent.
For study 1, HBECs derived from two healthy, nonsmoking donors (CC-2540; Lonza, Basel, Switzerland) were cultured following a method modified from Gray et al. 19 Briefly, cells were cultured in T75 cm2 flasks in Bronchial Epithelial Growth Medium (BEGM; Lonza) for 6–7 days at 37 °C/5% CO2, changing media and removing apical mucus every 2–3 days. Cells were lifted from flasks and seeded at 250,000, 125,000, or 75,000 cells/well onto individual Transwell permeable membrane support inserts (6.5 mm diameter, 0.4 µm pore size, polystyrene membrane; Costar 3470; Corning Life Sciences, Tewksbury, MA) coated with 0.15 µg/mL human collagen type IV in a 24-well receiver plate (Costar 3524; Corning Life Sciences). Cells were cultured submerged for 2 days and then differentiated at the air–liquid interface for at least 21 days in small airway epithelial cell basal medium (SABM) differentiation medium. For full cell culture methods, see the Supplemental Materials.
For study 2, primary 3D human small airway epithelial layers, SmallAir (EP21; Epithelix, Geneva, Switzerland), from three healthy, nonsmoker donors were used. Cells seeded at 300,000 cells/well were provided as ready-formed pseudostratified epithelial layers after 28 days of differentiation. These ALI cultures were maintained until use, by changing SmallAir Culture Medium (EP64SA; Epithelix) and removing apical mucus, if required, every 2–3 days.
Cell Treatment
Once differentiated at ALI, cell cultures with TEER readings ≥300 Ω·cm2 were considered to have formed an intact barrier.
Study 1: To demonstrate the effect of reducing cell number to suboptimal seeding densities, on the formation of an intact epithelial barrier, Lonza HBECs from one donor were seeded at 75,000, 125,000, or 250,000 cells/well. Cultures were treated daily, over a period of 72 h, with media vehicle control or 10 ng/mL TGF-β1 to disrupt epithelial barrier integrity in bronchial epithelial basal medium (BEBM) differentiation medium (600 µL/well basolaterally, 20 µL/well apically). A time course was subsequently performed using cells from two donors seeded at 250,000 cells/well treated, in duplicate, daily for 72 h with basolateral (600 µL/well) 0.025% (v/v) DMSO vehicle control or TGF-β1 in SABM differentiation medium, as above (see
Study 2: Epithelix SmallAir cultures seeded at 300,000 cells/well were treated with basolateral (600 µL/well) 0.025% DMSO vehicle control for 48 h or 1 mM EDTA for 1 h prior to the end of the 48 h incubation in SmallAir Culture Medium. Treatments were performed in triplicate, with replicates assayed on separate plates across two independent experiments.
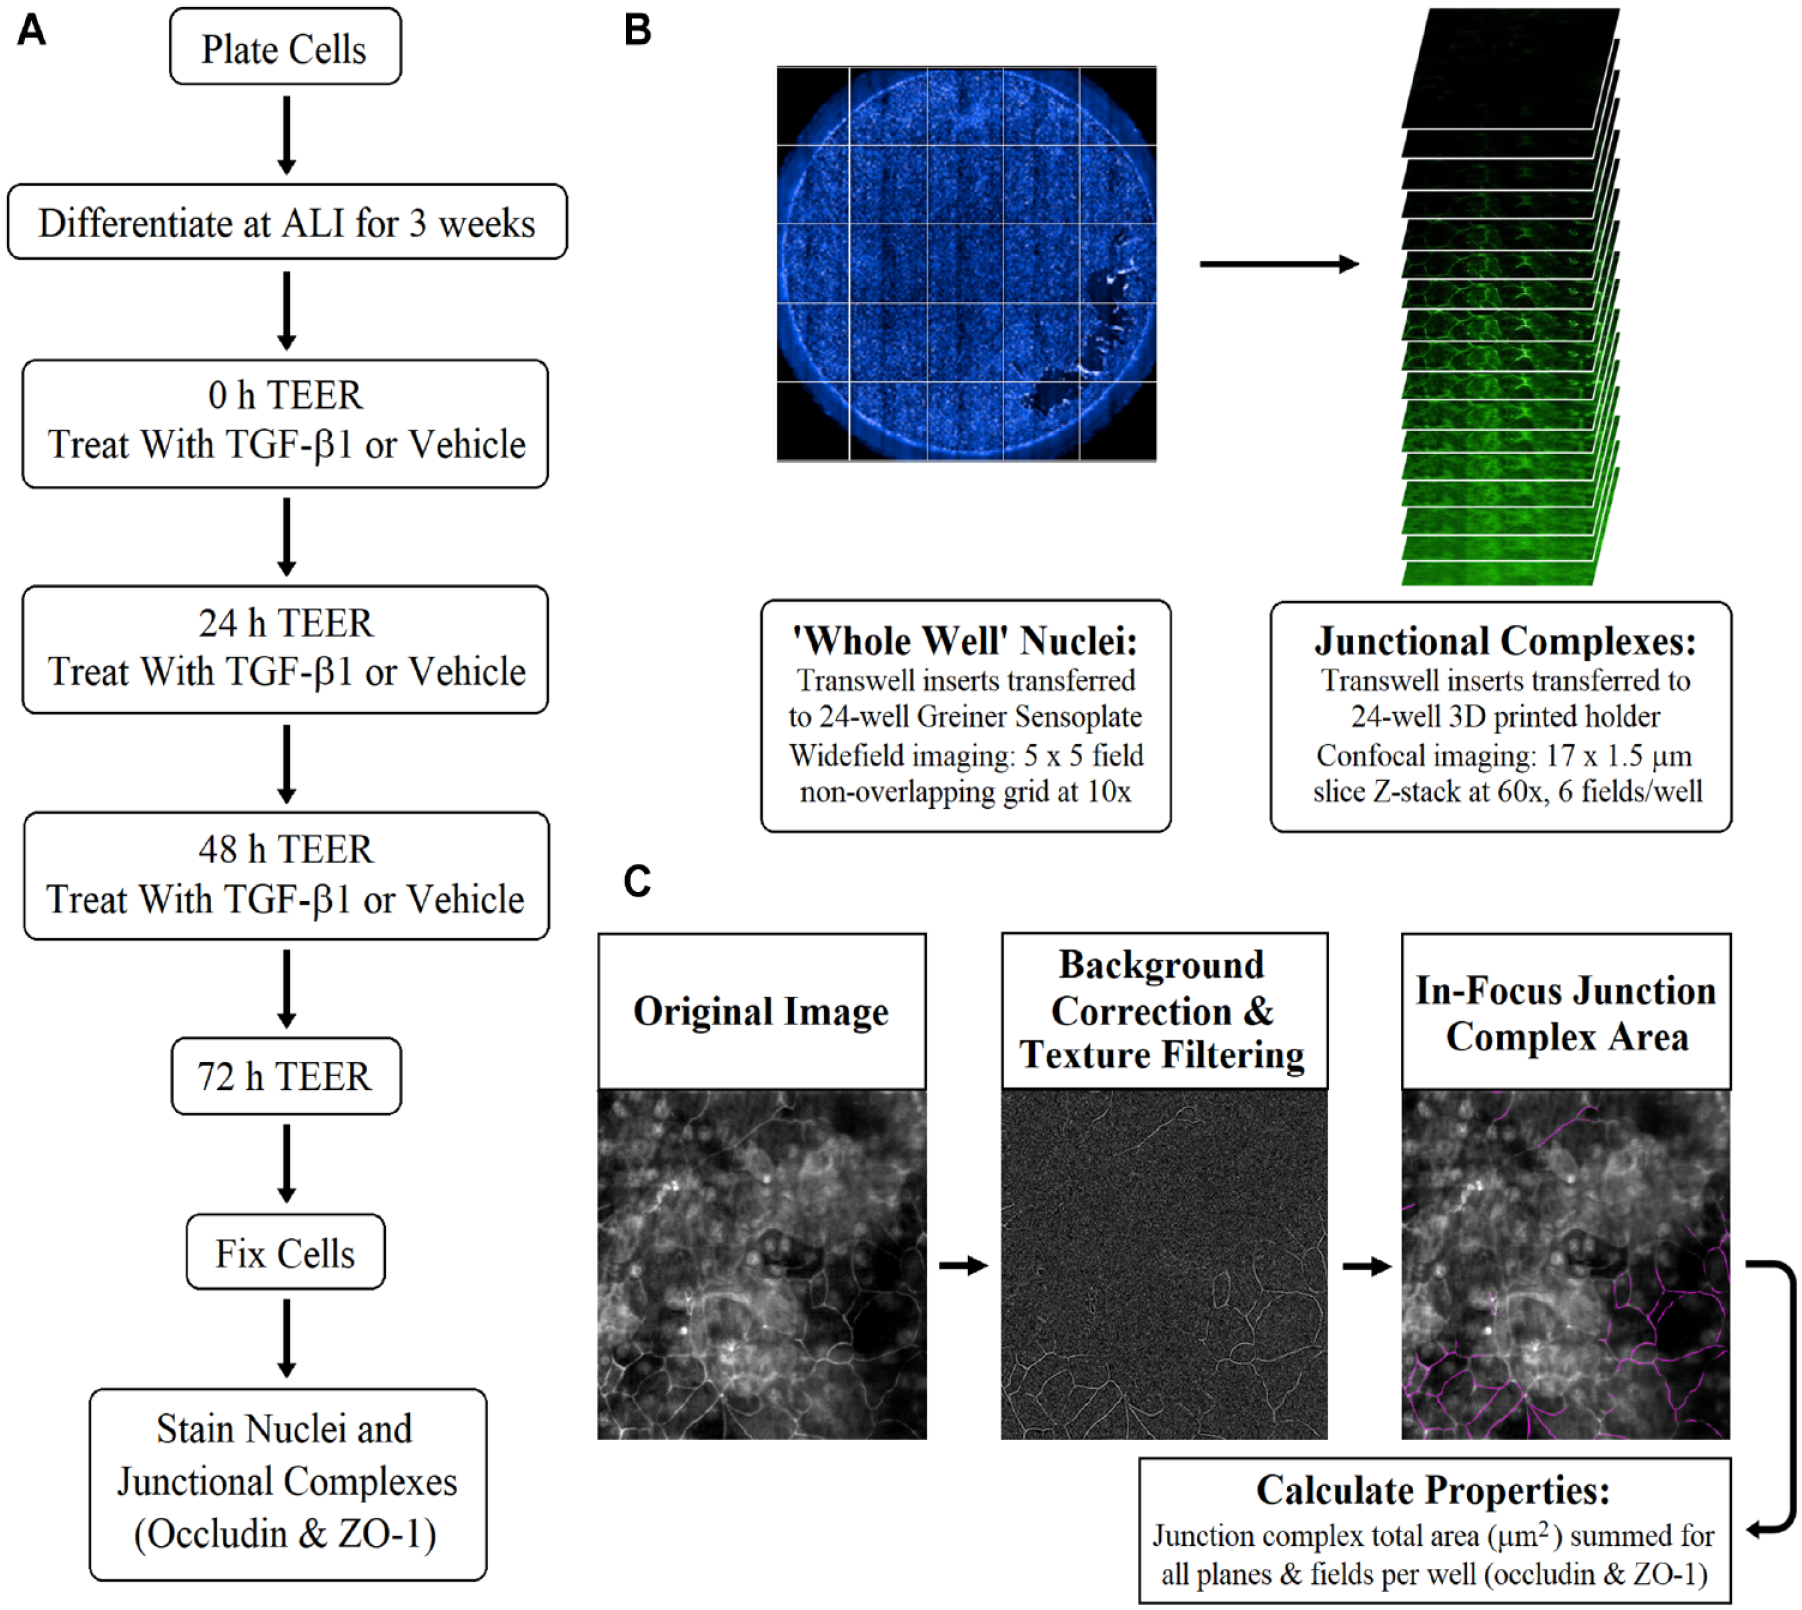
Combined TEER and junctional complex high-content imaging approach to profile HBEC barrier integrity. (
TEER and Data Analysis
Each Transwell ALI culture insert was placed into a well of a 24-well reservoir receiver plate filled with prewarmed unsupplemented 1:1 SABM (CC-3319; Lonza)/Dulbecco’s modified Eagle medium (DMEM; Gibco 31966; Thermo Fisher Scientific) (600 µL/well). Apical surfaces of the epithelial layers were washed twice with prewarmed medium (250 µL/well). The cultures were incubated submerged for 10 min in fresh prewarmed medium, using the volumes above, at 37 °C/5% CO2. TEER was measured by the chopstick electrode method, either manually using a handheld epithelial voltohmmeter (EVOM; EvoM2; World Precision Instruments, Sarosota, FL) or through automation using an Automated TEER Measurement System with Corning HTS Transwell-24 (REMS-24) electrode (World Precision Instruments), according to the manufacturer’s instructions. Triplicate readings were measured per well using the handheld probe; the automated system performs a single read per well.
For study 1, manual readings using the handheld probe were taken at 0 h before treatment and at 24, 48, and 72 h after vehicle control or TGF-β1 treatment in unsupplemented 1:1 SABM/DMEM medium (250 µL/well). To minimize temperature fluctuations, Transwell cultures in 24-well reservoir plates were placed on a prewarmed (37 °C) Duolink In Situ Microplate Heat Transfer Block (DUO82065; Sigma-Aldrich) during TEER measurement. For study 2, using SmallAir cultures, automated TEER readings were taken on day 1, prior to vehicle control treatment. On day 3, TEER readings were taken 48 h after vehicle control treatment and also before and after 1 h of 1 mM EDTA treatment.
A TEER data analysis pipeline was developed to enable statistical evaluation of treatment effects on barrier integrity. Resistance readings (Ω), without blank correction (see Discussion), were multiplied by the Transwell insert membrane area to convert them to TEER (Ω·cm2). 9 Triplicate technical replicate TEER reading values were averaged per well (mean TEER). Our assumptions are that within a well, error is normally distributed, reflecting the technical variation of the assay, and the variation between wells is log-normally distributed (see Suppl. Fig. S3A , which illustrates heteroscedasticity between seeding densities), reflecting the biological variation between replicate wells. The within-well averages were log-transformed to ensure the validity of downstream analysis (which assumes errors are normally distributed). The resulting endpoint, x, is defined in eq 1:

Data were plotted and analyzed as TEER change from baseline (eq 2), calculated by subtracting the log10-transformed mean TEER at time 0 h (TEER0) from the log10-transformed mean TEER at the time point of interest (TEERt):

For the automated TEER system, measuring a single reading per well, log10(TEER) was substituted in place of log10(mean TEER) in the above equations.
Junctional Complex Immunostaining
Prior to fixation, HBEC ALI cultures in Transwell inserts were gently washed three times with prewarmed phosphate-buffered saline (PBS) pH 7.4, supplemented with Ca2+/Mg2+, to remove mucus which can hinder immunostaining from the epithelial surface. Cells were fixed with 4% paraformaldehyde (Parafix; Pioneer Research Chemicals Ltd., Colchester, Essex, UK) for 15 min at room temperature and then washed three times with PBS. The apical epithelial surface was blocked and permeabilized with PBS containing 5% bovine serum albumin (BSA) and 0.5% Triton X-100 for 1 h at room temperature. After blocking and permeabilizing, primary antibodies against ZO-1 (1:100, 2.5 µg/mL final concentration; Invitrogen 61-73000; Thermo Fisher Scientific) with or without occludin (1:100, 5 µg/mL; Invitrogen 33-1500; Thermo Fisher Scientific), were applied to the apical surface and incubated overnight at 4 °C. Cells were washed for 5 min with PBS; this wash step was performed five times. Fluorescently conjugated Alexa Fluor 488 (AF488; 1:500, 4 µg/mL; Molecular Probes A-21202; Thermo Fisher Scientific) and Alexa Fluor 647 (AF647; 1:500, 4 µg/mL; Molecular Probes A-31573; Thermo Fisher Scientific) anti-species secondary antibodies, together with nuclear counterstain Hoechst 33342 (1.66 µM; Invitrogen H21492; Thermo Fisher Scientific), were applied to the apical surface for 1 h at room temperature. Cells were washed as described above and then transferred into PBS (pH7.4) without Ca2+/Mg2+ (PBS–/–) (D8537; Sigma-Aldrich) for imaging. For the full method, see the Supplemental Materials.
High-Content Image Acquisition
Cells were imaged, in situ, in Transwell inserts using an IN Cell Analyzer 6000 (GE Healthcare Life Sciences, Little Chalfont, Buckinghamshire, UK) high-content imager, by two methods. First, widefield single-plane images of Hoechst-labeled nuclei at 10× magnification (0.45 numerical aperture [NA] air objective) were captured, covering an area of 6656 × 6656 µm (25 fields of view per well in a 5 × 5 tiled square grid, without image overlap). These were used to generate a whole-well nuclei composite image to qualitatively assess cell coverage in the well, to provide additional context to the TEER values. Second, confocal Z stacks (17 × 1.5 µm slices) of Hoechst-labeled nuclei, ZO-1-AF647 and occludin-AF488 at 60× magnification (0.95 NA air objective), capturing six unique 222 × 222 µm fields of view per well, were used to assess junctional complexes (
For 10× magnification image acquisition, Transwell inserts were suspended in a glass-bottomed 24-well SensoPlate (662892; Greiner Bio-One International GmbH, Kremsmünster, Austria) containing PBS–/– (600 µL/well) and covered with a plate lid that had black Nunc Sealing Tape (236703; Thermo Fisher Scientific) stuck to the underside.
To enable scalable in situ 60× confocal image acquisition of cells in Transwell inserts without membrane excision, a 24-well holder was custom-designed using SOLIDWORKS 2019 (Dassault Systèmes SolidWorks Corporation, Waltham, MA) computer-aided design (CAD) software (
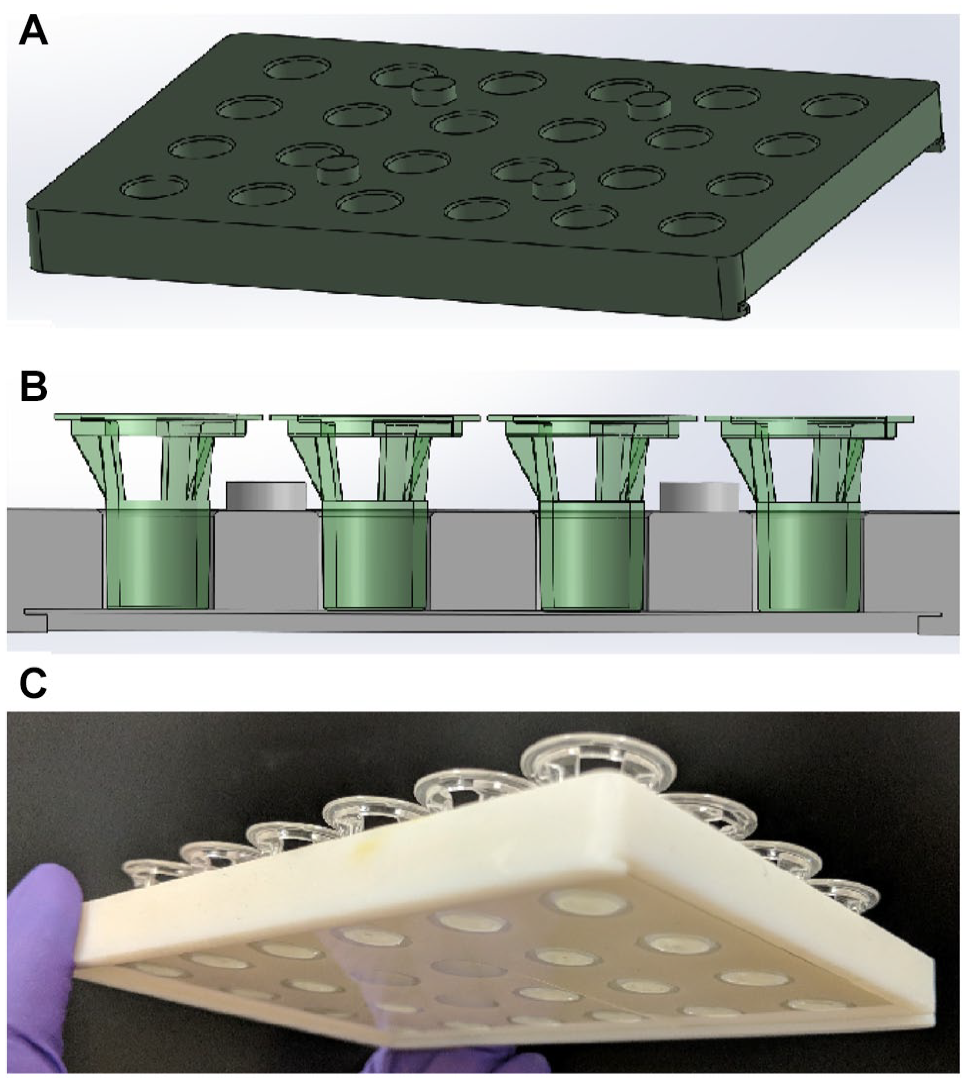
3D-printed 24-well Transwell insert holder designed to the same footprint as a standard multiwell imaging plate, to ensure compatibility with automated high-content imaging platforms. SOLIDWORKS 2019 CAD designs (full specifications are provided in
Suppl. Fig. S1
): (
For automated 60× magnification confocal imaging, laser and software autofocusing did not reliably detect a defined aspect of the epithelium (e.g., cell nuclei or the Transwell insert membrane). To avoid manual focusing of each Z-stack position, to ensure the full epithelial layer thickness was imaged, we performed a widefield 2D single-plane exposure in the nuclei channel (without capturing an image) using laser autofocus and a 50 µm software focus allowance. The focal plane of this exposure was used to set the focal point for each confocal Z stack, to enable automated imaging of junctional complexes. For study 1, to further aid autofocusing, 1 µm blue FluoSpheres (Molecular Probes F8815; Thermo Fisher Scientific) were added to the apical surface (apical PBS was replaced with 100 µL/well of 2.4 × 10⁸ FluoSphere particles/mL in PBS–/–) and centrifuged for 1 min at 200g to settle the fluorescent microspheres onto the epithelial surface. Transwell inserts were transferred to the 3D-printed holder, housing two coverglasses (size 2) in the base, retaining a bead of PBS–/– on the underside of each insert to make liquid contact with the glass, to aid imaging (
Image Analysis
To characterize barrier integrity using cell–cell junctional complexes, we developed image analysis pipelines using Columbus v2.8.0 software (PerkinElmer, Waltham, MA), to determine the total junction protein area for occludin and ZO-1. To enable assay scalability, cells were imaged through the Transwell membrane. This method resulted in high background fluorescence at lower planes, and for this reason, the 60× magnification Z-stack images were analyzed on a single-plane basis, rather than as a maximum intensity projection (
Statistical Analysis
Where appropriate, statistical analyses were performed using R version 2019 20 and R package emmeans version 1.4.2; 21 no data for conditions tested were excluded from these analyses. Graphs were plotted using tidyverse, 22 which is a collection of R packages for data science.
Prior to statistical analysis, TEER or mean TEER data were log10-transformed and junction complex protein data were square root-transformed to stabilize variation.
For study 1, we performed one-way analysis of variance (ANOVA) to test whether TEER changes from baseline for wells with reduced seeding density or TGF-β1 treatment were significantly different from the changes from baseline for vehicle controls. We used a separate one-way ANOVA for each treatment–control comparison. To analyze changes in TEER over time, a separate one-way ANOVA was fitted to the data for each time point. The p values from these separate analyses will be correlated and thus do not carry the same weight that three independent p values would. To test whether ZO-1 tight junction total protein area changes from baseline following TGF-β1 treatment were significantly different from the changes from baseline for vehicle controls, we fitted a general linear model to the ZO-1 data with two fixed effects: treatment and donor. This model differs from a two-way ANOVA in that it has no interaction terms.
For study 2, to test whether TEER or ZO-1 total area changes from baseline following EDTA treatment were significantly different from the changes from baseline for vehicle controls, we fitted general linear models with three fixed effects: treatment, HBEC donor, and assay plate. This model differs from a three-way ANOVA in that it has no interaction terms.
Results
Automated Imaging and Quantification of Tight Junction Proteins
To enable evaluation of respiratory epithelial barrier integrity at sufficient scale for drug discovery, we developed an automated image acquisition and analysis pipeline to quantify tight junction proteins (
Development of an Improved TEER Data Analysis Methodology
For these studies, we measured TEER using the Ohm’s law method. An alternating current is applied using a chopstick electrode pair inserted into the apical and basolateral compartments of a Transwell epithelial cell culture. The measurement of electrical resistance, in ohms (Ω), across the cell layer, is indicative of its paracellular permeability to ions and is proportional to the integrity of the epithelial barrier.9,11 To determine changes in ionic permeability of the epithelial barrier, we developed an improved TEER data analysis process. TEER values are typically corrected by subtraction of a blank well containing the Transwell insert semipermeable membrane without cells, to determine the resistance of the epithelium. 9 Changes in TEER are often calculated as a percentage of the basal reading or unstimulated controls;23–26 however, percentage changes do not typically follow a normal distribution. We applied log10 transformation and calculated changes in barrier integrity as the change in log10(mean TEER) or log10(TEER) from baseline or untreated control (see Suppl. Tables S5–S8 ). This method enabled data analysis to be performed without the requirement of blank well correction. TEER analyses from the two case studies used to validate this methodology will be presented in more detail in the following sections.
Development of a Combined TEER and Imaging Approach to Evaluate Barrier Integrity
TEER assay robustness can suffer from high variability due to environmental conditions and epithelium damage due to manual interventions during ALI culture. For study 1, we used the handheld EVOM chopstick electrode system, for which electrode positioning and epithelium damage caused by manual TEER measurement can also affect assay robustness. We used whole-well nuclei imaging to provide additional contextual information, to understand the TEER data. For example (see
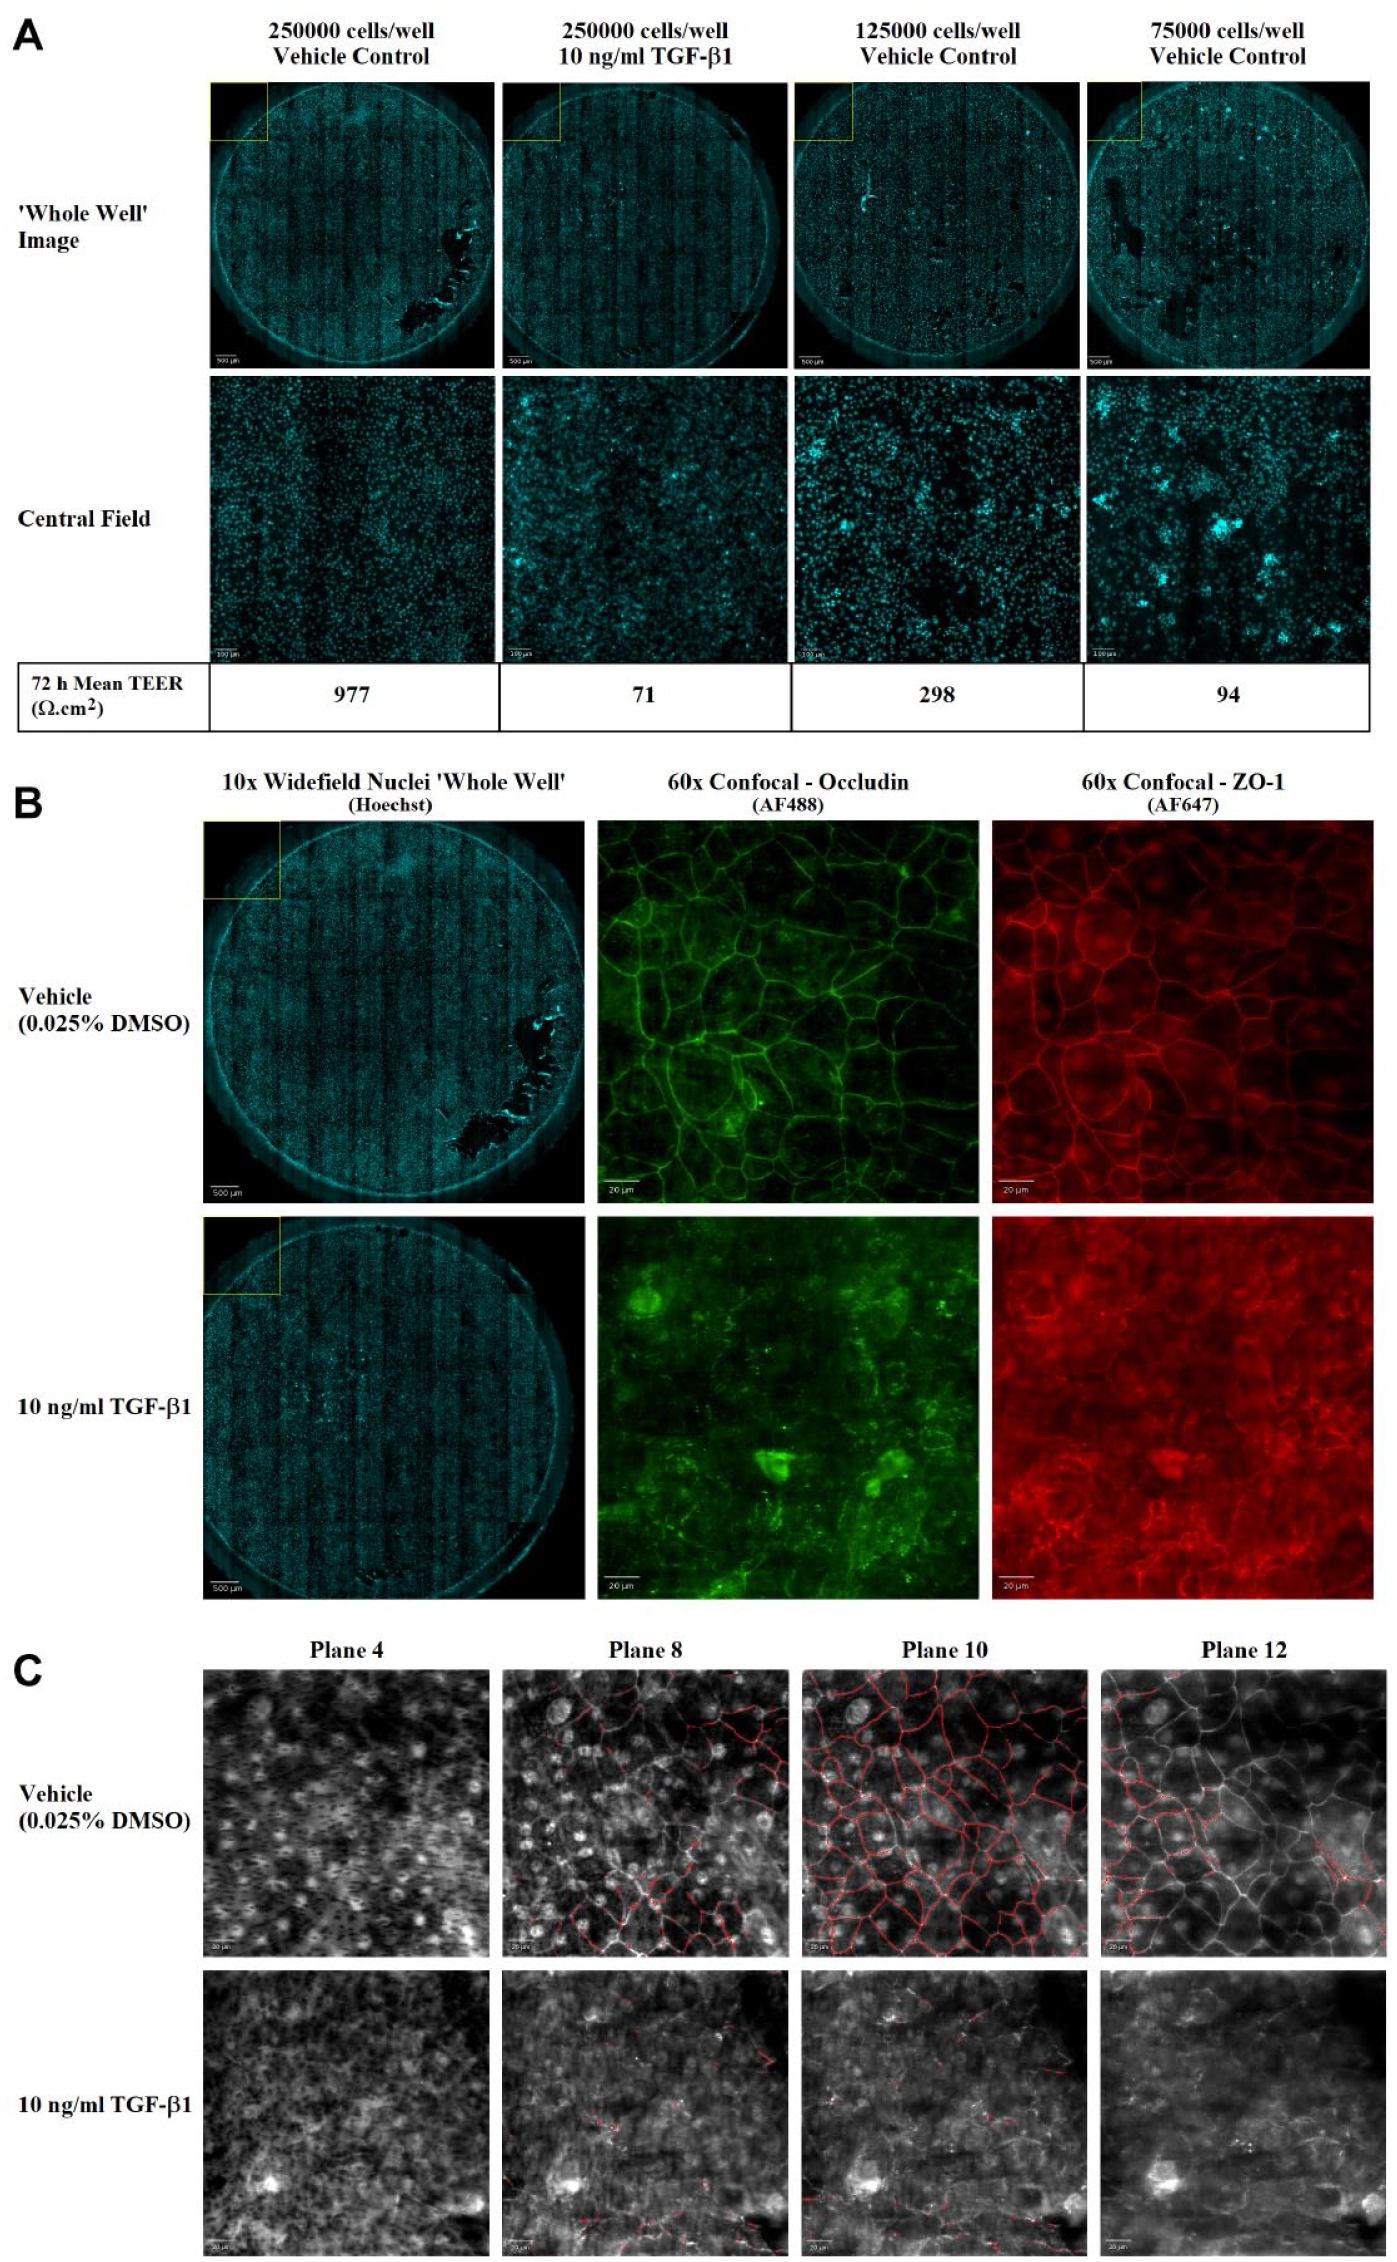
Junctional complex protein imaging. Disruption of occludin and ZO-1 junctional complexes by daily treatment of Lonza HBEC ALI cultures with 10 ng/mL TGF-β1 for 72 h to induce EMT. (
We combined measurement of paracellular ionic permeability with quantitative assessment of junctional complex proteins to enable the evaluation of multiple barrier integrity mechanisms from the same epithelial ALI cultures using the workflow described in
Validation of Quantitative Combined TEER and Imaging Approach
To validate and assess the assay robustness of our quantitative combined TEER and imaging approach for evaluating bronchial epithelial barrier integrity, we performed two studies, employing differing methods, to reduce barrier integrity. The first study used epithelial cultures differentiated at ALI, from two Lonza healthy, nonsmoker primary HBEC donors, using suboptimal seeding densities and induction of EMT with TGF-β1 to reduce barrier integrity.16,17 The second study used Epithelix healthy, nonsmoker primary SmallAir cultures from three donors, provided as pseudostratified epithelial layers. These cells were treated with EDTA, which chelates divalent cations (e.g., Ca2+), resulting in loss of cell–cell adhesion. The presence of calcium is required to achieve the correct conformation, to allow E-cadherin proteins on neighboring cells to bind to each other, to form an adherens junction. 18
The majority of the epithelial layers used in both studies had formed a good intact barrier (mean TEER >300 Ω·cm2); baseline mean TEER values are shown in
Study 1. To assess the effects of seeding density on epithelial barrier integrity, we seeded 250,000, 125,000, or 75,000 cells/well in BEGM and then differentiated them at ALI in SABM differentiation medium. Typically, 250,000–300,000 cells/well are seeded into 6.5 mm diameter Transwell inserts to generate an intact epithelial barrier; 125,000 and 75,000 cells/well were considered suboptimal seeding densities. As expected, we observed a progressive increase in newly formed intact epithelial barrier with increasing seeding density, measured by both ionic permeability (increasing log10[mean TEER];
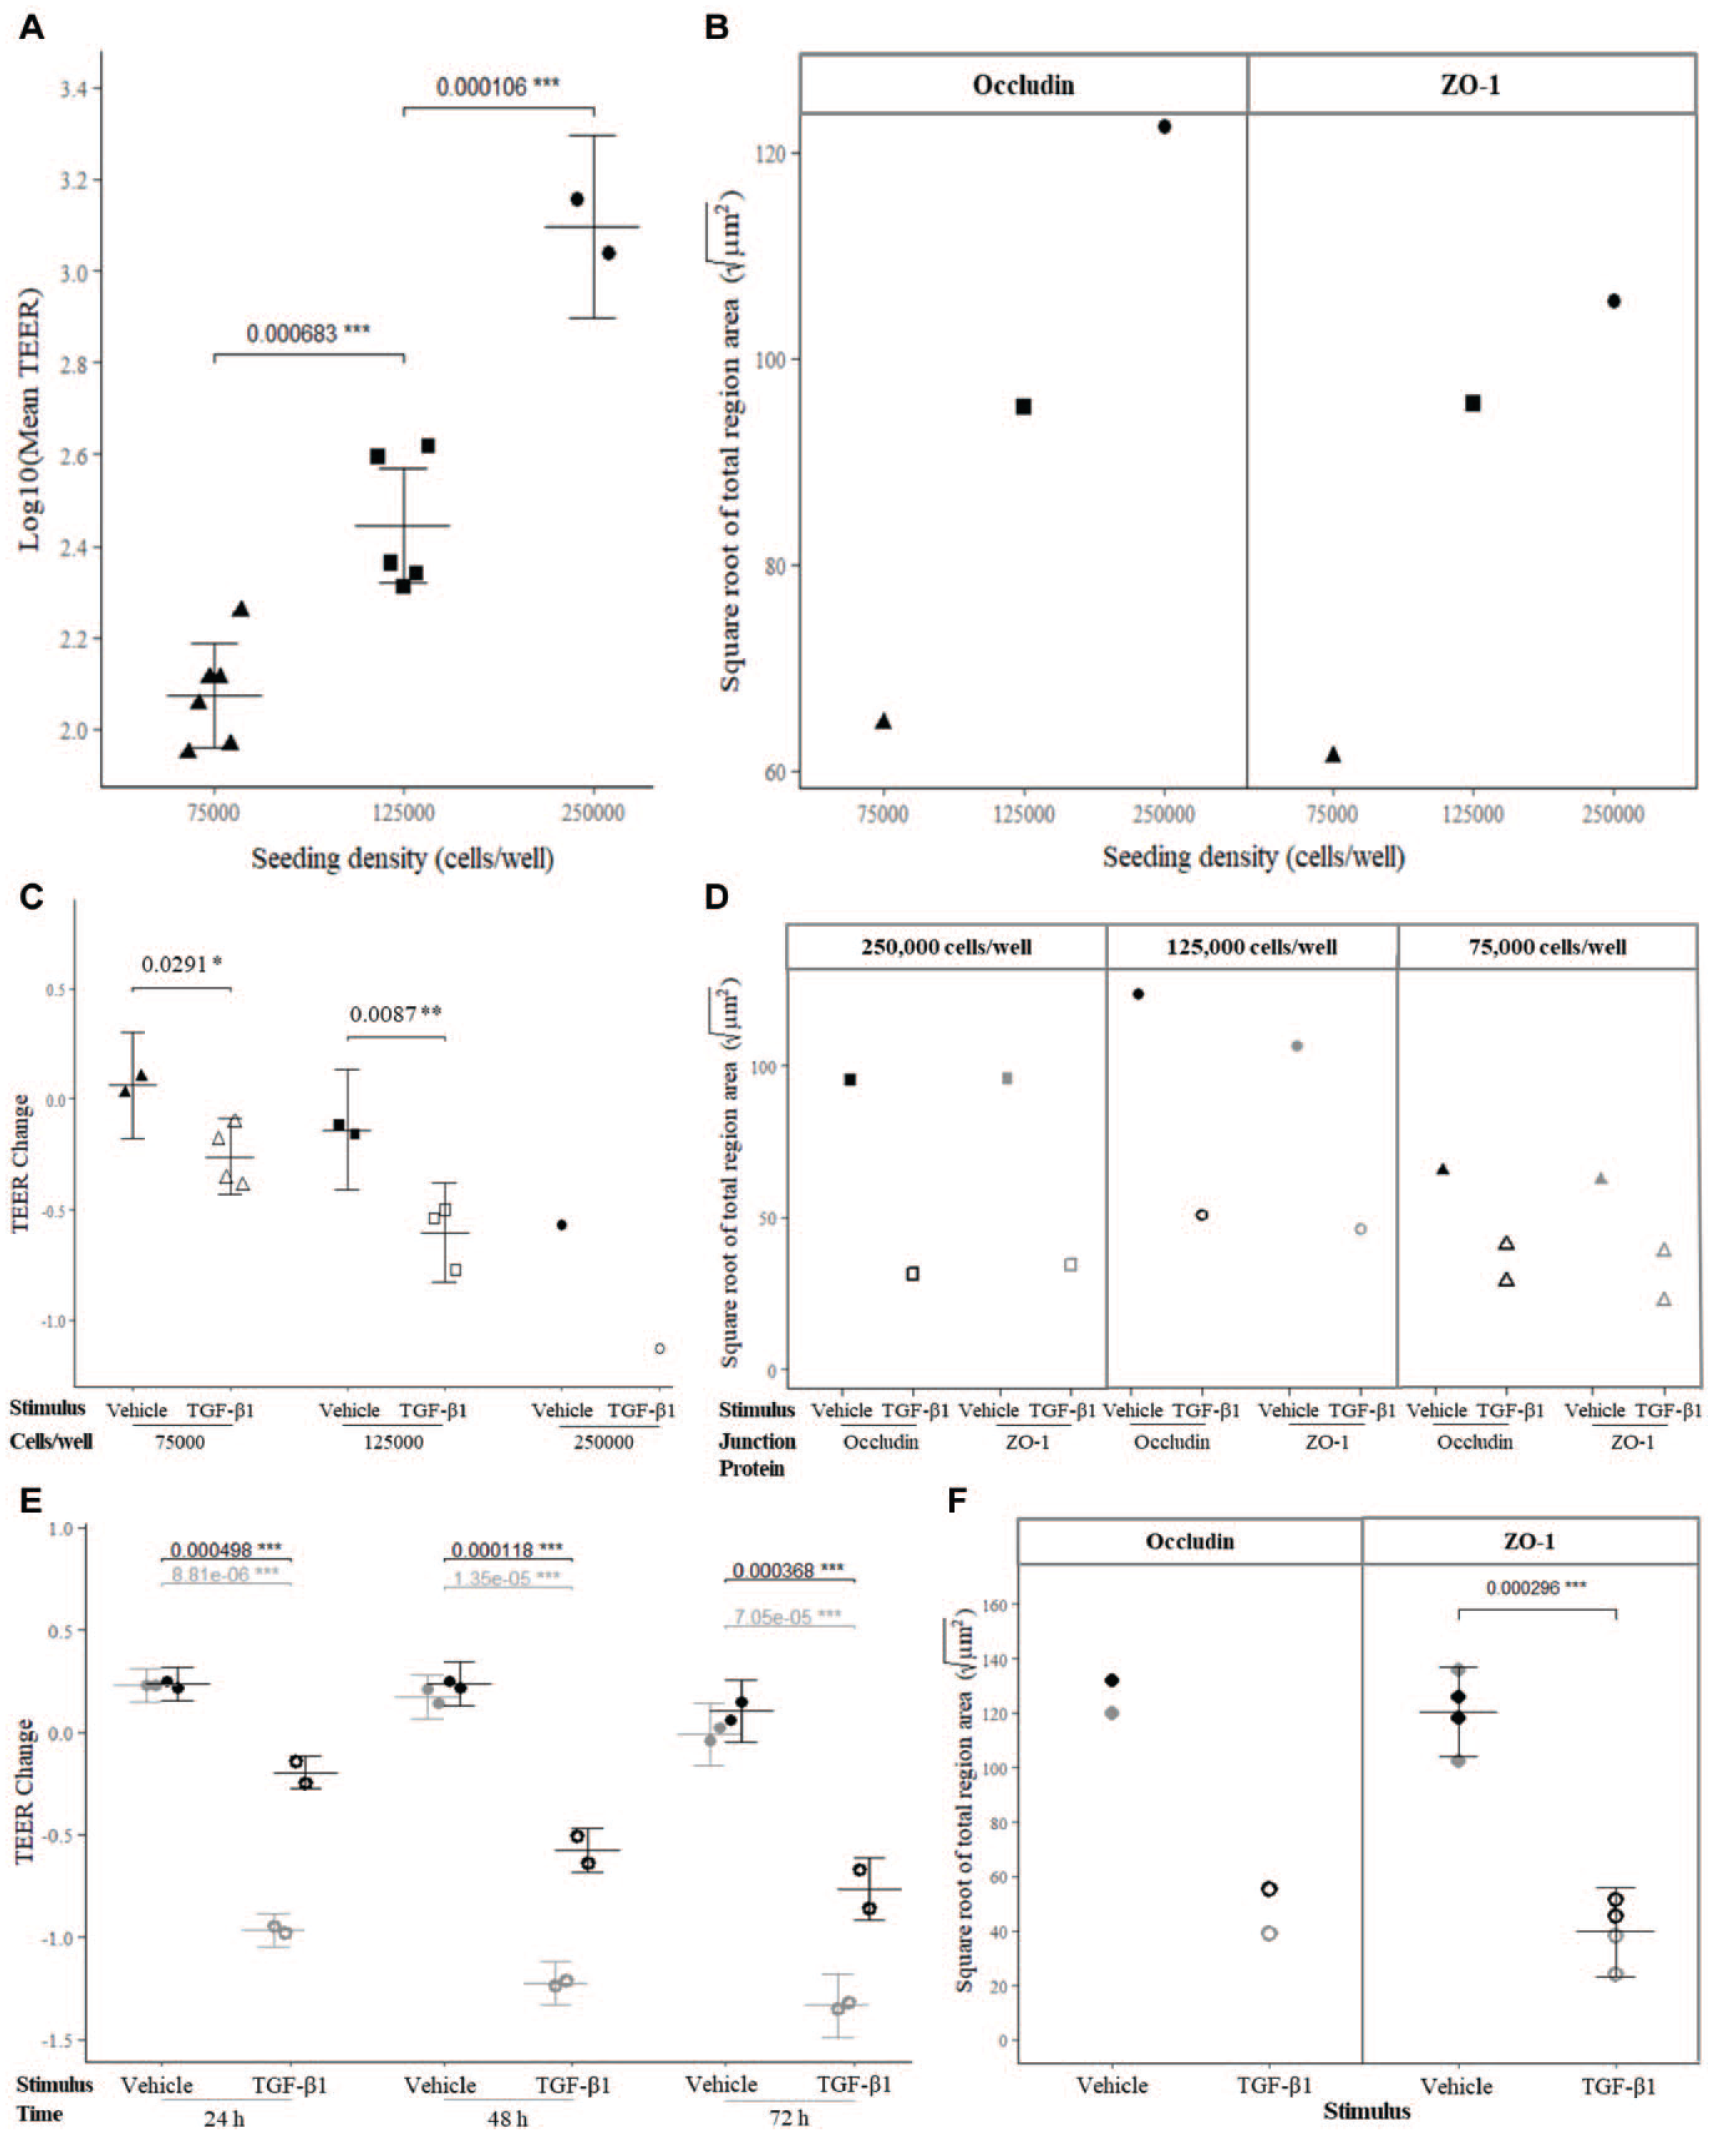
Study 1—lowering cell seeding density and daily treatment for up to 72 h with 10 ng/mL TGF-β1 (open symbols), to induce EMT, impaired epithelial barrier integrity in Lonza healthy, nonsmoker primary HBEC ALI cultures. This was demonstrated by reduced ionic permeability (TEER) and total area of junctional complex proteins (occludin and ZO-1 imaging) in two independent experiments. Experiment 1: a progressive increase in newly formed intact epithelial barrier was observed with increasing seeding density measured by (
We also observed reductions in barrier integrity, as expected, after daily treatment over the course of 72 h with 10 ng/mL TGF-β1 to induce EMT, characterized by loss of cell–cell junctions. Log10(mean TEER) (
Study 2. To further validate this improved methodology, we assessed the effect of 1 h of treatment with 10 mM EDTA on SmallAir HBEC ALI cultures seeded at 300,000 cells/well. EDTA chelates calcium and is expected to reduce barrier integrity by interfering with cell–cell adhesion. We observed an approximate fourfold reduction in ionic permeability measured by TEER (
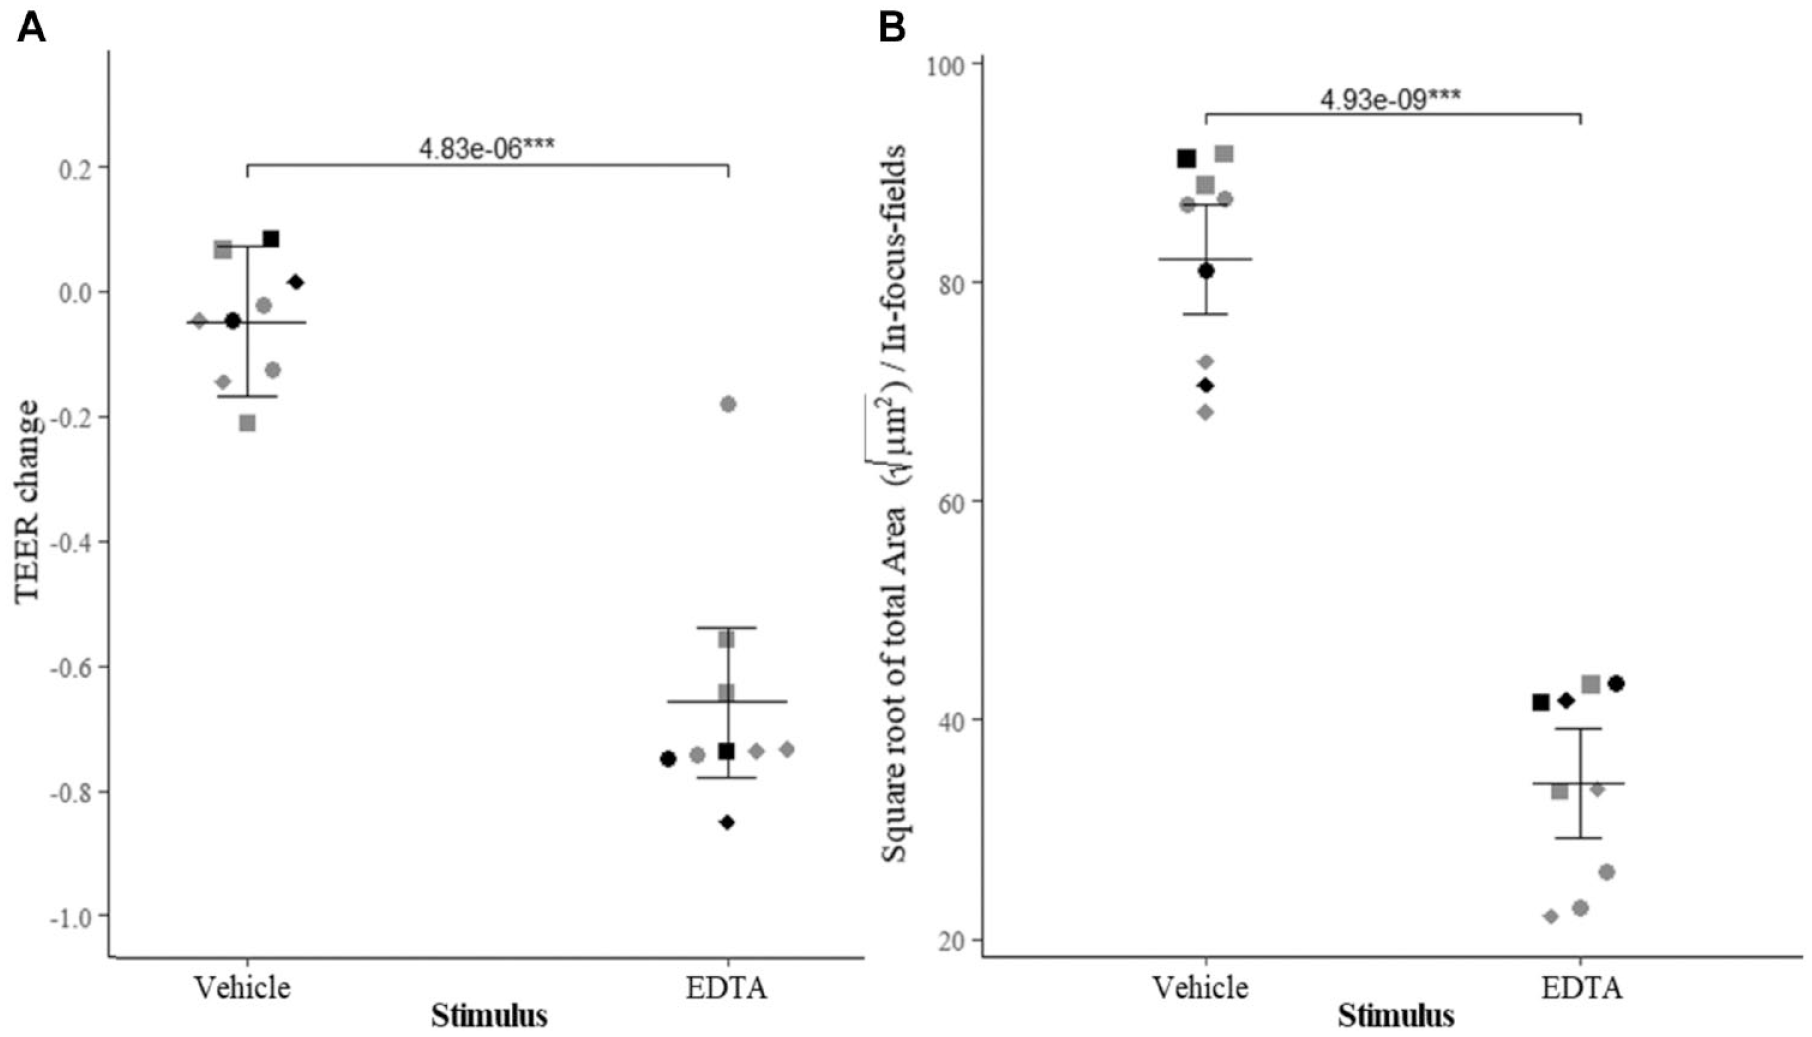
Study 2—epithelial barrier integrity was disrupted in primary healthy, nonsmoker SmallAir HBEC cultures by 1 h of treatment with 1 mM EDTA, which impairs cell–cell adhesion by chelating calcium ions. Barrier integrity was measured from three donors (circles, squares, and diamonds) in triplicate, across two independent experiments (colored gray and black). Loss of barrier integrity was demonstrated by (
In summary, data from these validation studies demonstrated that barrier integrity reductions caused by suboptimal HBEC seeding densities or treatment of epithelial layers with agents that disrupt cell–cell junctions were quantifiable using our combined approach of improved TEER data analysis and automated tight junction protein image analysis.
Discussion
Integrated measurement of ionic permeability and junctional complex protein interactions within the same sample provides a more robust method for assessing epithelial barrier integrity, compared with using either assessment alone, by providing complementary information. Epithelial macromolecular flux, resulting from changes in junctional complex structure or function, can increase without an associated drop in ionic permeability measured by TEER, highlighting the importance of using multiple approaches to assess barrier integrity. 10 Our method can be applied to multiple stages of the drug discovery process for analysis of 100–1000 samples, including target validation studies, compound screening, and safety assessment.
Study 1 used two independent donors to develop this combined TEER and quantitative imaging approach for barrier integrity profiling. This methodology was further validated by applying it to study 2 using an additional three independent donors, with triplicate wells per condition, to capture donor-to-donor variability. This work used a total of five independent donors; we have demonstrated that this methodology works across the five individual donors from two different sources, providing confidence that it is a reproducible technique for evaluating barrier integrity.
The TEER Ohm’s law method is a well-established technique that uses electrodes placed in medium on either side of the cell barrier and an alternating current. Measuring the voltage and current enables the resistance to be calculated; the more intact the barrier, the higher the resistance. Both the maintenance of ALI cell cultures requiring removal of secreted mucus and the TEER technique itself require a high level of dexterity to minimize damage to the epithelial cell layer. By imaging the whole well, it is possible to assess whether reductions in TEER are truly indicative of loss of barrier integrity through increased ionic permeability and not due to cell loss through inadvertent damage of cell cultures or cell death.
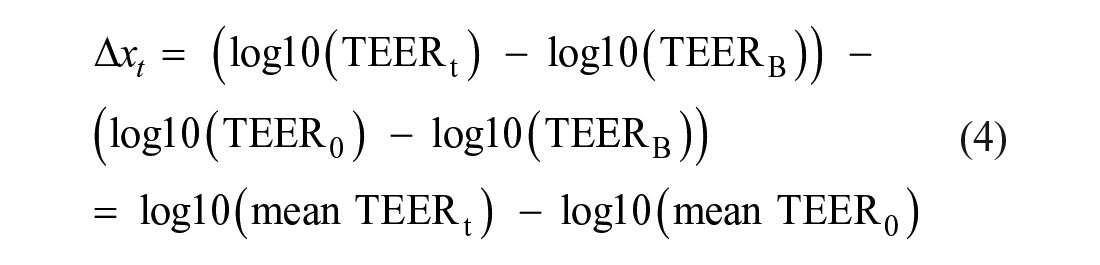
For analysis purposes, an enhanced novel TEER data analysis process was performed. TEER data were log10-transformed, enabling statistical evaluation of treatment effects on barrier integrity using a change in log10(mean TEER) from baseline. Typically, TEER values are corrected using a blank well, containing the Transwell insert semipermeable membrane without cells, to determine the resistance of the epithelium. 9 TEER changes are often calculated as a percentage of the basal reading (time 0 h) or unstimulated controls;23–26 however, percentage changes do not typically follow a normal distribution. The new methodology described here, using change in log10(mean TEER), enables statistical evaluation of treatment effects on barrier integrity, while avoiding assuming normality of percentage change in mean TEER values (ratios of observations are generally not normally distributed). In addition, this TEER data analysis method, using log10 transformation, negated the need for blank well correction, typically employed when calculating TEER by traditional methods. 9 Under the assumption that the expected blank well value does not depend on time, change in log10(mean TEER) or log10(TEER) is mathematically independent of the expected blank well value. Specifically, if the expected blank well value is log10(mean TEERB) and assumed to be known, then the blank well corrected observation is given by eq 3:
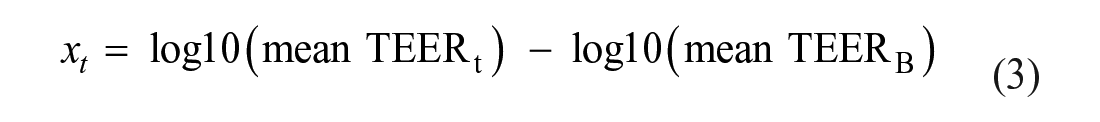
Change in blank well corrected log10(mean TEER) is given by eq 4, where the last expression is independent of log10(mean TEERB):
Ideally for blank correction, the blank semipermeable membrane should be surface treated in the same manner as that used to grow the epithelial layers. This TEER analysis method was also implemented for epithelium bought as preformed ALI pseudostratified epithelial layers; setting up blank wells for such cultures is challenging because the Transwell insert coating methods may be proprietary and blank wells may not be supplied. In instances where it is not possible to generate a true blank well, the ability to forego the need for blank correction is an important consideration.
This technique of combining TEER with whole-well nuclei imaging adds context to losses in barrier integrity measured by ionic permeability. It highlights marked cell loss resulting from cytotoxicity or significant mechanical disruption during ALI cell culture/TEER measurement, which may cause reductions in barrier integrity independent of cell treatment.
Visualizing tight junctions of epithelial cells cultured at ALI in situ requires high-magnification (60×) confocal imaging using lenses that typically have working distances too short to image cells in situ on Transwell membranes suspended within standard 24-well imaging plates. We achieved this by using the IN Cell Analyzer 6000 combined with a custom-made 3D-printed 24-well holder to accommodate the Transwell inserts. This avoids the need to excise the membranes, with attached cells, from the Transwells and to mount them onto coverslips for imaging work. This minimizes damage through manual manipulation and significantly speeds up data acquisition. For study 1, fluorescent FluoSpheres were settled onto the epithelial surface to aid microscope autofocusing, to avoid the need to manually focus each well. For subsequent studies, including study 2, depending on the nature of the epithelial culture, it was not always necessary to apply FluoSpheres to aid autofocusing. A consistent approach was taken within each study.
The challenge with studying junctional complex protein interactions is that the junctions lie in different planes of view, due to the fact that the cells do not grow in a uniform layer. This requires taking multiple confocal planes of view to form a Z stack. Typically, Z stacks would be analyzed as a maximum intensity projection image. In order to improve the scalability of the technique, by removing the necessity to excise Transwell membrane inserts and mount them on coverslips, the cells were imaged through the Transwell insert membrane. This technique resulted in a high fluorescence background in Z-stack planes close to the insert membrane. To overcome this, the Z stacks were analyzed plane by plane. To analyze the cell–cell junctions, image analysis algorithms were developed to quantify in-focus junctional complex structures in each Z plane. This helps to overcome bias in data analysis incurred when a subjective analysis of stained images is undertaken. One limitation of this image analysis methodology is that the same object can be counted in multiple planes; the error would be consistent between samples when using this method to analyze epithelial layers of similar thickness, mitigating its impact on experimental analysis. Ideally, the epithelial layer would be analyzed as a 3D object; for example, the amount of tight junction protein could be analyzed as a volume or a 3D surface. Currently, there is a lack of off-the-shelf 3D image analysis software applicable for use with a wide range of high-content imaging platforms that is suitable for automated batch analysis of multiwell data at the scales required for drug discovery. 27 While the studies presented here assessed occludin and ZO-1, this image analysis pipeline could be modified to evaluate other junctional complex proteins, such as E-cadherin and claudins.
To the best of our knowledge, this is the first report of using a combined TEER and quantitative imaging approach for the assessment of epithelial barrier integrity. It has been successfully applied to a drug discovery target validation project within GlaxoSmithKline to investigate whether target modulation adversely affected respiratory epithelial barrier integrity. It has the potential to be used for other epithelial barriers of interest; for example, impaired gastrointestinal epithelial barrier integrity is associated with inflammatory bowel disease, obesity, and fatty liver diseases. 28 The technique could also be further scaled to a 96-well plate format.
Supplemental Material
sj-pdf-1-jbx-10.1177_24725552211013077 – Supplemental material for Epithelial Barrier Integrity Profiling: Combined Approach Using Cellular Junctional Complex Imaging and Transepithelial Electrical Resistance
Supplemental material, sj-pdf-1-jbx-10.1177_24725552211013077 for Epithelial Barrier Integrity Profiling: Combined Approach Using Cellular Junctional Complex Imaging and Transepithelial Electrical Resistance by Theresa J. Pell, Mike B. Gray, Sarah J. Hopkins, Richard Kasprowicz, James D. Porter, Tony Reeves, Wendy C. Rowan, Kuljit Singh, Ketil B. Tvermosegaard, Naheem Yaqub and Gareth J. Wayne in SLAS Discovery
Footnotes
Acknowledgements
The authors acknowledge PerkinElmer for Columbus image analysis software guidance.
Supplemental material is available online with this article.
Declaration of Conflicting Interests
The authors declared the following potential conflicts of interest with respect to the research, authorship, and/or publication of this article: The following authors were employed by GlaxoSmithKline, Theresa J. Pell, Mike B. Gray, Sarah J. Hopkins, Richard Kasprowicz, James D. Porter, Tony Reeves, Wendy C. Rowan, Kuljit Singh, Ketil B. Tvermosegaard and Gareth J. Wayne; the research and authorship of this article was completed within the scope of people’s employment with GlaxoSmithKline.
Funding
The authors received no financial support for the research, authorship, and/or publication of this article.
References
Supplementary Material
Please find the following supplemental material available below.
For Open Access articles published under a Creative Commons License, all supplemental material carries the same license as the article it is associated with.
For non-Open Access articles published, all supplemental material carries a non-exclusive license, and permission requests for re-use of supplemental material or any part of supplemental material shall be sent directly to the copyright owner as specified in the copyright notice associated with the article.