
Abstract
The semiconductor manufacturing sector plans to introduce III/V film structures (eg, gallium arsenide (GaAs), indium arsenide (InAs) onto silicon wafers due to their high electron mobility and low power consumption. Aqueous solutions generated during chemical and mechanical planarization of silicon wafers can contain a mixture of metal oxide nanoparticles (NPs) and soluble indium, gallium, and arsenic. In this work, the cytotoxicity induced by Ga- and In-based NPs (GaAs, InAs, Ga2O3, In2O3) and soluble III-V salts on human bronchial epithelial cells (16HBE14o-) was evaluated using a cell impedance real-time cell analysis (RTCA) system. The RTCA system provided inhibition data at different concentrations for multiple time points, for example, GaAs (25 mg/L) caused 60% inhibition after 8 hours of exposure and 100% growth inhibition after 24 hours. Direct testing of As(III) and As(V) demonstrated significant cytotoxicity with 50% growth inhibition concentrations after 16-hour exposure (IC50) of 2.4 and 4.5 mg/L, respectively. Cell signaling with rapid rise and decrease in signal was unique to arsenic cytotoxicity, a precursor of strong cytotoxicity over the longer term. In contrast with arsenic, soluble gallium(III) and indium(III) were less toxic. Whereas the oxide NPs caused low cytotoxicity, the arsenide compounds were highly inhibitory (IC50 of GaAs and InAs = 6.2 and 68 mg/L, respectively). Dissolution experiments over 7 days revealed that arsenic was fully leached from GaAs NPs, whereas only 10% of the arsenic was leached out of InAs NPs. These results indicate that the cytotoxicity of GaAs and InAs NPs is largely due to the dissolution of toxic arsenic species.
Introduction
Gallium arsenide (GaAs) and indium arsenide (InAs) materials are being considered for semiconductor manufacturing. In comparison to silicon, these materials have direct band gap, higher electron mobility, and semi-insulating properties which help to increase electrical performance and decrease power consumption in semiconductor devices. 1 -4
Although these III/V materials have advantages, there are occupational health and environmental safety concerns due to the potential release of hazardous waste materials during wafer production via the chemical and mechanical planarization (CMP) process. The CMP uses pristine slurries such as silica (SiO2), alumina (Al2O3), or ceria (CeO2) nanoparticles (NPs) to produce smooth material surfaces. 5 Polishing of III/V thin could generate CMP waste containing nano-sized GaAs and InAs, as well as potential by-products such as gallium and indium oxides (Ga2O3, In2O3) that are formed due to corrosion of the respective arsenides. 5,6 The CMP-derived waste streams can also contain dissolved III/V species (eg, gallium(III), indium(III), arsenic(III), and arsenic(V)) which are released into the aqueous environment during the planarization process. 5 -9 The combination of these materials in the waste stream may cause potential environmental, safety, and health problems that need to be carefully considered. In particular, there is a concern about the health risks and environmental impacts of dissolved arsenic (As), a well-known carcinogen and highly toxic metalloid, 10,11 and As-containing materials. Relatively high concentrations of As have been found in effluent streams of electronic fabrication facilities that utilize III/V materials in several countries (35-2,000 mg/L). 9,12,13 High levels of arsenide particulates are also expected in CMP waste streams, 14,15 but the concentrations found in these effluents have not been reported to date. The CMP effluents are treated at semiconductor facilities to remove regulated pollutants (eg, copper, soluble As) prior to discharge to municipal sewer systems, but current treatment systems are not designed to remove nano-sized Ga- and In arsenides or other Ga- and In-containing NPs. The limit of As in effluents from electronic manufacturing in the United States is 2.09 mg/L as the 1-day average maximum and 0.83 mg/L as the average of daily values for 30-consecutive-day maximum. 16
Arsenic is well known for its toxicity and carcinogenicity 11 and thus is highly regulated. Gallium arsenide has also been classified as a group I carcinogen to humans. 17 Exposure to As can cause different effects such as gastrointestinal distress, death, or major organ damages. There is a long history of adverse health effects by As that can target multiple organs, including the lung. 18 We have shown that As compromises basic lung epithelial cell signaling and barrier function. 19 -22 The most common route for As-induced lung disease is via contaminated drinking water. 23 -25 The World Health Organization and the United States Environmental Protection Agency have established an acceptable limit of As concentration in drinking at 10 μg/L. 26,27 Since As has toxicity and carcinogenicity implications, implementation of NPs containing As in semiconductor industry can potentially cause toxic effects via different exposure routes.
In toxicity assessments, conventional in vitro cytotoxicity assays measuring fluorescence, luminescence, or absorbance are alternatives to animal tests, 28 but NPs can interfere with these optical measurements. 29,30 Impedance-based assays, such as the xCELLigence real-time cell analysis (RTCA) system, allow for cytotoxicity and cell viability assessment that is label-free, dynamic, and can facilitate high-throughput studies. 30 -33 The measured impedance is affected by the biological status of the cells interacting with the surface of wells in which the culture cells are growing. 30,34 There have been studies applying this system to investigate the cytotoxicity of As(V), As(III), Hg, sodium dichromate, and inorganic NPs with reliable and highly sensitive results. 34 -36
The objective of this study is to investigate the cytotoxic effects of gallium- and indium-based NPs: GaAs, InAs, Ga2O3, and In2O3 toward human bronchial epithelial cells (16HBE14o-) using impedance-based RTCA assays. We demonstrated that Ga- and In-based NPs caused cytotoxicity in 16HBE14o- cells and that this cytotoxicity could be due to corrosion of the NPs and subsequent dissolution of toxic As species.
Materials and Methods
Chemicals
Gallium(III) chloride (GaCl3, CAS# 13450-90-3, >99.99%), sodium meta-arsenite (NaAsO2, CAS# 7784-46-5, ≥99%), sodium arsenate dibasic heptahydrate (Na2HAsO4·7H2O, CAS# 10048-95-0, ≥98%), and citric acid (C6H8O7, CAS# 77–92-9) were purchased from Fisher Scientific (Pittsburgh, Pennsylvania). Indium (III) chloride tetrahydrate (InCl3·4H2O, CAS# 22519-64-8, >99.99%) was obtained from Strem Chemicals (Newburyport, Massachusetts). Due to their low solubility in the neutral pH range, 37 the stock solutions of indium(III) and gallium(III) were supplied with citrate at a molar ratio 1:3.75, metal:citrate to prevent any precipitation in the circumneutral bioassay media. Citrate, a metabolite of living cells, is a ubiquitous compound found in the natural environment. 38 This compound is also used as a chelating agent in metal processing industries like semiconductor manufacturing. 39 Therefore, it is relevant to couple citrate with In(III) and Ga(III) in this study.
Gallium oxide (Ga2O3) nanopowder (CAS# 12024-21-4, >99.9%) was obtained from American Elements (Los Angeles, California). Indium oxide (In2O3) NPs (CAS# 1312-43-2, 99.995%) were purchased from SkySpring Nanomaterials, Inc. (Houston, Texas). Gallium arsenide nanopowder (GaAs) (CAS# 1303-00-0, 99.99%) and InAs nanopowder (CAS# 106097-59-0, 99.99%) were obtained from Nanoshel LLC (Wilmington, Delaware).
Particle Size Distribution and ζ Potential
The average hydrodynamic particle sizes and the particle size distribution of Ga2O3 and In2O3 NPs were measured by dynamic light scattering (DLS) using a Zetasizer Nano ZS (Malvern Instruments, Westborough, Massachusetts) with a laser wavelength of 633 nm and a scattering angle of 173°. The refractive index of the Ga2O3 and In2O3 NPs was 1.92 and 1.86, respectively. The NP concentration in the samples analyzed by DLS was 100 mg/L.
The ζ potential of the NP dispersions was also determined using the Zetasizer Nano ZS instrument. The data were determined using the Smoluchowski equation that correlates the electrophoretic mobility of particles with their ζ potential value.
Corrosion and Dissolution of III-V Particles
The dispersions of NP (500 mg/L) were prepared in aqueous medium containing 1 g/L of NaHCO3. The pH of the dispersions was maintained at 7.85 throughout the process by supplying 1% CO2 gas (vol/vol, based on the volume of headspace of the serum flasks) after liquid samples were collected. The flasks were shaken in an incubator at 110 rpm at 30°C. The corrosion and dissolution experiments were carried out for 7 days. Liquid samples were collected daily for analysis.
Immortalized Human Bronchial Epithelial Cell Culture
In this research, 16HBE14o- cells were obtained from California Pacific Medical Center Research Institute (San Francisco, California). 16HBE14o-, an adherent and immortalized human bronchial epithelial cell line, is often used as a model cell type to study pulmonary adsorption, transport, and permeability of environmental contaminants. 20,40,41 The cells were initially grown as previously described. 34,42 Firstly, cells were grown in tissue culture flasks coated with a collagen/fibronectin/bovine serum albumin (CFB) matrix in a controlled growth medium that contains minimum essential medium (MEM) supplemented with 10% (vol/vol) fetal bovine serum (FBS), 2 mM GlutaMAX, penicillin, and streptomycin at 37°C in a 5% CO2 atmosphere. Next, the cells were transferred to RTCA assay plates coated with CFB and maintained with a reduced serum (5% FBS) medium.
Real-Time Cell Analysis Assay
The xCELLigence real-time cell analysis (RTCA) instrument (ACEA Biosciences, San Diego, California) allows for dynamic monitoring cytotoxicity and cell proliferation based upon impedance measurements. The RTCA instrument and the 96-well microelectronic plates (also known as E-plates 96; ACEA Biosciences) are used in this bioassay. When cells attach to the bottom of each well, they create impedance that can be detected by interdigitated gold microelectrodes integrated on the bottom of the testing place, thereby allowing measurement of the cellular status in real time. 43 The measured impedance is calculated and plotted as cell index (CI), which is proportional to cell biological statuses as cell number, morphology, and adhesion. The instrument is placed in a standard CO2 cell culture incubator and interfaces via a cable with analysis and control units which are located outside the incubator.
In the RTCA assay, 150 µL of 16HBE14o- cells were plated onto 96-well E-plates at a cell density of approximately 100 000 cells/well as described above and then incubated overnight at 37°C and 5% CO2 to verify proper attachment and cell growth. During this growth period, the impedance was monitored every 15 minutes. After the cells were plated with only medium present, a low AC voltage of 10 mV was applied, producing a small electric field between the microelectrodes that could be impeded by the presence of adherent cells and lead to the changes in measured impedance. 32 As the number of cells increased over time, there would be significant changes in impedance. 32 There is a proportional relationship between the impedance change and the number of cells inside each well which can provide information about the morphological and adhesive characteristics of the cells. 32 After cell stabilization (15-18 hours), 50 µL of soluble species or NP stock solutions were added to each well. These stock solutions were prepared in culture medium a few minutes before addition. The impedance values were measured and recorded every 15 minutes for 24 hours. Assays were performed in quadruplicate and appropriate negative controls (eg, without soluble species or NPs) were run in parallel. Cell-free controls amended with GaAs, InAs, Ga2O3, or In2O3 NPs (300 mg/L) were tested and did not show any increase in impedance over 24 hours compared to noninoculated assays lacking NP addition.
Relative impedance is expressed as CI and presented after normalization (normalized cell index [NCI]) and was calculated for data analysis using the following equation:

where CIt is the CI at any time t and CI0 is the CI at the time of toxicant dosing (where NCI is equal to 1). The percentage inhibition was then calculated based on NCI values using the following equation:

When the NCI values of the samples were less than 1, inhibition values were reported as 100%. When the slope was horizontal or negative, the activity was assumed to be 0 and the inhibition value was reported as 100%. The NCI values from the 16-hour exposure time were used to develop concentration–response curves.
Uptake of NPs by 16HBE14o- Cells
Approximately 550,000 16HBE14o- cells in MEM supplemented with 5% FBS, 2 mM GlutaMAX and penicillin/streptomycin were plated onto 6-well plates coated with CFB and incubated for 24 hours. The cells were then exposed to 250 mg/L GaAs NPs for 24 hours. Finally, the cells were prepared for transmission electron microscopy (TEM) measurements after washing by Hank’s balanced salt solution. Cells were viewed in a Tecnai Spirit Bio Twin (FEI America, Hillsboro, Oregon) operated at 100 kV. Eight bit tilt images were captured via an AMT 4Mpix digital camera. Measurements were taken at eucentric height using the FEI TIA software (version 4.0).
Analytical Methods
The concentration of dissolved As, Ga, and In in liquid samples was determined by inductively coupled plasma optical emission spectrometry (ICP-OES model 5100; Agilent Technologies, Santa Clara, California) at a wavelength of 188.980 nm (for As), 294.363 nm (for Ga), and 230.606 nm (for In). The limit of detection for all 3 metals was 50 μg/L. Prior to ICP analysis, liquid samples were centrifuged (12,000 rpm for 10 minutes) and filtered (through 25-nm membrane filter). The filtered samples were then diluted to proper concentrations with 2% HNO3 for analysis. Arsenic speciation (As(III) and As(V)) was measured using high-performance liquid chromatography (HPLC) for pretreatment and species separation followed by inductively coupled plasma mass spectrometer (ICP-MS; Agilent 7500a) for detection. The system is an Agilent 1100 HPLC (Agilent Technologies, Inc) with a reverse-phase C18 column (Prodigy 3u ODS(3), 150 × 4.60 mm; Phenomenex, Torrance, California) maintained at 50°C. The mobile phase (pH 5.85) contained 4.7 mM tetrabutylammonium hydroxide, 2 mM malonic acid, and 4% (vol/vol) methanol at a flow rate of 1.2 mL/min. The detection limit for this instrument was 0.1 µg/L for As speciation and 0.01 µg/L for As totals. All other analyses, including pH, were performed according to standard methods.
Results and Discussion
Physiochemical Characterization of NPs
Figure 1 shows the TEMs of the different nanomaterials investigated in this study. The micrographs show that the particle morphology of the nanomaterials is diverse and includes rod-like, nearly spherical, and amorphous particles. The average particle size values determined by TEM are reported by manufacturers as 20 to 70 nm (In2O3 NPs), 500 nm (Ga2O3 NPs), 80 to 100 nm (InAs NPs), and 80 to 100 nm (GaAs NPs).
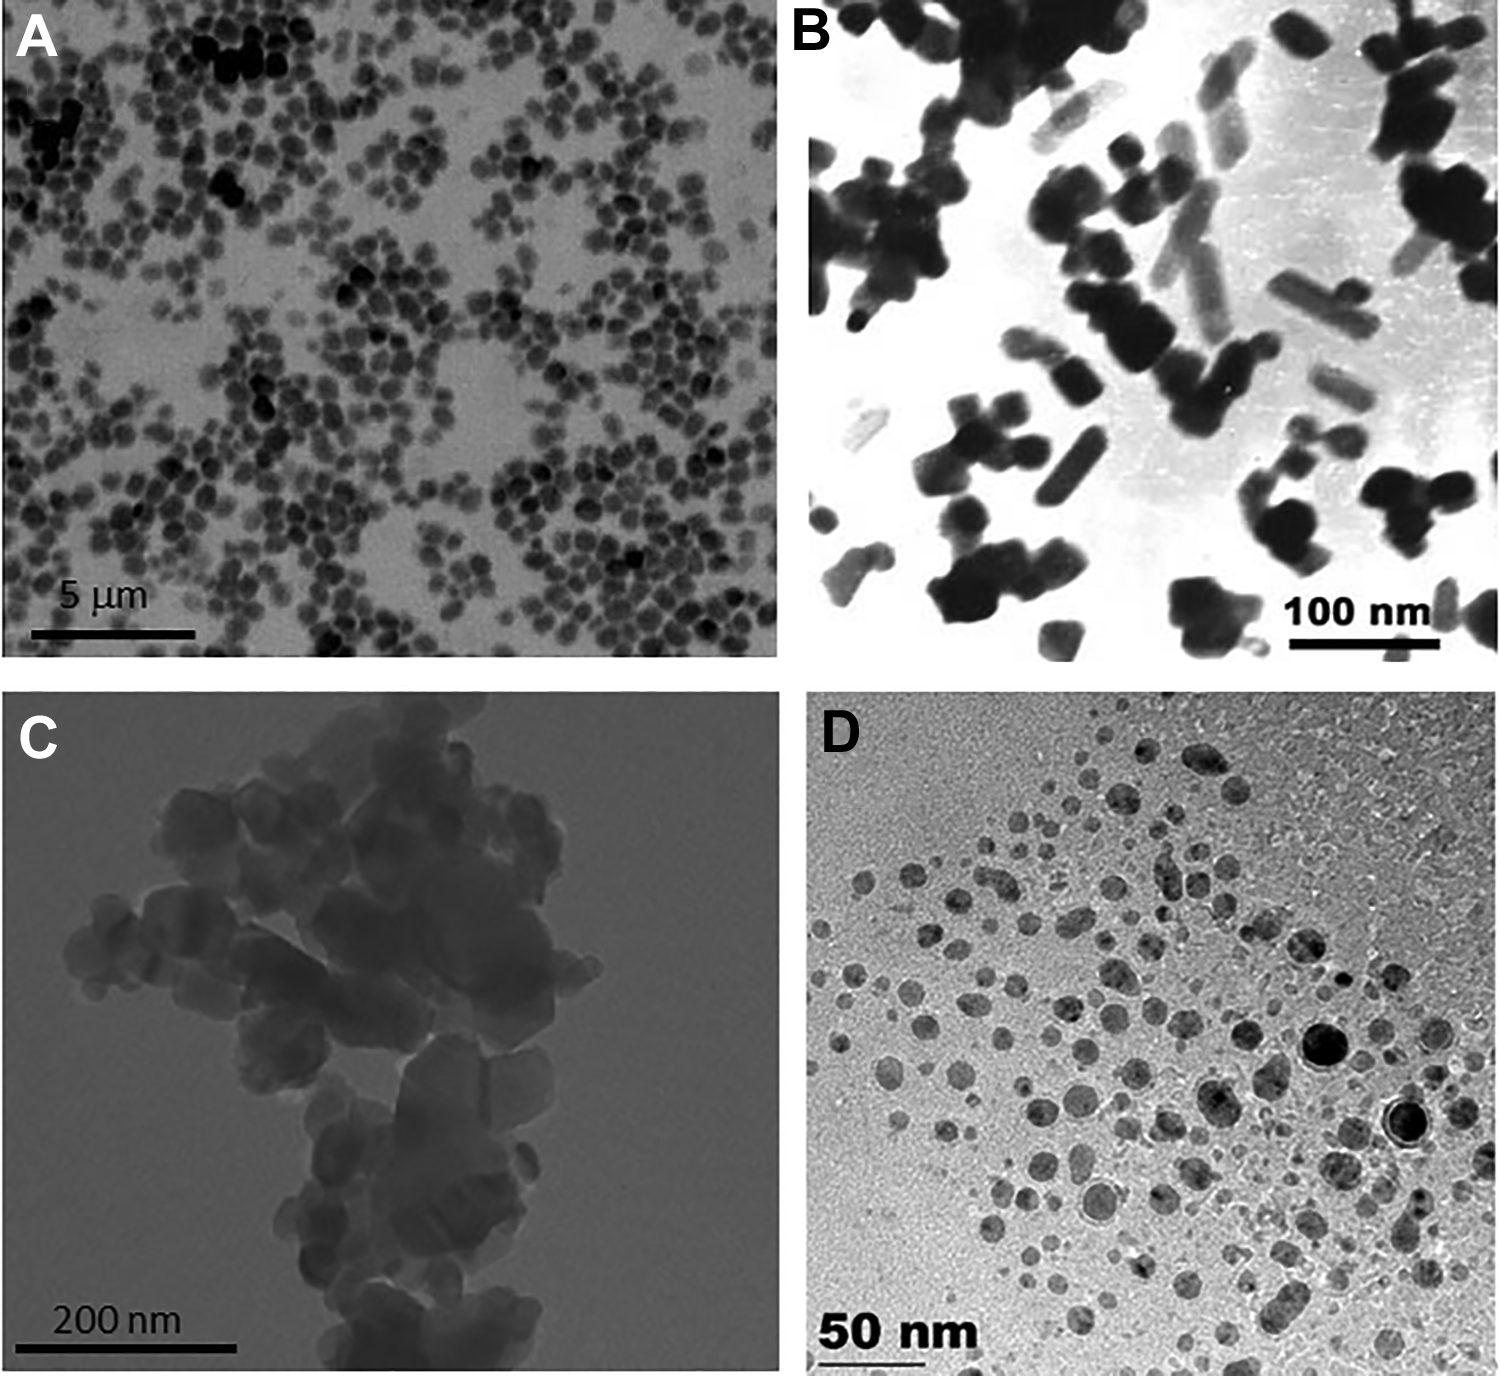
Transmission electron microscope (TEM) images of Ga2O3 (A), In2O3 (B), gallium arsenide (GaAs) (C), and indium arsenide (InAs) (D) nanoparticles provided by the respective nanomaterial manufacturers.
Characterization of NPs in the medium of study is important, since the formation of large aggregates may influence and change their potential toxicity. Dynamic light scattering was utilized to evaluate the particle size distribution in bioassay medium. The average hydrodynamic diameter includes the particle with water or other molecules adsorbed on its surface, and therefore, it is generally higher than the primary size determined for the dry particles by electron microscopy. The results show that the average hydrodynamic particle sizes of the NPs in bioassay medium were much higher than their primary sizes. The average particle size determined for Ga2O3 and In2O3 ranged from 626 to 654 nm. Additionally, the ζ potential of the Ga2O3 and In2O3 dispersions was low, averaging 15.1 and 1.3 mV, respectively. Colloidal dispersions exhibiting ζ potential values higher than +30 mV or lower than −30 mV are considered stable, while particles with low surface charge tend to aggregate due to limited electrostatic repulsion. Since the isoelectric point of Ga2O3 and In2O3 NPs dispersions in pure water (8.4-9.2) 44,45 is relatively close to the pH of the bioassay media (ca. 7.0), the observed particle aggregation in the bioassay medium is not surprising. In addition, the high ionic strength of the culture media, which contains high concentrations of NaHCO3 (2.2 g/L), NaCl (6.8 g/L), and other salts, is also expected to contribute to compress the electrical double layer and, consequently, facilitate particle agglomeration. It is well known that many NP dispersions are destabilized in complex aqueous media 46 containing high levels of salts and/or organic compounds, 12 resulting in aggregates that have effective sizes that are orders of magnitude higher compared to that of the primary particles. The arsenide NP dispersions were highly unstable in culture medium and formed large aggregates that settled readily and could not be assessed for particle size distribution and ζ potential using the Zetasizer Nano ZS instrument utilized in this study to characterize the NP dispersions.
Cytotoxicity of Ga- and In-Based NPs
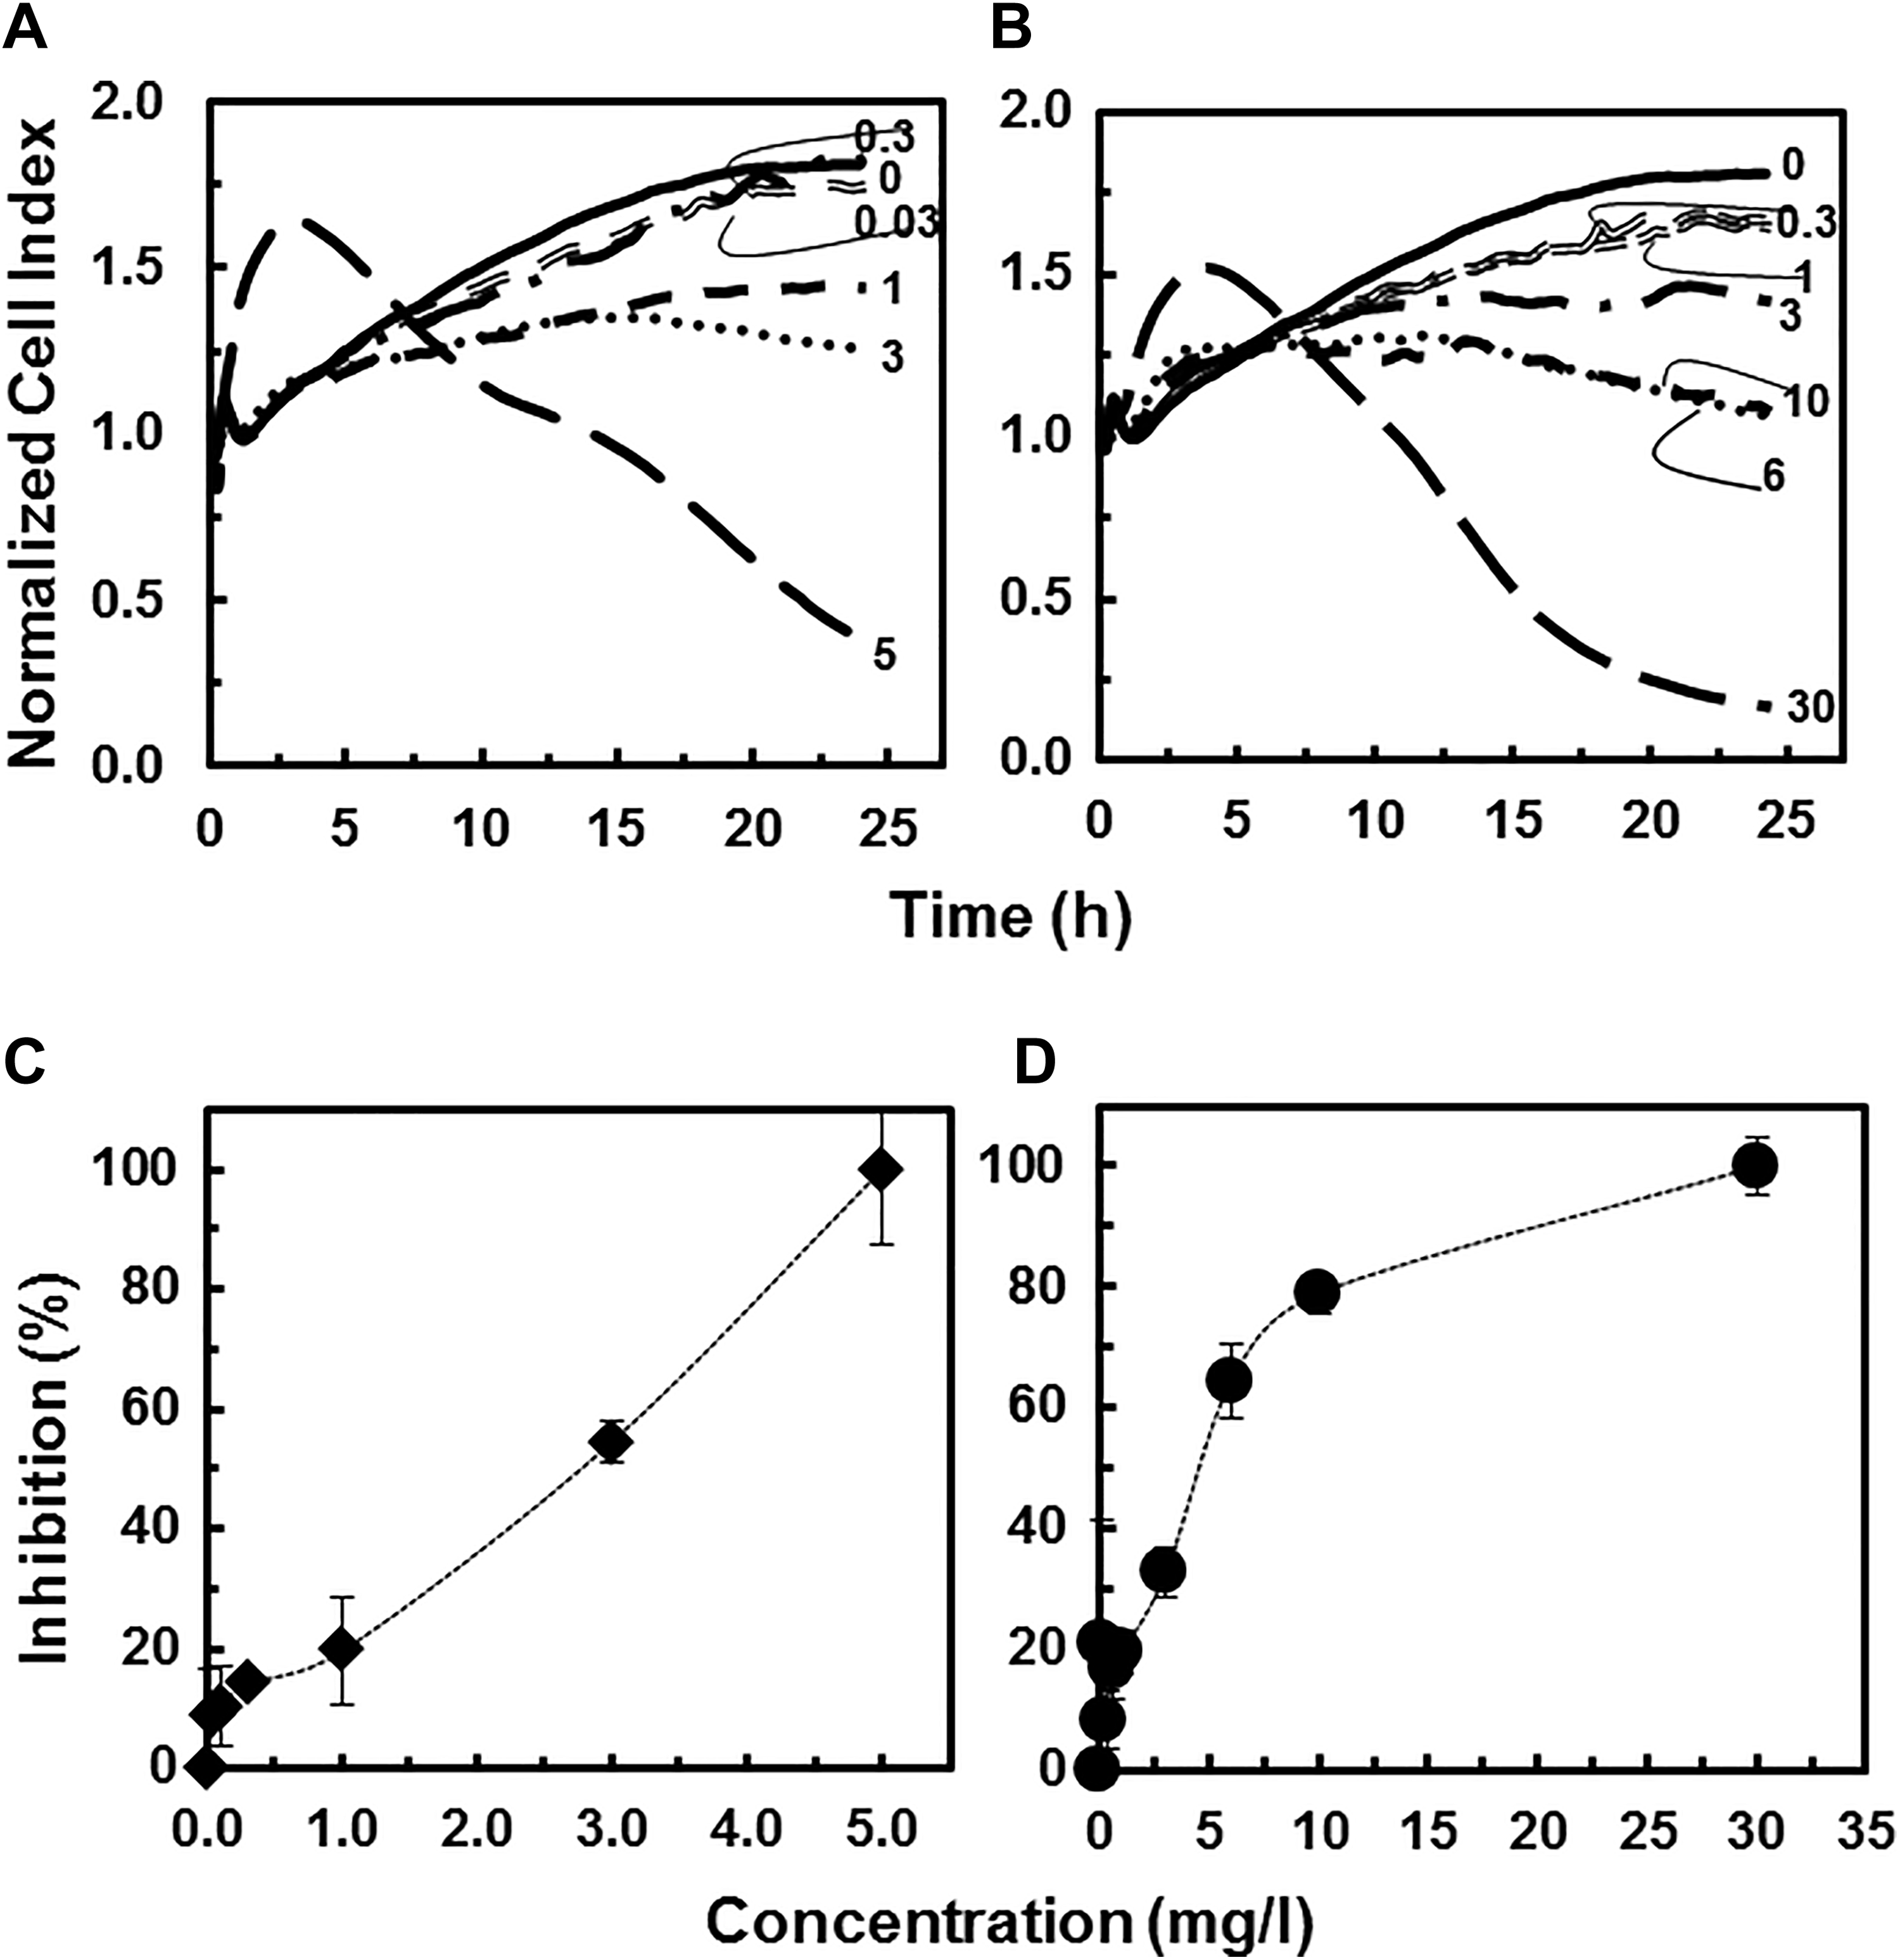
The CMP process uses pristine slurries such as silica (SiO2), alumina (Al2O3), or ceria (CeO2) NPs to produce smooth material surfaces. 5 When new materials are introduced onto the wafer, CMP could generate waste containing GaAs and InAs NPs as well as potential by-products such as Ga2O3 and In2O3 NPs. We first evaluated the potential cytotoxicity of GaAs and InAs NPs to human bronchial epithelial cells using the xCELLigence RTCA system. 16HBE14o- cells were exposed to GaAs and InAs NPs at concentrations ranging from 0 to 250 mg/L and the NCI was recorded for 24 hours (Figure 2A and B). The GaAs NPs caused strong inhibition to the target cells. Increasing concentration of GaAs NPs resulted in a high initial increase in NCI within the first 4 hours of exposure, followed by a loss of NCI over the 24-hour period (Figure 2A). At the highest tested concentration of GaAs NPs (125 mg/L), the initial NCI increase was rapid, peaking near 2 hours, followed by a drastic decrease in NCI values until there was no impedance within 10 hours of exposure. These changes are consistent with GaAs-induced cellular signaling (ie, increased NCI) followed by cytotoxicity (ie, loss of NCI). The RTCA measurements following InAs NPs resulted in a similar concentration-dependent short-term signaling and long-term cytotoxicity, albeit with a significantly reduced response (Figure 2B). A 16-hour exposure time point was chosen to compare toxicity and develop a concentration response (Figure 2C and D). With GaAs NPs, a growth inhibition of 95% was observed at 25 mg/L and 100% inhibition at 125 mg/L. The 50% growth inhibition concentrations, IC50 value, after 16-hour exposure was 6.2 mg/L (Table 1). For InAs NPs, a concentration of 125 mg/L resulted in ca. 60% inhibition, and full inhibition was only reached at the highest concentration tested (250 mg/L). The calculated 16-hour IC50 for InAs NPs (68.0 mg/L; Table 1) was 10-fold higher than that observed for GaAs NPs. Similar cytotoxicity toward BEAS-2B cells (an alternative human bronchial cell line) has been reported for GaAs NPs (<10 nm) using single time point (24 hours) fluorescent assay (IC50 = 12.5 mg/L). 15 In the same study, InAs NPs (20-200 nm) displayed limited cytotoxicity toward BEAS-2B cells (<10% cell death at 98.7 mg/L). 15 The use of the RTCA in the current experiments allowed for an examination of physiological changes (including cytotoxicity as an end point) over time. The RTCA system provided the percentage inhibition toward the 16HBE14o- cells at different concentrations at multiple time points such as after 8, 16, and 24 hours of exposure (Figure 3A and B). This is a significant difference from previous work in which cytotoxicity was reported at a single time point. 15 Such analysis shows that early (ie, 1-4 hours) signaling, as noted in the rapid increase in NCI, is predictive of a later cytotoxicity response, recorded here as a loss of NCI and previously in single time point fluorescence assays. 15
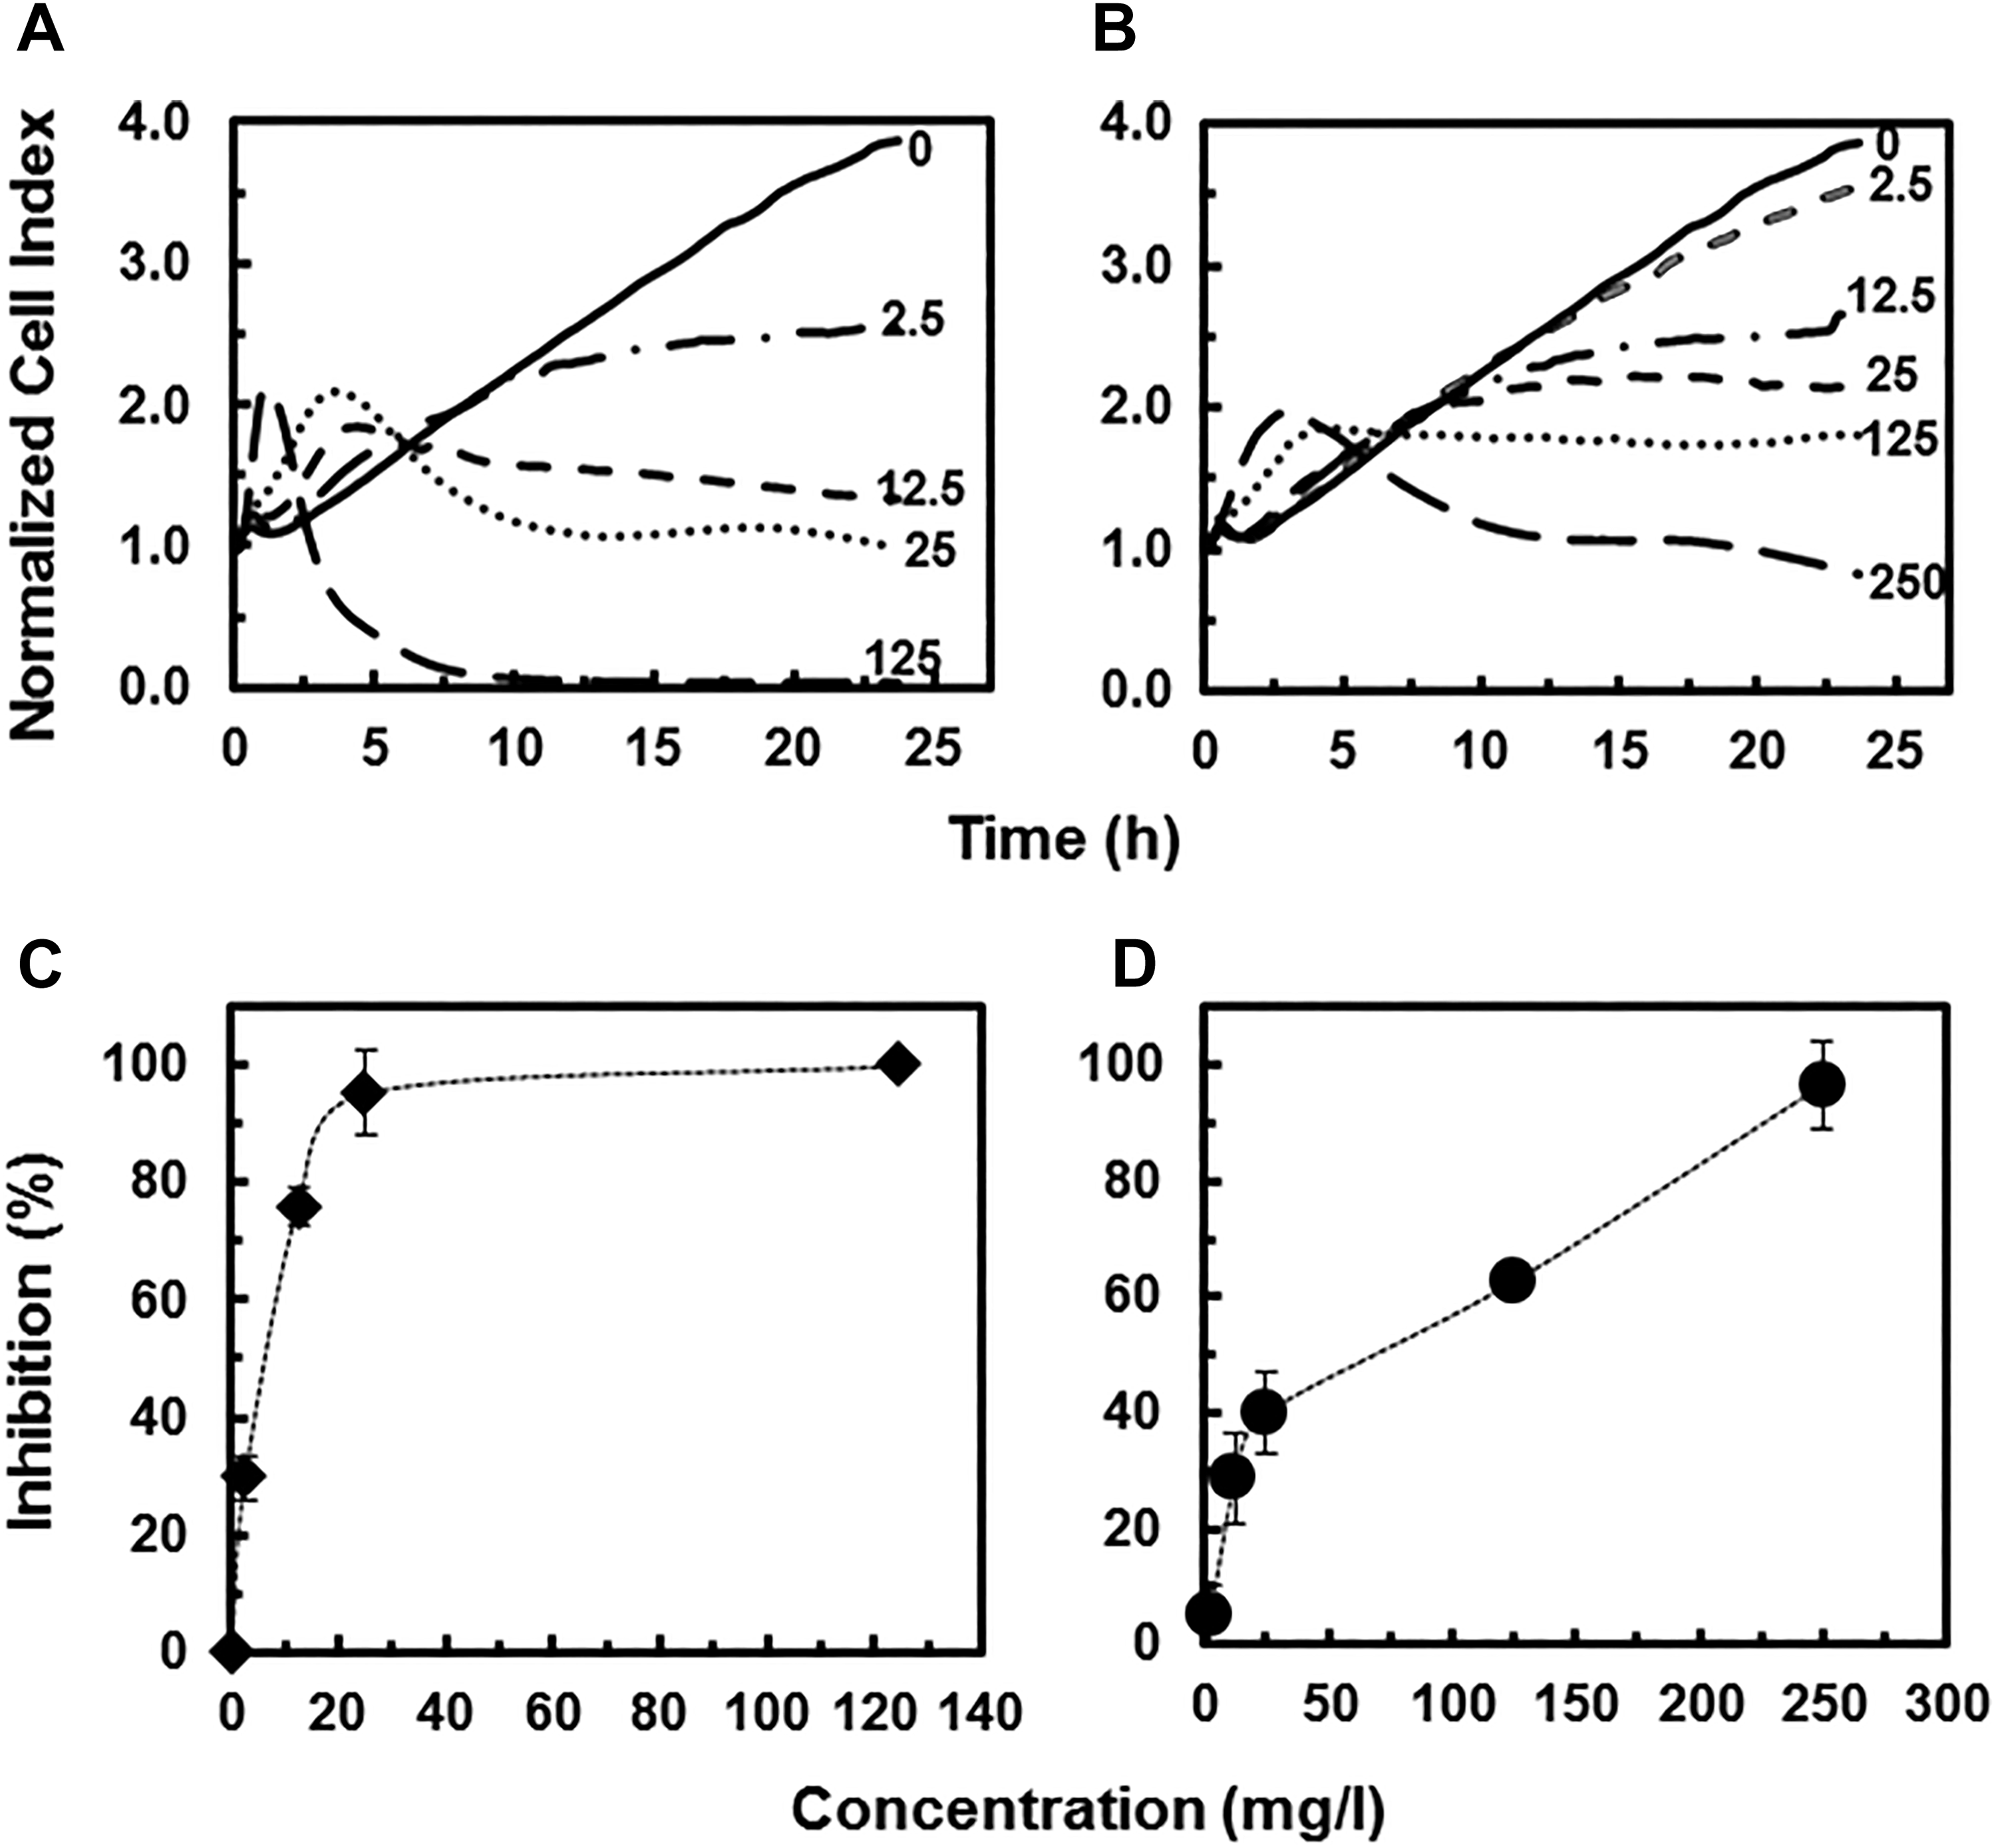
Cytotoxicity response of human bronchial epithelial cells (16HBE14o-) exposed to increasing concentrations (mg/L) of different nanoparticles (NPs) as a function of time: gallium arsenide (GaAs) NPs (A) and indium arsenide (InAs) NPs (B). Lines represent average values of 4 replicates. Inhibitory effects (%) of GaAs NPs (C) and InAs NPs (D) on human bronchial epithelial cells after 16 hours of exposure as a function of concentration.
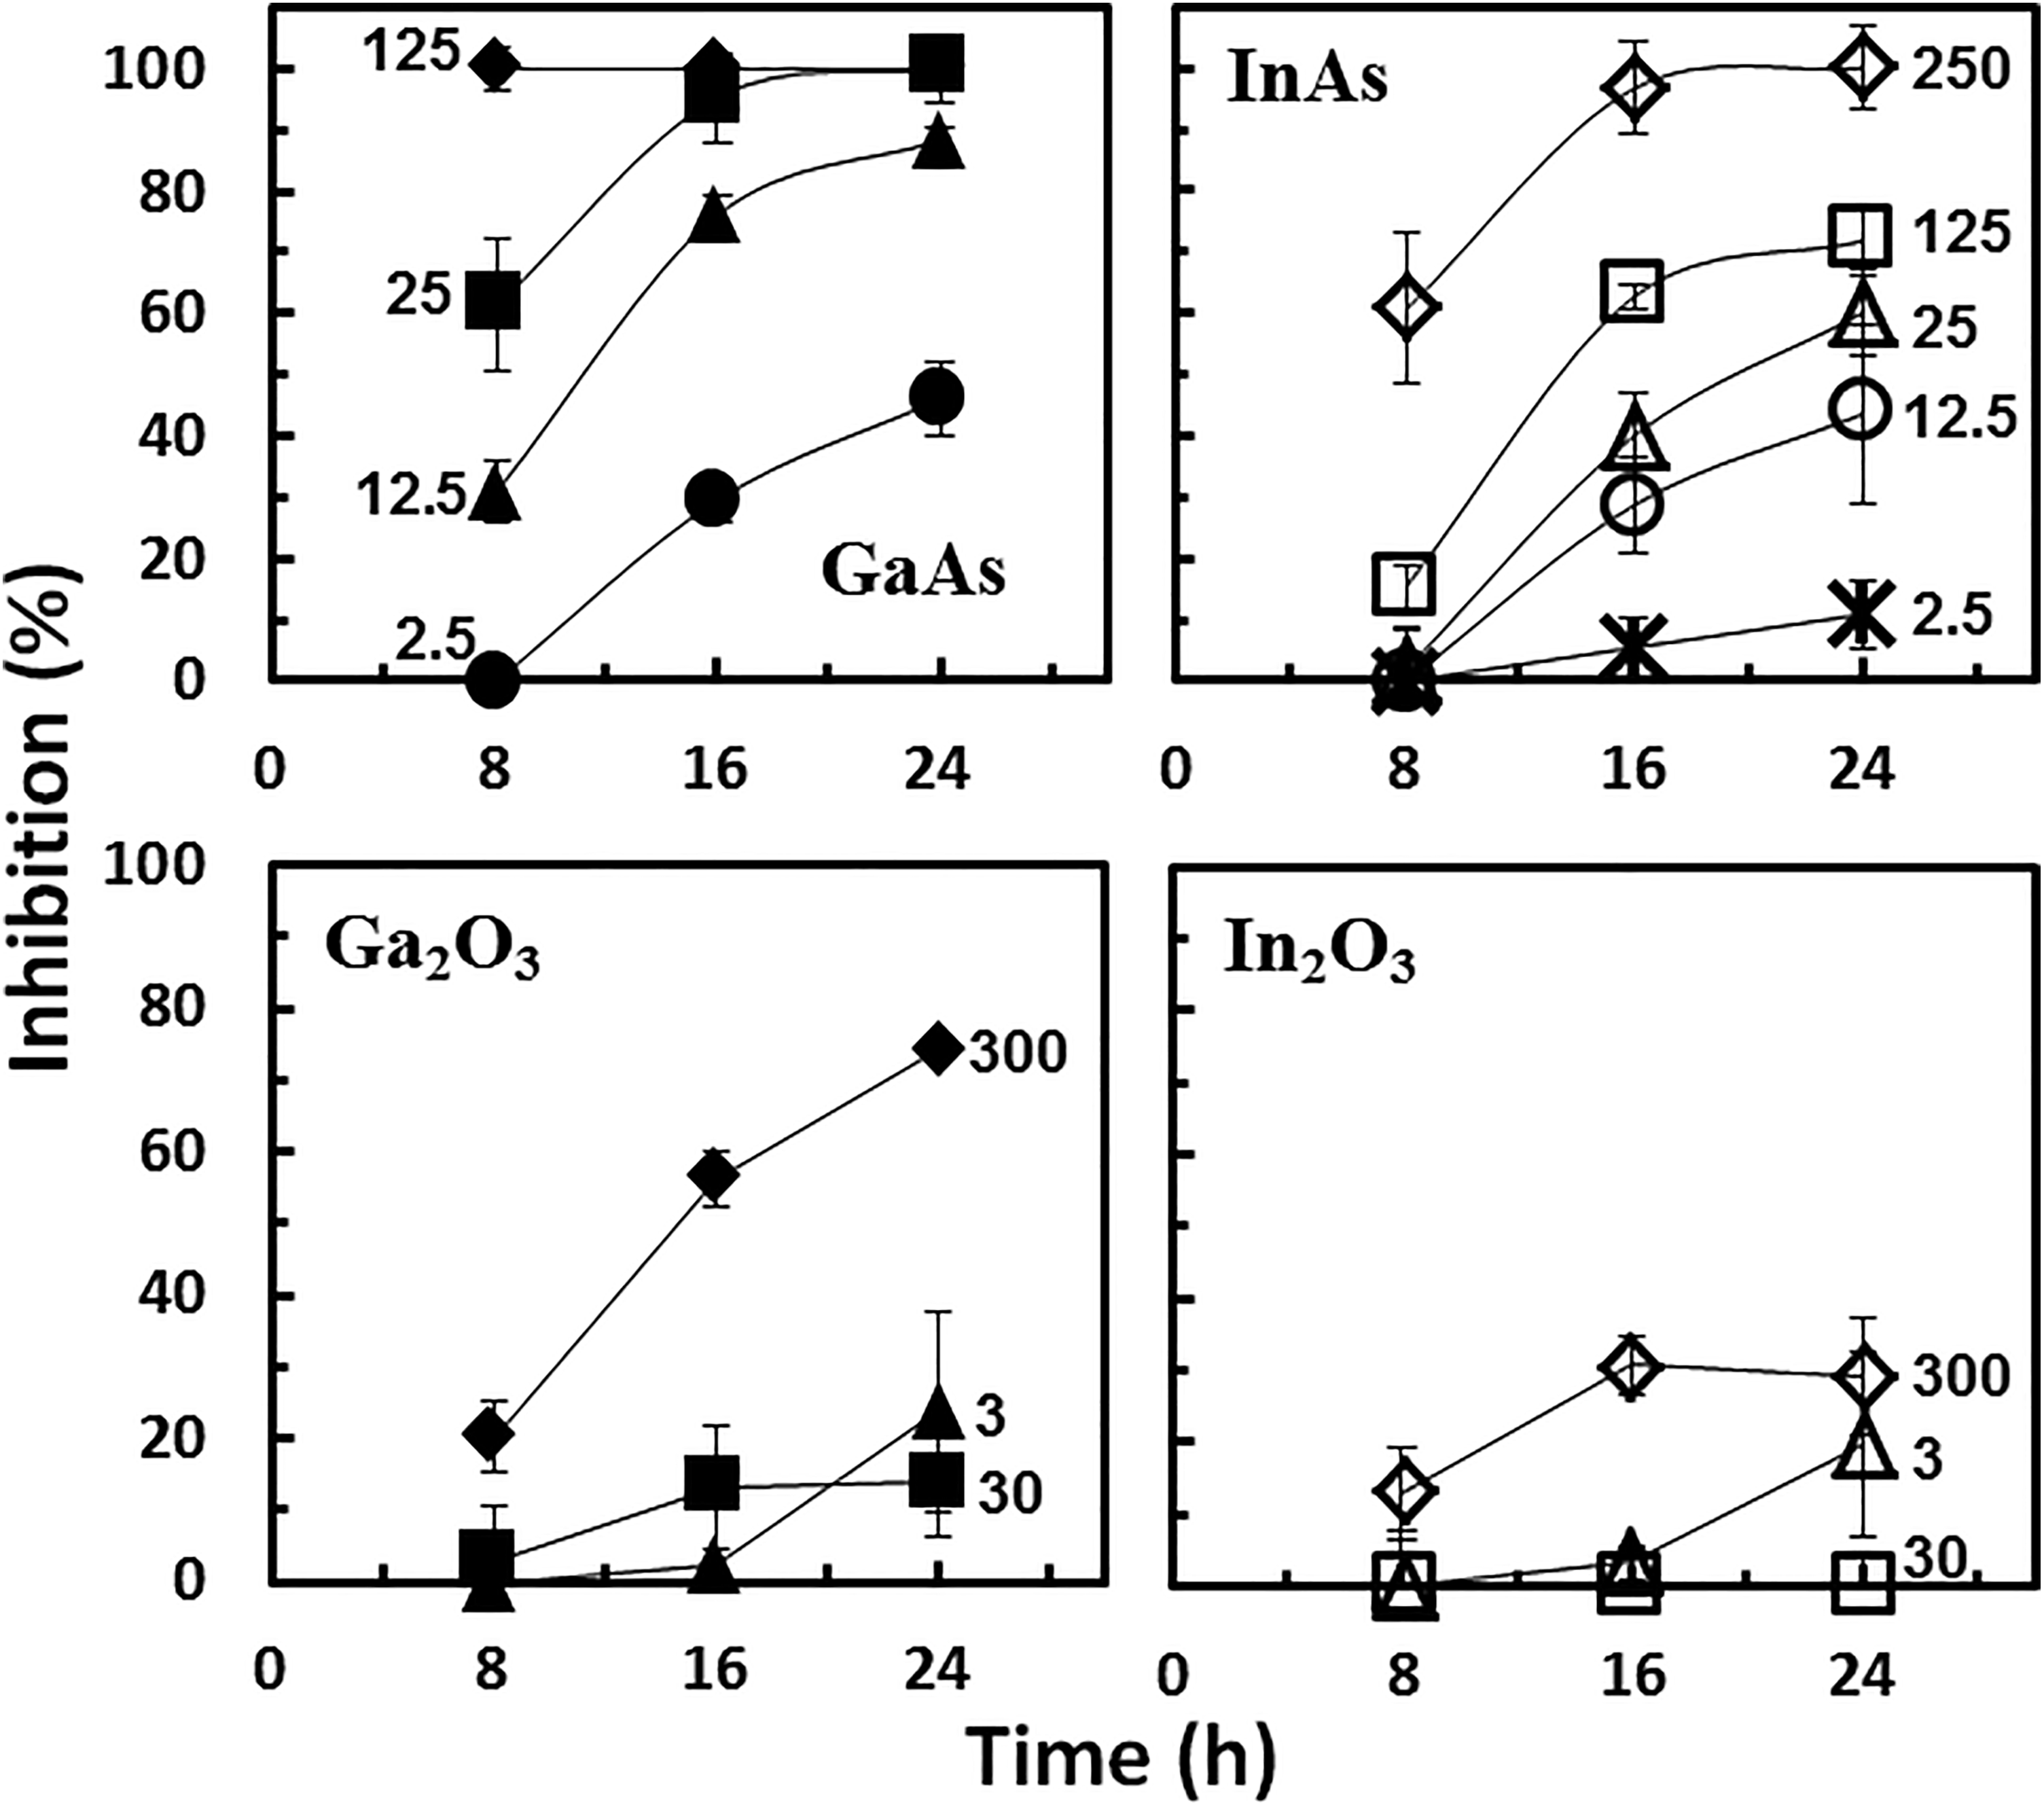
Inhibitory effects (%) of gallium arsenide (GaAs) nanoparticles (NPs), indium arsenide (InAs) NPs, Ga2O3 NPs, and In2O3 NPs on human bronchial epithelial cells at different concentrations (mg/L) as a function of time. The label shown next to each curve indicate the nanoparticle concentration in the bioassays (in mg/L).
Concentrations of Soluble and Nano-Sized III/V Chemicals Tested Causing 50% Inhibition (IC50) After 16 Hours of Exposure in the Impedance-Based RTCA Bioassay.
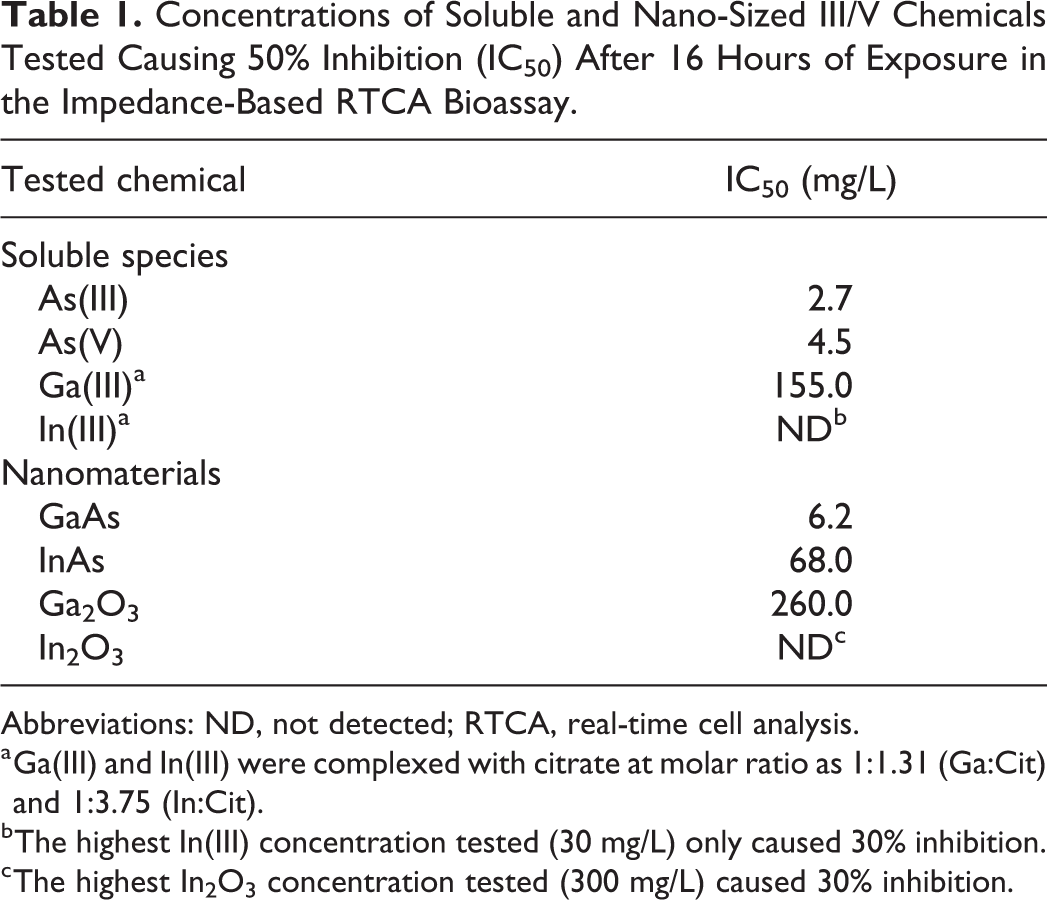
Abbreviations: ND, not detected; RTCA, real-time cell analysis.
a Ga(III) and In(III) were complexed with citrate at molar ratio as 1:1.31 (Ga:Cit) and 1:3.75 (In:Cit).
b The highest In(III) concentration tested (30 mg/L) only caused 30% inhibition.
c The highest In2O3 concentration tested (300 mg/L) caused 30% inhibition.
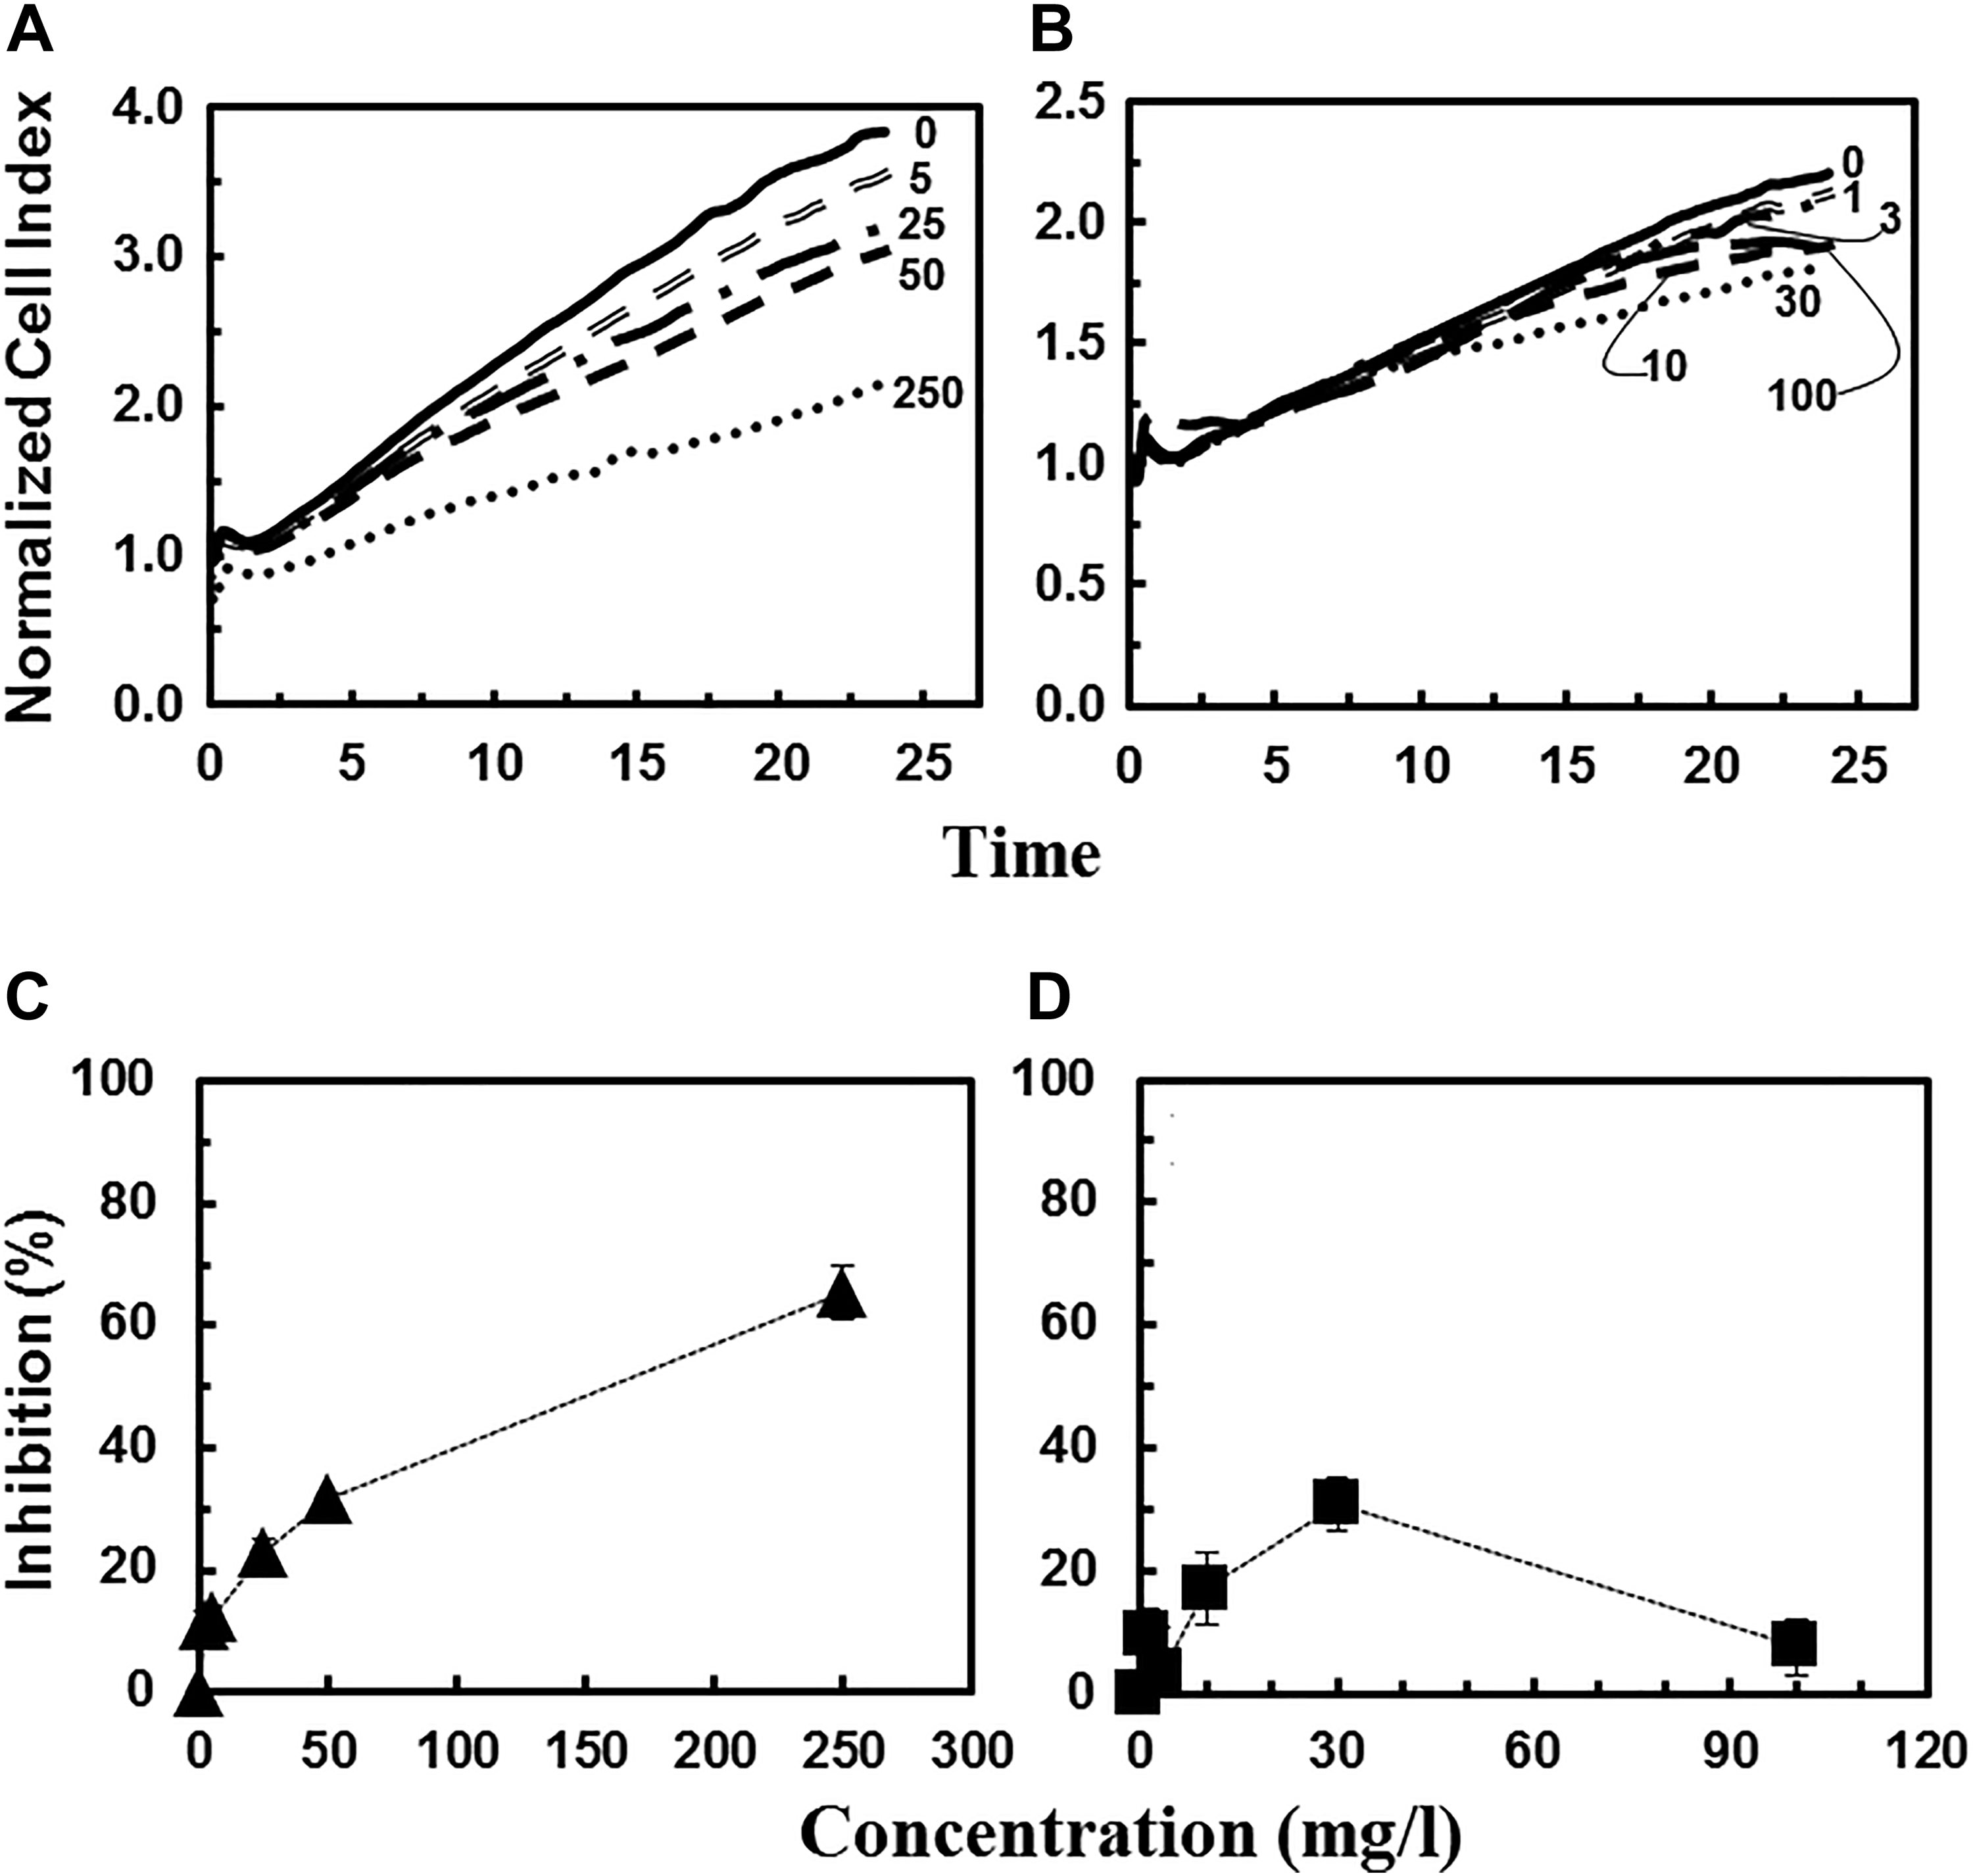
In addition to the arsenide NPs derived from the III-V materials, Ga2O3 and In2O3 NPs can also be formed as potential byproducts of the CMP process of the semiconductor fabrication plant. 5,6 Both Ga2O3 and In2O3 NPs were found to be relatively nontoxic to the 16HBE14o- target cells. Unlike the As-containing NPs above, the cytotoxicity traces for Ga2O3 and In2O3 NPs showed significant decreases only at the highest concentrations tested (30 and 300 mg/L for Ga2O3 NPs and 300 mg/L for In2O3 NPs; Figure 4A and B). Similarly, at a concentration of 300 mg/L, Ga2O3 and In2O3 NPs only caused 56% and 30% growth inhibition, respectively, after 16 hours of exposure. Data in this current study are in agreement with single time point (24 hours) viability assays (MTT assay) where In2O3 (>200 nm) has been shown to have minimal effects on BEAS-2B cells at 50 mg/L and 50% reduction in viability at 1,000 mg/L. 47 A direct comparison of the Ga2O3 and In2O3 NPs RTCA traces with the GaAs and InAs NPs RTCA traces shows a loss of early signaling upon addition of the oxidized compounds and a distinct loss of cytotoxicity.
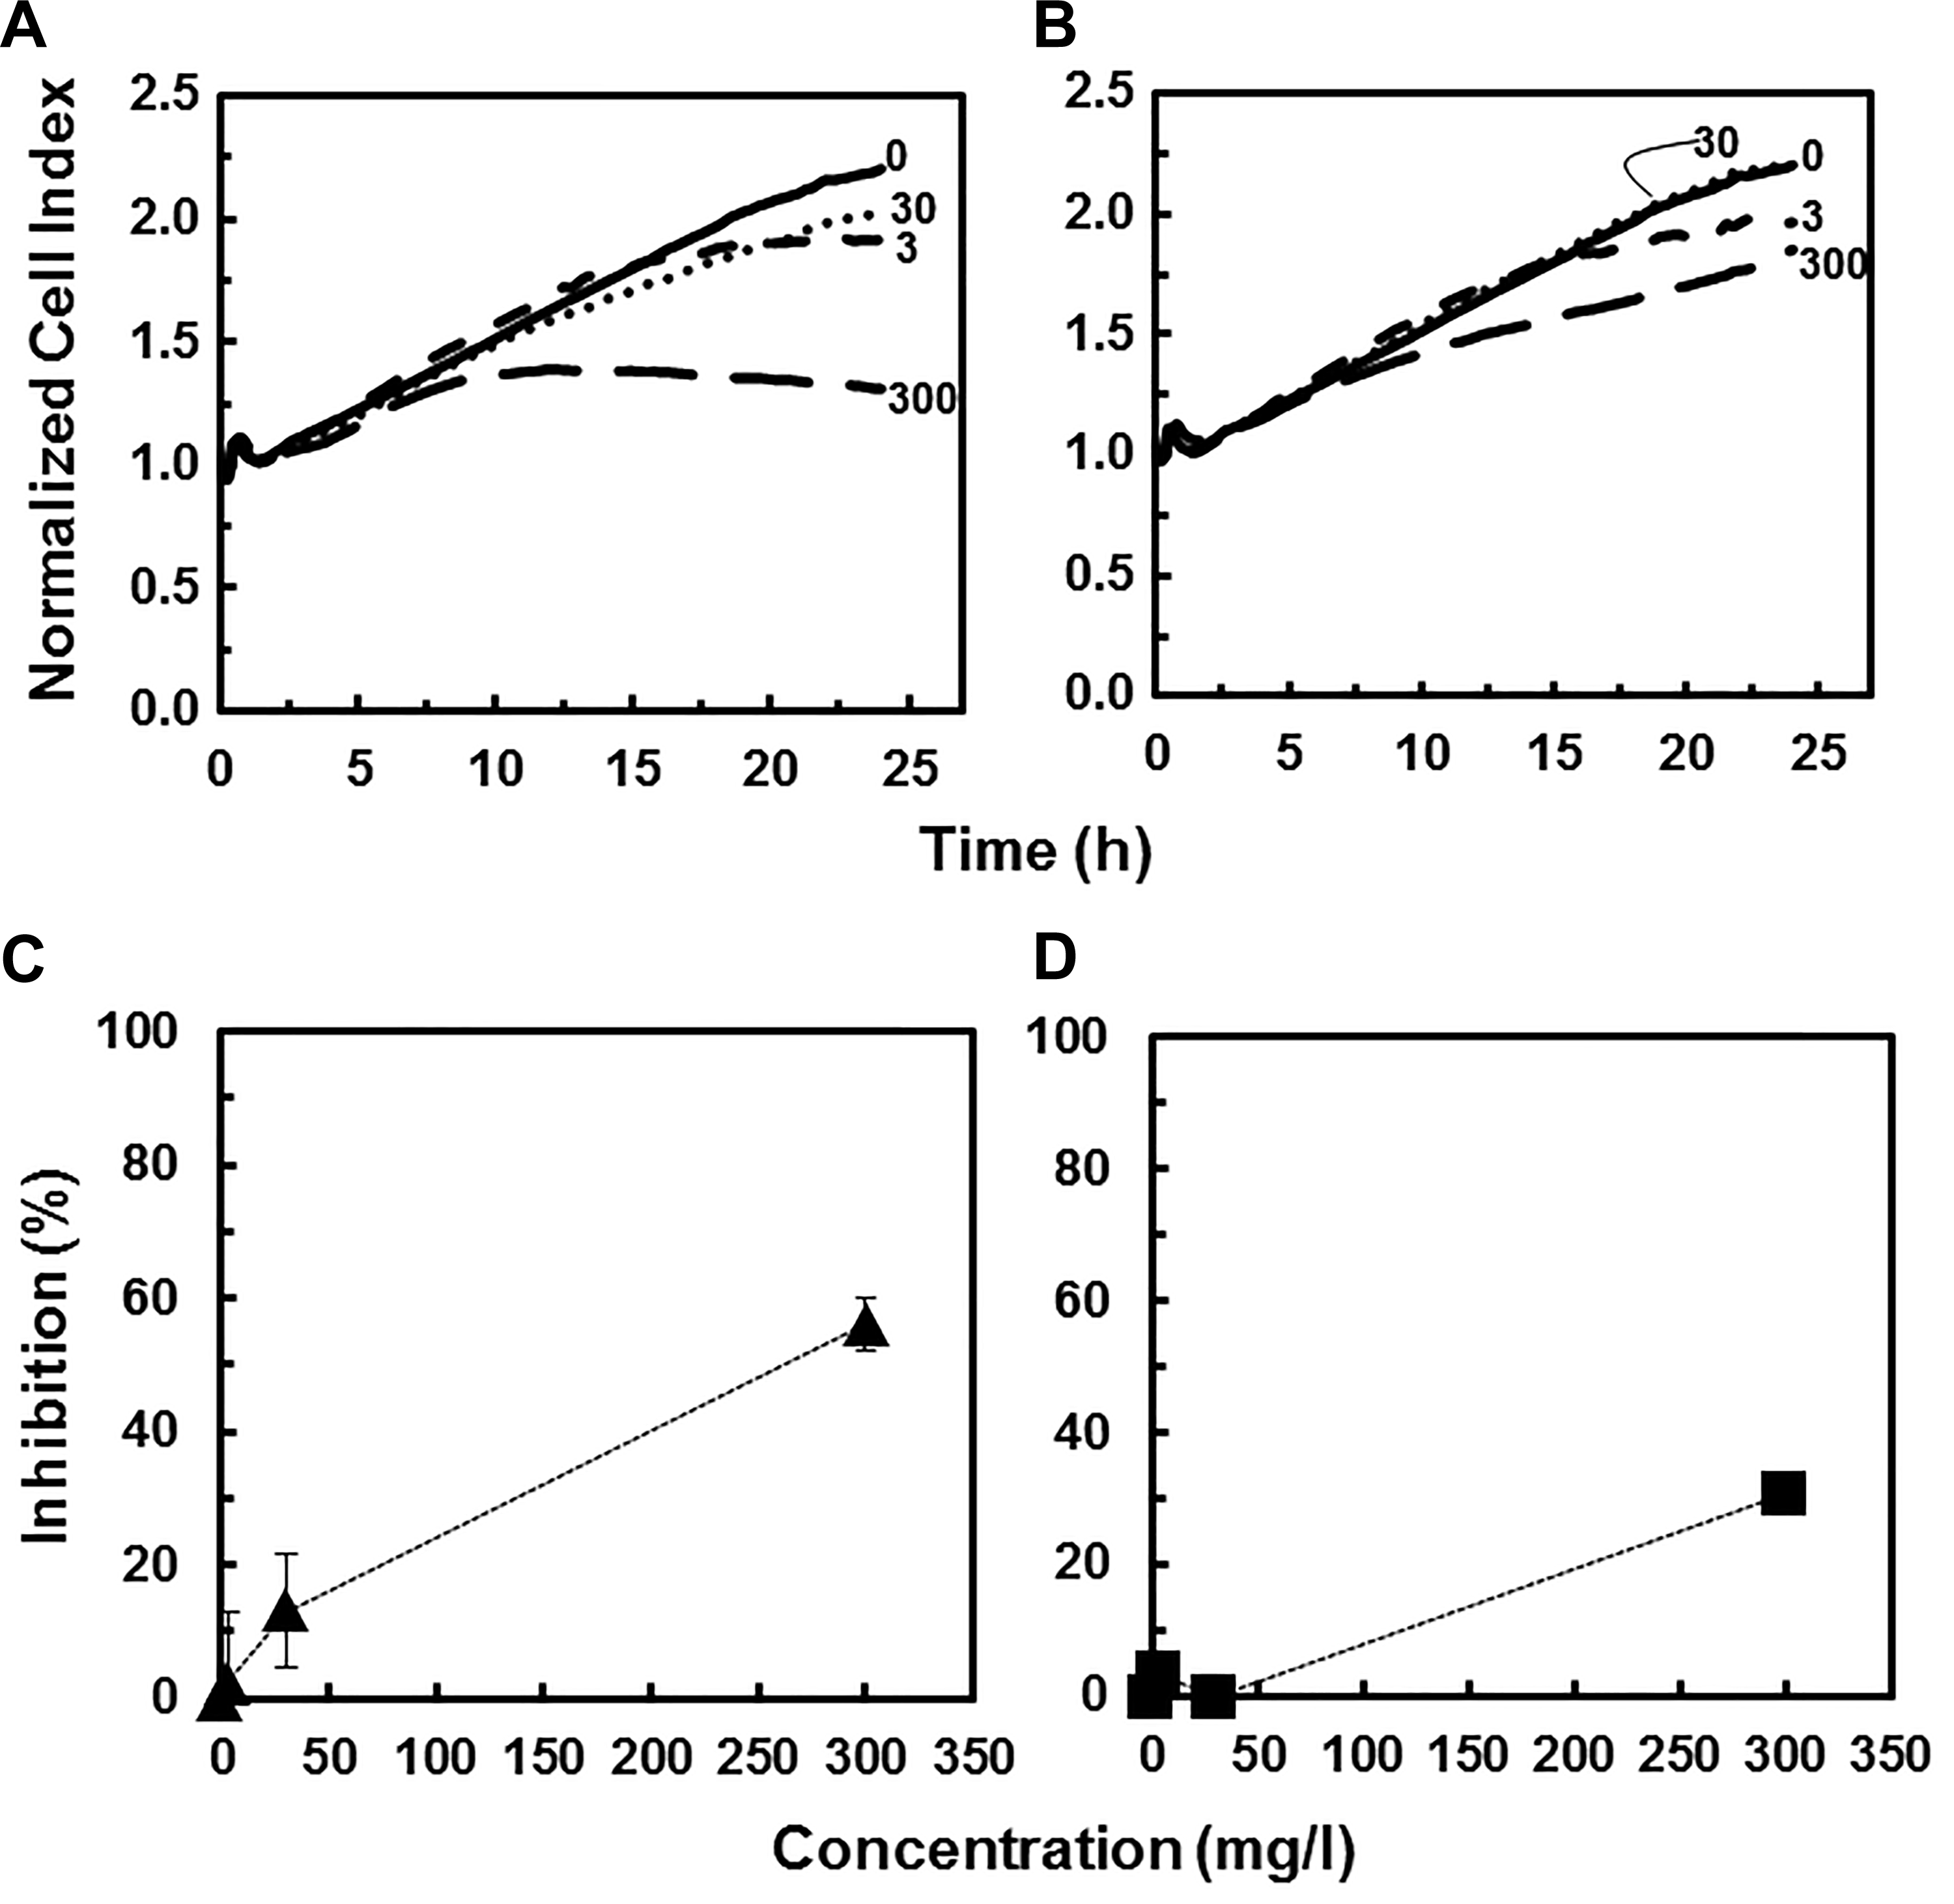
Cytotoxicity response of human bronchial epithelial cells (16HBE14o-) exposed to increasing concentrations (mg/L) of different NPs as a function of time: Ga2O3 nanoparticles (NPs) (A) and In2O3 NPs (B). Lines represent average values of 4 replicates. Inhibitory effects (%) of Ga2O3 NPs (C) and In2O3 NPs (D) on human bronchial epithelial cells after 16 hours of exposure as a function of concentration.
Corrosion and Dissolution of GaAs and InAs NPs
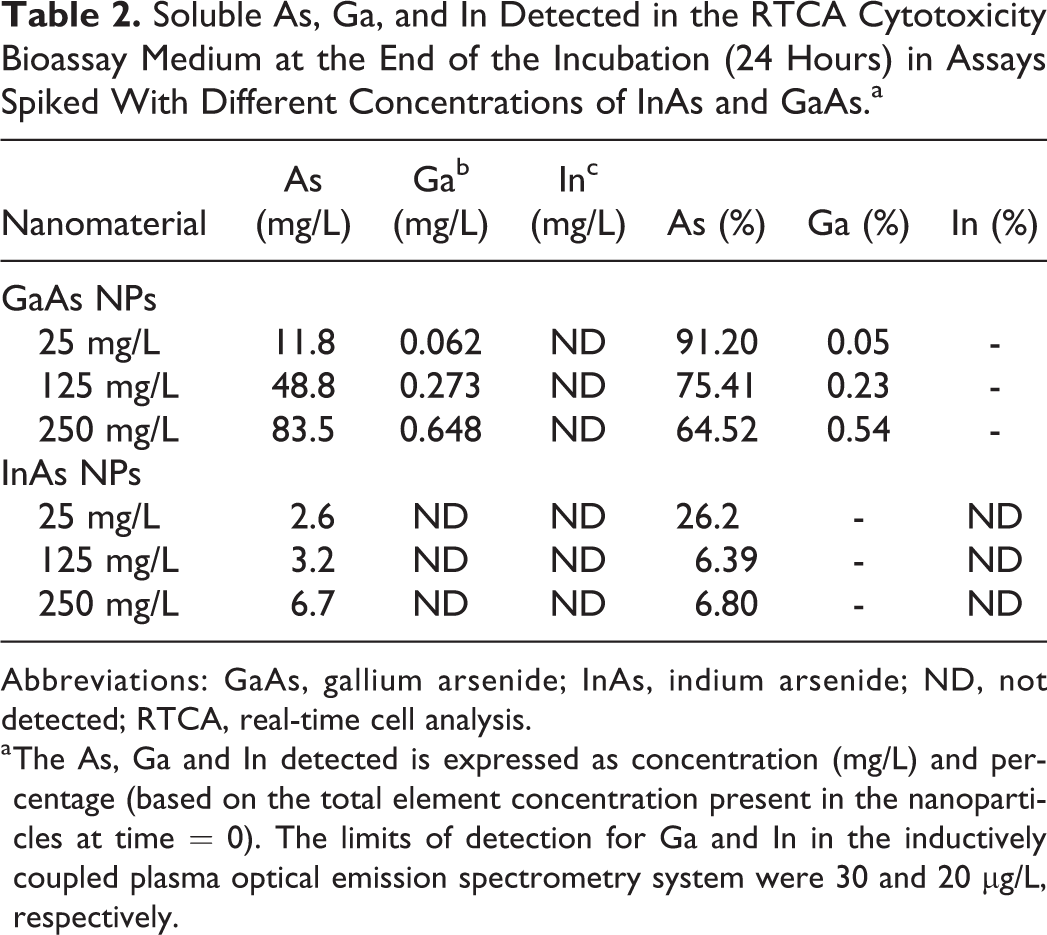
Both GaAs and InAs particles have been shown previously to be susceptible to corrosion in aqueous medium with concomitant release of soluble As species. 48 Therefore, the heightened signaling and subsequent cytotoxicity observed in GaAs and InAs NPs compared to Ga2O3 and In2O3 NPs reported above could be caused by the NPs themselves or by toxic species released into solution due to NP corrosion. The concentrations of soluble As, Ga, and In detected in the medium at the end of the cytotoxicity assays (ie, 24 hours after NP addition) are listed in Table 2. The results indicate that GaAs NPs underwent rapid dissolution in the bioassay medium, leading to the release of high concentrations of toxic soluble As. Soluble As was also detected in the samples originally spiked with InAs NPs, albeit at much lower concentrations. Arsenic speciation analysis revealed that As(III) was the dominant As species, accounting for 81.2% to 93.3% of the total concentration of soluble As, depending on the assay.
Soluble As, Ga, and In Detected in the RTCA Cytotoxicity Bioassay Medium at the End of the Incubation (24 Hours) in Assays Spiked With Different Concentrations of InAs and GaAs.a
Abbreviations: GaAs, gallium arsenide; InAs, indium arsenide; ND, not detected; RTCA, real-time cell analysis.
a The As, Ga and In detected is expressed as concentration (mg/L) and percentage (based on the total element concentration present in the nanoparticles at time = 0). The limits of detection for Ga and In in the inductively coupled plasma optical emission spectrometry system were 30 and 20 μg/L, respectively.
Dissolution experiments were performed with GaAs and InAs NPs over 7 days to better characterize the potential release of soluble As in aqueous medium under circumneutral pH conditions commonly found in natural waters (Figure 5). In aqueous media, the arsenide NPs underwent significant dissolution. Of the initial 500 mg/L of GaAs NPs (80-100 nm) incubated at the start of the experiment, almost all of the As were leached out (259 mg As/l, corresponding to 100%) after 7 days. Speciation results showed that 50% of total measured As was As(III) and 11% was As(V). Under similar testing conditions, only 20 mg As/l (≈10% of the As) was leached out of InAs NPs. Speciation results of InAs NPs study indicated that about 68% of total measured As was As(III) and 7% was As(V). The results of dissolution and speciation studies indicate that the potential cytotoxic effects of GaAs NPs and InAs NPs can come from the toxic soluble As species. In the current study, the concentration of soluble Ga and In detected both in the cytotoxicity bioassays (Table 2) and the corrosion tests (Figure 5) was very low. For example, the dissolved concentrations of Ga and In recorded in the corrosion tests on day 7 were only 0.03 and 12.3 mg/L, corresponding for 0.01% and 4.1% of the respective metal initially present in the GaAs and InAs NPs. Higher concentrations of soluble Ga(III) and In(III) would be expected based on the concentrations of dissolved As determined. In the corrosion tests (day 7), the molar ratio of dissolved As:Ga was over 8,000 and the molar As:In ratio was 2.5. These ratio values were higher than the theoretical ratio of 1:1 in the solid phase NPs, suggesting that a large fraction of Ga and In released by corrosion had been oxidized to insoluble products. It is well known that Ga(III) and In(III) are sparingly soluble (0.01-1.0 mg/L of soluble Ga, <0.1 mg/L of soluble In) in water at pH values ranging 6.0 to 8.0 and ambient temperature. 37 In addition, the 16-hour IC50 values of As(III) and As(V) at 2.7 and 4.5 mg/L (Table 1), respectively, were very similar to that of GaAs NPs at 6.2 mg/L. When combining the results of corrosion and dissolution experiments of GaAs and InAs NPs with the IC50 values of the cytotoxicity tests, it is evident that the release of toxic soluble As species significantly contributes to the observed cytotoxic effects to human bronchial epithelial cells.
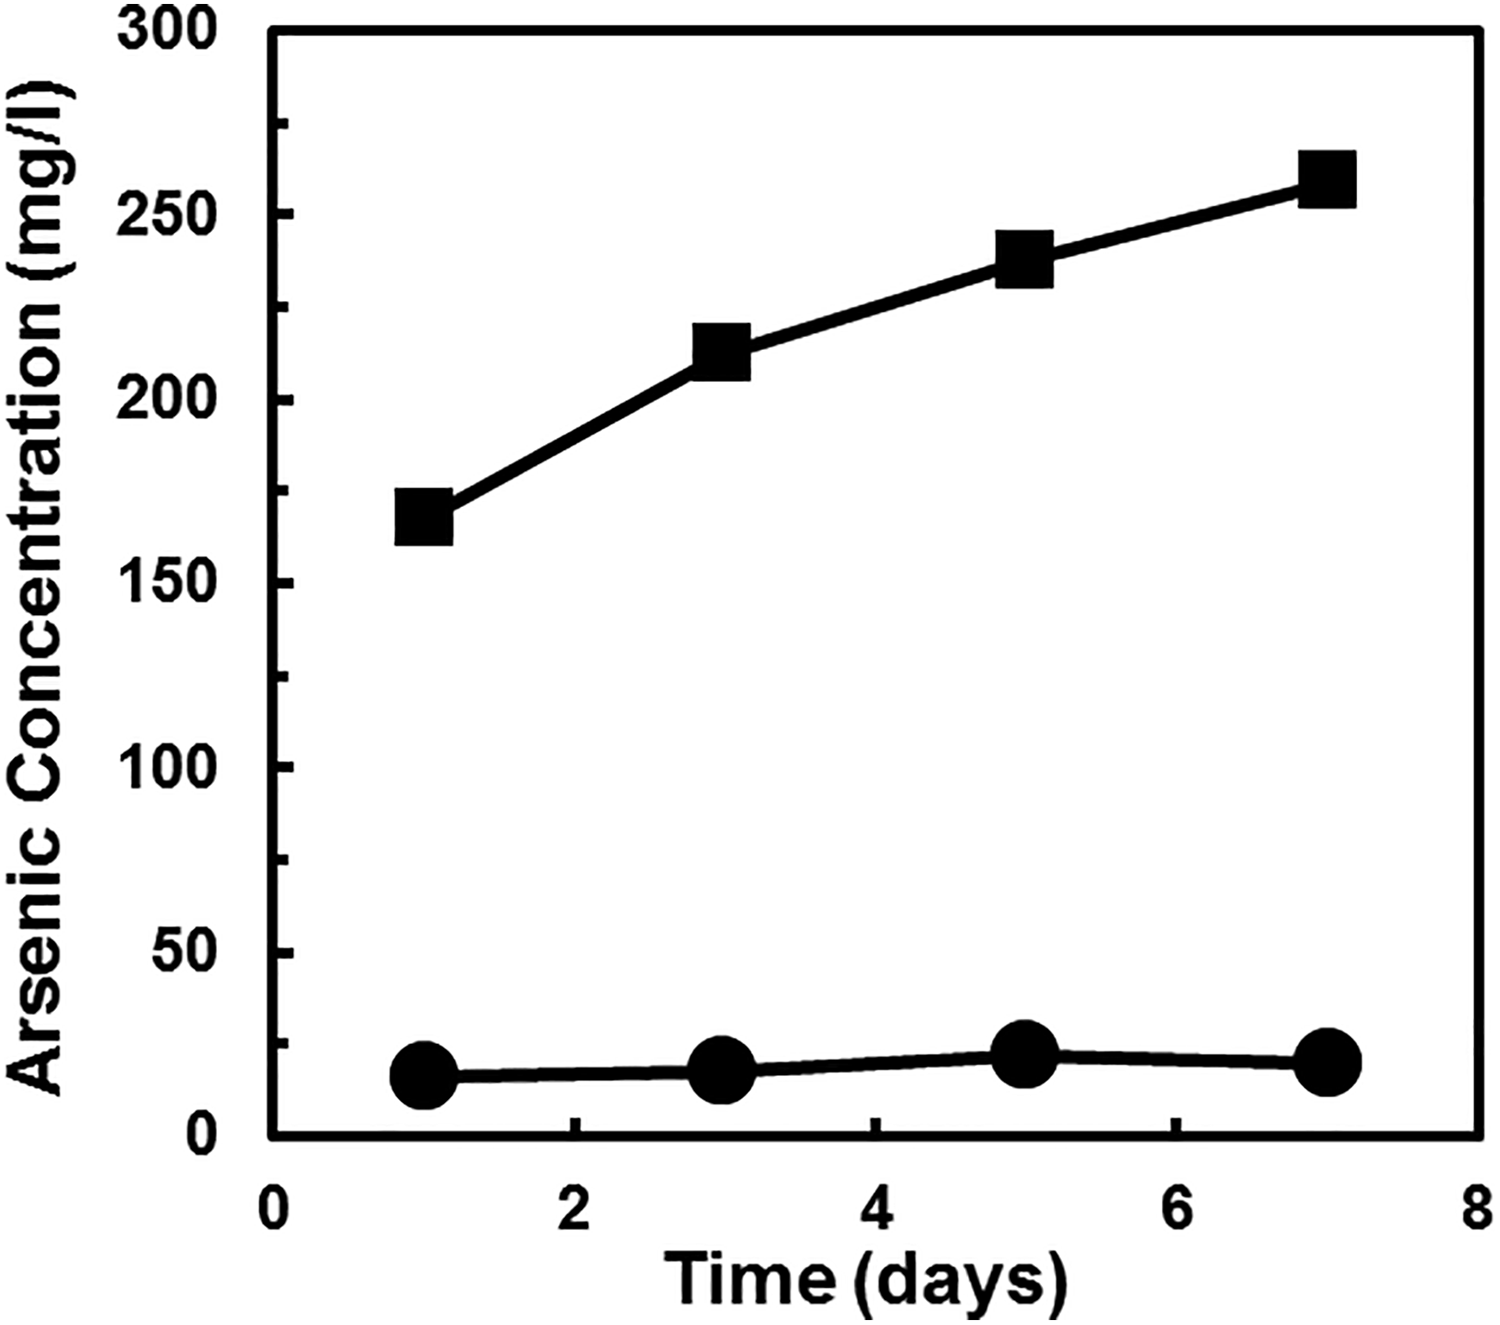
Time course of dissolution of gallium arsenide (GaAs) nanoparticles (NPs) (80-100 nm) (▪) and indium arsenide (InAs) NPs (80-100 nm) (•) in 1 g/L NaHCO3 at pH 7.8. The initial NP concentration was 500 mg/L.
Cytotoxicity of Soluble As, In, and Ga Species
It has been suggested that the toxicity of GaAs NPs, and to a lesser extent that of InAs NPs, is due to the As that dissociates in solution. 15 To test for such a speciation-driven toxicity, we performed RTCA toxicity assays with 16HBE14o- cells and As(III), As(V), and the relatively soluble Ga(III)-citrate and In(III)-citrate. As(III) displayed a distinct pattern of cytotoxicity over the 24-hour experiment. At the highest As(III) concentration tested (5 mg/L), an RTCA pattern similar to cytotoxic concentrations of GaAs NPs was observed; there was a rapid development of increasing NCI (1-3 hours) followed by a dramatic decrease in NCI that continued throughout the 24-hour experiment (Figure 6A). The cytotoxic effect of As(III) was concentration dependent and concentrations as low as 1 mg/L caused cytotoxicity (Figure 6A). The IC50 value after 16 hours of exposure (2.7 mg/L) was even lower than that observed for GaAs NPs (6.2 mg/L; Table 1). Additionally, data in this current study indicated that as the exposure time increased, the inhibitory effect increased (Figure 7). It is evident that even at low concentrations, As(III) is significantly cytotoxic.
Cytotoxicity response of human bronchial epithelial cells (16HBE14o-) exposed to increasing concentrations (mg/L) of As(III) (A) and As(V) (B) as a function of time. Lines represent average values of 4 replicates. Inhibitory effects (%) of As(III) (C) and As(V) (D) on human bronchial epithelial cells after 16 hours of exposure as a function of concentration.
Cytotoxicity response of human bronchial epithelial cells (16HBE14o-) exposed to increasing concentrations (mg/L) of Ga(III)-citrate (A) and In(III)-citrate (B) as a function of time. Lines represent average values of 4 replicates. Inhibitory effects (%) of Ga(III)-citrate (C) and In(III)-citrate (D) on human bronchial epithelial cells after 16 hours of exposure as a function of concentration.
Next, the cytotoxicity of As(V) was tested. At the highest tested concentration of As(V) (30 mg/L), the NCI initially increased in values during the first 3 hours, followed by a dramatic decrease in the NCI and eventual loss of signal (Figure 6B). Also similar to As(III) traces, lower concentrations of As(V) resulted in reduced cellular signaling and a reduction in overall impedance loss, indicative of less cytotoxicity. The dose-related inhibition after 16-hour exposure is shown in Figure 6D in which 100% growth inhibition was observed at 30 mg/L. The IC50 value after 16-hour exposure was 4.5 mg/L (Table 1). Similarly, evaluation of the cytotoxicity caused by different As(V) concentrations after 8, 16, and 24 hours of exposure indicated that the inhibitory impact increased with increasing exposure time (Figure 7B).
The evidence suggests that As(III) has a major impact on human bronchial epithelial cells. Considering various human cell lines, the IC50 of As(III) in the literature ranges from 0.14 to 12.2 mg/L. 15,25,49 The distinctive pattern of the rising and decreasing NCI was reported once before and discussed by Xing et al with NIH 3T3 cells (a standard fibroblast cell line) treated with As(III). 28 In their study, it was observed that NIH 3T3 cells fused together and formed larger multinuclear cell bodies during the first 3 hours of exposure to As(III). 28 However, after 8 hours of exposure to As(III), the multinuclear cells began to dissociate into smaller cells, which led to the decrease in NCI. 28 This phenomenon of the NCI rising and decreasing is unique to As since it does not occur with other metals. 28 In this current study, As(III) did not lead to any cell detachment or cell death at lower tested concentrations that is consistent with the findings of Xing et al 28 who did not observe an early increase in the NCI at a lower As(III) dose (0.094 mg/L). Even though the cell line in this study is different from the other studies, the results are within the range of reported values and prove that As(III) can lead to acute toxic effects to human lung cells at relatively low concentrations. The other As species behaved similarly.
Results in the current study and previous work showed that As(V) is cytotoxic to human cells. Considering different human cell lines, the 24-hour IC50 values reported for As(V) in the literature range from 3.8 to 97.6 mg/L. 15,50,51 The observed pattern of the rising and decreasing NCI when human lung cells were exposed to As(V) was also reported before by Xiao et al and Moe et al with the fibroblastic V79 cell line and the human lung carcinoma cell line A549 exposed to As(V), respectively. 50,51 In both of these earlier studies, it was observed that at the highest tested concentrations of 1.4 and 279 mg As(V)/l, the NCI values increased during the first 5 to 6 hours, then slowly decreased below the NCI values of the control group. 50,51 Similar to As(III), this phenomenon of the NCI rising and decreasing is unique to As since it does not occur with other metals. 28 Compared to As(III), in this current study, As(V) did not lead to any cell detachment or cell death at the lowest tested concentrations. This finding is consistent with the previous findings of Xiao et al and Moe et al who did not observe the early increase in the NCI at low As(V) doses (3-7 mg/L). 50,51 The results in this current study are within the previously reported IC50 range in the literature, suggesting that As(V) significantly affects human epithelial lung cells.
In addition to soluble As species, the potential cytotoxicity of soluble Ga(III)-citrate and In(III)-citrate to 16HBE14o- cells was studied. Both Ga(III)-citrate and In(III)-citrate were distinctly less toxic than the inorganic As species (Figure 7A and B). The NCI values from samples exposed to Ga(III)-citrate were only slightly lower than that of control group at 250 mg/L, while at lower concentrations, no significant decrease was observed (Figure 7A). In Figure 7B, approximately 60% inhibition was recorded at this highest tested Ga(III)-citrate concentration (250 mg/L). Additionally, at 3 different time points of exposure (8, 16, and 24 hours), Ga(III)-citrate was moderately cytotoxic at the concentrations of 250 and 500 mg/L (Figure 8C). The IC50 value after 16-hour exposure was 155 mg/L of Ga(III)-citrate (Table 1). Like Ga(III)-citrate, In(III)-citrate was not very toxic as evidenced by the NCI values from samples exposed to different concentrations of In(III)-citrate being were very close to that of the control after 24-hour exposure (Figure 7B). A similar trend of noncytotoxicity of Ga(III)-citrate and In(III)-citrate was reported in previous studies using different human cell lines. 15,52 The results in this current study demonstrated that Ga(III)-citrate and In(III)-citrate were less cytotoxic to target cells compared to soluble As species.
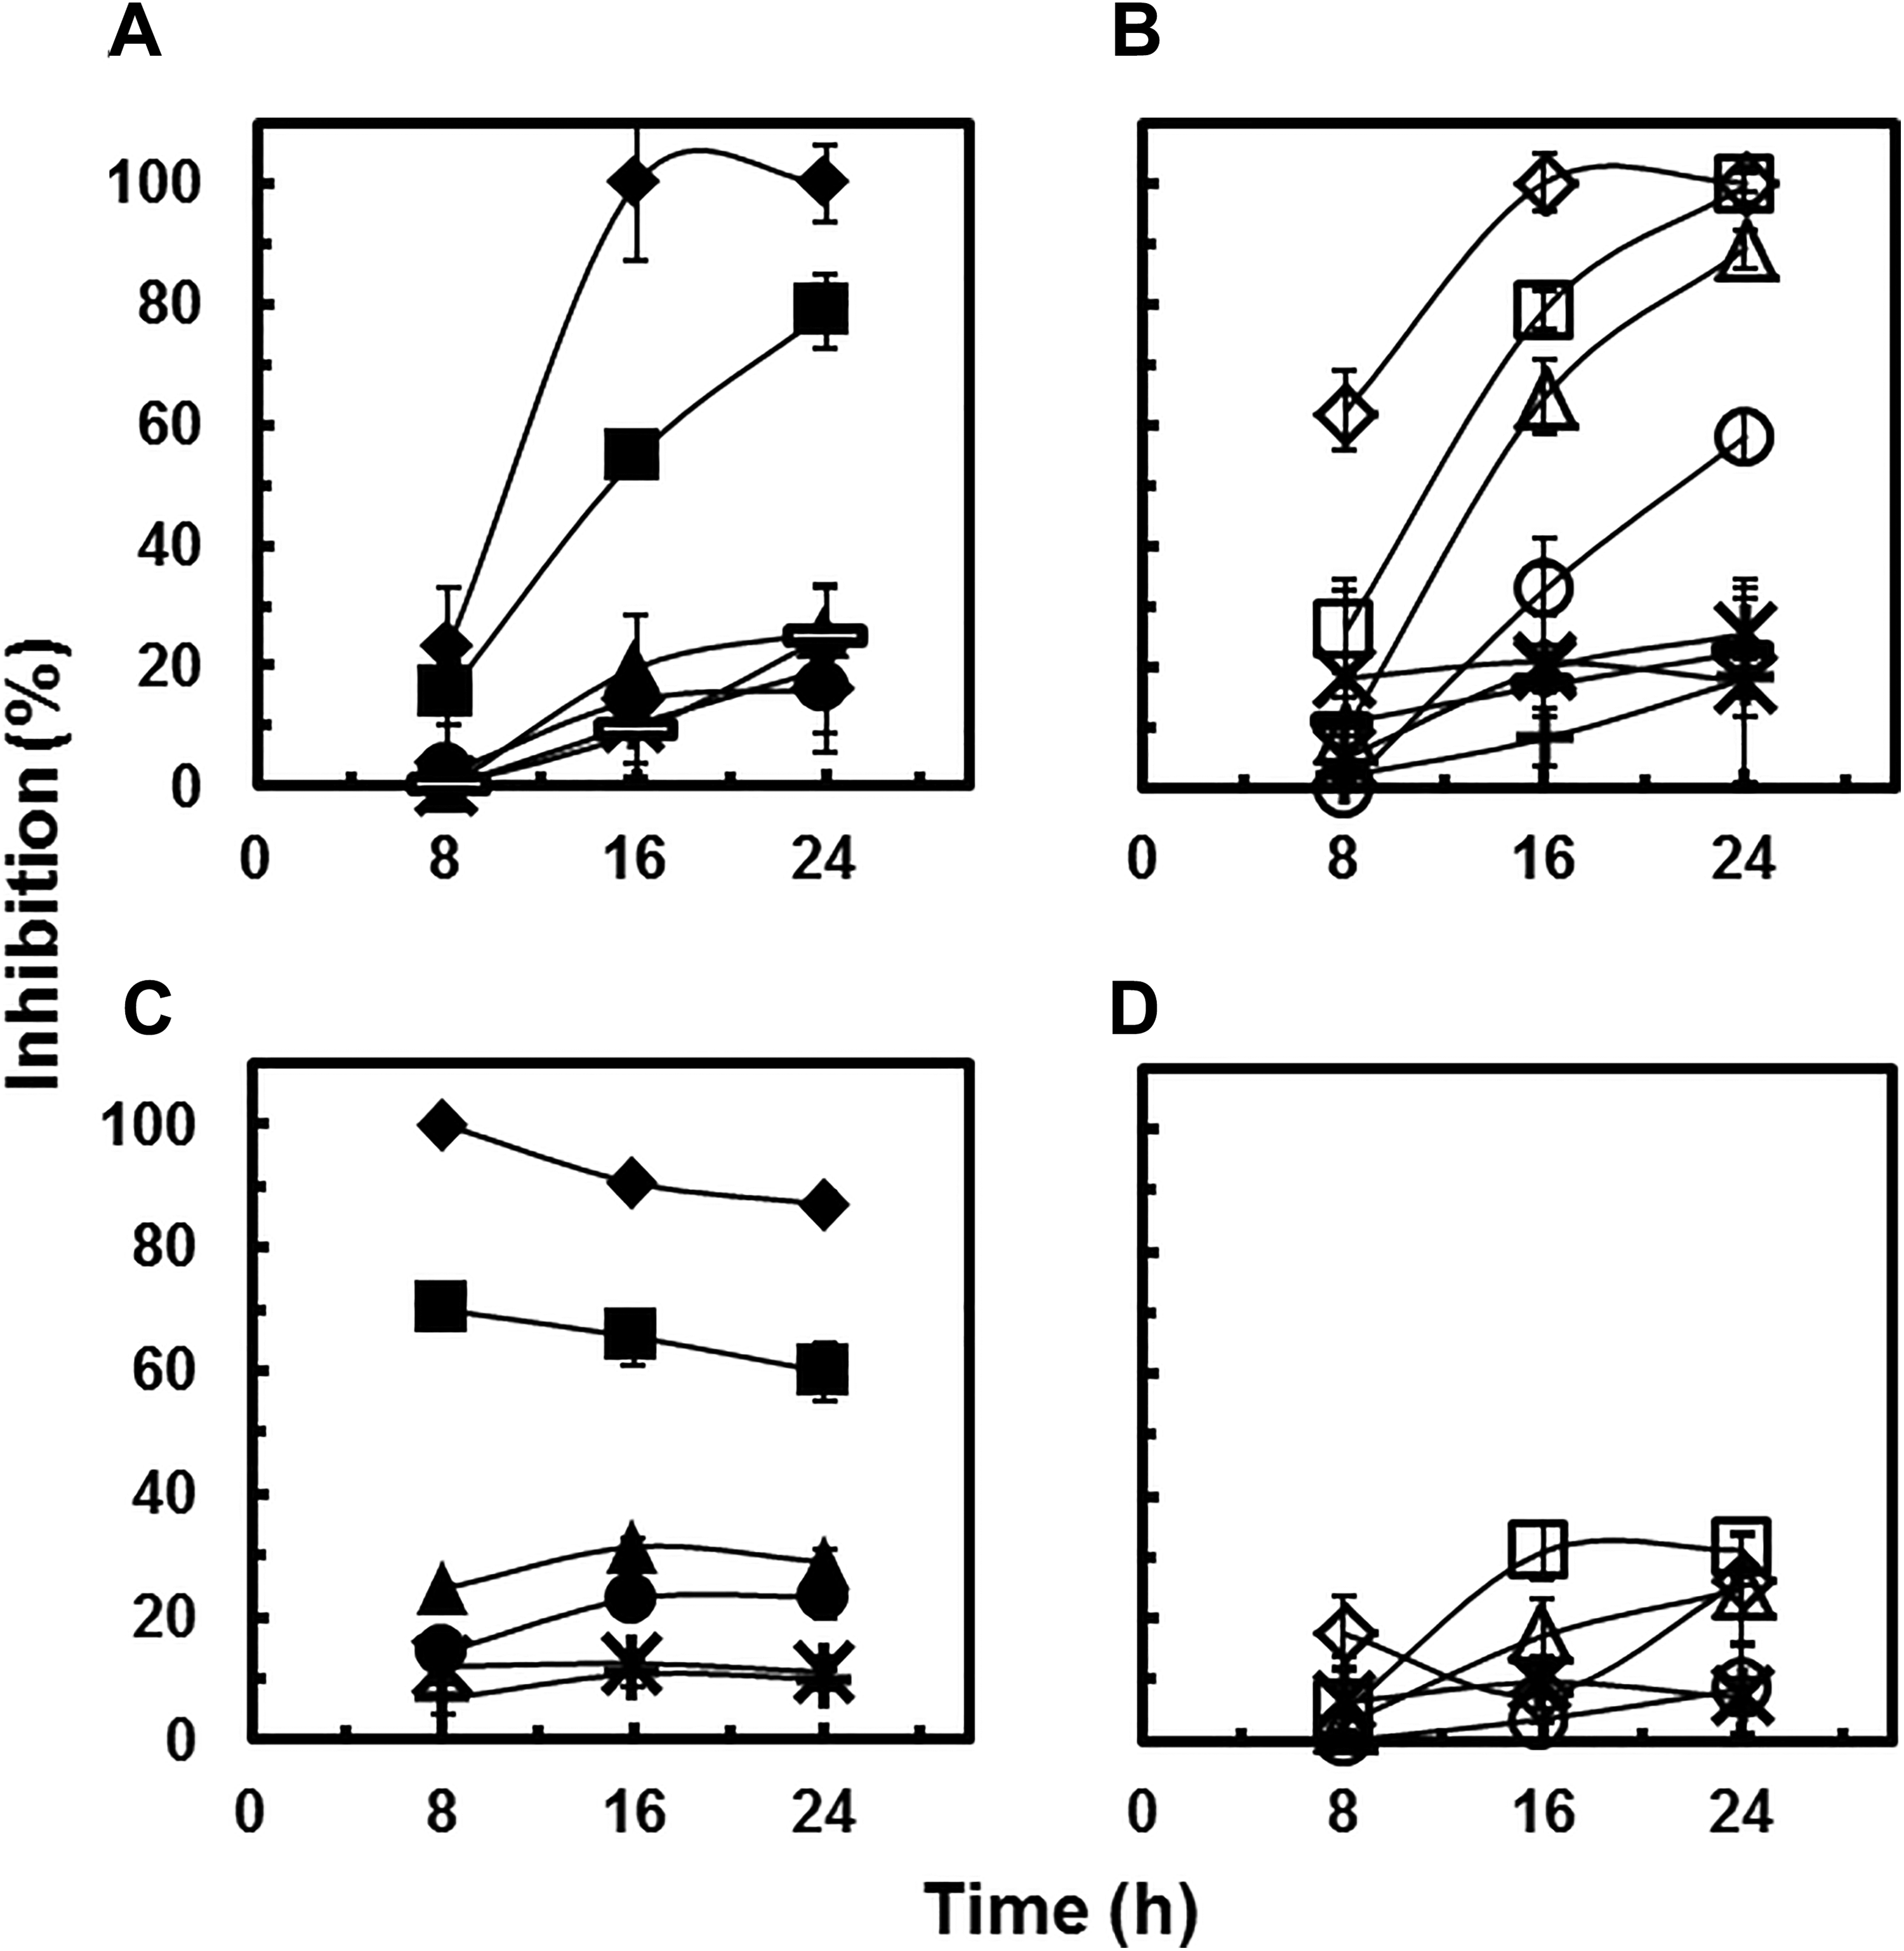
Inhibitory effects (%) of As(III) (A), As(V) (B), Ga(III)-citrate (C), and In(III)-citrate (D) on human bronchial epithelial cells at different concentrations (mg/L) as a function of time. Panel A: (▬) 0.03, (*) 0.1, (•) 0.3, (▴) 1.0, (▪) 3.0, and (♦) 5.0. Panel B: (×) 0.1, (+) 0.3, (▬) 0.6, (*) 1.0, (ˆ) 3.0, (▵) 6.0, (□) 10.0, and (◊) 30.0. Panel C: (+) 2.5, (*) 5.0, (•) 25.0, (▴) 50.0, (▪) 250.0, and (♦) 500.0. Panel D: (*) 1.0, (ˆ) 3.0, (▵) 10.0, (□) 30.0, and (◊) 100.0.
Nanoparticle Uptake by 16HBE14o- Cells
Due to their small size, NPs more likely enter mammalian cells and can potentially contribute to toxic effects compared to larger size particles with the same chemical composition. In this work, GaAs NPs were shown to be taken up by human bronchial epithelial cells which can contribute to the potential cytotoxic effects. The GaAs NPs were taken up and accumulated in Golgi body of the cells (Figure 9), which could affect its biological function and eventually affect the overall activity of human lung cells. Additionally, the potential release of As(III) from GaAs NPs could increase the inhibitory effects. The finding in this study agrees with one previous study in which GaAs NPs were taken up into endosomal compartments of the BEAS-2B cells. 15 The researchers of that previous study also reported that the GaAs NPs likely resided in lysosomes, and because of the low pH (4.5) inside lysosomes, they observed an increase in GaAs particle dissolution (compared to neutral pH). 15
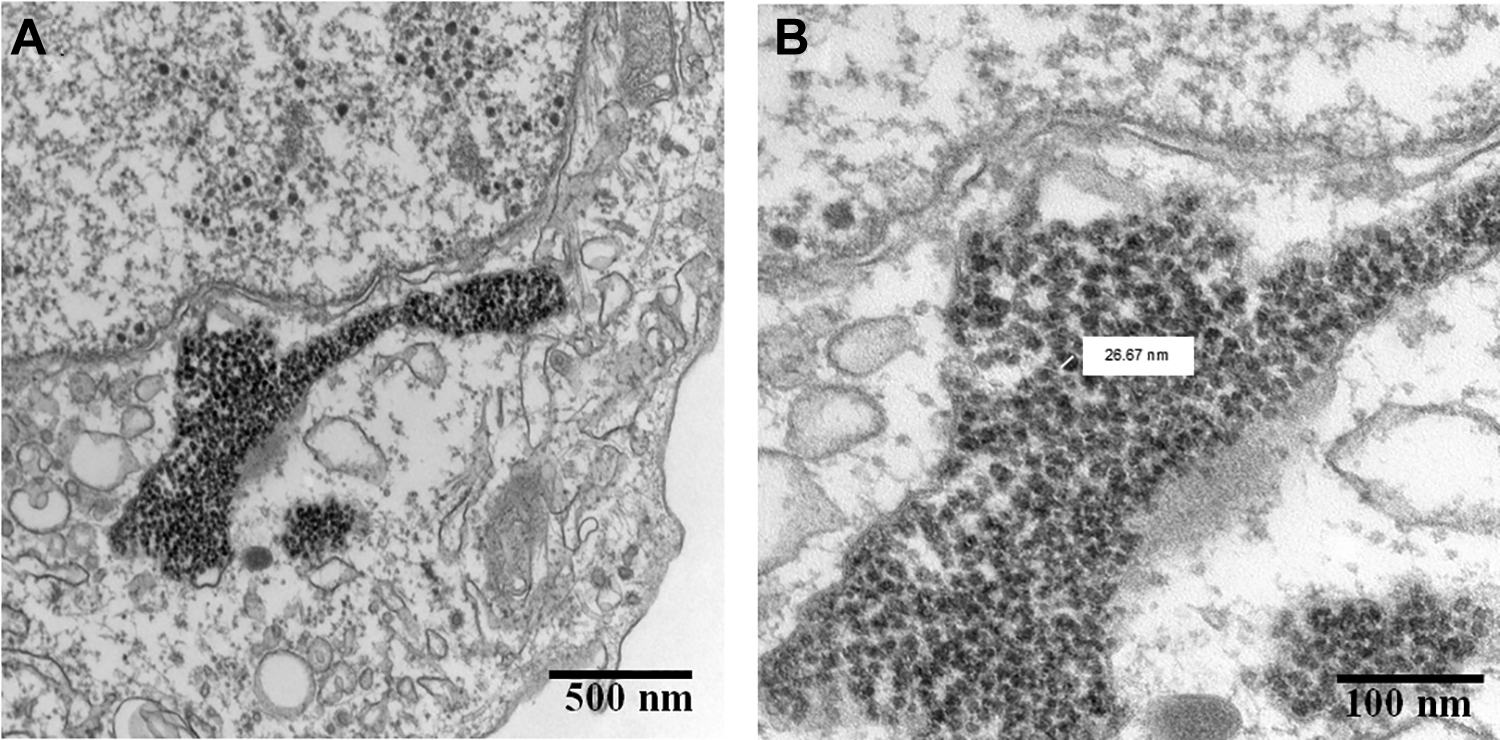
Transmission electron microscopy images of gallium arsenide (GaAs) nanoparticles (NPs) in 16HBE14o- human bronchial epithelial cells. Panel A shows that GaAs NPs were accumulated in the Golgi body of the cells. Panel B shows a close-up image of the GaAs particles (average diameter 25 nm) inside the Golgi body.
Potential Mechanisms of Species Cytotoxicity
Corrosion and speciation studies suggest that the species primarily responsible for the cytotoxicity of GaAs and InAs NPs is As(III). The literature provides several plausible mechanisms for As(III) toxicity. The toxic effect of As(III) has been attributed to oxidative stress due to the generation of reactive oxygen species (ROS). 53 Oxidative stress develops when ROS are formed and react with cellular constituents including thiols, sulfides, and lipids. 54 These oxidants deplete glutathione, and the redox status of the cell can be affected causing stressful toxic situation. 54 In addition, As(III) increases heat shock or stress proteins in cultured human cells. 55 In addition to As(III), As(V) is also released from GaAs and InAs NPs, which can add to the observed cytotoxicity.
According to previous studies, one of the main mechanisms of toxicity of As(V) relates to the chemical similarities of As(V) and phosphate. As(V) has the identical structure and acid dissociation constants as phosphate, so As(V) can substitute phosphate in many biochemical reactions. 56,57 When As(V) substitutes for phosphate, the methylation metabolism can convert As(V) into compounds with different properties from phosphate. 57 Additionally, As(V) reacts with adenosine diphosphate (ADP) to form a mixed arsenate–phosphate bond in molecules like adenosine triphosphate (ATP). 57 This bond can be hydrolyzed easily and the mixed arsenate–phosphate molecule can dissociate quickly without generating an ATP. 57,58 As(V) can also replace phosphate in the sodium pump and the anion exchange transport system of the human red blood cell. 59
In this study, Ga(III)-citrate was found to cause only low to moderate toxicity at low concentrations (16-hour IC50= 166 mg Ga/l). Previous studies have shown that Ga(III) can compete with Fe(III) in cellular systems. One recent study reported that the interference of Ga(III) on Fe homeostasis can cause disruption of ribonucleotide reductase and mitochondrial function as well as the regulation of transferrin receptor and ferritin. 60 Ga(III) shares certain properties with Fe(III), for instance, Ga(III) has an octahedral ionic radius of 0.620 Å and a tetrahedral ionic radius of 0.47 Å, while those of Fe(III) are 0.645 and 0.49 Å. 60 Because of these similar properties, Ga(III) can compete with Fe(III) for binding to several redox enzymes and eventually interfere with some essential biological reactions. 61
Conclusions
Both GaAs and InAs NPs caused noteworthy acute toxicity to 16HBE14o- human bronchial epithelial cells due to the release of inorganic arsenic species, As(III) and As(V), via corrosion and dissolution. On the other hand, Ga(III) and In(III) were only moderately toxic. Oxide NPs of Ga2O3 and In2O3 were not cytotoxic and were also not subject to dissolution. The results of this study indicate that the discharge of GaAs and InAs NPs can potentially be hazardous to humans if semiconductor manufacturing sector plans to introduce these materials.
Footnotes
Author Contributions
Chi H. Nguyen contributed to conception and design, contributed to acquisition, analysis, and interpretation, and drafted the manuscript. Chao Zeng contributed to conception and contributed to acquisition and analysis. Scott Boitano, Jim A. Field, and Reyes Sierra-Alvarez contributed to conception and design and contributed to acquisition, analysis, and interpretation. All authors critically revised the manuscript, gave final approval, and agree to be accountable for all aspects of work ensuring integrity and accuracy.
Declaration of Conflicting Interests
The author(s) declared no potential conflicts of interest with respect to the research, authorship, and/or publication of this article.
Funding
The author(s) disclosed receipt of the following financial support for the research, authorship, and/or publication of this article: This work was supported by the Semiconductor Research Corporation (SRC) Engineering Research Center for Environmental Benign Semiconductor Manufacturing [Award 425.052] and by the National Science Foundation (NSF-CBET/GOALI) [Award 1507446].