
Abstract
Hexavalent chromium [Cr(VI)] is a common industrial pollutant, and exposure may cause toxic effects in multiple organ systems and carcinogenesis, including lung cancer. However, the toxic effect of Cr(VI) on the respiratory system is poorly understood. In the present study, it was demonstrated that Cr(VI) exposure significantly decreased the viability of human bronchial epithelial cells (16-HBE) in a dose-dependent manner. Flow cytometry demonstrated that Cr(VI) enhanced the transition of 16-HBE cells from G1 to S phase and arrested S-phase progression. Reverse transcription-quantitative polymerase chain reaction analysis revealed a significant alteration in the expression of apoptosis-associated genes in Cr(VI)-treated 16-HBE cells. In addition, using two-dimensional fluorescence differential gel electrophoresis with mass spectrometry, 15 differentially expressed proteins (1 upregulated and 14 downregulated) were identified in 16-HBE cells with Cr(VI) treatment compared with controls. Functional classification revealed that these differentially expressed proteins were involved in apoptosis, cytoskeletal structure, and energy metabolism. In conclusion, these data suggested that Cr(VI) caused toxic effects in bronchial epithelial cells and the mechanisms may involve the abnormal expression of apoptosis-associated proteins, cytoskeletal proteins, and energy metabolism-associated proteins.
Introduction
Chromium, an important pollutant, is widely used in industries including metallurgy, leather tanning, paper manufacturing, and other chemical processes.1–3 Epidemiological studies have demonstrated a strong association between occupational hexavalent chromium [Cr(VI)] exposure and respiratory cancer.4–6 Inhalation of Cr(VI) markedly increases the risk of lung cancer. 7 However, the molecular mechanism underlying Cr (VI)-induced lung injury has not been fully elucidated.
Chromium has multiple valence states in nature, including trivalent chromium [Cr(III)] and hexavalent chromium [Cr(VI)], which have different physical and chemical characteristics. 8 Cr(III) is necessary for human health and has an important effect on carbohydrate, lipid, and protein metabolism,9,10 whereas Cr(VI) may result in respiratory toxicity, hepatotoxicity, and reproductive and renal toxicity.11–13 Previous studies have demonstrated that Cr(VI) may cause DNA damage and interfere with the apoptotic process in A549 cells and human bronchial epithelial (16-HBE) cells.14,15 Notably, although Cr(VI) does not interact with DNA, its reduced forms may cause DNA damage. 16 In addition, Cr(VI)-induced activation of nuclear factor-κB (NF-κB) was additionally reported in 16-HBE cells and Jurkat cells.17,18 The nuclear transcription factor NF-κB has a vital role in promoting carcinogenesis and cancer progression by regulating the expression of multiple genes, including cell cycle, apoptosis, and inflammatory response genes. 19 Furthermore, Cr(VI) has been reported to induce the generation of reactive oxygen species, a process involved in carcinogenesis. 20
Previous studies demonstrated that epigenetic alterations, including DNA methylation and histone modification, may be involved in the regulation of Cr(VI)-induced lung cancer.21–23 Kondo et al. 23 demonstrated that chromate-induced lung cancer exhibited an increasing trend in methylation of the p16 gene promoter region. p16 serves a key role in repressing cell cycle progression and is additionally an inhibitor of cyclin dependent kinase 4, which phosphorylates the serine/threonine residues of the retinoblastoma protein.24,25 Previous studies additionally demonstrated that chromium exposure significantly increased the levels of H3K9 dimethyl and H3K4 trimethyl in A549 cells, suggesting that histone modification may be involved in regulating the carcinogenic process.26,27 These data demonstrated that epigenetic alterations may have a non-negligible effect in Cr-induced lung cancer.
In the present study, the toxic effects of Cr(VI) on 16-HBE cells were investigated. Furthermore, using two-dimensional fluorescence difference gel electrophoresis (2D-DIGE) coupled with matrix-assisted laser desorption/ionization time of flight mass spectrometry (MALDI-TOF-MS/MS), the effects of Cr(VI) on the proteome of 16-HBE cells were determined, to identify potential key molecules that may be involved in Cr(VI)-induced lung damage.
Materials and Methods
Chemicals and Reagents
Potassium chromate (K2CrO4) was purchased from Sigma-Aldrich; Merck KGaA (Darmstadt, Germany). Minimum essential medium (MEM), heat-inactivated fetal bovine serum (FBS), antibiotics (streptomycin and penicillin), and trypsin-EDTA solution were all purchased from Gibco (Thermo Fisher Scientific, Inc., Waltham, MA, USA).
Cell Culture and Treatment
The human bronchial epithelial cell line 16-HBE was a gift from Prof. D.C. Gruenert of the University of California-San Francisco (CA, USA). Cells were cultured in MEM supplemented with 10% (v/v) heat-inactivated FBS and antibiotics (penicillin 100 U/ml and streptomycin 100 μg/mL) at 37°C in a humidified incubator with 5% CO2. The cells were treated with different concentrations of Cr(VI) (according to cell viability assay) for 24 h, and 0.1% sterile deionized water was used as the control.
Cell Viability Assay
The Cell Counting Kit-8 (CCK-8) assay (Dojindo Molecular Technologies, Inc., Kumamoto, Japan) was performed to assess cell viability.28–30 16-HBE cells at a density of 1 × 10⁵ cell/mL were seeded in a 96-well plate and treated with 0, 1.5625, 3.125, 6.25, 12.5, 25, and 50 μM Cr(VI) for 24 h when the cell confluence reached 70–80%. The CCK-8 reagent (10 μL) was added to each well, and the cells were incubated for 2 h at 37°C. The absorbance was measured at 450 nm using a microplate reader (BioTek Instruments, Inc., Winooski, VT, USA).
Cell Cycle Analysis
Flow cytometry was performed to analyze the alterations in the cell cycle in 16-HBE cells. The cells were first synchronized with serum-free medium for 12 h. 31 After treatment with Cr(VI), the cells were fixed with cold (4°C) 70% ethanol overnight and washed with PBS buffer. The cells were resuspended in the same buffer containing 200 μg/mL RNase A (Qiagen, Inc., Valencia, CA, USA) and incubated for 30 min at 37°C in the dark, followed by incubation with the nuclear stain propidium iodide (Sigma-Aldrich; Merck KGaA) at a final concentration of 40 μg/mL for 15 min at room temperature. The samples were processed using a FACScalibur flow cytometer (BD Biosciences, Franklin Lakes, NJ, USA). The data were analyzed using FlowJo software v7.6.1 (FlowJo LLC, Ashland, OR, USA).
Apoptosis Analysis
Cell apoptosis analysis was performed using annexin V/propidium iodide staining. After treatment with Cr(VI), the cells were washed with PBS buffer, transferred to a centrifuge tube, and adjusted to a density of 3-5 ×10⁵ cells/tube. Annexin V-EGFP (5 μL) was first added and incubated for 15 min at room temperature in the dark. Then 5 μL propidium iodide was added and incubated for another 15 min at room temperature in the dark. The cells were analyzed using a FACScalibur flow cytometer (BD Biosciences, Franklin Lakes, NJ, USA). The data were analyzed using FlowJo software v7.6.1 (FlowJo LLC, Ashland, OR, USA).
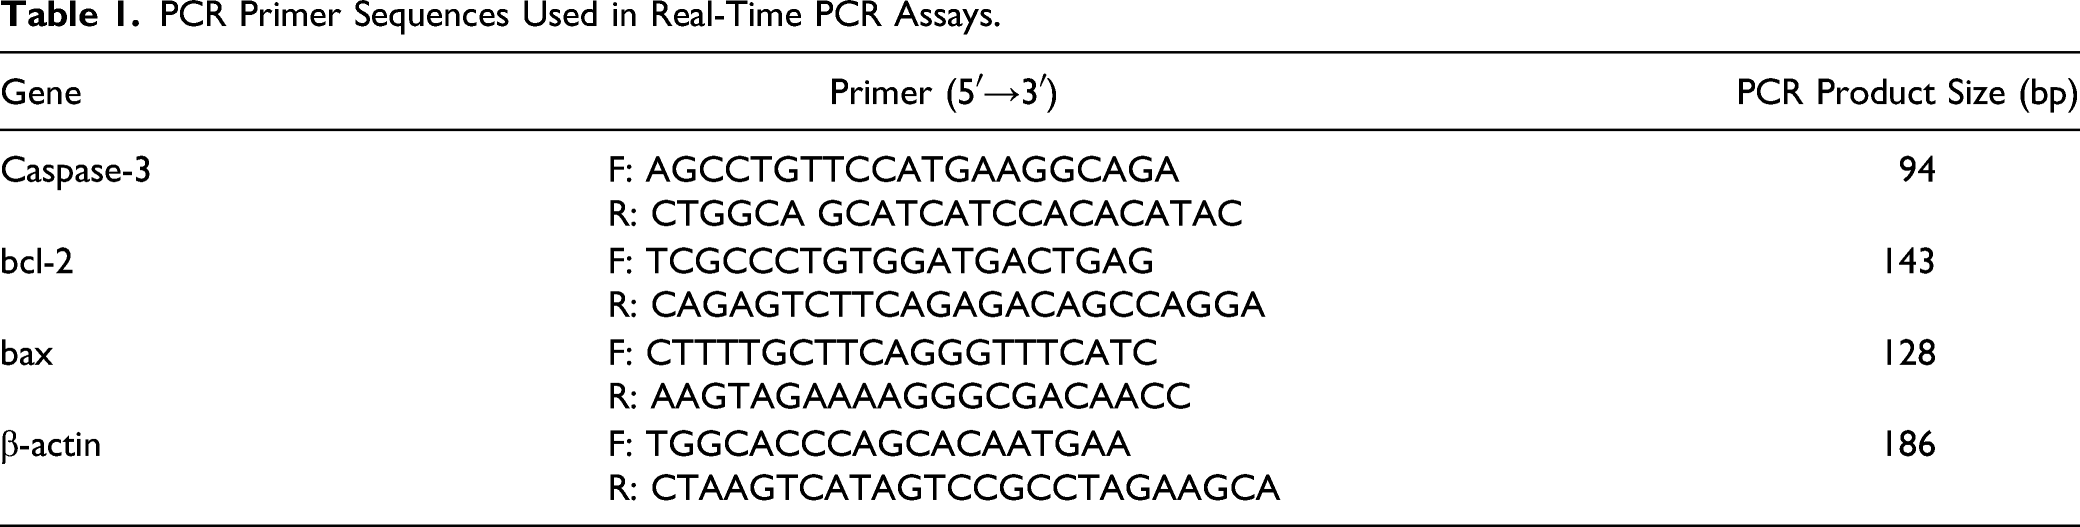
Reverse Transcription Quantitative Polymerase Chain Reaction (RT-qPCR)
PCR Primer Sequences Used in Real-Time PCR Assays.
Protein Extraction, Quantification, and Labeling
Following treatment, the cells were collected in 1.5 mL microtubes (0.25% trypsin-EDTA), washed 3 times with PBS, and subsequently lysed on ice using a lysis buffer (30 mM Tris-HCl, 2 M thiourea, 7 M urea, and 4% CHAPS) for 15 min. The samples were sonicated at 15% output of 650 W energy for 4 min (14 seconds × 10 times) on ice and centrifuged at 14 000g for 20 min at 4°C. The samples were stored at −80°C for further analysis. Quantification of the proteins was performed as described in the 2-D Quant kit protocol (GE Healthcare, Chicago, IL, USA). The biological replicates were labeled and reverse labeled by Cy3 and Cy5 fluorescent dyes from the CyDye DIGE Fluor Labeling kit (GE Healthcare), respectively. A total of 50 μg of all individual samples were pooled as the internal standard and labeled with Cy2 dye. Each sample (internal standard included) was labeled with 400 pmol/l working solution on ice and protected from light for 30 min. The labeling reaction was terminated by adding 1 μL lysine (10 mM) to the protein mixture.
2D Electrophoresis and Imaging
The labeled samples were mixed and focused on 24 cm, 3-11 NL immobilized pH gradient (IPG) strips (GE Healthcare) using an IPGphor focusing apparatus (GE Healthcare). Isoelectric focusing (IEF) steps were as follows: 30 V for 12 h; 300 V for 1 h; 1000 V for 1 h; 3000 V for 1 h; gradient 8000 V for 4 h; and 8000 V for 5 h. Following IEF the IPG strips were equilibrated in equilibration buffer (6 M urea, 75 mM Tris-HCl, 30% glycerol, 2% SDS), 1% dithiothreitol (Sigma-Aldrich; Merck KGaA) and 2.5% indole-3-acetic acid (Sigma-Aldrich; Merck KGaA) for 15 min at 4°C, respectively. The strips were placed on the top of 12.5% Tris-glycine-SDS gels and the power was set at 1 W for each gel for 50 min, and 11 W for each gel for ∼4.5 h, respectively. The gels were scanned using a Typhoon TRIO Imager (GE Healthcare) at excitation/emission wavelengths of 488/520, 532/580, and 633/670 nm for Cy2, Cy3, and Cy5, respectively. The unlabeled pooled samples (1 mg) were also run under the same conditions and stained with Coomassie at room temperature for 4 h for protein identification.
Quantitative Analysis
Relative quantitation of the proteins was performed using DeCyder (version 6.5; GE Healthcare). The internal standard (cyanine 2 dye) was used to normalize the samples in different groups. A total of 2500 spots were analyzed across the samples. Differential in-gel analysis and biological variance analysis were performed sequentially according to the normalized spot volumes/protein abundance. The Student’s t-test and one-way analysis of variance were used to determine the statistical differences in the differentially expressed protein spots.
In Gel Digestion
The protein spots were cut using 1 mL tips from Coomassie-stained gels and washed 3 times with Milli-Q water (EMD Millipore, Billerica, MA, USA). The spots were de-stained using destaining solution (25 mM ammonium bicarbonate/50% acetonitrile) and incubated at 37°C for 30 min. The de-stained gels were washed again with Milli-Q water and 50% acetonitrile. The gels were dehydrated using 100% acetonitrile. Subsequently, 0.01 mg/mL trypsin (in 25 mM ammonium bicarbonate) was added to each gel and absorbed at 4°C for 15 min. Ammonium bicarbonate (10-15 μL; 25 mM) was added to each gel and incubated at 37°C overnight. The samples were centrifuged at 14 000g for 20 min at 4°C, and the supernatant was isolated for further analysis.
Protein Identification
All mass spectra were acquired on an AutoFlex MALDI-TOF-MS/MS with LIFT technology (Bruker Corporation, Ettlingen, Germany). Peptide samples were prepared on an anchor chip steel target plate, and the matrix (0.4 mg/mL α-cyano-4-hydroxycinnamic acid in 30% acetonitrile/0.06% trifluoroacetic acid) was mixed with each sample in the target plate. The peptide calibration standard (Starter kit; Bruker Daltonics; Bruker Corporation) was prepared in the plate, according to the manufacturer’s protocol. MS data were acquired with a 355 nm nitrogen laser at a power rate of 20-50%. MS/MS data were acquired based on the signal/noise ratio (threshold was set to 15). FlexAnalysis v3.5 (Bruker Daltonics; Bruker Corporation) was used to produce peak lists and transferred to BioTools software V3.0 (Bruker Daltonics; Bruker Corporation) for MS/MS Mascot searches (release no. 2.3.1). Search parameters were set as follows: Taxonomy, Homo sapiens; enzyme, trypsin; missed cleavage, 1; fixed modification, carbamidomethyl (C); variable modification, oxidation (M); peptide tolerance, ±100 ppm; mass tolerance, ±0.3 Da; ions, [M+H]. Only significant hits, as defined by the Mascot probability analysis (P < 0.05), were accepted. Protein scores >35 were considered statistically significant (P < 0.05). The database searched was SwissProt (29).
Statistical Analysis
Statistical analysis was conducted using Student’s t-test and one-way analysis of variance with Bonferroni’s correction as the post hoc test. The data are expressed as the mean ± standard error of the mean. All experiments were repeated at least 3 times independently. The DIGE experimental data were processed using Decyder v6.5, and the other data were processed with MedCalc® v11.2.4.0 (MedCalc Software, Ostend, Belgium). P < 0.05 was considered to indicate a statistically significant difference.
Results
Effect of Cr(VI) Exposure on the Viability of 16-HBE Cells
The viability of 16-HBE cells was measured following exposure to Cr(VI). The results demonstrated that cell viability was significantly inhibited by Cr(VI) exposure (P < 0.01; Figure 1). In particular, Cr(VI) treatment suppressed 16-HBE cell viability in a dose-dependent manner within the concentration range set. These data suggested that Cr(VI) exposure exerted a toxic effect on 16-HBE cells. This is in line with our previous study
33
indicating that Cr(VI) causes DNA damage in cells, which induces cell cycle arrest and in turn inhibition of cell growth. Effects of Cr(VI) exposure on the viability of 16-HBE cells. The Cell Counting Kit-8 assay was used to detect the viability of 16-HBE cells following treatment with various concentrations of Cr(VI). Cell viability = (mean absorbance of experimental group/mean absorbance of control group) × 100. The data are expressed as the mean ± standard error of the mean. **P < 0.01 and ****P < 0.0001 vs C. The data are from at least three independent experiments. C, control.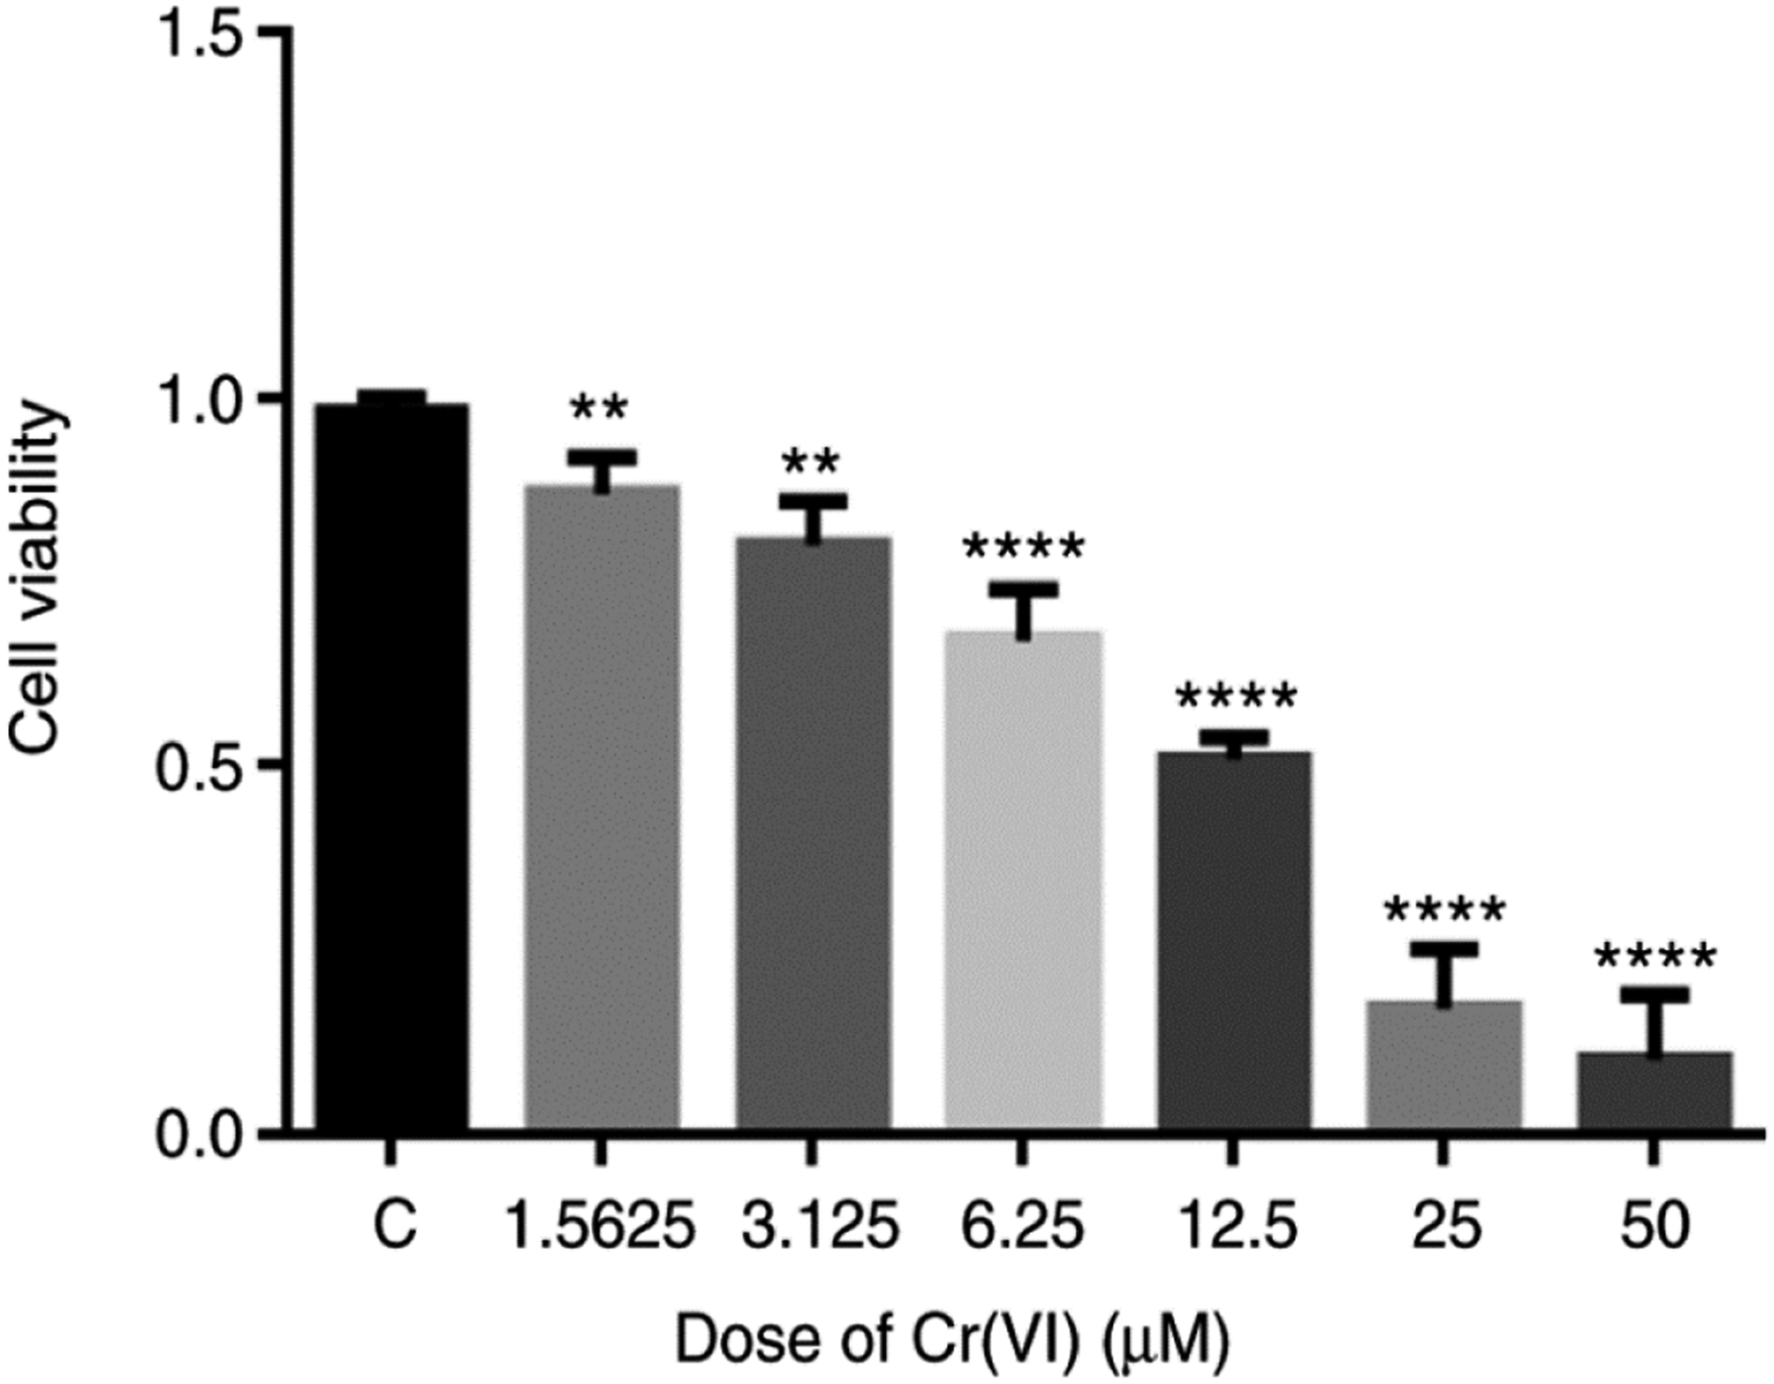
Effect of Cr(VI) Exposure on the Cell Cycle of 16-HBE Cells
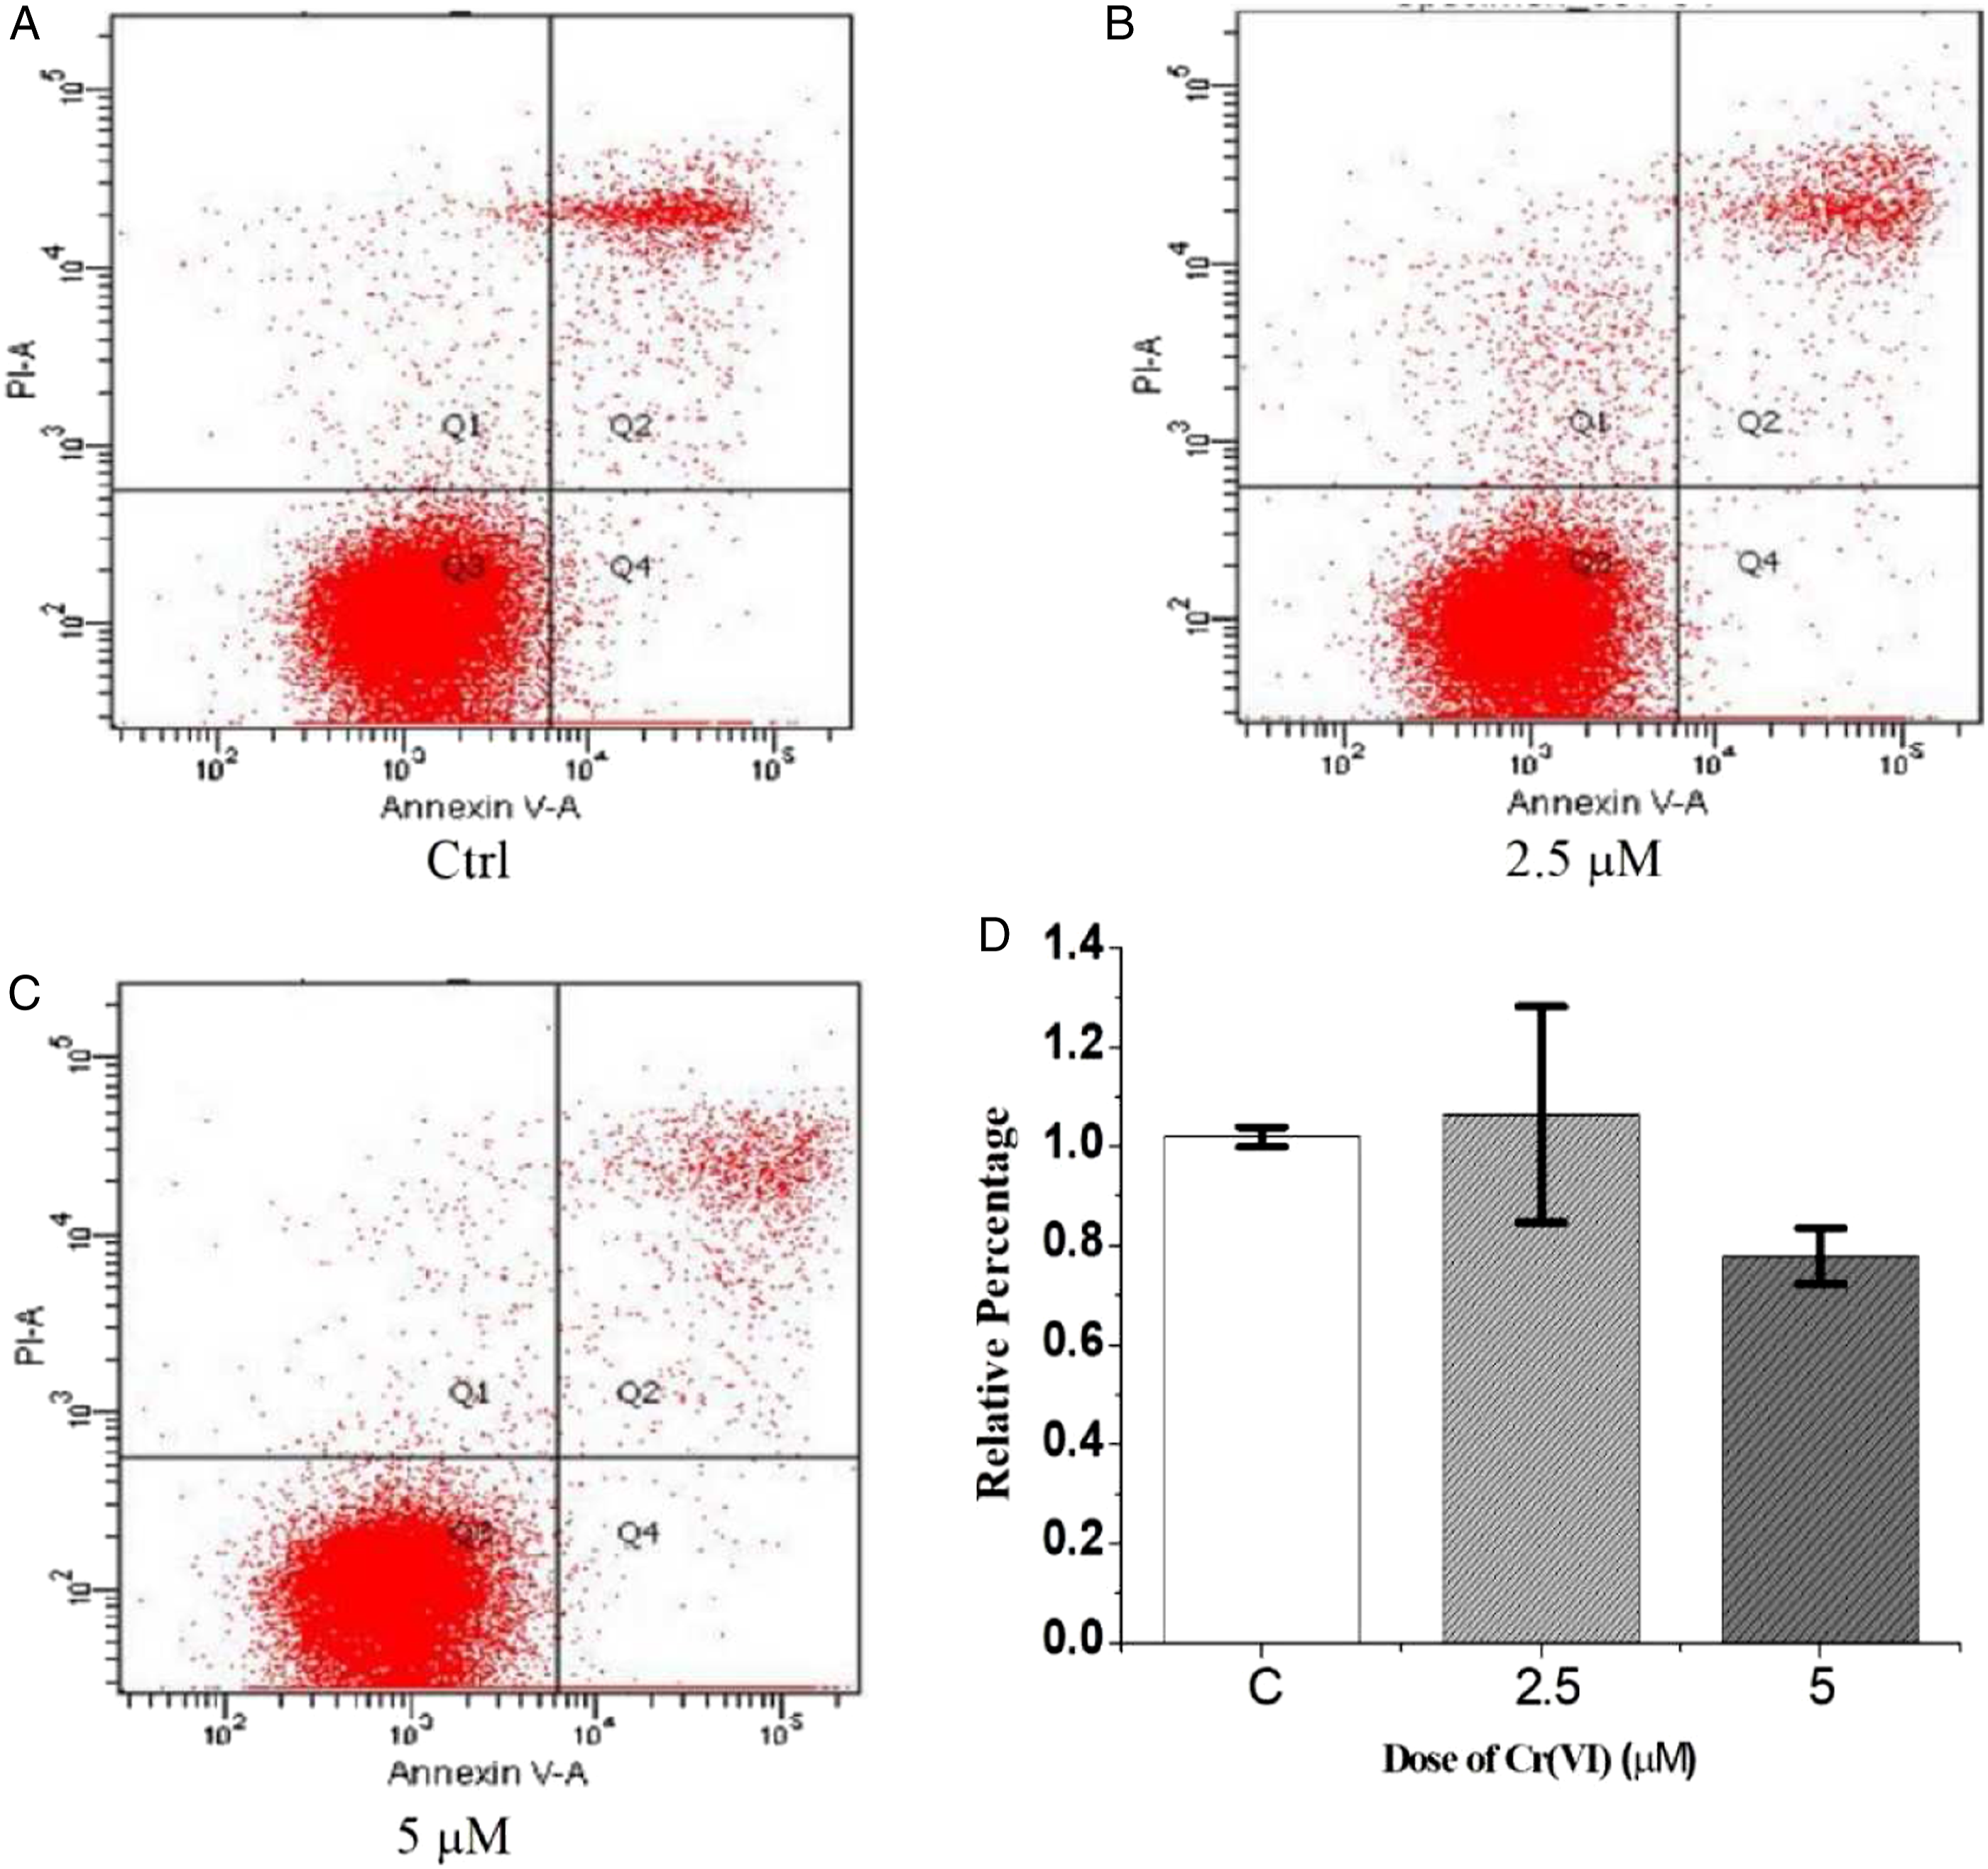
To determine the effects of Cr(VI) on the cell cycle of 16-HBE cells, flow cytometry was used to examine the alterations in the cell cycle in 16-HBE cells treated with various concentrations of Cr(VI). A concentration of 5.0 μM was selected as the highest concentration in the present study as it is less than one-half on the lethal concentration 50 (LC50), and 2.5 μM was selected as a minimally toxic dose. Cr(VI) exposure significantly increased the percentage of cells in the S phase and decreased the percentage of cells in the G1 and G2 phases (P < 0.05; Figure 2). These data suggested that Cr(VI) promoted the transition of 16-HBE cells from G1 to S phase and arrested the transition between the S and the G2 phase, leading to S-phase accumulation. Effects of Cr(VI) exposure on the cell cycle in 16-HBE cells. (A) The flow cytometry results of the control group. (B) The flow cytometry results of 2.5 μM Cr(VI)-treated 16-HBE cells. (C) The flow cytometry results of 5.0 μM Cr(VI)-treated 16-HBE cells. (D) Statistical analysis. The data are expressed as the mean ± standard error of the mean. *P < 0.05, vs control. The data are from at least three independent experiments.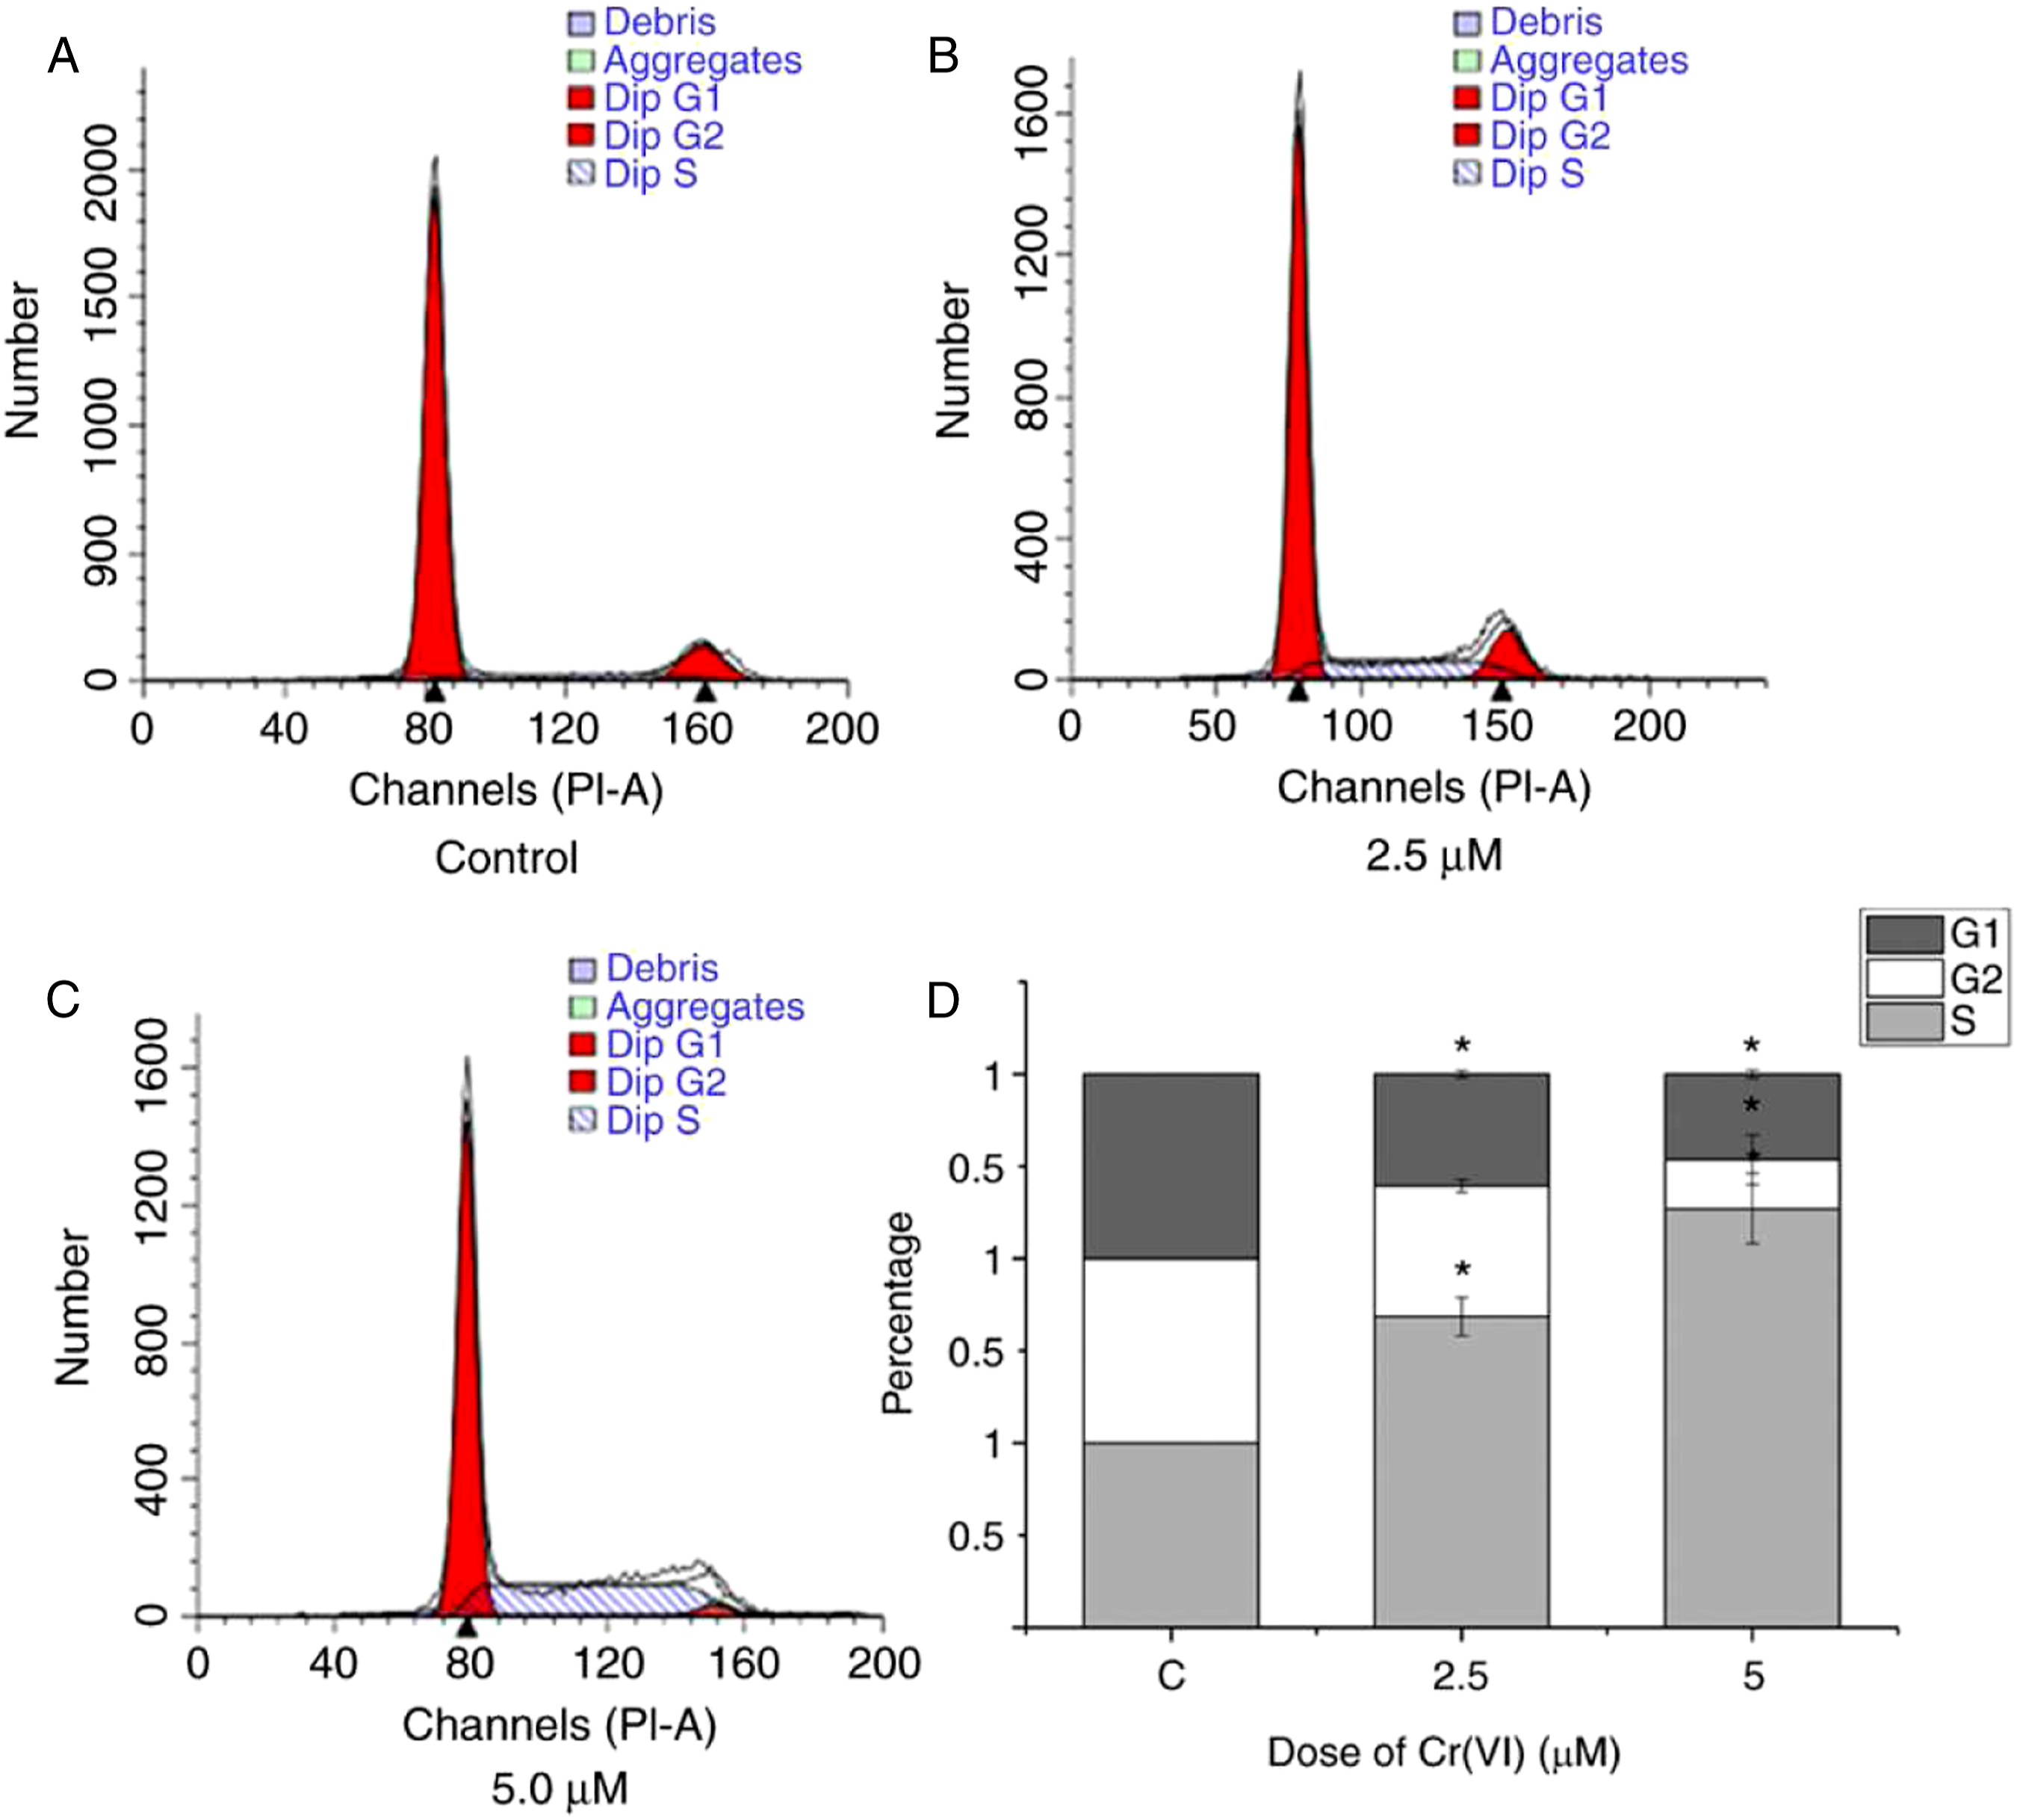
Effect of Cr(VI) Exposure on the Apoptosis of 16-HBE Cells
To determine the effect of Cr(VI) on apoptosis-associated genes in 16-HBE cells, qPCR was performed to determine the mRNA expression levels of caspase-3, bcl-2, and bax in these cells. Treatment with Cr(VI) significantly upregulated the expression of caspase-3 (Figure 3). Specifically, the mRNA expression level of caspase-3 was significantly increased in 16-HBE cells treated with 2.5 and 5.0 μM Cr(VI) compared with the control group (P < 0.01). The 5.0 μM Cr(VI) dose significantly decreased bcl-2 gene expression (P < 0.0001). The bax mRNA expression level was not significantly altered in the 3 groups. However, apoptosis assays showed that no significant change was found in Cr(VI)-treated cells compared to the control group (Figure 4). These data suggested that although a typical caspase apoptosis cascade is activated, Cr(VI) inhibited apoptosis in some way. This may contribute to the carcinogenicity of Cr(VI). Effects of Cr(VI) exposure on the expression of apoptosis-associated genes in 16-HBE cells. The relative mRNA expression levels of apoptosis-associated genes (caspase-3, bcl-2, and bax) were assessed in the control group, 2.5 μM Cr(VI)-treated 16-HBE cells, and 5.0 μM Cr(VI)-treated 16-HBE cells. The data are expressed as the mean ± standard error of the mean. **P < 0.01, ***P < 0.001, and ****P < 0.0001 vs control. The data are from at least three independent experiments. Bcl-2, apoptosis regulator Bcl-2; bax, apoptosis regulator BAX. Effects of Cr(VI) exposure on the apoptosis of 16-HBE cells. (A) The flow cytometry results of the control group. (B) The flow cytometry results of 2.5 μM Cr(VI)-treated 16-HBE cells. (C) The flow cytometry results of 5.0 μM Cr(VI)-treated 16-HBE cells. (D) Statistical analysis. The data are expressed as the mean ± standard error of the mean. *P < 0.05, vs control. The data are from at least three independent experiments.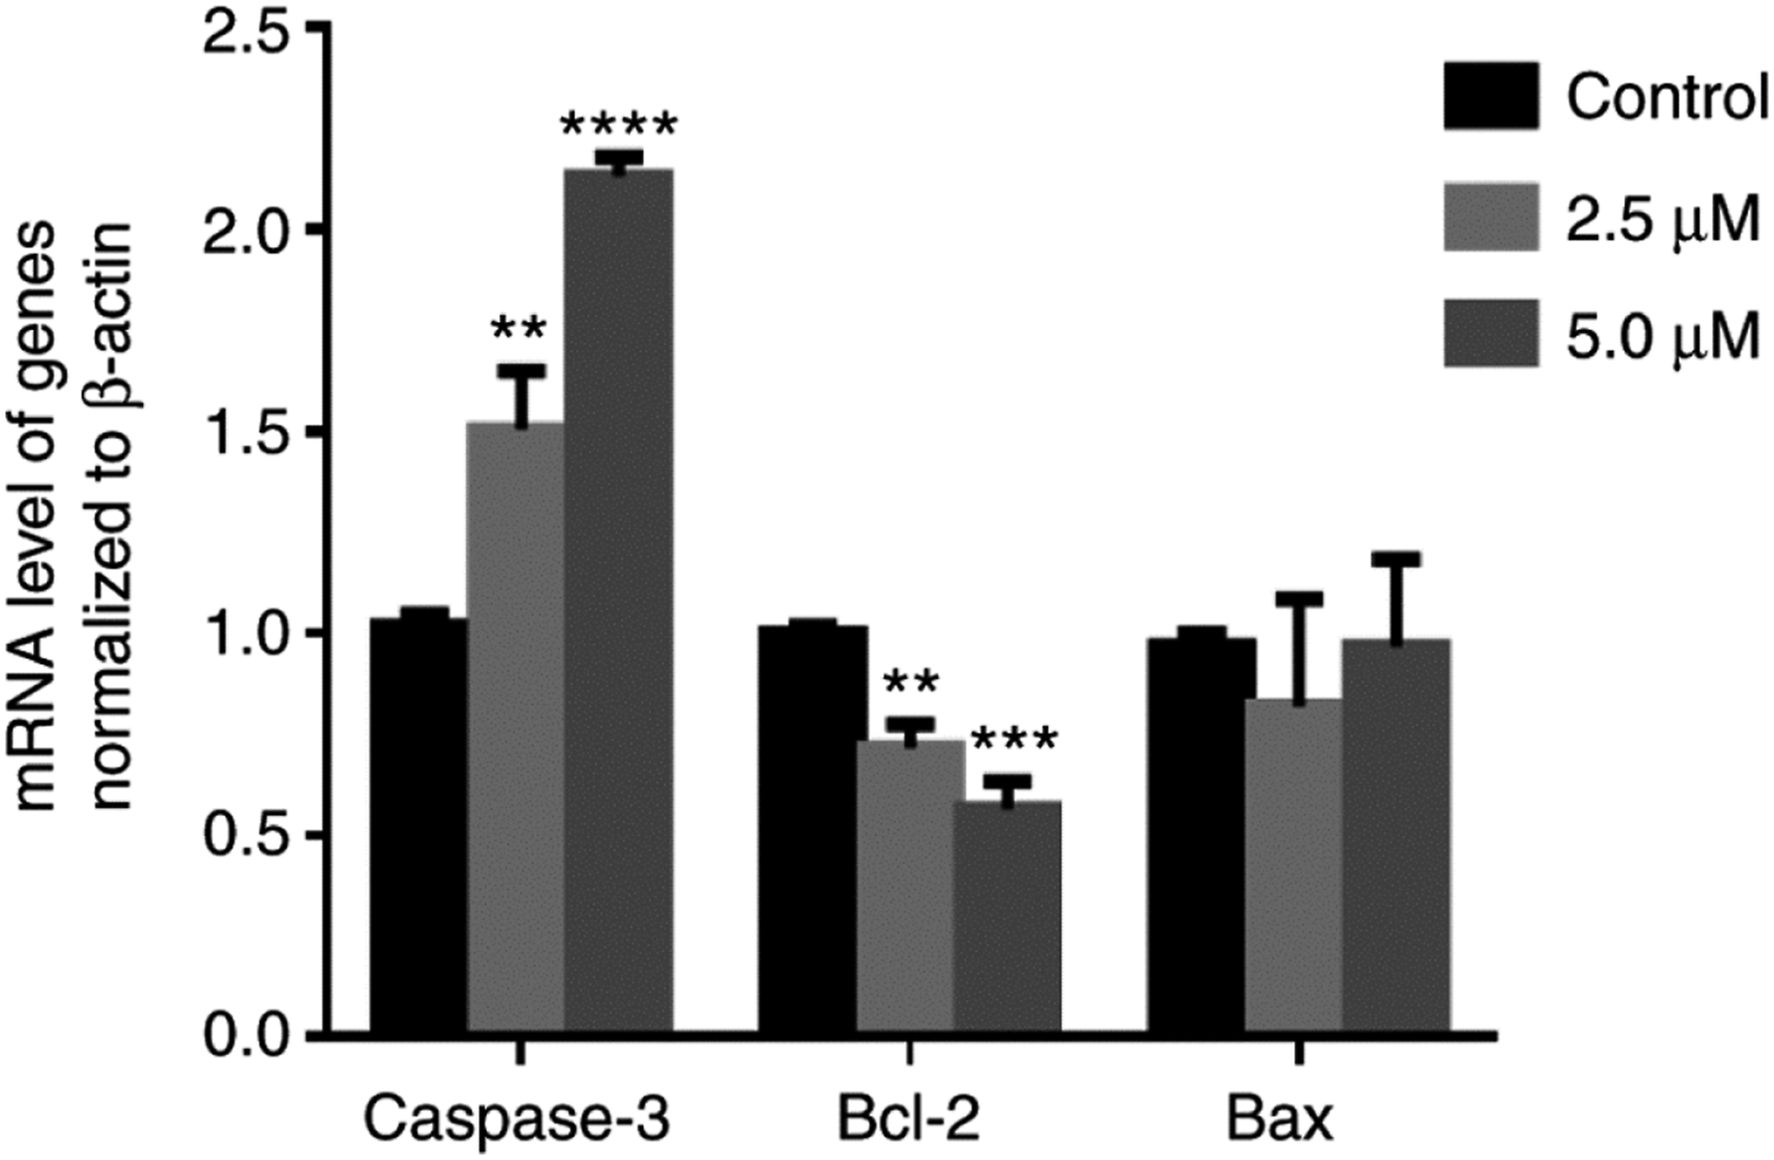
Analysis of Cellular Proteins in Untreated and Cr(VI)-Treated 16-HBE Cells
To determine the effects of Cr(VI) on the protein expression of 16-HBE cells, comparative proteomic analysis was performed on 16-HBE cells treated with or without 5.0 μM Cr(VI). The spots that had a fold change ≥1.1 and P ≤ 0.05 were considered to be differentially expressed protein spots. A total of 15 protein spots were identified and annotated (Figure 5) using their protein IDs, which were manually assigned, according to their P value (Table 2); serpin B5 was assigned protein ID 1 as it has the lowest P value. The Mascot scores and theoretical molecular weights of these proteins, which were searched in the SwissProt database,
34
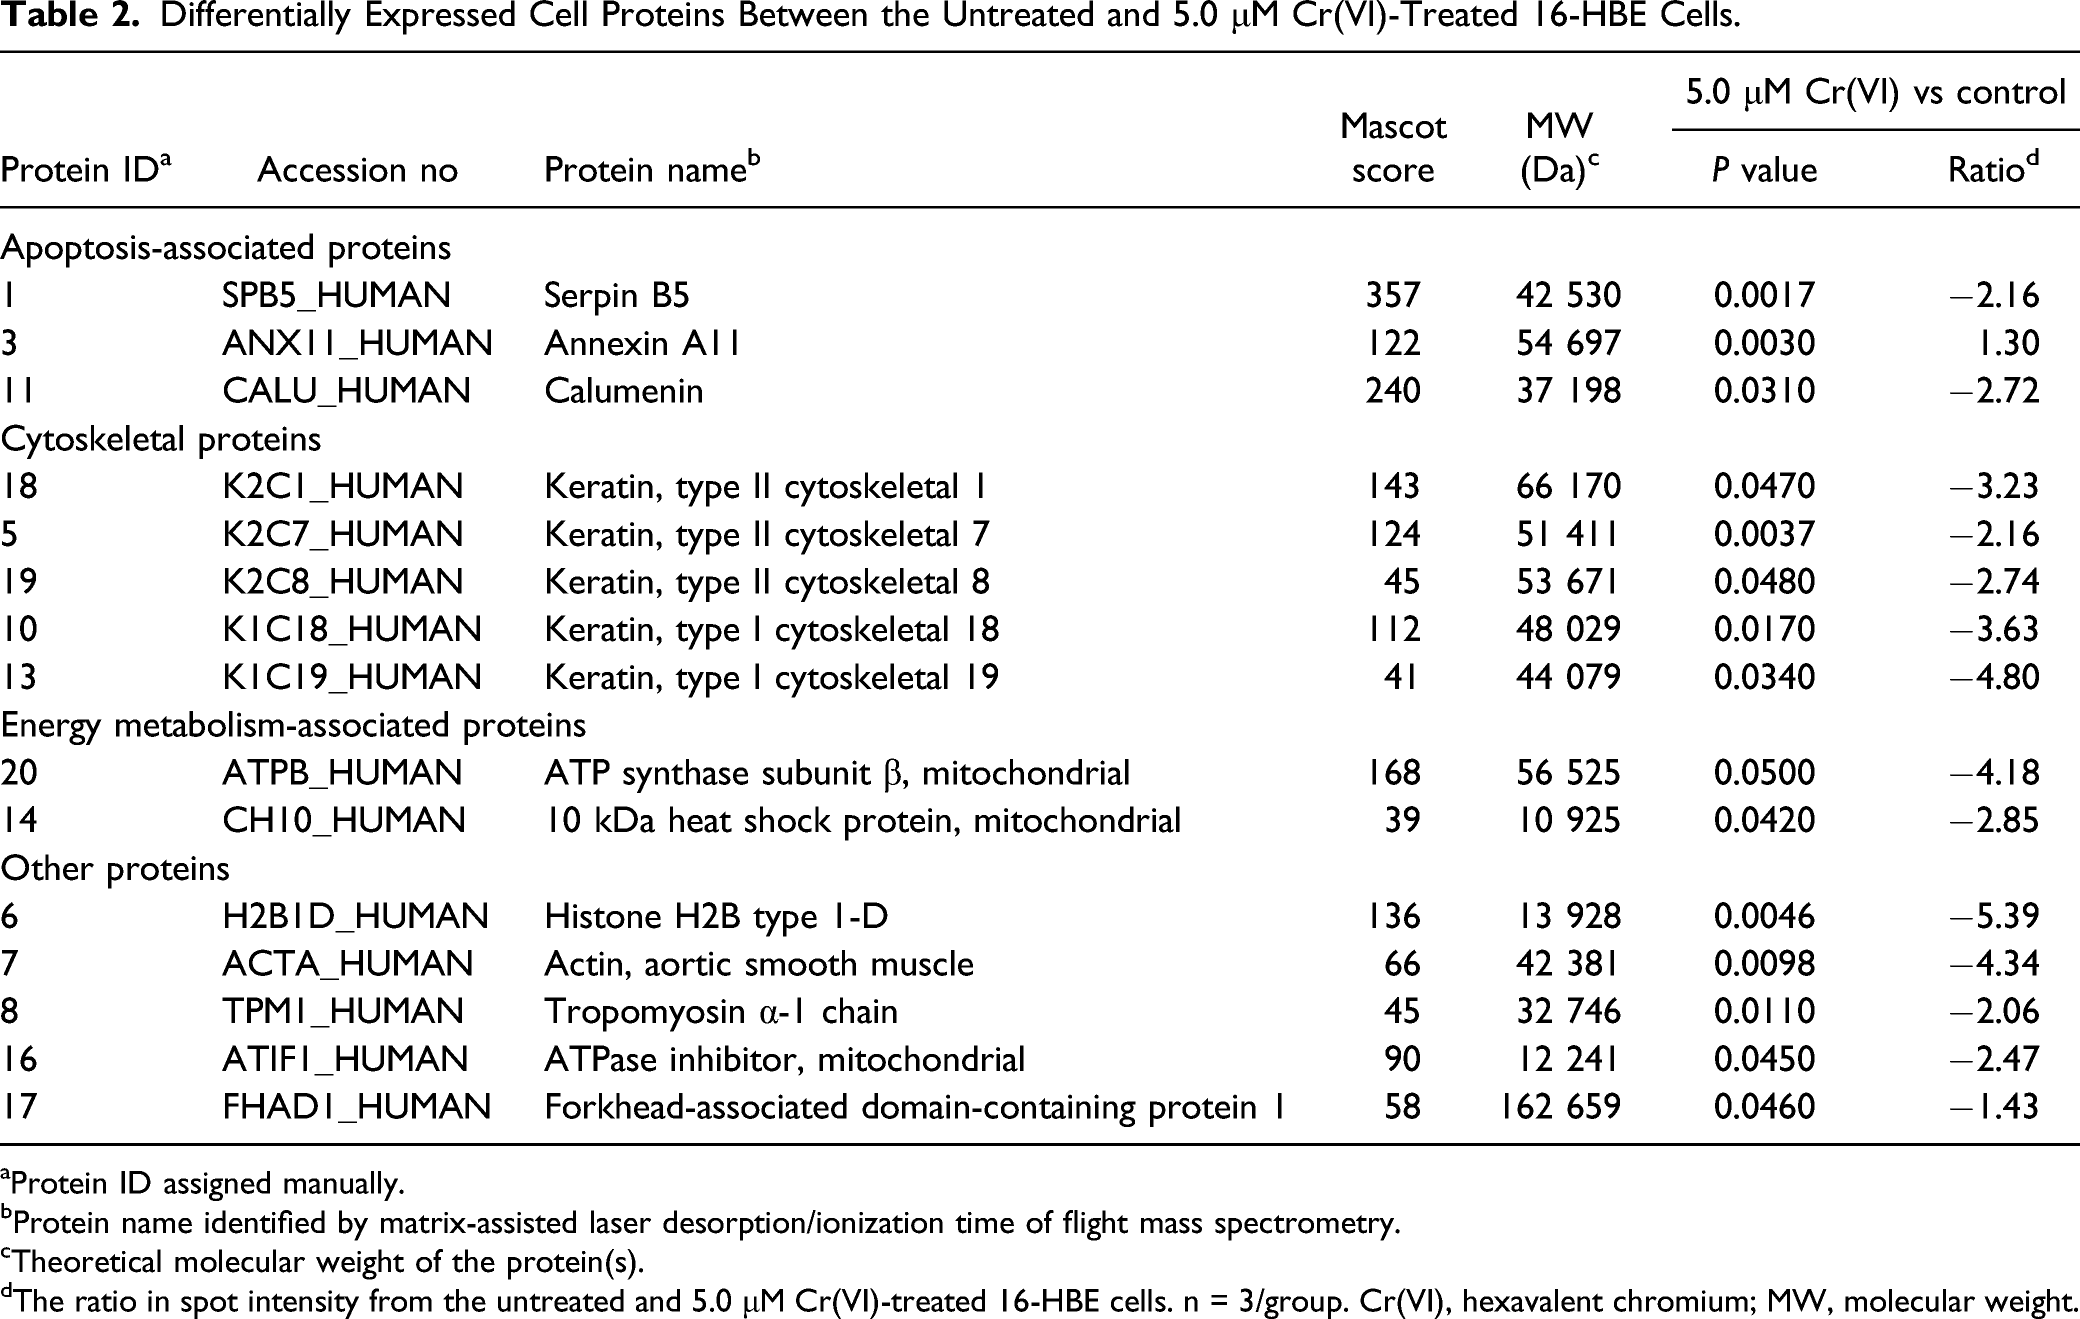
are presented in Table 2. The fold-change ratio and P values obtained using the Decyder software are presented in Table 2. A representative 2D-DIGE gel image of differentially expressed proteins in untreated and 5.0 μM Cr(VI)-treated 16-HBE cells. Comparative proteomic analysis was performed on 16-HBE cells treated with or without 5.0 μM Cr(VI). Cellular proteins from these two groups were labeled with Cy3 or Cy5 dye, respectively (n=3 in each group). An internal standard protein sample (a mixture of all cell samples) was labeled with Cy2 dye. The Cy dye-labeled samples were combined, and the proteins were co-separated in the first dimension via isoelectric focusing in 24 cm pH 3-11 nonlinear immobilized pH gradient strips, followed by separation in the second dimension via SDS-PAGE. Spots of interest were manually excised, digested, and subjected to identification by MALDI-TOF-MS/MS. A greyscale 2D-DIGE gel image presenting 17 differentially expressed protein spots identified by MALDI-TOF-MS/MS (black numbers with white square) in the 5.0 μM Cr(VI)-treated 16-HBE cell sample compared with the control group is presented. 2D-DIGE, two-dimensional fluorescence difference gel electrophoresis; MALDI-TOF-MS/MS, matrix-assisted laser desorption ionization-time of flight-mass spectrometry. Differentially Expressed Cell Proteins Between the Untreated and 5.0 μM Cr(VI)-Treated 16-HBE Cells. aProtein ID assigned manually. bProtein name identified by matrix-assisted laser desorption/ionization time of flight mass spectrometry. cTheoretical molecular weight of the protein(s). dThe ratio in spot intensity from the untreated and 5.0 μM Cr(VI)-treated 16-HBE cells. n = 3/group. Cr(VI), hexavalent chromium; MW, molecular weight.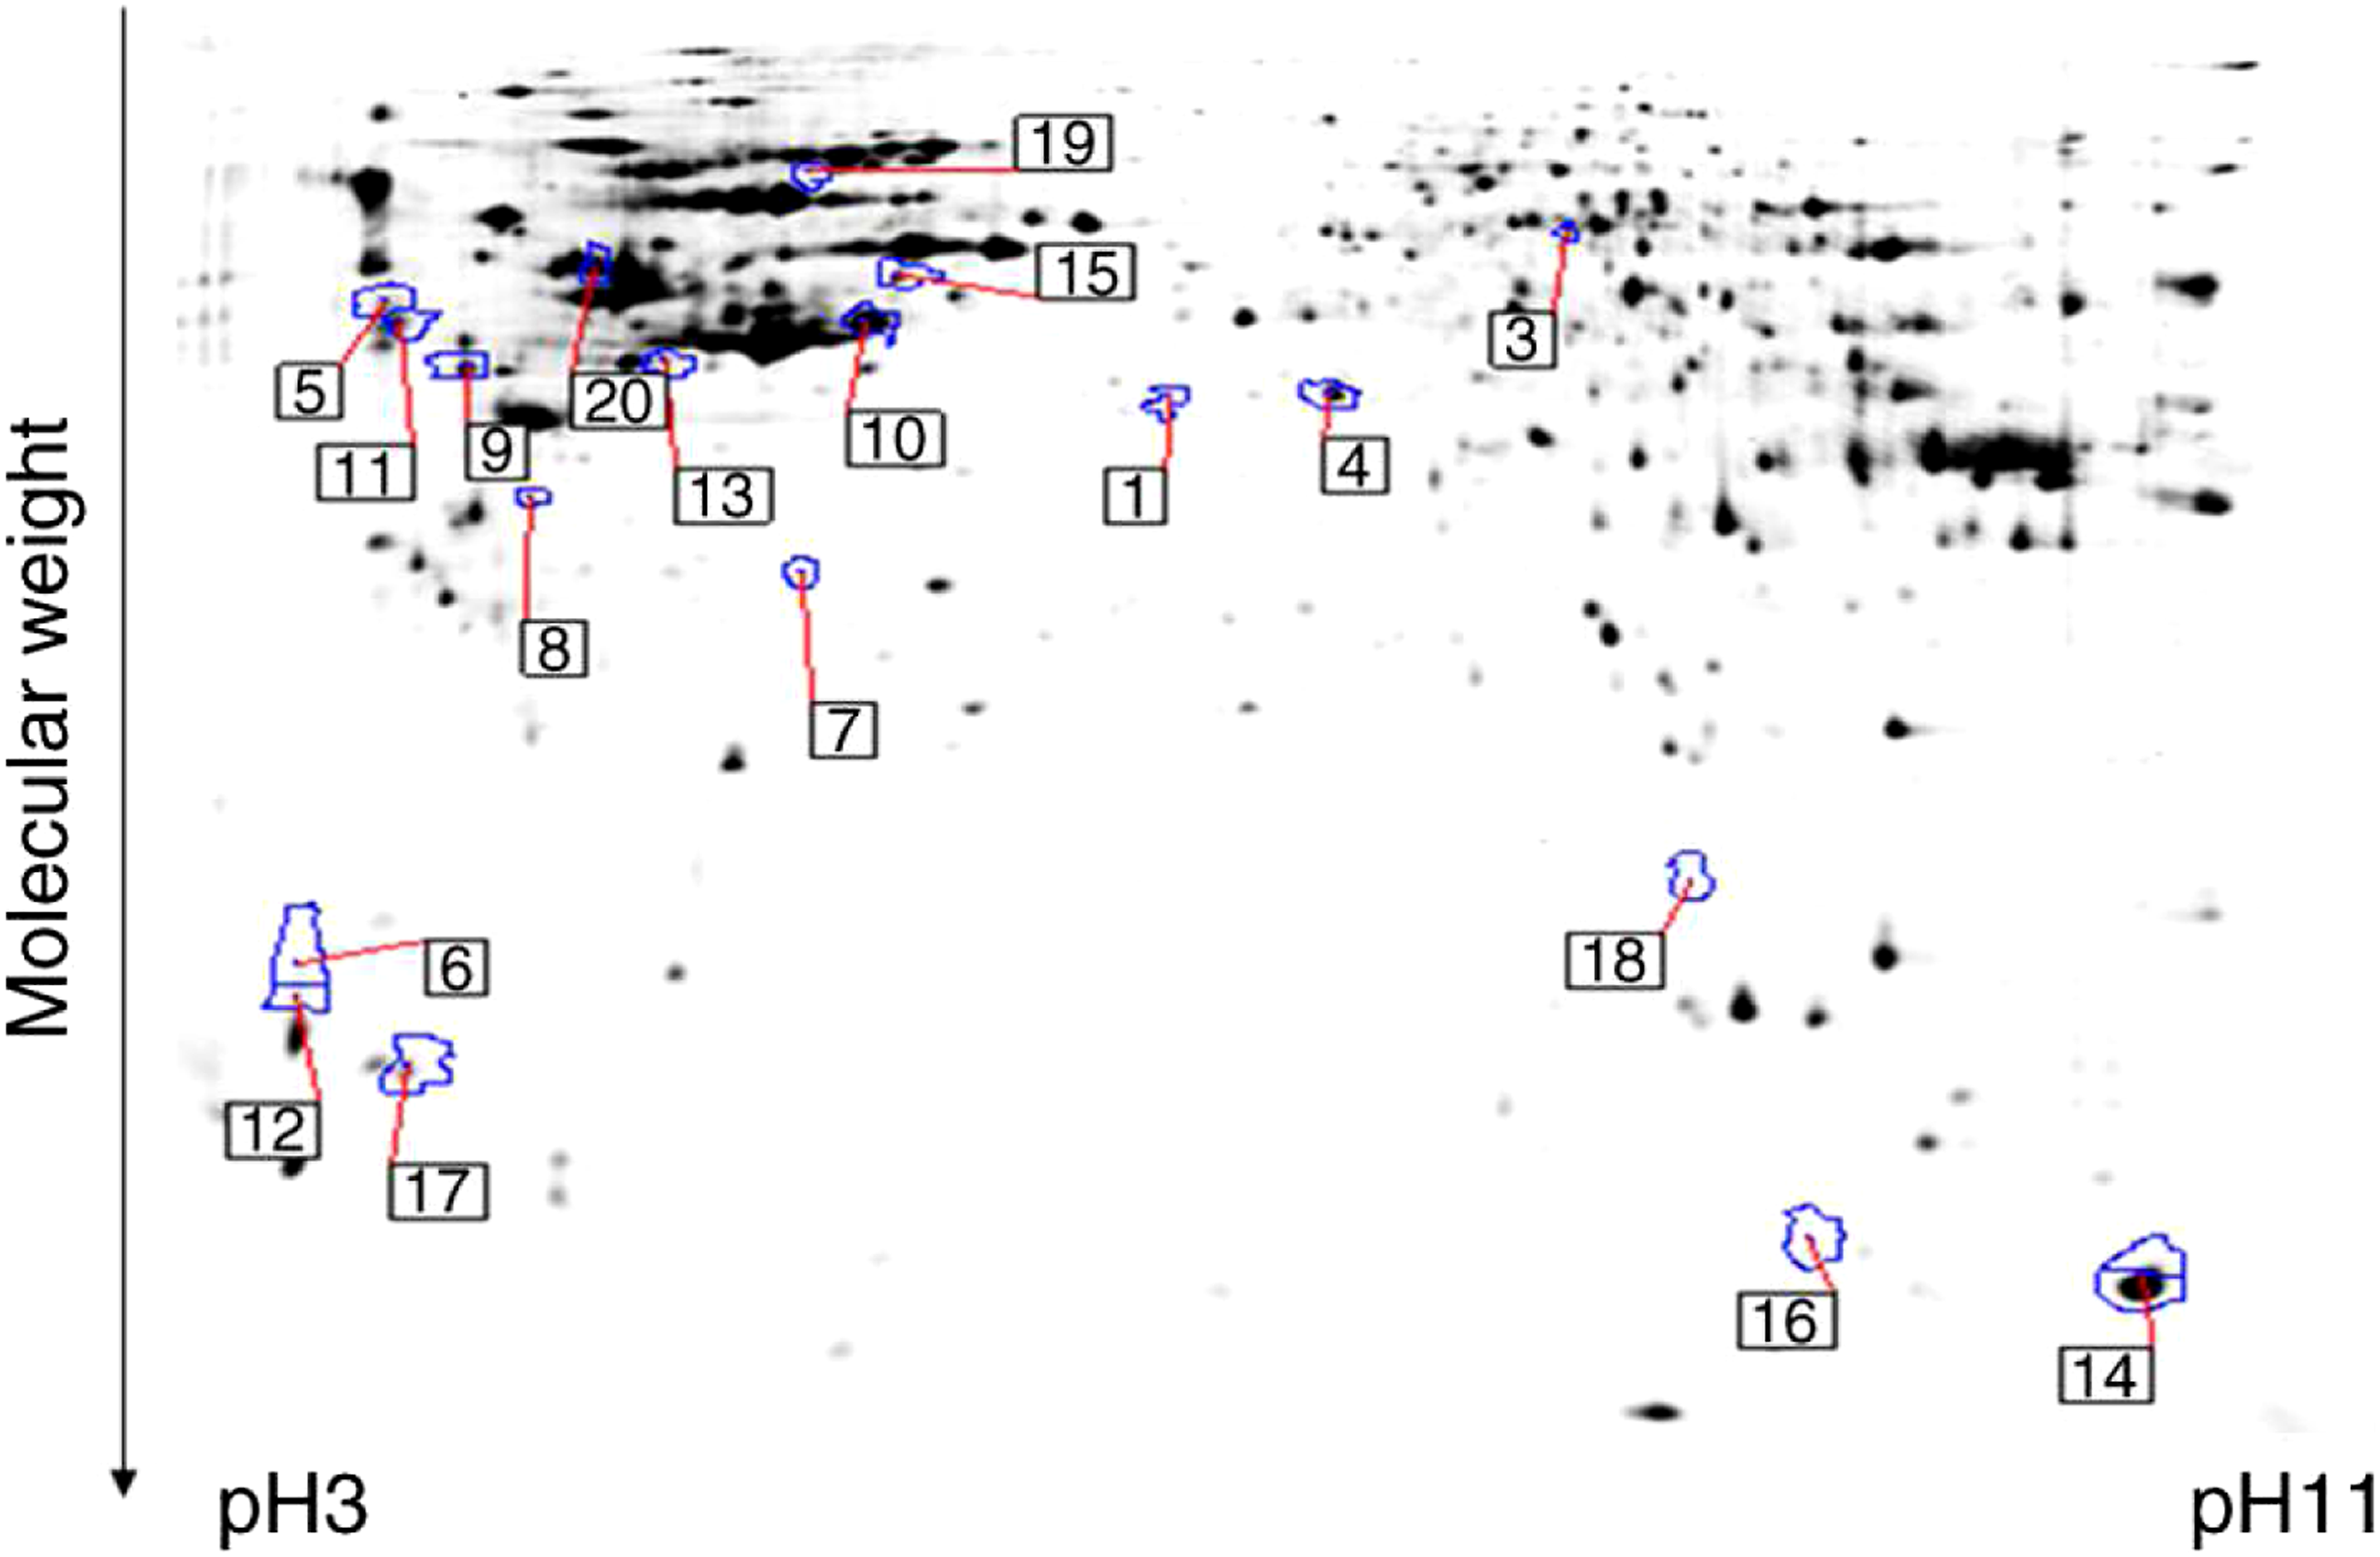
Identification of Differentially Expressed Proteins in Untreated and Cr(VI)-Treated 16-HBE Cells
A total of 15 proteins were identified in Cr(VI)-treated 16-HBE cells compared with the control group (Table 2). Of these differentially expressed proteins, 1 protein spot was upregulated in Cr(VI)-treated 16-HBE cells (Annexin A11) and 14 protein spots were downregulated. According to the functional classification of differentially expressed proteins, these proteins were classified into the following 3 categories: apoptosis-associated proteins, cytoskeletal proteins, and energy metabolism-associated proteins.
Discussion
In the present study, the potential toxicity of Cr(VI) exposure in 16-HBE cells was evaluated. It was demonstrated that Cr(VI) significantly decreased cell viability in a dose-dependent manner. Cr(VI) accelerated the transition of 16-HBE cells from the G1 to the S phase, upregulated the mRNA expression of caspase-3, and downregulated the mRNA expression of bcl-2. The proteomic analysis revealed 15 differentially expressed proteins (1 upregulated and 14 downregulated) in 16-HBE cells following treatment with Cr(VI). The 15 proteins identified using MALDI-TOF-MS/MS included apoptosis-, cytoskeleton-, and energy metabolism-associated proteins, suggesting that multiple cellular processes were involved in Cr(VI)-induced cytotoxicity of 16-HBE cells.
Increasing lines of evidence have suggested that Cr(VI) may cause serious adverse health effects.35–37 The 16-HBE cell line is a human bronchial epithelial cell line that retains the differentiated morphology and function of human airway epithelia and is an ideal cell model for studying bronchial toxicity. 38 In the present study, the effects of Cr(VI) on cell viability, the cell cycle, and the mRNA expression of apoptosis-associated genes were investigated. Furthermore, Cr(VI) altered the mRNA expression levels of apoptosis-associated genes. However, the underlying mechanisms of Cr(VI)-induced toxicity remain unclear. To obtain clues and identify the potential molecular mechanisms involved, proteomic analysis was also performed on Cr(VI)-treated 16-HBE cells in the present study.
The proteins identified using MS reflected a complex cellular response to Cr(VI) exposure. The function and the alteration in expression of these differentially expressed proteins provided insights into the toxicity of Cr(VI) at the protein level. Bioinformatic analysis revealed that the proteins were categorized into apoptosis-associated proteins, cytoskeletal proteins, and energy metabolism-associated proteins according to their functions.
Serpin B5 (SPB5) acts as a tumor suppressor in a variety of types of human cancer, including mammary tumors. 39 Abnormal expression of annexin A11 (ANXA11) is associated with the malignant transformation of tumors, including liver cancer. 40 The significant alterations in expression indicated that SPB5 and ANXA11 may additionally be involved in the pro-apoptotic process and therefore tumorigenesis caused by Cr(VI) exposure. Furthermore, calumenin (CALU), a calcium-binding endoplasmic reticulum (ER) chaperone protein, has an important role in ER stress-induced apoptosis, and overexpression of CALU slows down the apoptotic process in cardiomyoctes. 41 CALU downregulation is direct evidence of the toxic effects of Cr(VI) exposure.
The cytoskeleton serves a role in controlling cell proliferation, the cell cycle, and cellular apoptosis. 42 Keratins represent the largest subgroup of intermediate filament (IF) proteins. Keratin IFs protect cells from stresses, including apoptotic signals that cause cell rupture and death. 43 In the present study, it was demonstrated that Cr(VI) exposure downregulated the expression of keratin 1, 7, 8, 18, and 19, which may promote cellular apoptosis. The abnormal expression of these proteins was indirect evidence of Cr(VI)-induced cytotoxicity.
The alterations in energy metabolism-associated proteins induced by Cr(VI) exposure indicated that cellular metabolism was affected by Cr(VI). The decreased ATP synthase subunit β expression level indicated that respiratory chain electron transfer was suppressed. 44 The alteration in chaperonin 10 suggested that Cr(VI) may affect ATP synthesis. 45 These alterations in protein expression indicated that cellular metabolism dysfunction may additionally be involved in the toxic action of Cr(VI).
In conclusion, the present study demonstrated that Cr(VI) exposure caused marked cytotoxicity in 16-HBE cells. Proteomic analysis demonstrated that Cr(VI) induced the differential expression of a number of proteins, including cytoskeleton-associated proteins, energy metabolism-associated proteins, and apoptosis and tumor-associated proteins, which may be directly or indirectly involved in Cr(VI)-induced cytotoxicity in 16-HBE cells.
Footnotes
Acknowledgments
The authors would like to thank Professor Dieter Gruenert (University of California, Bakersfield, CA, USA) for providing the human bronchial epithelial cell line.
Author’s Contribution
Bo Xia substantially contributed to conception or design, contributed to acquisition, analysis, or interpretation of data, drafted manuscript, and critically revised manuscript; Jiao Yuan and Li Pang contributed to acquisition, analysis, or interpretation of data and drafted manuscript; Kaiwu He substantially contributed to conception or design, contributed to acquisition, analysis, or interpretation of data, drafted manuscript, and critically revised manuscript. All authors gave final approval and agree to be accountable for all aspects of the work in ensuring that questions relating to the accuracy or integrity of any part of the work are appropriately investigated and resolved.
Declaration of Conflicting Interests
The author(s) declared no potential conflicts of interest with respect to the research, authorship, and/or publication of this article.
Funding
The author(s) disclosed receipt of the following financial support for the research, authorship, and/or publication of this article: This work was supported by the Project of Natural Science Foundation of Hunan Province (Project number: 2018JJ2169), Project of Natural Science Foundation of Hunan Province (Project number: 2018JJ3231) and 1515 talents Program of Hunan Agricultural University.