
Abstract
The real-time quantification of target engagement (TE) by small-molecule ligands in living cells remains technically challenging. Systematic quantification of such interactions in a high-throughput setting holds promise for identification of target-specific, potent small molecules within a pathophysiological and biologically relevant cellular context. The salt-inducible kinases (SIKs) belong to a subfamily of the AMP-activated protein kinase (AMPK) family and are composed of three isoforms in humans (SIK1, SIK2, and SIK3). They modulate the production of pro- and anti-inflammatory cytokines in immune cells. Although pan-SIK inhibitors are sufficient to reverse SIK-dependent inflammatory responses, the apparent toxicity associated with SIK3 inhibition suggests that isoform-specific inhibition is required to realize therapeutic benefit with acceptable safety margins. Here, we used the NanoBRET TE intracellular kinase assay, a sensitive energy transfer technique, to directly measure molecular proximity and quantify TE in HEK293T cells overexpressing SIK2 or SIK3. Our 384-well high-throughput screening of 530 compounds demonstrates that the NanoBRET TE intracellular kinase assay was sensitive and robust enough to reveal differential engagement of candidate compounds with the two SIK isoforms and further highlights the feasibility of high-throughput implementation of NanoBRET TE intracellular kinase assays for target-driven small-molecule screening.
Keywords
Introduction
Robust measurements of target engagement (TE) by small-molecule ligands are central to effective drug development and compound validation. 1 Direct TE measurement can provide key affinity and selectivity data for drug discovery programs and reveal structure-activity relationships of compounds interacting with their respective targets. Biomarkers can be an alternative, cost-effective proxy of TE. Their measurement enables the quantification of the endpoint efficacy of a drug; however, alone, they can be misleading regarding the mechanism of action, so that a correlation with TE is important to establish. Because of this, there have been significant efforts to implement TE assays early in drug development. 1
Bioluminescence resonance energy transfer (BRET) has become a widely used technique for real-time measurement of ligand-protein interaction in living cells. 2 It uses a bioluminescent donor, such as luciferase, that provides resonance energy and an acceptor that emits fluorescence upon activation. Close proximity of a donor and an acceptor, typically 10-nm distance constraints, allows a nonradiative transfer of photons from the donor to the acceptor. Recent engineering of NanoLuc, a smaller luciferase that bears higher emission intensity with a narrower spectrum than other luciferase variants, significantly improves the spectral resolution of a donor molecule. The use of NanoLuc in a BRET assay (i.e., NanoBRET), therefore allows robust TE analysis in living cells by localizing signals specifically from target-ligand interaction.3,4
The salt-inducible kinases (SIKs) belong to a subfamily of the AMP-activated protein kinase (AMPK) family comprising three isoforms in human (SIK1, SIK2, and SIK3). 5 They are ubiquitously expressed and play a major role in the control of gene expression in response to extracellular cues that increase intracellular cAMP levels. SIKs are also involved in the regulation of energy metabolism, linking endocrine signals via G protein–coupled receptors to changes in gluconeogenesis and lipid metabolism in the liver and adipose tissue. Recent data demonstrating a role for SIKs in modulating the production of pro- and anti-inflammatory cytokines in immune cells have provided a strong rationale for investigating SIK inhibition as a therapeutic strategy for inflammatory disease indications. 5 Although pan-SIK inhibitors efficiently reverse the SIK-dependent cytokine production, potential toxicities associated with inhibition of other functions of SIK kinases suggest that isoform-specific inhibition may be required to realize a therapeutic benefit with acceptable safety margins.6–8 In line with this, a discovery of potent inhibitors targeting SIK2 using matrix-assisted laser desorption/ionization time-of-flight mass spectrometry was recently published, but it is not clear whether their potent cellular activity was solely derived from SIK2 inhibition or also from inhibition of other isoforms. 9 Another small-scale cellular screening of >150 kinase inhibitors also identified active small molecules targeting all SIK isoforms, but developing isoform-specific SIK inhibitors has proven to be difficult. 10 Moreover, previous efforts to discover potent SIK inhibitors mostly rely on biochemical enzymatic activities or endpoint cellular activities such as cytokine production. Therefore, direct evidence of TE of potent SIK inhibitors in live cells has been missing.
In this study, we investigated the TE of 530 small-molecule compounds with two major SIK isoforms, SIK2 and SIK3. We used transient transfection to overexpress SIK2-NanoLuc and SIK3-NanoLuc fusion proteins in HEK293T cells and treated both cell lines with a cell-permeable tracer, K-4, that reversibly binds to the adenosine triphosphate (ATP)–binding pocket of the kinases and functions as the BRET acceptor. When graded amounts of test compounds were added, displacement of the tracer allowed for the measurement of the compounds’ affinity for SIK2 and SIK3. We independently confirmed the TE of the select compounds to SIK2 and SIK3 using a time-resolved fluorescence resonance energy transfer (TR-FRET) kinase assay and established the strong correlation between these two. Our analyses conclude that the NanoBRET intracellular kinase assay format is sensitive and robust enough to reveal differential engagement of candidate compounds with the two SIK isoforms and further highlight the feasibility of high-throughput implementation of a NanoBRET TE intracellular kinase assay for target-driven small-molecule screening.
Materials and Methods
Cell Culture and Transfection
HEK293T cells (#CRL-1573, ATCC, Manassas, VA) were grown in complete medium (DMEM, #10-013-CV, Corning, Corning, NY) supplemented with 10% fetal bovine serum (FBS; #35-010-CV, Corning), 1% L-glutamine, and 1% penicillin/streptomycin and maintained at 37 °C with 5% CO2. For transfection, four million cells were seeded into a T75 flask in 20 mL of antibiotic-free media. At the same time, cells were transfected with a mixture of 9 µg of promoter-less carrier DNA (#E4881, Promega, Madison, WI) and 1 µg of NanoLuc-SNF1LK2 Fusion vector (#NV2061, Promega) or NanoLuc-SIK3 Fusion vector (#NV2041, Promega) using 30 µL FuGENE HD transfection reagents (#E2312, Promega). These vectors contain the coding region of NanoLuc luciferase fused to the N-terminus of the full-length human SNF1LK2 (SIK2) kinase or the N-terminus of full-length human SIK3 kinase. Eighteen to 24 h posttransfection, cells were resuspended and seeded into a 384-well nonbinding surface (NBS) plate (#3574, Corning) for assay the following day.
NanoBRET TE Assay
Serially diluted 100× stock small-molecule inhibitors were prepared in DMSO in a 384-well microplate. On the day of the assay, 100× stock was thawed and 20 nL of inhibitor solution was transferred to a 384-well NBS plate using Echo 555 Liquid Handler (Labcyte, San Jose, CA). The transfected cells were resuspended in Opti-MEM (#11058-021, Life Technologies, Carlsbad, CA) at a density of 3.13 × 10⁵ cells/mL and 16 µL (5000 cells) solution per well was directly dispensed to the plate using a Multidrop Combi Reagent Dispenser (Thermo Fisher Scientific, Waltham, MA), followed by dispensing 4 µL of 5× NanoBRET Tracer K-4 per well (#N2540, Promega). The concentrations of 5× tracer were 0.5 µM and 2.5 µM for the SIK2 assay and SIK3 assay, respectively. Following 2-h incubation at 37 °C, 10 µL of 3× substrate/inhibitor solution in Opti-MEM per well was added before reading BRET signals.
Determining Subsaturating Concentration of Tracer K-4
To accurately measure the TE by a test compound in the NanoBRET TE assay, cells were treated with a subsaturating concentration of NanoBRET tracer in our assay. To determine the optimal tracer concentration, we first generated the dose-response curves of the tracer in HEK293T cells ectopically expressing NanoLuc-SIK2 or NanoLuc-SIK3 and obtained the tracer EC50 values in both settings (0.13 µM for SIK2 and 0.8 µM for SIK3; Fig. 1A ). Next, we used the varying concentrations of a pan-SIK inhibitor (YKL-05-099) to further select the optimal tracer concentration for SIK2 and SIK3 assays ( Fig. 1B ). Based on the robustness of assays, as determined by, for example, the signal to background ratio (S/B) and Z′ score, we selected 0.1 µM and 0.5 µM as optimal tracer concentrations for SIK2 and SIK3 assays, respectively.
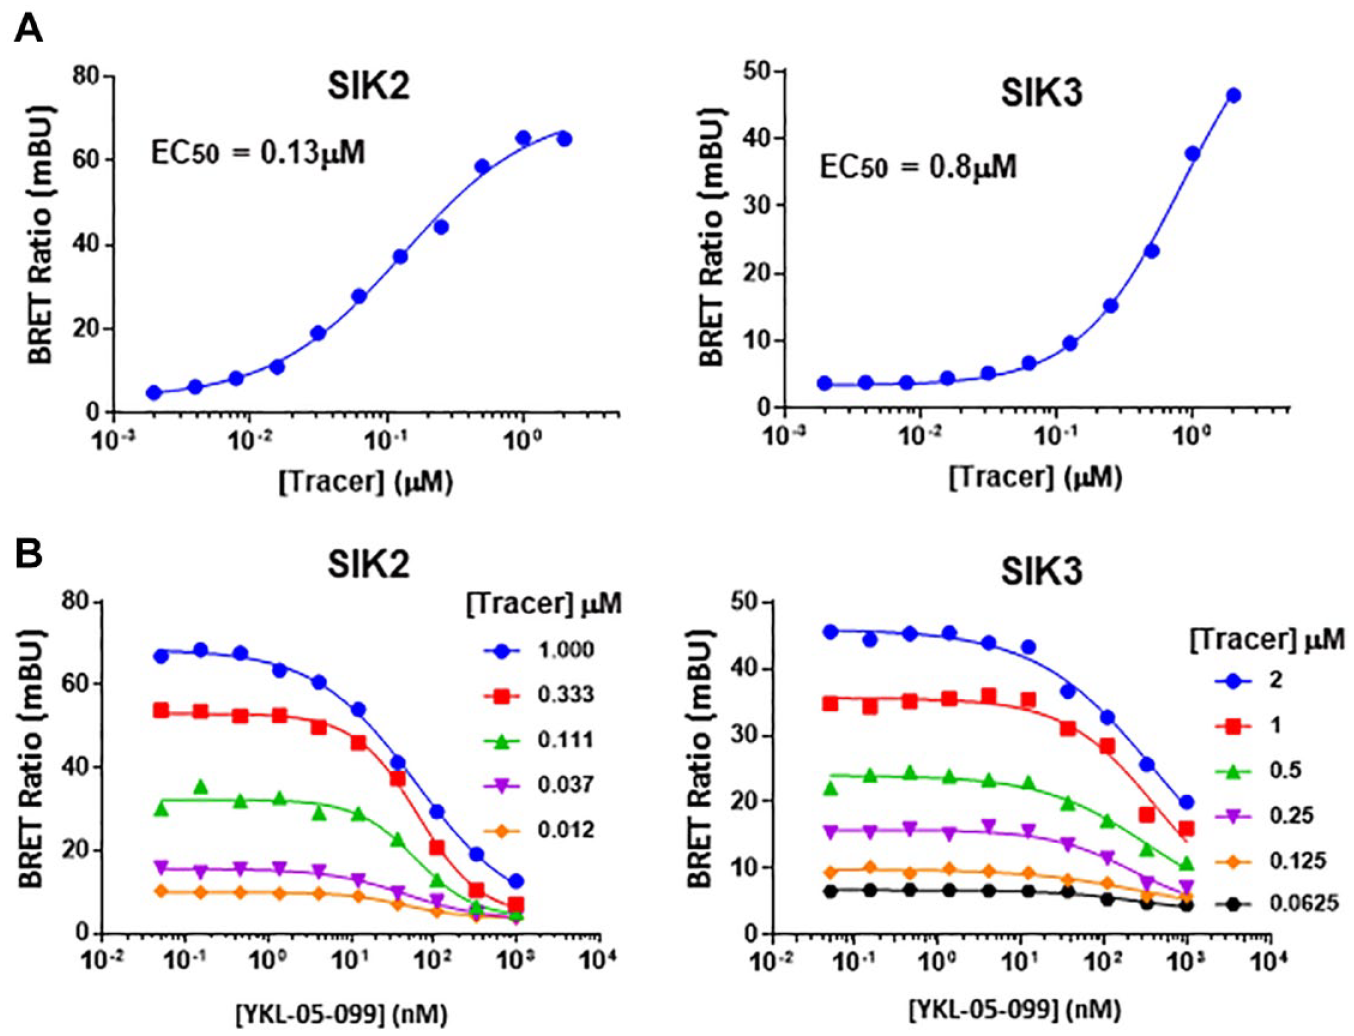
High-throughput implementation of the NanoBRET target engagement intracellular kinase assay. (
BRET Signal Measurements
All BRET measurements were performed on EnVision (PerkinElmer, Waltham, MA) equipped with a 460/25 bandpass filter for detecting donor signals and a 615/8.5 bandpass filter for detecting acceptor signals. BRET signals were measured within 1 h after adding substrate/inhibitor solution with a 1.0 s integration time. The BRET ratio (milliBRET unit) was defined as the ratio of acceptor signal over the donor signal multiplied by 1000.
AlphaLISA Human TNFα Detection Assay
An AlphaLISA human tumor necrosis factor α (TNFα) detection assay was conducted according to the manufacturer’s protocol (#AL208, PerkinElmer). Briefly, human primary peripheral blood mononuclear cells (PBMCs) were seeded in a 384-well culture plate (#6007680, PerkinElmer) with 40 000 cells in 60 µL per well in stimulation media (RPMI 1640, 10% FBS). The cells were stimulated with lipopolysaccharide (LPS; 100 pg/mL) for 24 h, together with a graded amount of a pan-SIK inhibitor, YKL-05-099. On the next day, the AlphaLISA reaction was run in a 384-well white Opti-Plate (#6007299, PerkinElmer) with a total reaction volume of 24 µL per well. First, 6 µL of supernatants from PBMC culture and 8 µL of acceptor beads/biotinylated antibody were mixed and incubated for 1 h. This was followed by the addition of 10 µL of streptavidin-donor mixture and another 1-h incubation in the dark. Immediately after the incubation, the AlphaLISA signals were quantified on EnVision with a total measurement time of 550 ms and an excitation time of 180 ms.
TR-FRET Kinase Assay
The TR-FRET assay was used to detect phospho-Ser79 on biotin-SAMS M74L by SIK2 (#02-129, CarnaBio, Natick, MA; N-terminal GST-fused full-length human SIK2) or SIK3 (#PV6405, Invitrogen, Carlsbad, CA; N-terminal GST-tagged human SIK3, aa. 59-365). SAMS peptide was derived from acetyl-CoA carboxylase (ACC) amino acids 73-85, in which Ser77 was mutated to Ala. Met74 was substituted with Leu (SAMS M74L) to improve peptide stability by preventing methionine oxidization. Biotinylated SAMS M74L was custom ordered from Bio-Synthesis Inc (Lewisville, TX, USA) LANCE Ultra Europium–anti-phospho-ACC (Ser79) antibody (#TRF0208-M, PerkinElmer), streptavidin-XL665 (#610SAXAC, CisBio, Codolet, France), and 10× Lance Detection Buffer (#CR97-100, PerkinElmer) were acquired from commercial sources. Kinase assay buffer contained 50 mM Tris-HCl (pH 7.4), 10 mM MgCl2, 2 mM dithiothreitol, and 0.01% Tween-20. The kinase reaction and TR-FRET detection were conducted in a total volume of 8 µL in a 384-well ProxiPlate (#6008289, PerkinElmer). Briefly, a serial dilution of compound, 15 µM ATP (concentration at its approximate Km), 1 µM biotin-SAMS M74L, and 1 nM SIK2 or 20 nM SIK3 in kinase assay buffer were incubated for 1 h at room temperature. The phospho-Ser79 on biotin-SAMS M74L was detected by LANCE Ultra Europium–anti-phospho-ACC (Ser79) and streptavidin-XL665 in Lance Detection Buffer in the presence of 5 mM EDTA and incubated for 1 h at room temperature. Assay plates were read on EnVision (PerkinElmer).
Quality Control and IC50 Calculation
The quality control (QC) and dose-response analyses were conducted using Genedata Screener Software. The IC50 was determined by a ROUT fit nonlinear regression model. 11 The Z′ score and S/B of each plate were calculated, and the experiments were repeated when the Z′ was lower than 0.4 or the S/B was lower than 2.5. The IC50 values were used only when the assay passed the QC cutoff.
Results
Selection of 530 SIK Inhibitor Candidates Regulating TNFα Production
The SIKs are composed of three isoforms in humans (SIK1, SIK2, and SIK3). Genetic mutant mice lacking each isoform have revealed their physiological roles. Although germline deletion of SIK3 (Sik3-/-) in mice causes high lethality after birth as well as metabolic and skeletal abnormalities,7,8,12 individual deletion of the other two isoforms exhibited much milder symptoms.13–16 Similarly, mice with kinase-dead knock-in (KI) mutation of SIK3 (SIK3-T163A) were born in submendelian ratio and predisposed to defects in skeletal development, whereas mice with kinase inactivation of the other two isoforms, SIK1 (SIK1-T182A) and SIK2 (SIK2-T175A), were viable and developed normally. 6 These data suggest the isoform-specific roles of SIK3 in prenatal development.
These studies also revealed isoform-specific roles of SIKs in modulating the production of pro- and anti-inflammatory cytokines in immune cells. Specifically, the studies of kinase-dead SIK2 KI mice revealed its roles in macrophage polarization, such that genetic inactivation of SIK2 polarizes macrophages toward a proresolution M2-like phenotype. 6 Consistent with this, pharmacologic inhibition of SIKs converts the immune cells to a more tolerogenic state, characterized by increased expression of anti-inflammatory cytokines such as interleukin-10 (IL-10) as well as decreased expression of proinflammatory cytokines, representatively TNFα and of common p40 subunit of interleukin-12/23 (IL-12/23).10,17–20 Antibodies blocking TNFα and IL-12/IL-23 cytokines are clinically validated in inflammatory bowel disease, rheumatoid arthritis, and psoriasis patients. 21 Therefore, the development of small-molecule inhibitors targeting SIKs would be beneficial in treating such inflammatory diseases.
To select a list of compounds to be tested for NanoBRET TE, we first screened compounds that modulate cytokine expression regulated by SIKs. We applied an AlphaLISA immunoassay to quantify TNFα and IL-10 production in human PBMCs with toll-like receptor ligand stimulation by LPS and investigated the regulation of the cytokine production mediated by a previously characterized pan-SIK inhibitor, YKL-05-099. 22 With this assay, we confirmed that YKL-05-099 is a potent inhibitor of TNFα production (IC50 = 0.198 ± 0.081 µM). However, the LPS-dependent induction of IL-10 was unexpectedly dampened and even reversed at the highest concentration of YKL-05-099 (>1 µM; Fig. 2A, B ). This observation is consistent with a previous report demonstrating that another pan-SIK inhibitor, HG-9-91-01, suppresses zymosan-induced IL-10 production at high concentration (>1 µM) in murine bone-marrow derived dendritic cells, presumably because of the inhibition of additional kinases mediating IL-10 production. 10 Therefore, we focused on TNFα production as a direct functional readout of SIK inhibition for the remainder of our study. We identified 530 small-molecule compounds that exhibited varied efficacy in inhibiting TNFα, including ~100 compounds that suppressed TNFα production more potently than YKL-05-099.
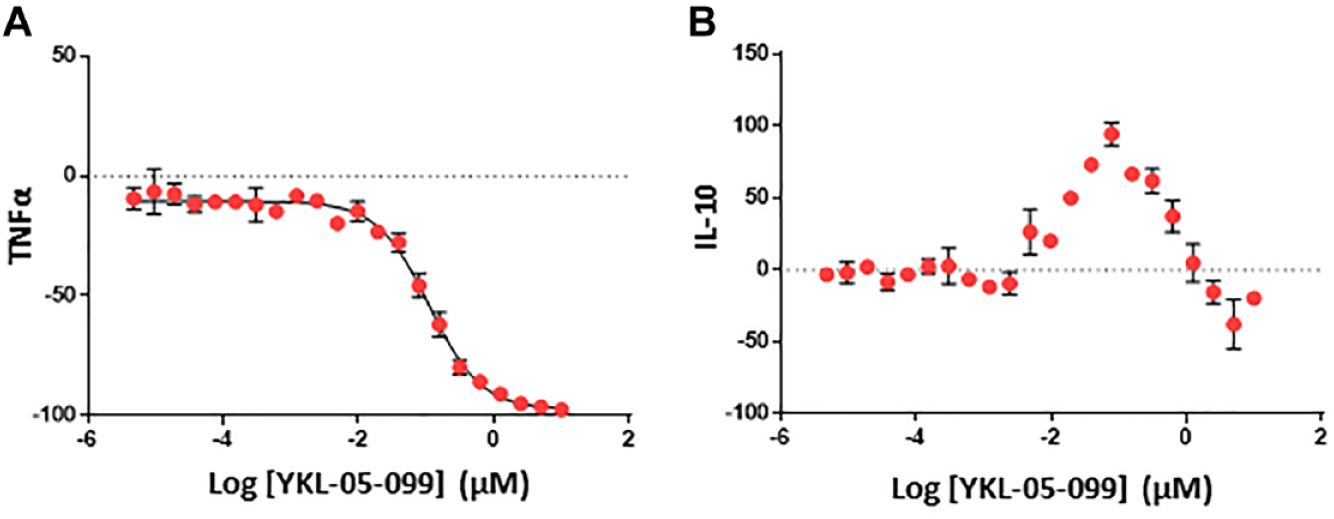
Regulation of proinflammatory cytokine tumor necrosis factor α (TNFα) and anti-inflammatory cytokine interleukin-10 (IL-10) by salt-inducible kinase (SIK) inhibition. Varying amounts of the previously characterized pan-SIK inhibitor, YKL-05-099, were added to human primary peripheral blood mononuclear cells treated overnight with lipopolysaccharide, and TNFα and IL-10 levels in the supernatant were quantified.
High-Throughput Implementation of NanoBRET TE Intracellular Kinase Assay
Next, we developed robust high-throughput assays to test the target selectivity of the compounds. Among the three SIK isoforms, we focused on SIK2 and SIK3 based on their high abundance in gene expression profiles and strong enzymatic activity in immune cells. In stark contrast, this trend was completely opposite in the case of SIK1 and therefore excluded from our analysis.6,23
We optimized the assay conditions in each experimental step first using SIK2-NanoLuc–overexpressing HEK293T cells. This includes optimization of signal integration time, assay plate type, assay time points posttransfection, cell number, and compound incubation time ( Suppl. Fig. 1A–E ). With our optimized condition, the assay concentration of K-4 tracer was determined in SIK2- and SIK3-overexpressing HEK293T cells independently by cross-titrating K-4 tracer and YKL-05-099 ( Fig. 1B ). The optimal concentrations of the tracer based on S/B, Z′, and IC50 were 0.1 µM for SIK2 and 0.5 µM for SIK3, which were below their tracer EC50, 0.13 µM for SIK2 and 0.8 µM for SIK3 to avoid the saturation of the tracer ( Fig. 1A ; see the Materials and Methods section). With this series of optimizations, we were able to achieve an assay window (S/B) of 7 and a Z′ score higher than 0.8, demonstrating that our assay is robust enough to conduct high-throughput screening.
Systematic TE Assessment Revealed SIK2- and SIK3-Specific Compounds
With our optimized NanoBRET intracellular TE assays, we next assessed TE of the selected compounds with SIK2 and SIK3 using SIK2-NanoLuc– and SIK3-NanoLuc–overexpressing HEK293T cells side by side. The screening process involved a total of 129 plates in a 384-well setting with each plate containing up to 16 compounds. Each compound was serially diluted, plated in a single row, and assayed in duplicate in a separate plate with the repeat experiment being conducted on a different day. Each plate contained YKL-05-099 as a positive control to compare plate-to-plate variability. Our data from the 129 plates were highly reproducible based on the IC50 values of YKL-05-099 and were also robust (Z′ of ~0.6 and S/B of ~5; Fig. 3A ).
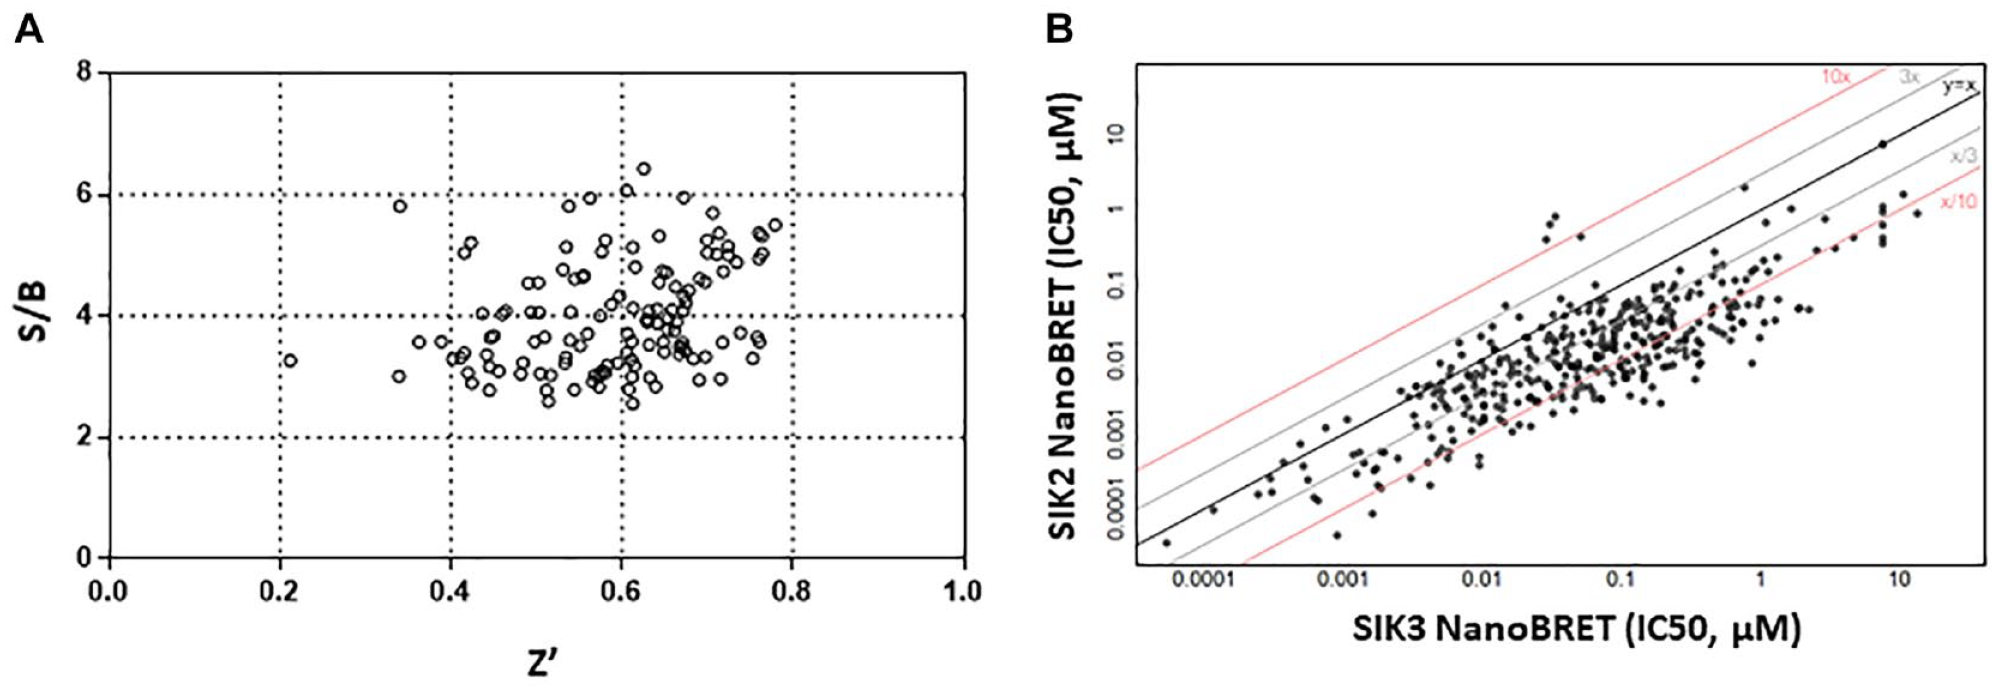
Target engagement assessment for salt-inducible kinase–2 (SIK2) and SIK3. (
When comparing the TE of the 530-compound set to SIK2 and SIK3 isoforms, our analysis clearly revealed that most compounds were not selective for either isoform, engaging both SIK2 and SIK3 to comparable degrees ( Fig. 3B ). Consistently, the IC50 values of TE of a pan-SIK inhibitor, YKL-05-099, for SIK2 (0.011 ± 0.010 µM) and SIK3 (0.017 ± 0.016 µM) were also comparable. This is presumably because of the high homology of ATP-binding sites of SIK2 and SIK3, the site of compound engagement. 24 However, we found a small set of isoform-selective compounds: 75 compounds being ≥10-fold more selective for SIK2 over SIK3 and 3 compounds being ≥10-fold more selective for SIK3 over SIK2 ( Fig. 3B ). It would be interesting to investigate the functional consequences of these isoform-specific compounds regulating cytokine production and inflammatory responses.
Nonetheless, our data demonstrated that the NanoBRET TE intracellular kinase assay is sensitive and robust enough to distinguish highly homologous kinases and reveal differential TE. Moreover, our high-throughput implementation of the assay demonstrated the feasibility of using the assay for target-driven small-molecule screening.
Independent Validation of TE by a Cell-Free Biochemical Assay
Next, we developed another biochemical assay to independently validate the results from NanoBRET TE. To this end, we employed a TR-FRET kinase assay, which is an established cell-free biochemical assay using physiologically relevant native protein substrates. 25 AMPK, a protein kinase in the same family as the SIKs, is a known metabolic sensor that activates fatty acid oxidation by phosphorylating its substrate, ACC. 26 A recent report demonstrated SIK2 may also phosphorylate S79 of ACC. 27 Based on these results, we synthesized an ACC peptide fragment that includes the S79 phosphorylation site and used this as a substrate for our TR-FRET assay (see the Materials and Methods section). By applying this assay to SIK2 and SIK3 isoforms side by side, we were able to biochemically quantify and compare their kinase inhibitory activities. The quantification of kinase activity upon treatment of 74 compounds that were previously tested for NanoBRET TE assay established a strong correlation of the IC50 values of these two assays for both SIK2 and SIK3 isoforms ( Fig. 4 ). This suggests that the TE of these compounds leads to a direct modulation of the kinase activity, further validating the robustness of the NanoBRET TE intracellular kinase assay.
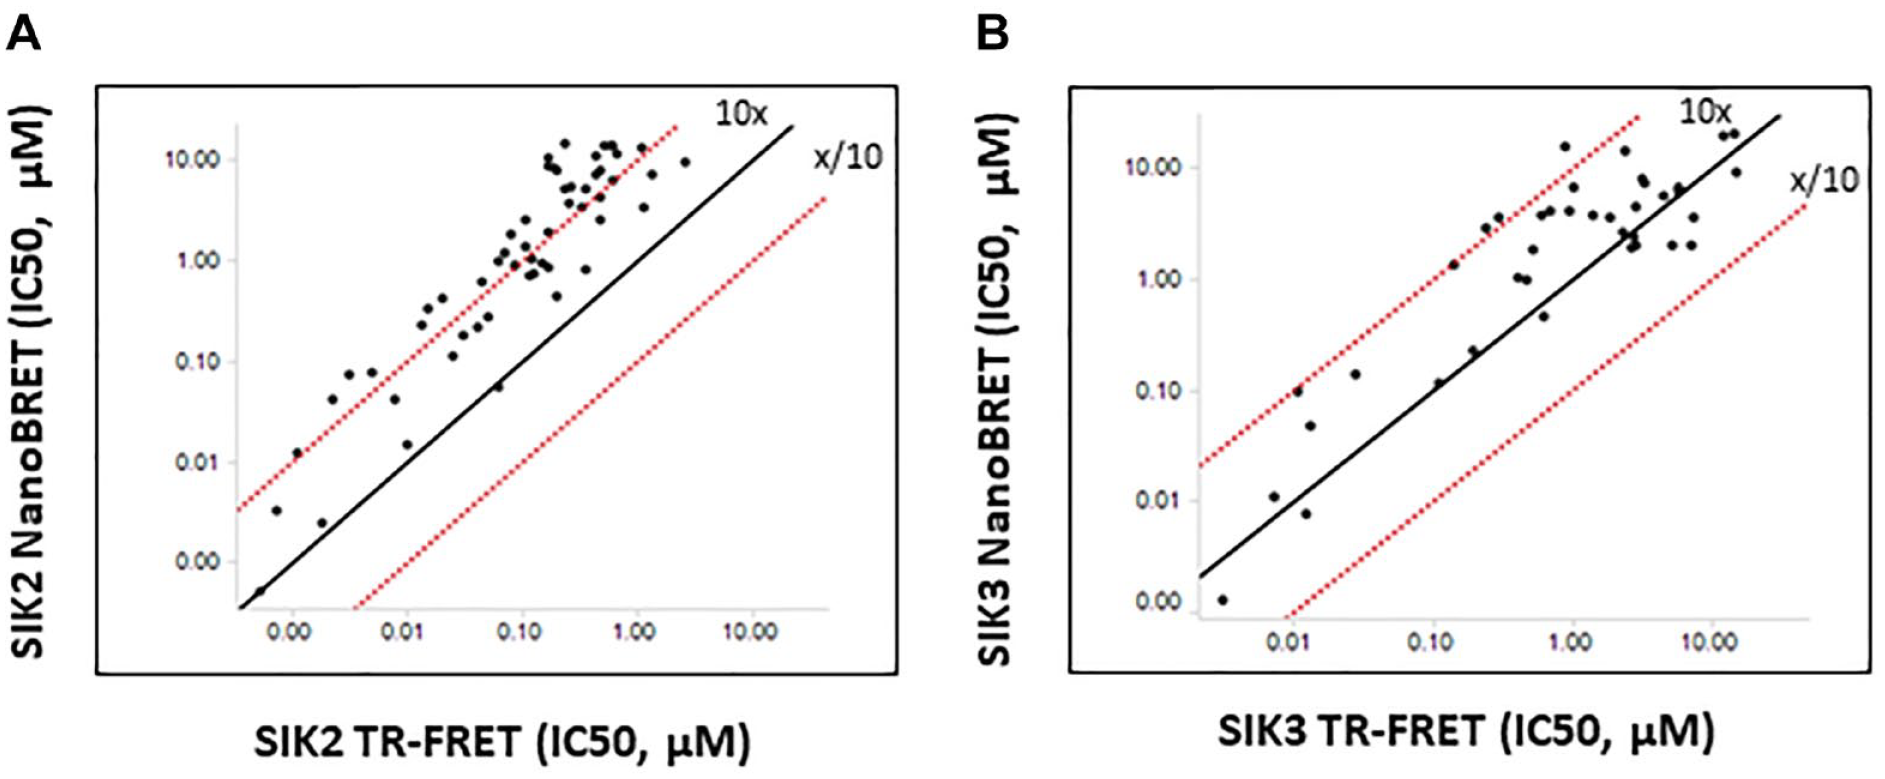
Correlation analysis of salt-inducible kinase–2 (SIK2) and SIK3 target engagement (NanoBRET TE) and kinase activity (time-resolved fluorescence resonance energy transfer). (
Discussion
Our studies demonstrated that the NanoBRET TE intracellular kinase assays can be used in a variety of stages of early hit prioritization steps. Although we have focused on a flow scheme of compound prioritization based on our initial cellular functional assays followed by NanoBRET cellular TE and biochemical assays, an inverse approach starting from biochemical enzymatic assays or a combined analysis of cellular functional, cellular TE, and biochemical enzymatic analysis is also feasible. In this integrated screening process, the NanoBRET cellular TE assay will provide pivotal data for compound selection, especially when the biochemical and cell-based functional assays fail to correlate. For example, compounds that demonstrate a correlation between NanoBRET cellular TE and biochemical assays yet fail to show cellular activity may suggest that the presence of functionally redundant molecules in cells and/or the target molecules are not biologically active. Some compounds may reveal correlative results between NanoBRET cellular TE and cellular functional assays with no biochemical activity. In this case, this compound series may need to be further validated. It is also possible to identify compounds inactive in the NanoBRET TE assay yet active in the other two, which indicates cellular activity via indirect mechanisms. Therefore, incorporation of NanoBRET TE intracellular kinase assays into various stages of early hit prioritization steps such as “hit ID,” “hit to lead,” and “lead optimization” will provide invaluable information to relate results from biochemical and cellular functional assays.
We conducted AlphaLISA-based cellular functional assays for the 530 compounds to select small molecules that regulate TNFα production, and these 530 compounds were also tested for SIK2 and SIK3 NanoBRET TE intracellular kinase assays. The direct comparison between these two assays would reveal which SIK isoform dominantly drives the TNFα suppression and provide the rationale to develop paralog-specific SIK inhibitors. Interestingly, the comparison revealed a high degree of correlation between SIK3 NanoBRET IC50 and TNFα production IC50, but there was significantly less obvious correlation between SIK2 NanoBRET IC50 and TNFα production IC50 (data not shown). This lack of a correlation between SIK2 NanoBRET and TNFα production suggests that SIK2 engagement alone is not sufficient to suppress TNFα, and SIK3 inhibition is required to achieve maximal TNFα suppression. We are currently following up on this observation using cell lines with individual or double knockout mutations of SIK isoforms and paralog-specific SIK inhibitors in human disease contexts.
Compared with our biochemical enzymatic activity data, NanoBRET cellular TE data showed a clear right shift by 10-fold for SIK2, but this trend was less obvious for SIK3 ( Fig. 4 ). One explanation to reconcile the discrepancy between the biochemical IC50s and cellular TE IC50s is that the small-molecule inhibitors we investigated bind to the active conformation of the kinase in the ATP-binding pocket. Higher ATP concentration in cellular assays compared with biochemical assays causes a preferential interference with the class of small-molecule inhibitors targeting ATP-binding pockets, which results in a right shift in IC50 values. 28 This is also reminiscent of results derived from previous efforts of the Amgen research group developing JAK2-selective inhibitors. 29 Using a set of ATP-competitive JAK2 inhibitors, the study demonstrated that there is discordance in the compound selectivity of JAK2-specific inhibitors between biochemical and cellular assays so that the degree of JAK2 selectivity determined by biochemical IC50 was not recapitulated in cellular IC50 values with a dramatic biochemical-to-cellular potency loss. 29 It is less clear why the biochemical-to-cellular potency loss is isoform specific. Although it would be necessary to test more compounds to confirm a differential shift between SIK2 and SIK3, one explanation is that the SIK2 enzyme construct used in the TR-FRET biochemical assay (N-terminal GST-fused full-length human SIK2) or in the NanoBRET TE assay (N-terminal NanoLuc-fused full-length human SIK2) may not properly represent native human SIK2. Similarly, we used N-terminal GST-tagged human SIK3 (aa 59-365) for the TR-FRET biochemical assay, whereas the N-terminal NanoLuc-fused full-length SIK3 was used for the NanoBRET TE assay. Therefore, the SIK2 proteins with a different tag or SIK3 with a different length used in the two assays may exhibit different ATP Km values. Another study on JAK isoforms demonstrated that ATP Km values of kinases predict the degree of potency loss driven by ATP competition so that the measured potency loss was the most drastic in JAK3 (~100-fold), 25-fold for JAK2, and only 10-fold for JAK1 isoform, when evaluated in a biochemical assay with ATP at its Km. 30 Therefore, a differential biochemical-to-cellular potency loss driven by ATP competition in SIK2 and SIK3 may be derived from different enzyme constructs used in each assay.
Overall, NanoBRET TE intracellular kinase assays for SIK2 and SIK3 revealed differential engagement of candidate compounds between the two highly homologous isoforms of a critical kinase family that regulate inflammatory cytokines. This assay format can be broadly applicable to paralog-specific small-molecule development for other kinase families. Our optimization of the NanoBRET TE intracellular kinase assays and independent validation with a biochemical enzymatic activity assay for a total of 530 compounds further highlighted the robustness and the feasibility of high-throughput implementation of the NanoBRET TE assay for target-driven small-molecule screening.
Supplemental Material
Fig_Supp_TIFF – Supplemental material for High-Throughput Implementation of the NanoBRET Target Engagement Intracellular Kinase Assay to Reveal Differential Compound Engagement by SIK2/3 Isoforms
Supplemental material, Fig_Supp_TIFF for High-Throughput Implementation of the NanoBRET Target Engagement Intracellular Kinase Assay to Reveal Differential Compound Engagement by SIK2/3 Isoforms by Hyun Yong Jin, Yanyan Tudor, Kaylee Choi, Zhifei Shao, Brian A. Sparling, Joseph G. McGivern and Antony Symons in SLAS Discovery
Footnotes
Acknowledgements
We thank the members of the Department of Medicinal Chemistry, Immuno-Oncology, Discovery Technologies, PKDM, and CBSS of Amgen for their help and constructive discussion.
Supplemental material is available online with this article.
Declaration of Conflicting Interests
The authors disclosed receipt of the following financial support for the research, authorship, and/or publication of this article: All authors are employed by Amgen Inc., and their research and authorship of this article were completed within the scope of their employment with Amgen Inc.
Funding
The authors received no financial support for the research, authorship, and/or publication of this article.
References
Supplementary Material
Please find the following supplemental material available below.
For Open Access articles published under a Creative Commons License, all supplemental material carries the same license as the article it is associated with.
For non-Open Access articles published, all supplemental material carries a non-exclusive license, and permission requests for re-use of supplemental material or any part of supplemental material shall be sent directly to the copyright owner as specified in the copyright notice associated with the article.