
Abstract
Macroautophagy is a catabolic process wherein cytosolic cargo is engulfed in an autophagosome that fuses with a lysosome to degrade the cargo for recycling. Autophagy maintains cellular homeostasis and is involved in a myriad of illnesses ranging from cancer to neurodegenerative diseases, but its therapeutic potential remains elusive due to a lack of potent and specific autophagy modulators. To identify specific inhibitors of early autophagy, a target-based, compound-multiplexed, fluorescence polarization, high-throughput screen that targets the ATG5–ATG16L1 protein–protein interaction was developed. This interaction is critical for the formation of LC3-II, which is involved in phagophore maturation, and its disruption should inhibit autophagy. This assay is based on the polarization of light emitted by a fluorescent rhodamine tag conjugated to a peptide corresponding to the N-terminal region of ATG16L1 (ATG16L1-N). It was confirmed that this peptide binds specifically to ATG5, and the assay was validated by rapidly screening 4800 molecules through compound multiplexing. Through these initial screening efforts, a molecule was identified that disrupts the ATG5–ATG16L1 protein–protein interaction with micromolar potency, and this molecule will serve as a starting point for chemical optimization as an autophagy inhibitor.
Keywords
Introduction
Autophagy is an evolutionarily conserved degradative process that is involved in maintaining cellular homeostasis. Stress signals, such as nutrient deprivation or organelle damage, induce the formation of double-membrane vesicles, termed autophagosomes, which sequester cellular debris for degradation in the lysosome and subsequent recycling. Because autophagy is responsible for recycling and processing a diverse range of biomolecules, it plays a critical role in a multitude of human diseases such as cancer, aging, neurodegeneration, inflammation, and various lysosomal disorders.1–5 Efforts to better understand the utility of autophagy modulation in disease models have been hampered, however, by the absence of potent autophagy inhibitors that lack off-target effects.
The autophagic pathway has four stages—initiation, nucleation, maturation, and degradation—all of which could be potential targets for autophagy inhibition. 6 During nucleation, ATG16L1 interacts with the ATG12–ATG5 conjugate through the association of its N-terminal α-helical region (ATG16L1-N) with a binding cavity on ATG5.7,8 This results in a conformational change in ATG5, allowing it to bind to the membrane of the phagophore. 8 This ATG12–ATG5–ATG16L1 complex is crucial for lipidation of LC3 (microtubule-associated protein 1A/1B—light chain 3), an autophagy-specific biomarker, to form LC3-II.9,10 The inhibition of LC3-II formation abolishes autophagy by preventing phagophore maturation.11,12 Currently available autophagy inhibitors, like chloroquine (CQ) and SAR405, exhibit off-target effects due to inhibition of other cellular pathways, such as lysosomal acidification and endosomal trafficking, respectively.13,14 Protein–protein interactions (PPIs) mediated by α-helical regions are particularly viable targets for inhibition, with several studies discovering molecules that effectively disrupt such interactions in vitro and in vivo.15–17 Therefore, targeting the ATG5–ATG16L1 PPI presents a viable alternative for the discovery of novel, autophagy-specific inhibitors. In fact, a previous study reported some success in discovering autophagy inhibitors through a virtual high-throughput screen (HTS) targeting the ATG5–ATG16L1 PPI. 18
Most methods used to discover autophagy inhibitors rely on high-content fluorescent microscopy to detect the formation of fluorescently labeled autophagosomes.19,20 This approach is limited by its inability to identify the molecular target responsible for inhibition, necessitating subsequent mechanism-of-action studies. Currently, no target-based high-throughput assays exist that target the ATG5–ATG16L1 PPI within the autophagy pathway. Assays measuring the lipidation of LC3 using the purified complex in vitro have been previously reported, but they have yet to be developed into a high-throughput approach. 21 It has also been shown that the members of this complex have roles outside of canonical autophagy, such as the involvement of ATG16L1 and ATG5 in LC3-associated phagocytosis (LAP) and the broad role of ATG5 in immunity.22–24 Therefore, not only would a high-throughput assay targeting the ATG5–ATG16L1 PPI provide an effective and rapid secondary screen for phenotypic assays, but also it would drive the discovery of molecules that inhibit the autophagy-specific roles of these proteins, potentially enabling the delineation of molecular mechanisms underlying their other cellular functions.
Herein, we report the successful development of a fluorescence polarization (FP) assay targeting the ATG5–ATG16L1 PPI. Our HTS is robust and can be compound-multiplexed, which enabled the rapid assessment of 4800 molecules from a curated library of potential PPI inhibitors to discover novel autophagy inhibitors. We successfully identified a hit that disrupted this interaction in dose, highlighting the utility of our multiplexed HTS approach.
Materials and Methods
Reagents
The labeled, Rho-ATG16L1-N (TAMRA-PRWKRHISEQLRRRDRLQRQAFEEIILQYNKLL), and unlabeled, ATG16L1-N (PRWKRHISEQLRRRDRLQRQAFEEIILQYNKLL), α-helical segment of ATG16L1 (residues 11–43) was purchased through the University of Illinois at Chicago (UIC) Research Resources Center (RRC, Chicago, IL); the labeled peptide is tagged with 5,6-carboxytetramethylrhodamine on the N-terminus of the α helix (no linker), and the final product was obtained in ≥90% purity. 10 Isopropyl-β-D-thiogalactoside (IPTG; cat. no. I6758, Sigma-Aldrich, St. Louis, MO), Na2PO4 (cat. no. BP331, Thermo Fisher Scientific, Waltham, MA), NaCl (cat. no. 0241, VWR, Radnor, PA), imidazole (cat. no. I2399, Sigma-Aldrich), 2-mercaptoethanol (cat. no. O3446I, Thermo Fisher Scientific), phenylmethanesulfonyl fluoride (PMSF; cat. no. P7626, Sigma-Aldrich), Triton X-100 (cat. no. 0694, VWR), 1× phosphate-buffered saline (PBS; cat. no. 21-040-CM, Corning, Corning, NY), DMSO (cat. no. 25-950-CQC, Corning), and Tween 20 (cat. no. M147, Amresco, Solon, OH) were also used.
Construction of the MBP-ATG5 Plasmid
Full-length human ATG5 was cloned from the pCMV-myc-Atg5 plasmid, which was a gift from Toren Finkel (cat. no. 24922, Addgene, Watertown, MA), into the pET His6 MBP TEV LIC cloning vector (1M; cat. no. 29656, Addgene), which was a gift from Scott Gradia, using ligation-independent cloning (LIC). 25 In brief, the ATG5 gene was amplified by PCR using forward (5′-TACTTCCAATCCAATGCAATGACAGATGACAAAGAT-GTGCTT-3′) and reverse (5′-TTATCCACTTCCAATGTTATTATCAATCTGTTGGCTGTGGG-3′) primers and gel-purified. The LIC vector was linearized by digestion with SspI-HF [cat. no. R3132S, New England BioLabs (NEB), Ipswich, MA] and gel-purified. Next, the digested vector and the PCR product were treated with T4 DNA Polymerase (cat. no. M0203S, NEB) in the presence of deoxyguanosine triphosphate (dGTP; cat. no. N0446S, NEB) for the vector and deoxycytidine triphosphate (dCTP; cat. no. N0446S, NEB) for the PCR product for 2 h at room temperature. The treated vector and PCR products were then mixed and incubated at room temperature for 30 min; transformed into competent DH5α Escherichia coli cells (cat. no. 18265017, Thermo Fisher Scientific), which were plated on agar plates containing kanamycin (cat. no. 11815024, Thermo Fisher Scientific) at 50 µg/mL; and grown overnight at 37 °C. Single colonies were picked and sequenced to confirm cloning.
MBP-ATG5 Expression and Purification
E. coli strain BL21(DE3)pLysS (cat. no. 69451-3, Novagen, Madison, WI) was revived and expanded at 37 °C with 50 µg/mL kanamycin (cat. no. 61-176-RG, Corning) and 25 µg/mL chloramphenicol (cat. no. 61-239-RI, Corning) antibiotics at 250 rpm (revolutions/min) until OD600 ≈ 0.6, and expression was induced using 1 mM IPTG at 16 °C overnight for ~15 h. The cultures were then centrifuged for 10 min at 5000 rpm, and the supernatant was decanted. The cell pellet was suspended in lysis buffer [20 mM Na2PO4, 500 mM NaCl, 5 mM imidazole, 5 mM 2-mercaptoethanol, 1 mM PMSF, and 0.5% Triton X-100, ~pH 7.4; β-mercaptoethanol (BME) and PMSF added right before lysis], and the cells were lysed using a Branson 150 sonicator (six cycles: 10 s on, 50 s off; Branson Ultrasonics, Danbury, CT). Lysate was clarified by centrifugation at 15,000 rpm at 4 °C for 30 min, and MBP-ATG5 was purified using ÄKTA start (Cytiva, Marlborough, MA) in a cold room, where the clear lysate was loaded onto the HisTrap HP column (cat. no. 17-5247-01, GE Healthcare, Marlborough, MA) and washed with wash buffer (20 mM Na2PO4, 20 mM imidazole, and 500 mM NaCl, ~pH 7.4). MBP-ATG5 was then eluted with elution buffer (20 mM Na2PO4, 500 mM imidazole, and 500 mM NaCl, ~pH 7.4). The eluate was desalted using a HiTrap Desalting column (cat. no. 17-1408-01, GE Healthcare), and stored in storage buffer (20 mM Na2PO4, 250 mM NaCl, and 0.05% Tween 20, pH 7.4). The protein concentration was then determined using a Bradford Assay (cat. no. 1863028, Thermo Fisher Scientific), after which reducing agent (2 mM; cat. no. B0009, Life Technologies, Waltham, MA) was added, and then the protein was flash-frozen using methanol and dry ice. Protein production was confirmed via sodium dodecyl sulfate–polyacrylamide gel electrophoresis (SDS-PAGE).
HTS Development
Peptide Solubility and Aggregation
ATG16L1-N and Rho-ATG16L1-N solubility was tested (
Protein/peptide aggregation was also tested in a detergent titration counterscreen
26
(
Binding Confirmation between MBP-ATG5 and ATG16L1-N
Purified MBP-ATG5 was diluted in assay buffer (1× PBS, 0.05% Tween 20, and 1% DMSO) to generate a 12-point dose curve (0.22 nM to 450 nM) with a volume of 45 µL per well in a black 384-well plate (cat. no. 3573, Corning). 5 µL of Rho-ATG16L1-N (10 nM) was added to each well, and then the plate was covered with foil and incubated in the dark at room temperature for 2 h. A SpectraMax i3x with the FP-Rhodamine module at 500 ms integration time and 9 mm read height with ex/em at 535/595 was then used to determine the millipolarization (mP), which is based on Equation (1):

where P = fluorescence polarization, I║ = fluorescence intensity parallel to excitation plane, and I⊥ = fluorescence intensity perpendicular to excitation plane.
Surface Plasmon Resonance (SPR)
Open SPR (version 3.13, Nicoya, Kitchener, Canada) was used in accordance with its operation and service manual. Briefly, the NTA sensor chip (cat. no. SEN-AU-100-10-NTA, Nicoya) was activated using the NTA reagent kit (NTA-RK, Nicoya) and coupled to MBP-ATG5 (500 µg/mL in running buffer) via its His-tag, in accordance with Nicoya’s tech guide. ATG16L1-N was diluted in the same running buffer (10 mM HEPES, 150 mM NaCl, 0.05% Tween 20, and deionized H2O, degassed and filtered through a 0.2 µm filter) to concentrations from 0.001 to 20 µM. Because it was not possible to remove the analyte (ATG16L1-N) without removing the ligand (MBP-ATG5) during the regeneration step, the ligand was removed using 150 mM HCl followed by 400 mM imidazole, and recoupled to the sensor chip prior to each injection of analyte at a flow rate of 20 µL/min. Kinetic analysis was performed on Trace Drawer in accordance with the Open SPR version 3.13 manual using the Fit model entitled “One to One,” using binding curves obtained across two independent experiments and analyte concentrations from 0.001 to 20 µM.
Competition Assay to Determine Specificity
ATG16L1-N was diluted in assay buffer to generate a 12-point dose curve (0.24 nM to 500 nM) for a volume of 40 µL/well in a black 384-well plate (cat. no. 3573, Corning). 5 µL of MBP-ATG5 (40 nM) and 5 µL of Rho-ATG16L1-N (10 nM) were added to each well, and the plate was covered in foil, placed in the dark, and incubated for 2 h prior to mP determination (same as above).
Selectivity of ATG16L1-N Interaction with ATG5 over MBP
MBP was diluted in assay buffer to generate an 8-point dose curve (3.16 nM to 810 nM) for a volume of 45 µL in a black 384-well plate. 5 µL of Rho-ATG16L1-N (10 nM) was added to each well, and the plate was covered with foil, placed in the dark for 2 h, and analyzed as described above.
High- and Low-Signal Plates
The high plates were similar to the binding confirmation experiment (high signal), in which 45 µL of MBP-ATG5 (40 nM) was added to a 384-well plate in columns 3–22, followed by 5 µL of Rho-ATG16L1-N (10 nM). The plates were covered in foil and incubated in the dark for 2 h prior to recording the mP. The low plates were similar to the competition experiment (low signal), in which 40 µL of ATG16L1-N (300 nM) was added to a 384-well plate in columns 3–22, followed by 5 µL of ATG5 (40 nM) and then 5 µL Rho-ATG16L1-N (10 nM) in those same wells. In both high and low plates, proteins/peptides were added via manual pipetting, and both high-signal and low-signal controls were included in columns 1, 2, 23, and 24 in a staggered pattern so that column 1 would have four rows with low signal, followed by eight rows with high signal, and end with four more rows of low signal (


where σ = standard deviation, µ= mean, + = positive control, and “−” = negative control. Distribution of proteins/peptides was then automated in the high- and low-signal plates (
Multiplex and Deconvolution
Multiplex
Purified MBP-ATG5 was diluted in assay buffer (1× PBS + 0.05% Tween 20), and 45 µL was manually pipetted into columns 3–22 for a working concentration of 40 nM in the assay plate. The controls were then added, and five compound plates (provided by the UICentre for Drug Discovery, Chicago, IL, a curated library of ChemDiv compounds from the PPI, PPI_Helix-Turn-3D-Mimetics, Spiro_Bridge, and Targeted_Diversity libraries) were pinned into the assay plate using the Beckman Coulter Biomek NXP liquid handler and a pin tool (V&P Scientific Inc., Winooski, VT). 5 µL of Rho-ATG16L1-N was then added to each well and mixed via manual pipetting, and the plate was covered with foil and incubated in the dark for 2 h. The mP was then analyzed as previously mentioned. The z-score of each well was calculated using Equation (4):

where x = the obtained value, µ = mean, and σ = standard deviation. The wells with a z-score lower than −3 were pursued for deconvolution.
Deconvolution
The compounds of the wells that had a z-score lower than −3 were purchased and individually tested in 12-point dose (80 µM to 0.31 µM) in the same way as the competition assay, except using the compound of interest instead of ATG16L1-N. The percent inhibition was calculated using Equation (5):

Additional “Hit” Analysis
The fluorescence of each compound was measured on the SpectraMax i3x with ex/em at 535/595 to eliminate fluorescent molecules (false positives). Solubility was determined by dissolving compound in PBS and measuring the absorbance at 620 nM after 4 h.
A detergent titration counterscreen
26
was also performed on the hit molecule H3, and a reported ATG5–ATG16L1 PPI inhibitor referred to as compound
Results
Fluorescence polarization is based on the principle that the polarization of light emitted by a fluorophore is inversely proportional to the rate of molecular rotation. Because larger molecules rotate slower, it is possible to quantify the interaction of a small fluorescent ligand, such as a peptide, with a larger substrate, such as a protein.27–29 Quantitatively, FP is derived from the difference of the emission light intensity parallel and perpendicular to the excitation light plane normalized by the total fluorescence emission intensity. 30 Because fluorescence from small molecules can lead to false positives in an FP assay, we chose rhodamine as the fluorophore because fewer library compounds are typically fluorescent within the red region of the light spectrum. In addition, ATG5 was left conjugated to MBP because it was prone to aggregation without this solubility tag.
Peptide Analysis
Rho-ATG16L1-N is the small fluorescent ligand used for the development of this assay. It is the N-terminal helical portion of ATG16L1 that is responsible for its interaction with ATG5. 10 Therefore, the unlabeled version of this truncated protein (ATG16L1-N) should act as an effective competitor to the labeled peptide through displacement of Rho-ATG16L1-N, thus causing the polarization signal to decrease.
A solubility assay was performed with the peptides to determine if there was aggregation (
Development and Validation of the FP Assay Targeting the ATG5-ATG16L1 PPI
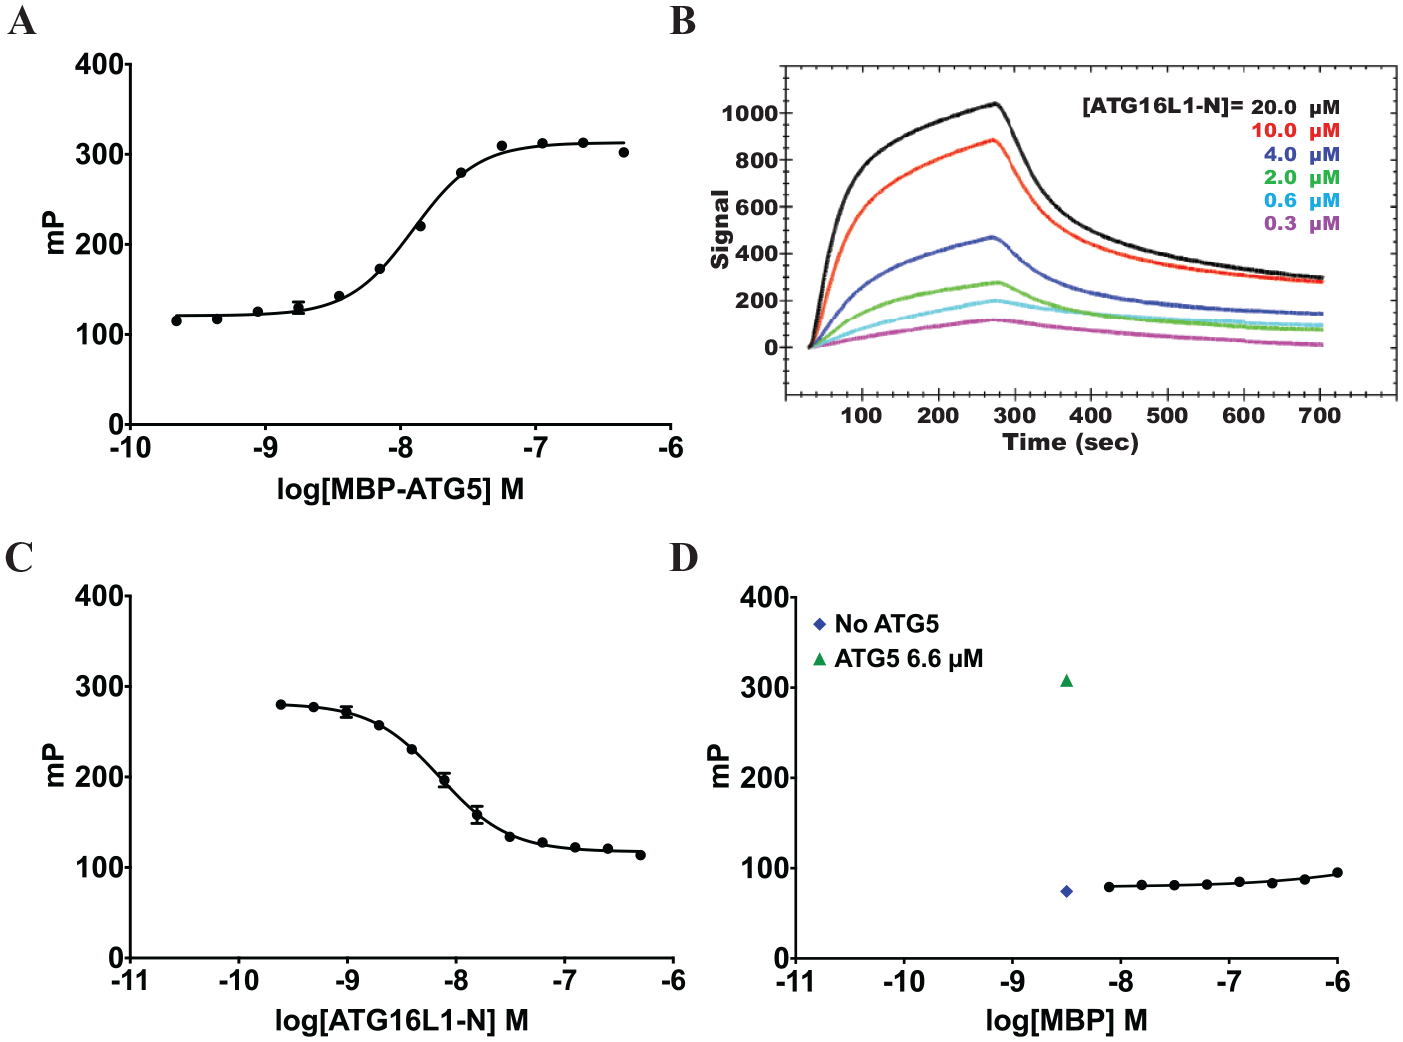
First, binding was confirmed between MBP-ATG5 and Rho-ATG16L1-N. The FP assay was performed in 12-point dose, in which Rho-ATG16L1-N (10 nM) was treated with MBP-ATG5 (0.22 nM to 450 nM). We saw a dose-dependent increase in the FP (mP) as MBP-ATG5 concentration increased ( Fig. 1A ). Because of the relatively large size difference between bound and unbound Rho-ATG16L1-N, this increase in the polarization of emitted light indicated that Rho-ATG16L1-N was binding to MBP-ATG5 (EC50 = 12.5 nM). SPR was used to confirm binding between MBP-ATG5 and ATG16L1-N ( Fig. 1B ), for which the KD was found to be 3.69 ± 0.141 µM.
Assay validation. (
Next, the specificity of the MBP-ATG5 and Rho-ATG16L1-N binding was determined using an unlabeled version of the peptide (ATG16L1-N) in a competition assay with Rho-ATG16L1-N. The FP assay was performed in 12-point dose, in which Rho-ATG16L1-N (10 nM) and MBP-ATG5 (40 nM) were treated with ATG16L1-N (0.24 nM to 500 nM). A dose-dependent decrease in mP ( Fig. 1C ) was observed, which indicated that the interaction between Rho-ATG16L1-N and MBP-ATG5 was specific, because ATG16L1-N acted as a competitive inhibitor to Rho-ATG16L1-N (IC50 = 7.16 nM), displacing it from MBP-ATG5 and leading to depolarization of emitted light.
To eliminate the possibility that the MBP bound to ATG5 was interacting with Rho-ATG16L1-N, the FP assay was performed in 8-point dose, in which Rho-ATG16L1-N (10 nM) was treated with MBP (3.16 nM to 810 nM). The mP remained close to background with increasing MBP concentration, suggesting that there is no significant interaction between MBP and Rho-ATG16L1-N and that Rho-ATG16L1-N is interacting specifically with ATG5 ( Fig. 1D ).
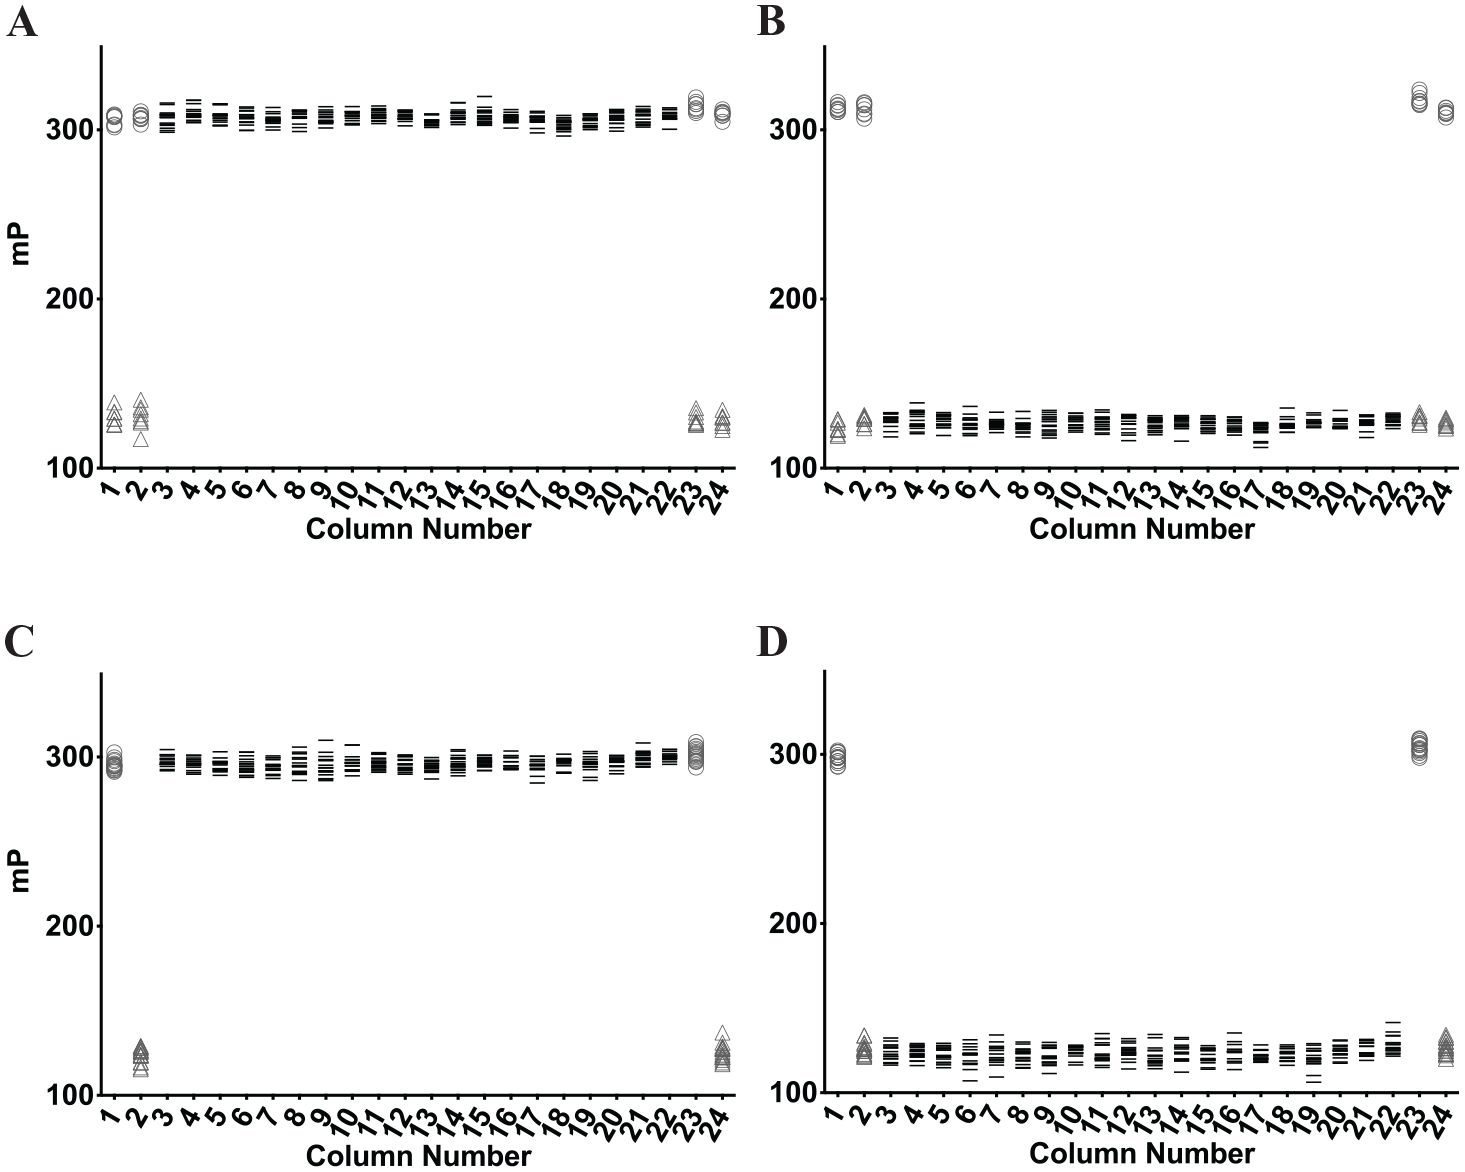
Before proceeding to screen a compound library, the overall quality and reproducibility of the FP assay were determined throughout a 384-well plate. Several parameters of the FP assay were quantified, including the Z factor (Z’) to determine the quality of the assay and the %CV to evaluate variation throughout a plate to assess plate effects. This analysis was initially performed in a semi-automated manner, in which proteins/peptides were distributed through manual pipetting and compounds were distributed by the liquid handler (
Assessment of assay quality and plate effects. (
Screening a Curated Library
Because this assay proved to be robust, we decided to expedite the screening process by compound-multiplexing 4800 molecules from a library of small molecules optimized to be PPI inhibitors (
Fig. 3
). Five compounds, from five different compound plates, were pin-transferred into a 384-well assay plate containing MBP-ATG5 (40 nM) and Rho-ATG16L1-N (10 nM). The results were expected to look like the competition assay in which a potential inhibitor would lower the mP response. Each assay plate was screened in duplicate, and wells with a z-score of less than −3 in both duplicates were considered to contain active compounds or hits (i.e., inhibitors;
Fig. 4A
). Active compounds were then identified through deconvolution, in which each of the five molecules was tested individually in 12-point dose in the FP assay from 0.04 µM to 80 µM. In each case, the active hit was clearly evident because it was the only molecule in the set that decreased the mP signal in dose (
Fig. 4B
). From the deconvolution data, the hits were prioritized based on the percent inhibition of each molecule, which was calculated based on in-plate controls (
Fig. 4C
). The four scaffolds that were identified as hits (80 µM) displayed more than 50% inhibition as single molecules and as part of the compound-multiplexed mixtures, as shown for H3 (
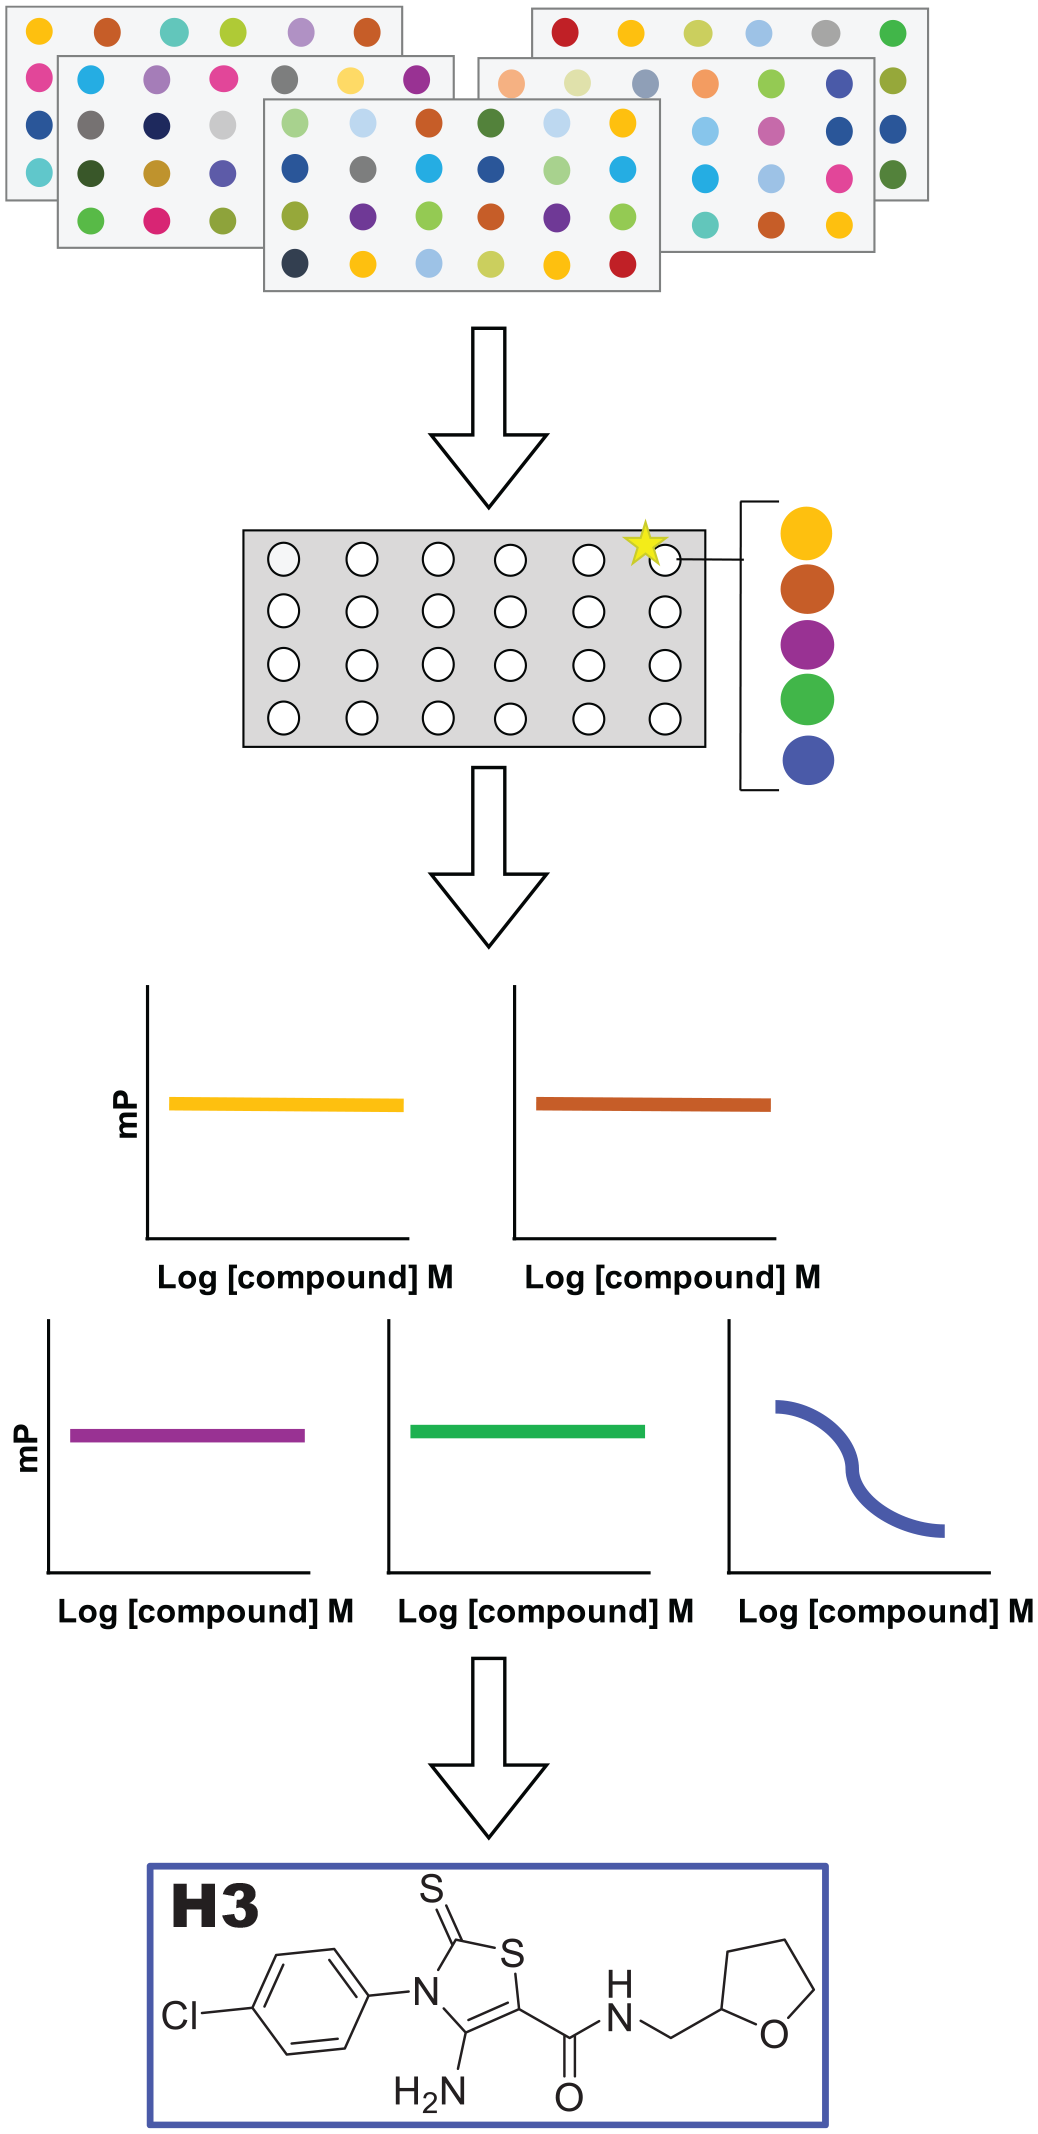
Pathway for inhibitor identification through compound-multiplexing 4800 molecules and deconvolution using fluorescence polarization, with the “hit” structure displayed (H3).
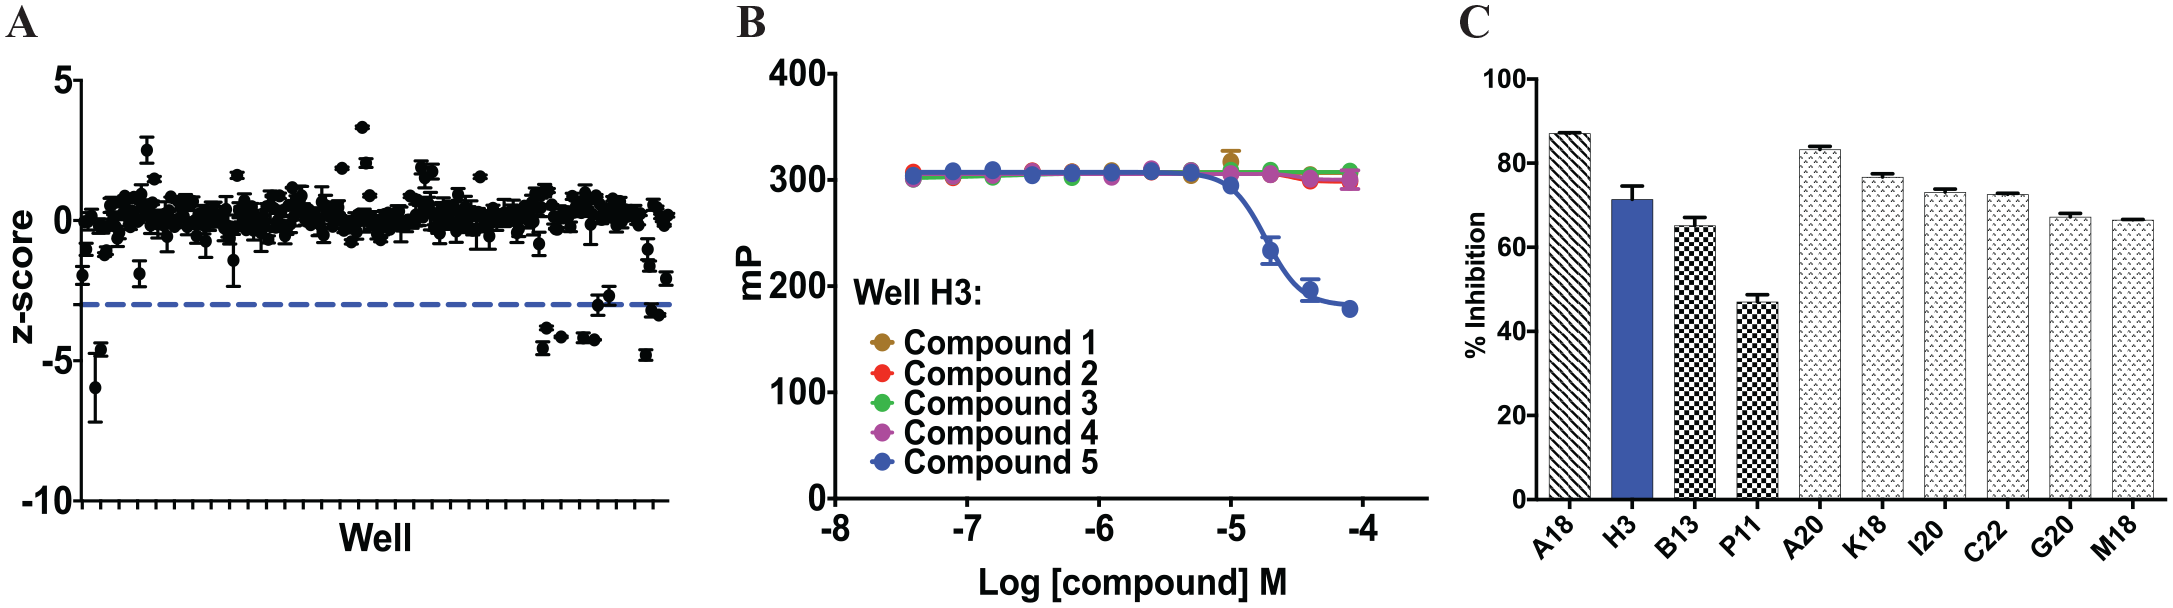
Multiplexing and deconvolution to identify and prioritize hits. (
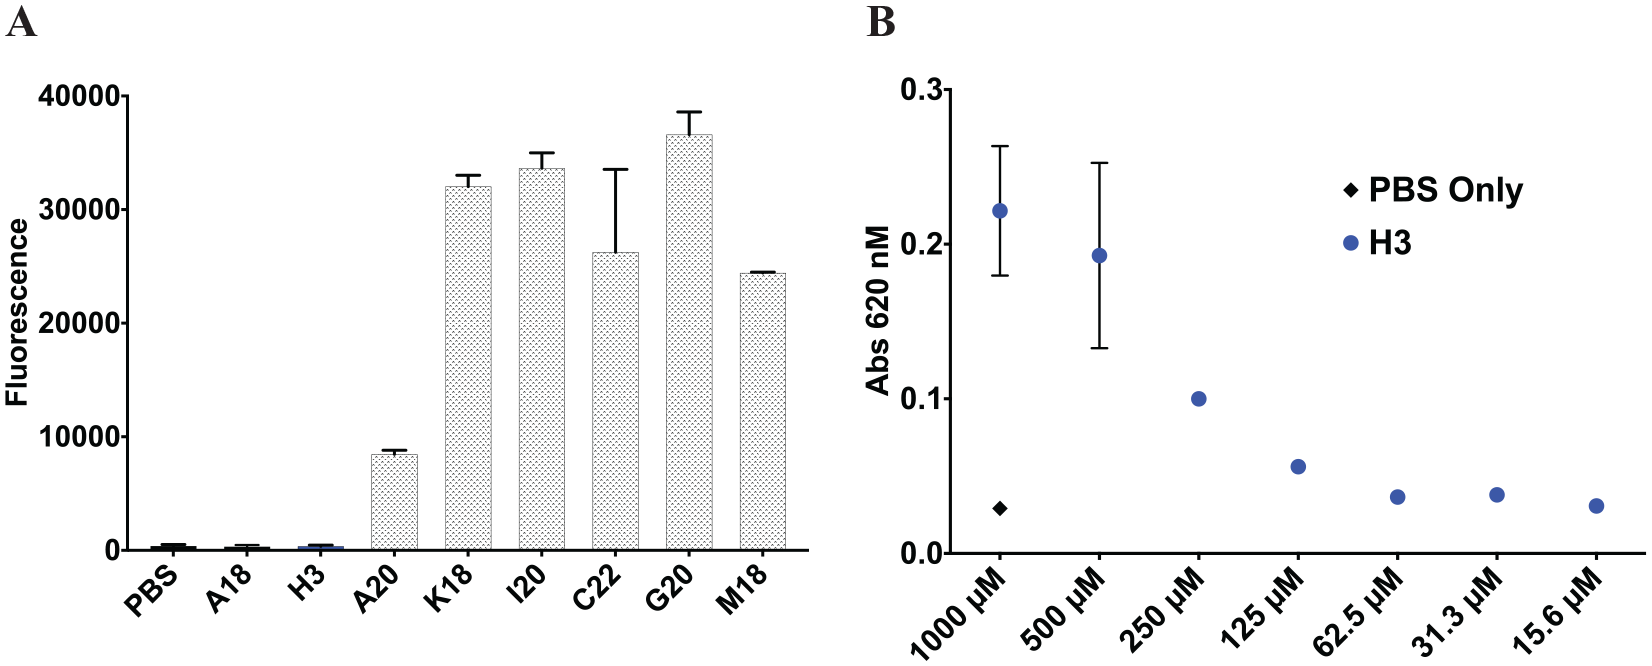
The hits identified in the deconvolution step described above were then tested at the same excitation/emission wavelength as rhodamine (ex/em = 535/595 nM) to exclude molecules that fluoresce at the same wavelength as rhodamine, which may lead to false positives due to the rapid rotation of free fluorescent small molecules in solution (
Fig. 5A
). In this manner, the benzimidazole scaffold, which displayed significant fluorescence for all analogues tested (A20, K18, I20, C22, G20, and M18), was excluded, leaving A18 (IC50 = 43.35 µM) and H3 (IC50 = 18.4 µM) as true hits in this assay. The solubility of H3 was also tested in aqueous solution, which revealed the limited solubility of this hit at higher than 100 µM (
Fig. 5B
). To test if H3 is a nonspecific inhibitor due to aggregation, a detergent titration counterscreen was conducted, in which H3 showed no significant aggregation effects because it had minimal changes in bioactivity after a 10-fold detergent concentration increase (
Additional analysis of hits. (
The multiplexed FP HTS pilot screen was completed, in which H3 was identified as a compound that disrupted the ATG5–ATG16L1 interaction (IC50 = 18.4 µM) and was not innately fluorescent. H3 (20–200 µM) was unable, however, to significantly lower the LC3-II levels or increase p62 levels in A549 or HeLa cells after 8 and 24 h, likely due to the partial solubility of H3 at higher than 100 µM. Additional optimization will be performed to determine if this hit can be developed as a selective autophagy inhibitor.
Discussion
Herein, we report the successful development of a compound-multiplexed FP assay targeting the disruption of the ATG5–ATG16L1 PPI. The crystal structure of the human ATG12–ATG5–ATG16L1 complex reveals that the α-helical amino end of the ATG16L1 protein is the region that interacts with two ubiquitin-like-fold domains (UFDs) on the surface of ATG5 of the ATG12–ATG5 conjugate.
10
The N-terminal section of ATG16L1 consisting of residues 11–43 was then synthesized with 5,6-carboxytetramethylrhodamine directly attached to the N-terminus of this truncated protein (Rho-ATG16L1-N), and a second peptide synthesized without the fluorophore (ATG16L1-N). Peptide solubility was tested, in which both ATG16L1-N and ATG16L1-Rho were soluble at concentrations much higher than their working concentrations of 300 nM and 10 nM, respectively (
FP has previously been shown to be a promising technique to probe this important interaction by Zhao and coworkers, who examined the binding affinities of 30 ATG16L1-based peptides labeled with 5-carboxyfluorescein (5-FAM) to ATG5 to determine key residues on ATG16L1 involved in the PPI. 33 They determined that the effective ATG5-binding segment of ATG16L1 includes residues I17, L21, and R24, or, more generally, residues 14–34. 33 Our goal was to find small molecules that disrupt the ATG5–ATG16L1-N PPI, so we decided to use a red-shifted rhodamine-tagged truncated ATG16L1 peptide to minimize the false discovery of fluorescent molecules. Furthermore, this peptide includes amino acids 11–43, which have now been determined to be critical for the interaction of ATG5 and ATG16L1 by multiple groups.10,33
The FP assay was also tested in a fully automated manner: The proteins/peptides were added using the MultiFlo FX, and the compounds were added using the NXP liquid handler. The Z’ and %CV of the automated method were very comparable to the semi-automated method, in which only the compounds were added using the liquid handler. The promising results of the automated high-signal and low-signal plates suggest that performing the HTS in a fully automated manner with compound multiplexing would enable the rapid and reproducible assessment of thousands of compounds.
We effectively demonstrated that our FP-based assay specifically measures the full-length ATG5 with the MBP solubility tag and truncated ATG16L1 PPI through a competition experiment and a counterscreen targeting MBP. After confirming the capability of our assay in high throughput, we used it to rapidly screen 4800 molecules for the inhibition of the ATG5–ATG16L1 PPI by compound-multiplexing five molecules per well. Hit compounds were identified using dose-dependent deconvolution and repurchased to test overall solubility and fluorescence to exclude false positives and prioritize hits for optimization.
The lead compound, H3, caused 70% inhibition as a single compound at 80 µM (
Fig. 4C
), and 54% inhibition at 20 µM as part of the compound-multiplexed mixture (
A suitable positive control for the disruption of the MBP-ATG5 and ATG16L1 PPI was not identified, so ATG16L1-N was used to decrease the mP and act as the positive control. Compound
Because the affinity of MBP-ATG5 toward ATG16L1-N was determined to be in the low nanomolar range, we expect that our hits will need to be optimized for potency to be effective probes in cells. It should also be noted that although the identified molecules disrupt the interaction between the isolated protein and peptide, it is possible that in a cellular context, the compounds may have a higher affinity for other targets and specificity may have to be analyzed using secondary assays. Molecules discovered using this screen will, however, be well positioned to serve as new tool compounds for autophagy modulation. In addition, target-based approaches targeting the inhibition of PPIs involved in early autophagy with small molecules are just beginning to be explored,34,35 and this method can act as an additional screen to discover novel autophagy inhibitors that affect PPIs in this pathway. Lastly, this new assay can serve as a secondary screen to rapidly delineate the mechanism of action of novel autophagy inhibitors identified through phenotypic HTS.
We hypothesize that optimized molecules that disrupt formation of the ATG5–ATG16L1 complex will inhibit autophagic flux in cells. Such molecules that selectively inhibit autophagy will allow for the evaluation of autophagy inhibition in various disease states, including cancer, in which autophagy inhibition may prove beneficial.36–38 In addition, the proteins of this complex also have roles outside of canonical autophagy, and the specific, spatiotemporal disruption of this complex would aid in elucidating the purpose of these proteins in other cellular functions. For example, ATG16L1 and ATG5 are involved in LAP, and ATG5 is also involved in lymphocyte development and proliferation, MHC II antigen presentation, and apoptosis, among other roles. 39 In conclusion, this assay is a cost-effective and robust tool that can be used for the identification, validation, and confirmation of novel inhibitors of the ATG5–ATG16L1 PPI.
Supplemental Material
sj-pdf-1-jbx-10.1177_24725552211000679 – Supplemental material for Development of a High-Throughput, Compound-Multiplexed Fluorescence Polarization Assay to Identify ATG5–ATG16L1 Protein–Protein Interaction Inhibitors
Supplemental material, sj-pdf-1-jbx-10.1177_24725552211000679 for Development of a High-Throughput, Compound-Multiplexed Fluorescence Polarization Assay to Identify ATG5–ATG16L1 Protein–Protein Interaction Inhibitors by Maryna Salkovski, Ivan Pavlinov, Qiwen Gao and Leslie N. Aldrich in SLAS Discovery
Footnotes
Acknowledgements
We would like to thank Scott Gradia from University of California, Berkeley, for the pET His6 MBP TEV LIC plasmid, and Toren Finkel from the National Institutes of Health for the pCMV-myc-Atg5 plasmid. We would also like to thank Audra Lemley from the University of Illinois at Chicago for assistance with SPR experiments.
Supplemental material is available online with this article.
Abbreviations
ATG16L1, A full-length protein; ATG16L1-N, an unlabeled segment of ATG16L1; CQ, chloroquine; %CV, percent coefficient of variation; FP, fluorescence polarization; HTS, high-throughput screen; LC3, microtubule-associated protein 1A/1B—light chain 3; MBP, maltose-binding protein; mP, millipolarization; PPI, protein–protein interaction; Rho, rhodamine; Rho-ATG16L1-N, a rhodamine-tagged N-terminal helical portion of ATG16L1.
Declaration of Conflicting Interests
The authors declared no potential conflicts of interest with respect to the research, authorship, and/or publication of this article.
Funding
The authors disclosed receipt of the following financial support for the research, authorship, and/or publication of this article: Funding for these studies was provided by the UIC Department of Chemistry, College of Liberal Arts and Sciences, and the UICentre for Drug Discovery [UIC CCTS (NIH UL1TR002003) and UICentre award no. 2017-16].
References
Supplementary Material
Please find the following supplemental material available below.
For Open Access articles published under a Creative Commons License, all supplemental material carries the same license as the article it is associated with.
For non-Open Access articles published, all supplemental material carries a non-exclusive license, and permission requests for re-use of supplemental material or any part of supplemental material shall be sent directly to the copyright owner as specified in the copyright notice associated with the article.