
Abstract
Target engagement by small molecules is necessary for producing a physiological outcome. In the past, a lot of emphasis was placed on understanding the thermodynamics of such interactions to guide structure–activity relationships. It is becoming clearer, however, that understanding the kinetics of the interaction between a small-molecule inhibitor and the biological target [structure–kinetic relationship (SKR)] is critical for selection of the optimum candidate drug molecule for clinical trial. However, the acquisition of kinetic data in a high-throughput manner using traditional methods can be labor intensive, limiting the number of molecules that can be tested. As a result, in-depth kinetic studies are often carried out on only a small number of compounds, and usually at a later stage in the drug discovery process. Fundamentally, kinetic data should be used to drive key decisions much earlier in the drug discovery process, but the throughput limitations of traditional methods preclude this. A major limitation that hampers acquisition of high-throughput kinetic data is the technical challenge in collecting substantially confluent data points for accurate parameter estimation from time course analysis. Here, we describe the use of the fluorescent imaging plate reader (FLIPR), a charge-coupled device (CCD) camera technology, as a potential high-throughput tool for generating biochemical kinetic data with smaller time intervals. Subsequent to the design and optimization of the assay, we demonstrate the collection of highly confluent time-course data for various kinase protein targets with reasonable throughput to enable SKR-guided medicinal chemistry. We select kinase target 1 as a special case study with covalent inhibition, and demonstrate methods for rapid and detailed analysis of the resultant kinetic data for parameter estimation. In conclusion, this approach has the potential to enable rapid kinetic studies to be carried out on hundreds of compounds per week and drive project decisions with kinetic data at an early stage in drug discovery.
Keywords
Introduction
The importance of understanding binding kinetics (BK) of compounds in early stages of drug discovery has been well recognized throughout the past decade.1–3 Traditional approaches to using steady-state affinity for triaging compounds at the lead identification (LI) stage use binding thermodynamics as a guide in their structure–activity relationship (SAR)-guided small-molecule synthesis. This approach is, however, proving inadequate without involving the structure–kinetic relationship (SKR). 4 This is because binding thermodynamics assumes equilibrium conditions, which is rarely the case in physiological drug–target interactions. 5 An increasing number of studies are showing how the absolute magnitudes of the second-order association rate constant (kon), 6 first-order dissociation rate constant (koff), and residence time (1/koff), indicating the lifetime of the drug–target complex, are dictating real physiological outcomes rather than ratiometric equilibrium constants.7–13 This becomes all the more pertinent in open systems, as is the case with living organisms, where several competing factors like pharmacokinetics, pharmacodynamics, target half-life, and so forth convolute the landscape of drug–target interactions.14–19 Furthermore, projects optimizing for covalent inhibitors have been wrongly using a time-, affinity-, and substrate concentration–dependent parameter like IC50 as a metric to drive SAR. The ideal parameter to estimate for covalent inhibition would be the second-order rate constant kinact/KI, given the time-dependent potency gain displayed by this class of inhibitors. 20 A typical affinity-based project cascade that is potency driven can underestimate a chemical series with poor affinity but desirable BK for the target of interest. This can undermine effective LI by ignoring compound series that, on medicinal chemistry intervention, could have delivered both desirable BK and potency. It should be noted that compounds with similar functional activity could have dissimilar BK profiles.16,21 Although BK under turnover conditions is often ignored during the early phase in a typical drug discovery pipeline, acquiring and using this information in early drug discovery can potentially contribute toward decreasing the attrition rate at a later date.5,16
Assay technologies and advanced data analysis tools are available for running biochemical kinetic assays. However, the pharmaceutical industry is still struggling with capturing biochemical kinetic data in a high-throughput fashion. Biochemical kinetic characterization of inhibitors requires quantitative measures of enzyme activity at very short time intervals to capture the time dependence of the reaction rate. Since standard photomultiplier tube (PMT)-based plate readers read one well at a time, the time interval for reading a full 384-well plate is approximately 1.5 min, which is unacceptably long if the experiment requires estimation of time-dependent rates of initial reaction (<5% substrate-to-product conversion) for reactions with reasonable kcat values (turnover in minutes). Furthermore, the resolution of the initial rate representing the first couple of turnovers would be highly valuable in estimating pre-steady-state parameters that shed critical insights into the chemical events happening at the active site. This can be achieved only with greater confluence of data points at those initial time points that cannot be generated with current plate-based readers. Covalent and slow-onset inhibitors showing nonlinear progress curves with distinct initial velocity (v°) and steady-state velocity (vss) phases are yet another example in which confluent data points will aid in capturing the transition from initial to steady-state phase accurately and, in turn, help estimate kinetic parameters with greater accuracy. Lack of points at the zone of transition (from v° to vss) will hamper the precise estimation of kobs and, thus, konapp and koff subsequently. It will also result in inaccurate estimates for the second-order rate parameter kinact/KI. Therefore, laser-based plate readers are limited to low-throughput biochemical kinetic studies.
In a typical SAR-led program, high-throughput screening (HTS) is deployed to identify compounds for subsequent IC50 studies. In a similar way, there is a need for first-pass high-throughput mechanistic characterization for large numbers of compounds to triage compounds for further detailed mechanistic characterization at low throughput. Using several representative kinase protein targets, we have delivered a novel application of a FLIPR (fluorescent imaging plate reader) assay platform to generate high-quality biochemical kinetic data, achieving better confluence than laser-based readers and meeting the demands of mechanistic characterization at the LI stage. In our examples, AssayQuant (Marlborough, MA, http://www.assayquant.com) technology using chelation-enhanced fluorescence (CHEF) by a Sox-containing peptide was used for assaying protein kinase activity, allowing real-time monitoring of kinase activity.22–25 Progress curve analysis was performed using the GeneData Mechanistic analysis package (GeneData, Basel, Switzerland), which facilitated delivery of a high-throughput system by reducing analysis time.
This study, to the best of our knowledge, is the first to demonstrate the use of FLIPR for generating high-throughput kinetic data for various kinase targets at an early stage in the drug discovery process. Furthermore, it demonstrates the importance of collecting confluent data points for precise parameter estimation in an early-stage drug discovery process to enable highly reliable SKR-guided medicinal chemistry.
Materials and Methods
Compound Handling
Known covalent inhibitors of the different kinase targets (kinase 1, kinase 2, kinase 3, and kinase 4) were selected from the AstraZeneca compound collection. Assay-ready compound plates (ARPs) were prepared by acoustically dispensing 18 chosen compounds into a 384-well, black, clear-bottomed microtiter plate (Corning 3544, Corning, Corning, NY). A range of different volumes were dispensed to create 16-point concentration–response curves, 1:1.5 dilution, with a final compound concentration range between 10 µM and 22 nM. All wells were backfilled with the appropriate volume of DMSO to achieve a final concentration of 1% v/v in a 10 µl final assay volume. All ARPs included neutral controls (no inhibition, 1% v/v DMSO) and inhibitor controls (100% inhibition, 20 µM of assay-specific compound) to determine the linearity window of the assay.
Biochemical Kinetic Assay
AssayQuant technology was used to allow real-time monitoring of kinase activity in a continuous and homogeneous assay format. The biochemical assay measured increase in CHEF for quantifying real-time phosphorylation of the Sox peptide, as a measure of kinetic activity.22–25 Working stocks of protein (kinase 1) and substrate mix [AQT (AssayQuant Technologies) peptide + adenosine triphosphate (ATP)] were prepared in assay buffer [20 mM HEPES pH 7.5, 0.005% BRIJ-35, 0.5 mg/ml bovine serum albumin (BSA), 5 mM MgCl2, and 5% glycerol]. 5 µl/well of substrate mix was dispensed, followed by 5 µl/well of protein mix into ARPs using the tips on FLIPR or using Certus FLEX, a liquid dispenser. When Certus FLEX was used to dispense the reaction mix, the plate was immediately sealed (Microseal ‘B’ PCR Plate Sealing Film, cat. no. MSB1001, BIO-RAD, Hercules, CA) and briefly centrifuged at 300 ×g prior to measuring fluorescence intensity (FI) using FLIPR, with kinetic measurements taken every 10 s for 360 reads. Final assay concentrations of kinase target 1, AQT peptide, ATP, and DMSO were 100 nM, 10 µM, 90 µM, and 1%, respectively. Note that the concentration of the AQT peptide used was much lower than its Km value since, at higher concentrations, the peptide either interferes with assay signal and/or results in enzyme inactivation, making it difficult to estimate its Km for the enzyme (
FLIPR Tetra Data Acquisition System
The biochemical kinetic assay was monitored using the 384 FLIPR Tetra, a high-throughput kinetic screening system with a high-sensitivity charge-coupled device (CCD) camera capturing FI recordings in all 384 wells simultaneously. The flexibility of the incorporated SoftMax Pro software (Molecular Devices, San Jose, CA) allows specific parameters to be chosen in the protocol to enhance assay performance and sensitivity. The assay was run using the following modified protocol: The FI was measured at 360 nm ± 20 nm excitation (Ex) / 545 nm ± 30 nm emission (Em), gain: 40; exposure time: 30 s; and excitation settings: 80% with read time intervals every 10 s for 360 reads. Following the completion of the run, substrate bias-corrected data were automatically exported into an assigned folder configured in the Auto-Export settings.
Data Analysis
Preliminary visualization of progress curves was done using ScreenWorks software associated with FLIPR. Kinetic raw data were analyzed using the GeneData Mechanistic analysis module. Neutral (100% activity) and inhibitor (0% activity) controls were used to assess signal window and assay linearity. To eliminate background noise, data were normalized by subtracting the average of inhibitor controls from the whole dataset. Normalized data were used for progress curve analysis to compute k3/KIapp (apparent kinact/KI) for a two-step analysis layer or k1 (apparent kinact/KI) for a one-step analysis layer. Automated data importation followed by fully interactive analysis significantly reduced the time required for data analysis, contributing to the purpose of delivering a high-throughput system. For low-throughput analysis, GraphPad Prism (version 8.1.2, GraphPad, San Diego, CA) was used.
Determination of kinact, KI, and kinact/KI from Total Progress Curve Analysis
The following scheme represents both covalent irreversible inhibition and slow-onset inhibition that results from either binding and covalent bond formation or from binding, isomerization, and subsequent trapping of the inhibitor to the target site on the enzyme: 8

where E and I are free enzyme and inhibitor, respectively; EI is the non-covalent complex between enzyme and inhibitor; and EI* is either the covalent complex or the isomerized complex in which the inhibitor is trapped. The rate constant k2 is equivalent to kinact in the case of covalent irreversible inhibition. k−2 would be zero for all practical purposes for covalent irreversible inhibitors and extremely slow for slow-onset inhibitors.26,27 KI, inhibitor concentration at the half-maximal inhibition rate, when all the inhibitor is complexed with enzyme, is defined as (k−1 + k2) / k1. This reduces to the equilibrium dissociation rate constant Ki (k−1/ k1) when the maximum rate of inactivation is extremely slow compared to the rate at which EI dissociates to E and I, respectively. Complete progress curves were generated and fit to Equation (1) for data generated using covalent inhibitors.

The kobs estimated from this fit was plotted as a function of inhibitor concentration, and the resultant data points were fit to Equation (2) for two-step covalent inhibition to extract kinact and KI.

Although covalent irreversible inhibition is most often a two-step process, oftentimes the curve of kobs versus [I] appears linear for reasons that have been extensively discussed elsewhere. 8 Briefly,

When the value of kinact is far less than koff (weak inactivation), the term can be ignored in the denominator, and kinact/KI is equal to (kon × kinact) / koff (or kinact/Ki). Under these conditions, the kobs versus [I] plot would appear linear because achieving inhibitor concentration that would yield maximal inactivation, and thus the zero-order phase of the curve, would be untenable. On the other extreme, when kinact is far greater than koff (both binding and inactivation are potent), the koff term in the denominator can be ignored and that would make the kinact/KI term equal to kon. In this latter case, too, the kobs versus [I] plot would appear linear because at high inhibitor concentrations, there would be potent inhibition, making it difficult to estimate the correct kobs from fits to the data. Any case in between the above-mentioned extremes would yield nonlinear hyperbolic plots for the kobs versus [I] plots (exceptions to this exist). When the plot appeared linear, the experimental data points were fit using linear regression with the slope of the line, providing an estimate of the ratio between kinact and KI (kinact/KI). 28 Care has to be exercised, however, to ensure that the inhibition is covalent and irreversible in nature (and not slow onset), using orthogonal measurements before applying this analysis.
For reversible equilibrium inhibition, the primary plots (signal vs. time) are linear (no time-dependent inhibition), and the secondary replots of kobs versus [I] are horizontal and flat at the bottom, indicating that there is no transition from initial velocity to steady-state velocity as a function of time (
Results
The main objective for an assay development effort is to standardize reaction conditions that can identify modulators of an enzyme’s activity, providing detailed insights into their mode of action vis-à-vis the target in a cost- and time-effective manner. A robust assay should show the traits of being sturdy, homogeneous, linear, and cost-effective with a threshold expense per well that is well within the project’s budget and is capable of handling the number of compounds that is aimed to be tested. Furthermore, it should have a variability coefficient of less than 10% and a signal–noise ratio higher than 8, should yield assay output within a reasonable window of time, and should confer clearly quantifiable benefits compared to currently existing methodologies (
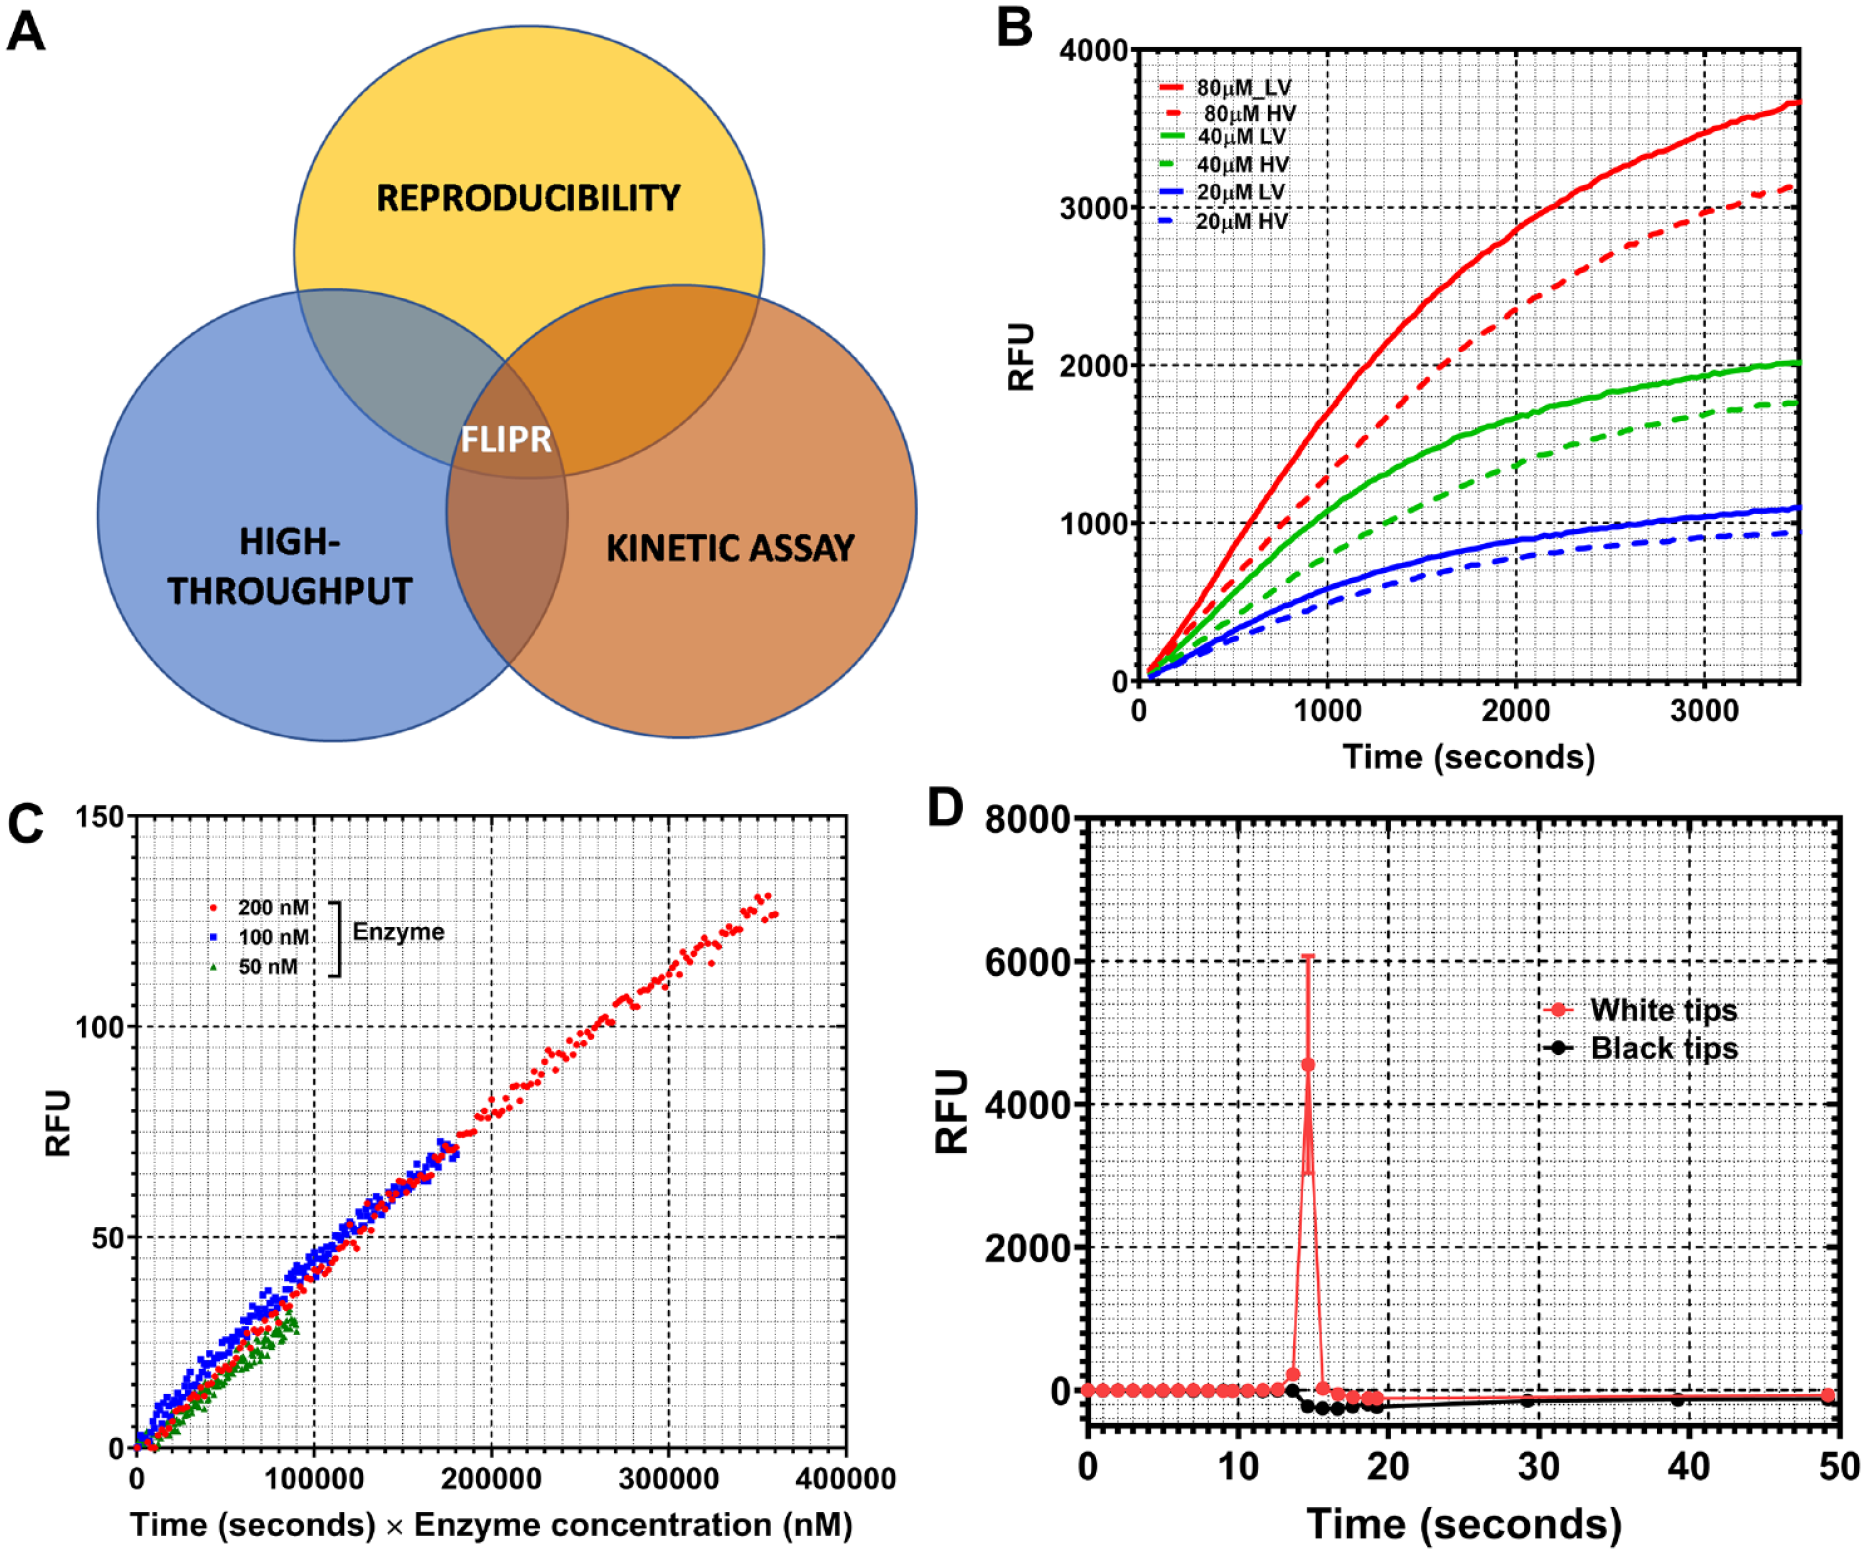
Assay optimization for structure–kinetic data-driven medicinal chemistry. (
Assay Development
Often, biochemical assays providing kinetic information suffer from the disadvantages of not being compatible with high-throughput format. We have developed a FLIPR Tetra–based assay as a means to overcome this limitation. FLIPR Tetra is often used for high-throughput cellular screening. Although a couple of studies have implemented a functional drug-screening system (FDSS) for biochemical assays in the HTS format,
29
to the best of our knowledge none have reported the application of FLIPR Tetra for biochemical assays. Moreover, most of the assays reported using FDSS are point measurements with very insignificant, if any, kinetic aspect to them. The assay was standardized with the cytosolic domain of kinase target 2, a receptor protein tyrosine kinase. The assay development phase was aimed at optimization of several different parameters. Conventionally, high-volume 384-well plates (100 µl maximum and 20 µl minimum volume) are used in FLIPR for carrying out cellular assays. These volumes are incompatible, however, with biochemical assay setup from the cost (monetary and reagent) perspective. Hence, optimization of the assay with low-volume 384-well plates was undertaken and was geared toward making the assay compatible with high-throughput format to develop a generalized applicability for expensive reagents used in biochemical assay settings. After initially assessing whether the biochemical assay yielded the necessary signal–noise ratio using standard high-volume plates, it was miniaturized to low-volume plates (50 µl maximum volume), and the assay was run in a total volume of 10 µl.
Figure 1B
shows the progress curves for the high-volume and low-volume formats obtained with 10 nM of kinase 2 enzyme at several different substrate concentrations (80, 40, and 20 µM, respectively). As can be seen, the signal intensity across the two different plate formats was comparable within experimental variation. In fact, the low-volume format showed slightly better signal–noise ratio compared to the high-volume format (
Progressive inactivation of protein is an important parameter to be optimized in an assay optimization exercise. Often, the nature of the plate used can have important implications for enzyme inactivation and, thus, assay stability. Selwyn’s test 30 was carried out to assess whether there was any protein activity loss as a function of the newly implemented low-volume plate format. In this assessment, velocity is plotted as the product of time and enzyme concentration. Any evident nonlinearity of the plots as a function of enzyme concentration variation would be indicative of protein inactivation. Figure 1C shows the outcome of Selwyn’s test for kinase 1. As is evident from the figure, there is no significant nonlinearity as a function of protein concentration variation for kinase 1, indicating that the protein does not lose activity as a function of time with low-volume plates.
Different tip types with specific coatings can have significant carryover (CO) effect and potential for assay interference and irreproducibility. 31 This becomes all the more pertinent if the FLIPR tips are used for dispensing the assay mix for simultaneous “add and read” application. Given the low-volume nature of the FLIPR-based assay, two different tip types were assessed for their effect on the assay outcome. Figure 1D shows the results for assay signal readout using black and white tips, respectively. As is evident from the figure, white tips gave rise to an artefactual spike in the signal, while black tips did not show any spikes, indicating minimal signal interference by the latter vis-à-vis the former. It is likely that the white tips interfere with the excitation source because they pipette into the reaction plate that is read through the bottom.
Most HTS exercises and kinetic characterization of inhibitor mechanism-of-action (MoA) studies are undertaken by dissolving the compounds in the aprotic solvent DMSO that is capable of dissolving both polar and apolar compounds. This is optimal given that pharmaceutical companies screen millions of different compounds during their initial HTS exercise, and use of DMSO as the base solvent helps maintain invariability across the screen. This is irrespective of the fact that DMSO could act as an inhibitor of some enzymes.
32
It was observed that some reaction progress curves showed a signal discontinuity when monitored in the presence of DMSO in the reaction mix (
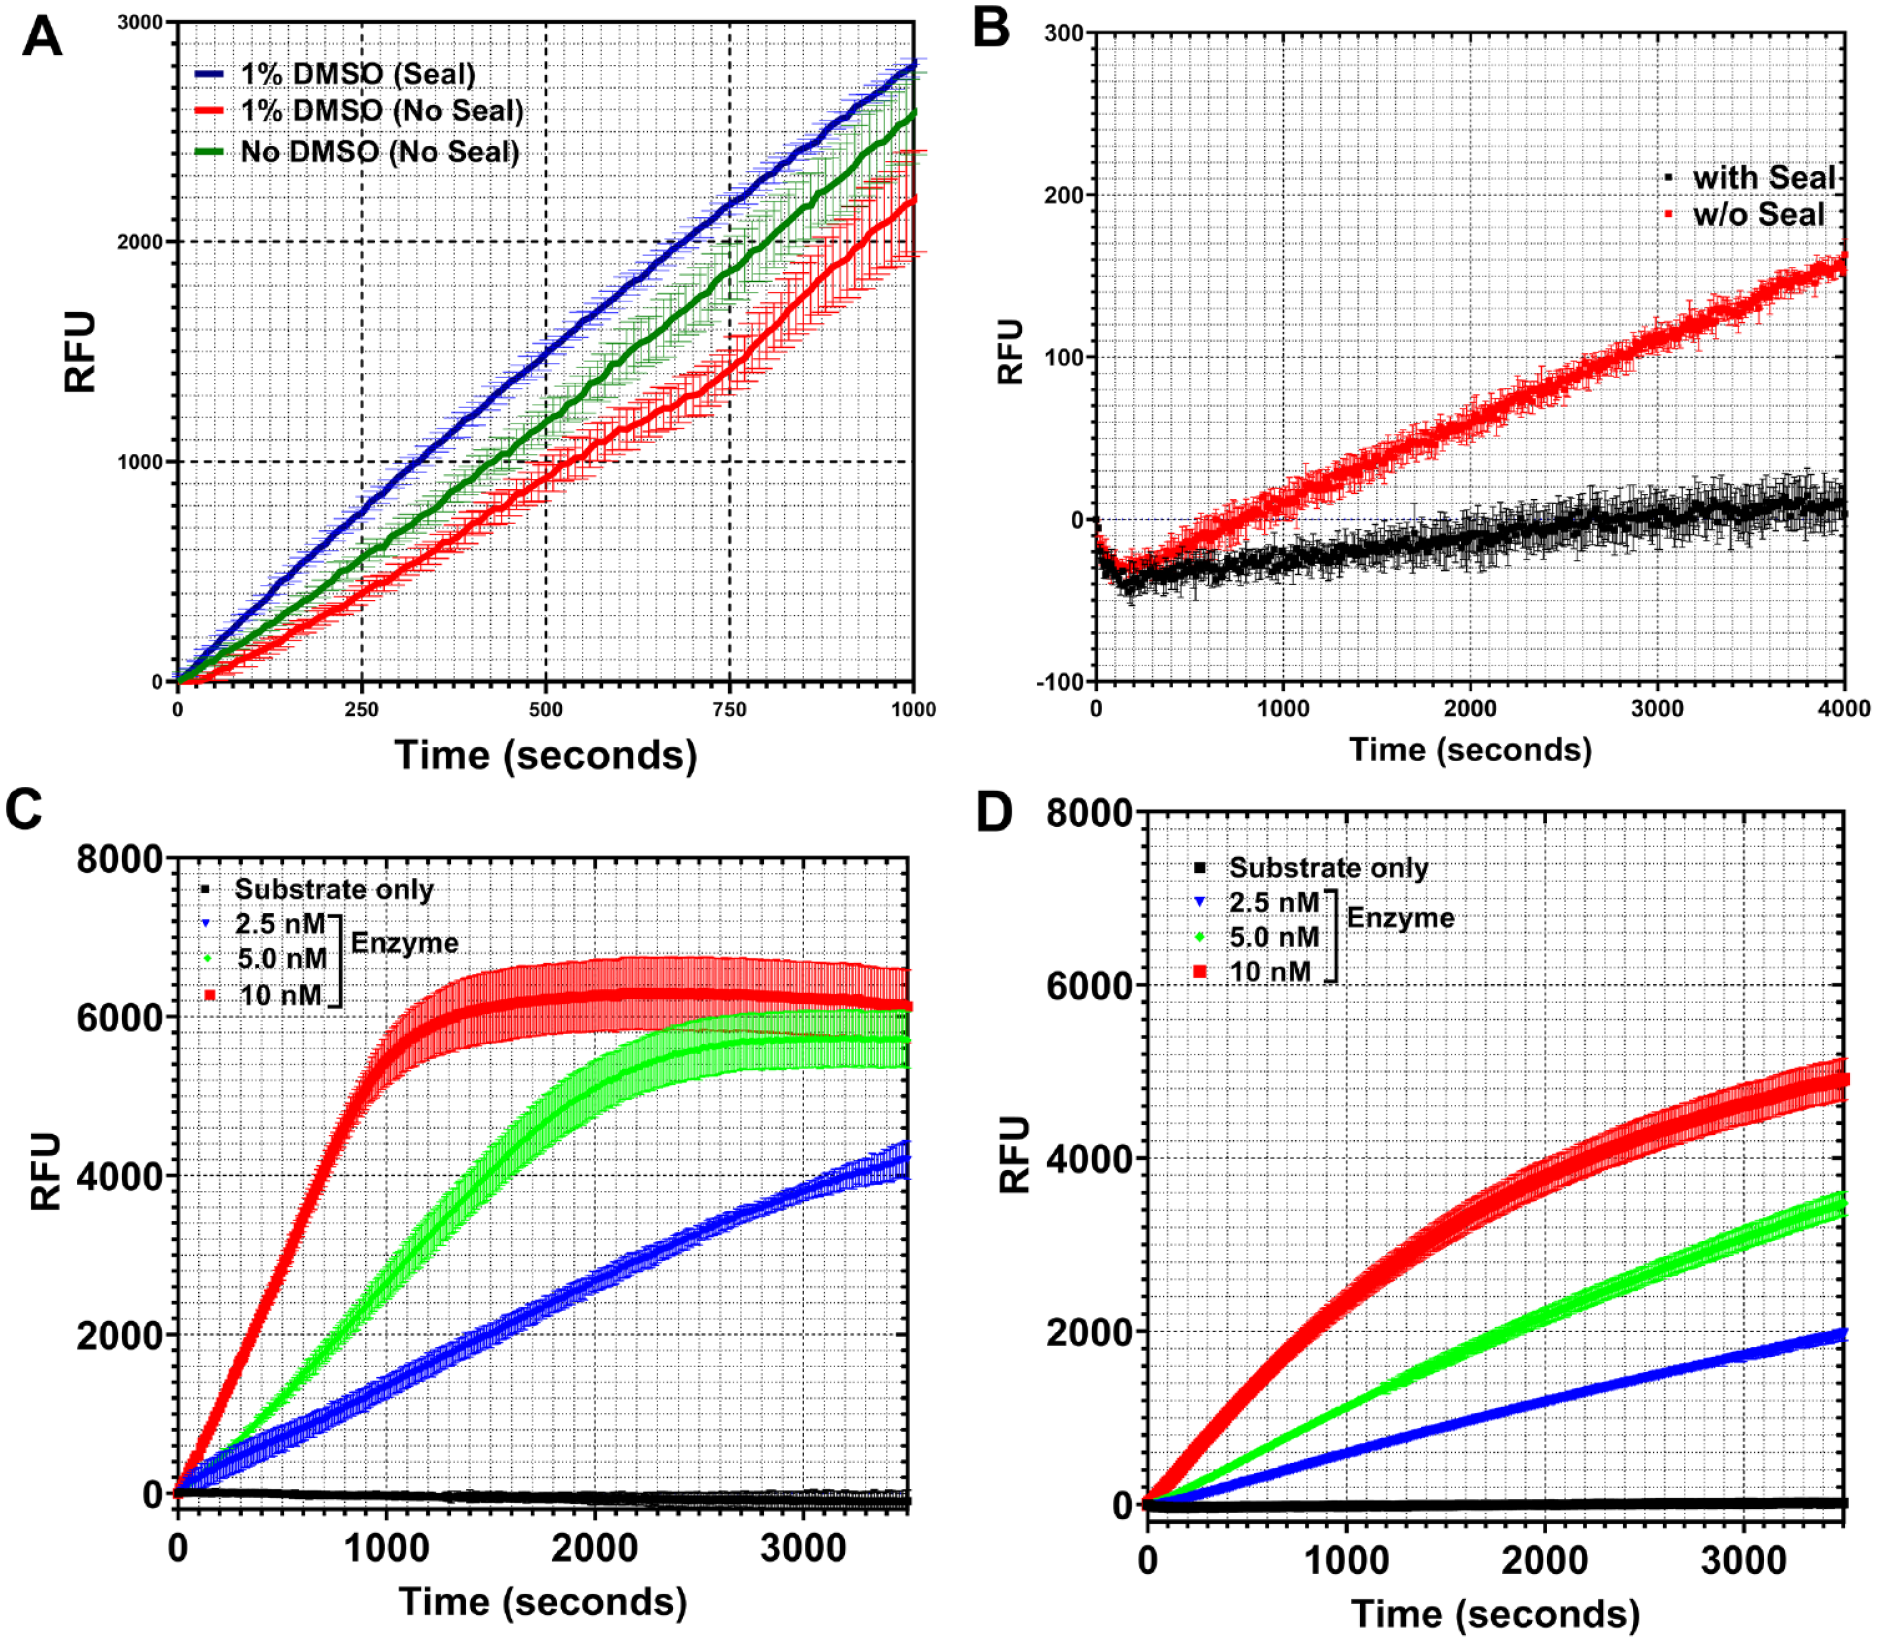
Assay optimization for structure–kinetic data-driven medicinal chemistry. (
Signal saturation is an essential parameter to optimize to ensure that the assay is carried out within a reasonable window for reproducibility. Signal saturation is usually very well defined and sharp in other readers (PheraStar FSX, BMG Labtech, Offenburg, Germany; and EnVision, PerkinElmer, Waltham, MA). A unique feature of monitoring assays on FLIPR is the deviation from sharp signal saturation. In FLIPR, the signal saturation is very gradual and variable, starting its deviation from linearity higher than 4000 signal counts. Initial observation of nonlinearity in reaction progress curves led the authors to suspect potential substrate depletion or product inhibition. The outcome from carrying out the assay under identical conditions at high-excitation settings (50 Gain, 0.4 Exposure, and 100% intensity) and low-excitation settings (50 Gain, 0.1 Exposure, and 50% intensity) at different concentrations of enzyme, however, refuted the above suspicion (
Optimization efforts were validated with parallel investigation of the same dataset using conventional biochemical readers (PMT readers; data not shown).
Assessment of Assay Platform Implementation for Various Kinase Targets
An assay platform development effort should invest considerable time and effort in demonstrating the generality of the setup in a target-agnostic manner among several therapeutic functionalities. To demonstrate the generality of the FLIPR-based approach, as a first step, we used it on several different kinases to generate biochemical kinetic data. Prominent distinct kinase targets anonymized as kinase 1, 2, 3, and 4 were assayed at various concentrations of their respective inhibitors with AssayQuant technology.
Figure 3
shows the progress curves for the various kinases at several different inhibitor concentrations (
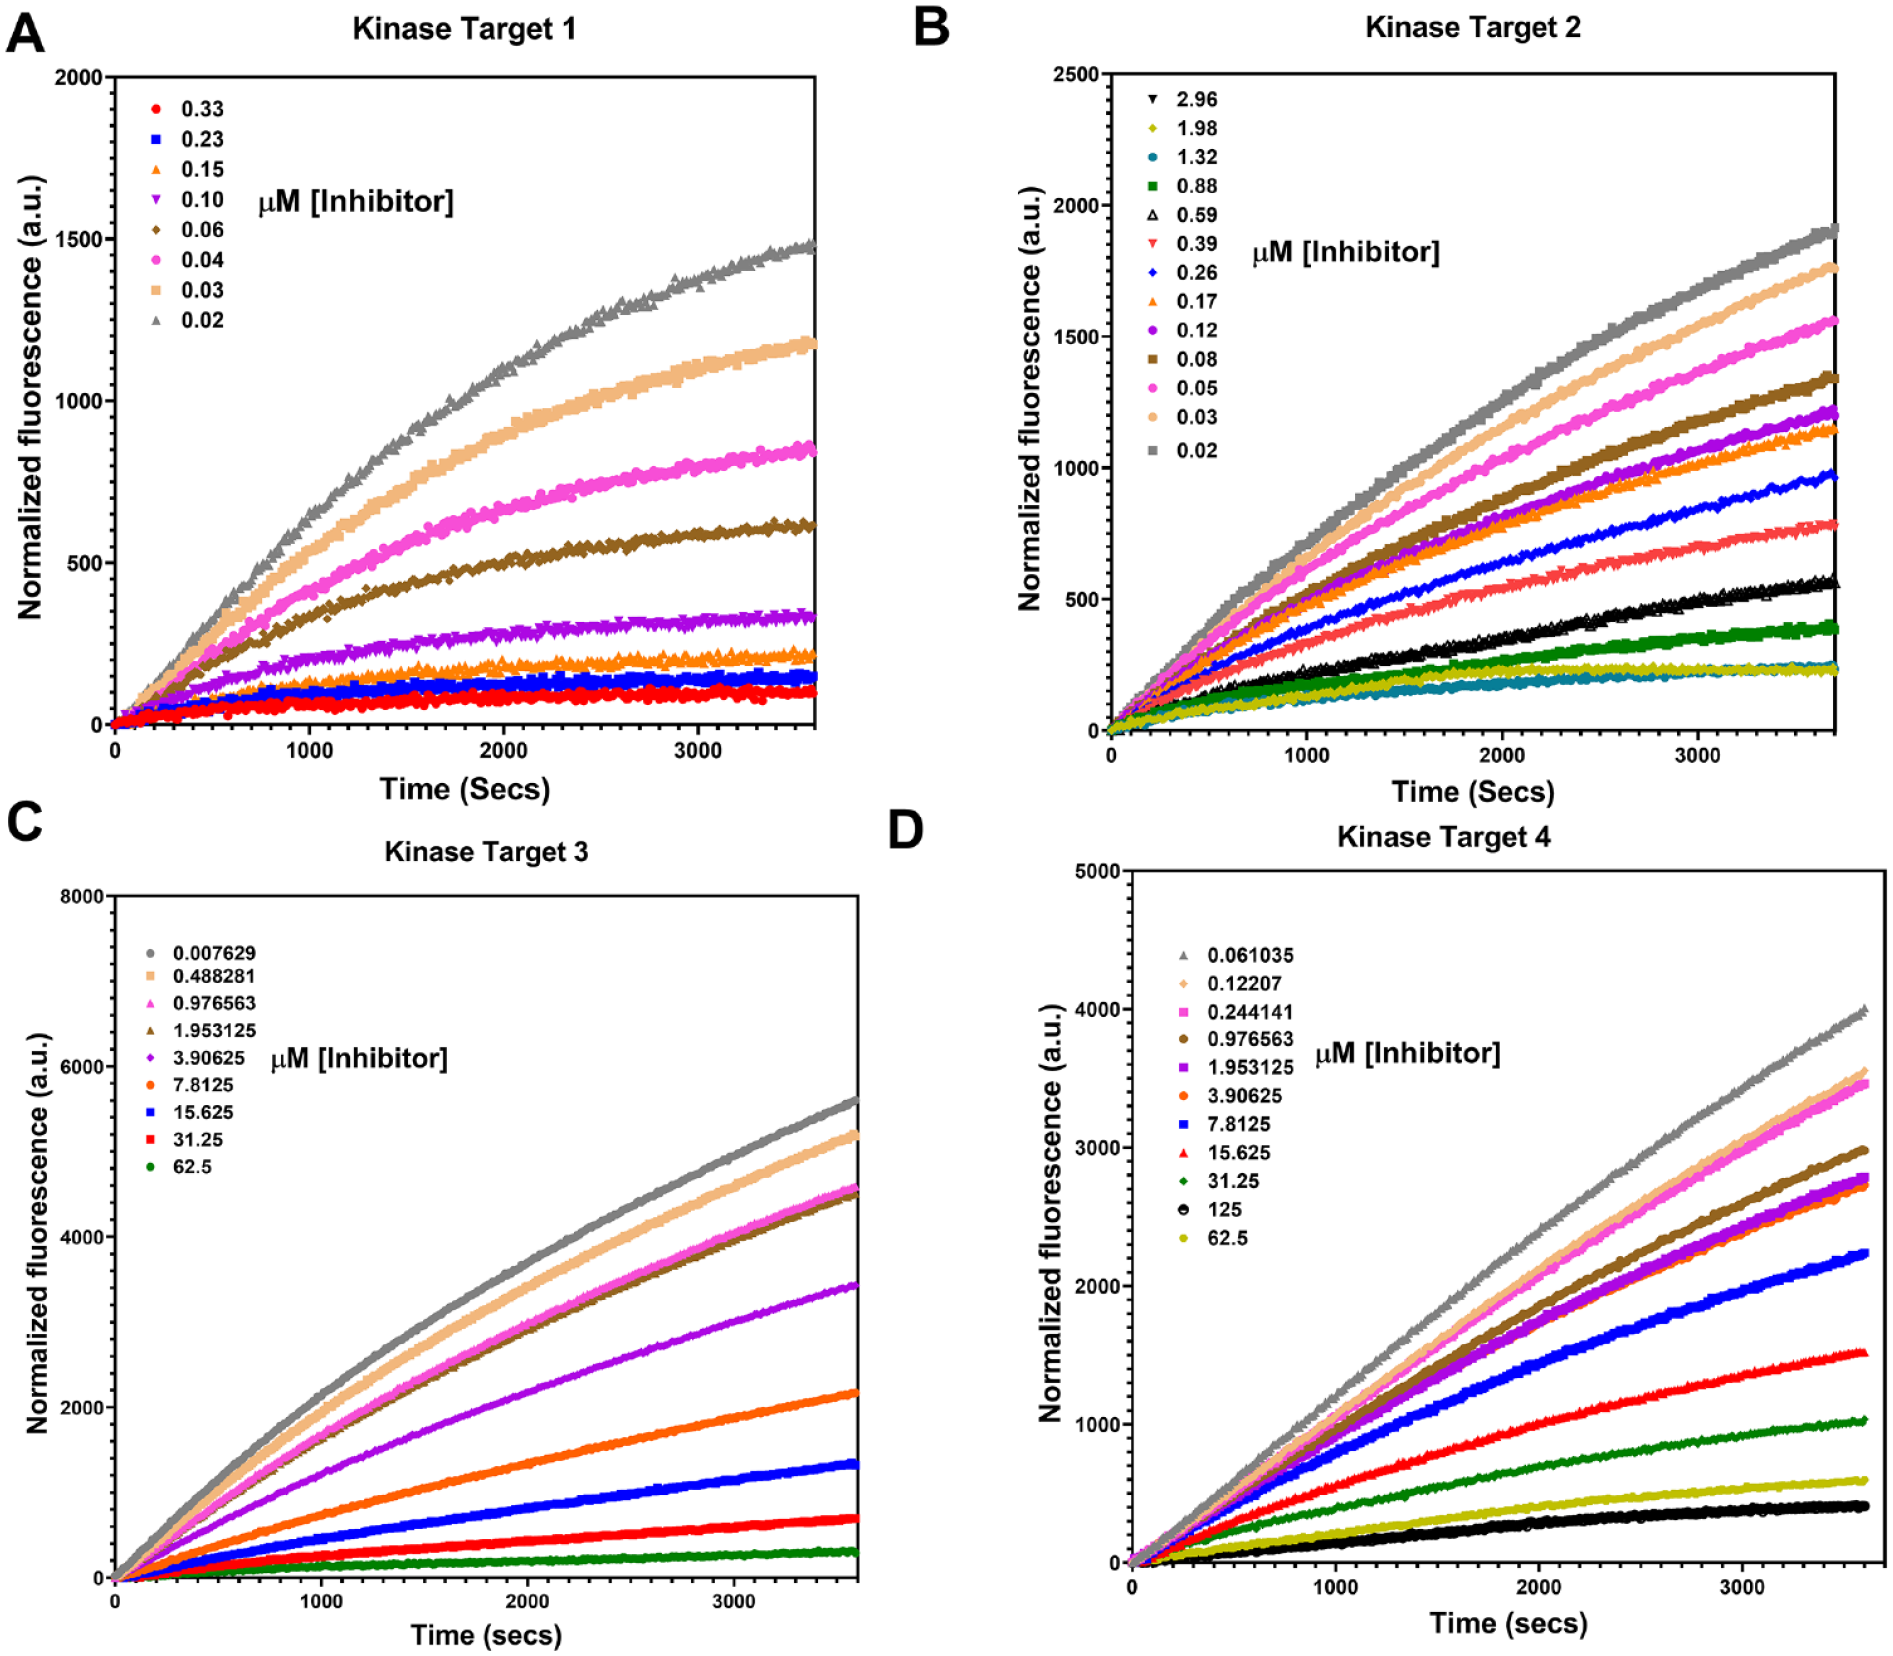
Assessment of a fluorescence imaging plate reader (FLIPR) Tetra–based assay as a target-agnostic platform for several different targets: (
Low-Throughput Kinetic Parameter Estimation from Full Progress Curve Analysis and Need of Confluent Data Points for Accurate Parameter Estimation
Low-throughput kinetic parameter estimation was performed using methods indicated in the Materials and Methods section. The reaction progress curves at several different concentrations of the inhibitors were fit using Equation (1) to extract the parameter kobs that provides a measure for the rate of transition from the initial velocity to the steady-state velocity as a function of time-dependent inhibition shown by covalent or slow-onset inhibition. For the former case, the steady-state velocity can be constrained to zero, while in the latter, it is >0 but <vi. The kobs values were plotted as a function of inhibitor concentration, and the resultant experimental data points were fit using linear regression and Equation (2) simultaneously to see whether they conform to either the one-step model or two-step model, respectively, when assessing covalent inhibitors. Appropriate model selection was made based on model comparison using statistical tests like the non-nested Akaike’s Information Criterion (AIC)
33
or nested extra sum-of-squares F test
34
in GraphPad Prism. Depending on the model, we obtain either kinact/KI as a composite term (slope of the line) for a one-step model or individually resolved values of kinact and KI for a two-step model. The resolution helps in guiding the chemists with individual optimization of both chemical reactivity of the warhead and the apparent binding magnitude embedded in the KI term for the covalent inhibitor or lead molecule. The experimental data showed that there was time-dependent loss in reaction velocity in addition to the concentration dependence of inhibition (
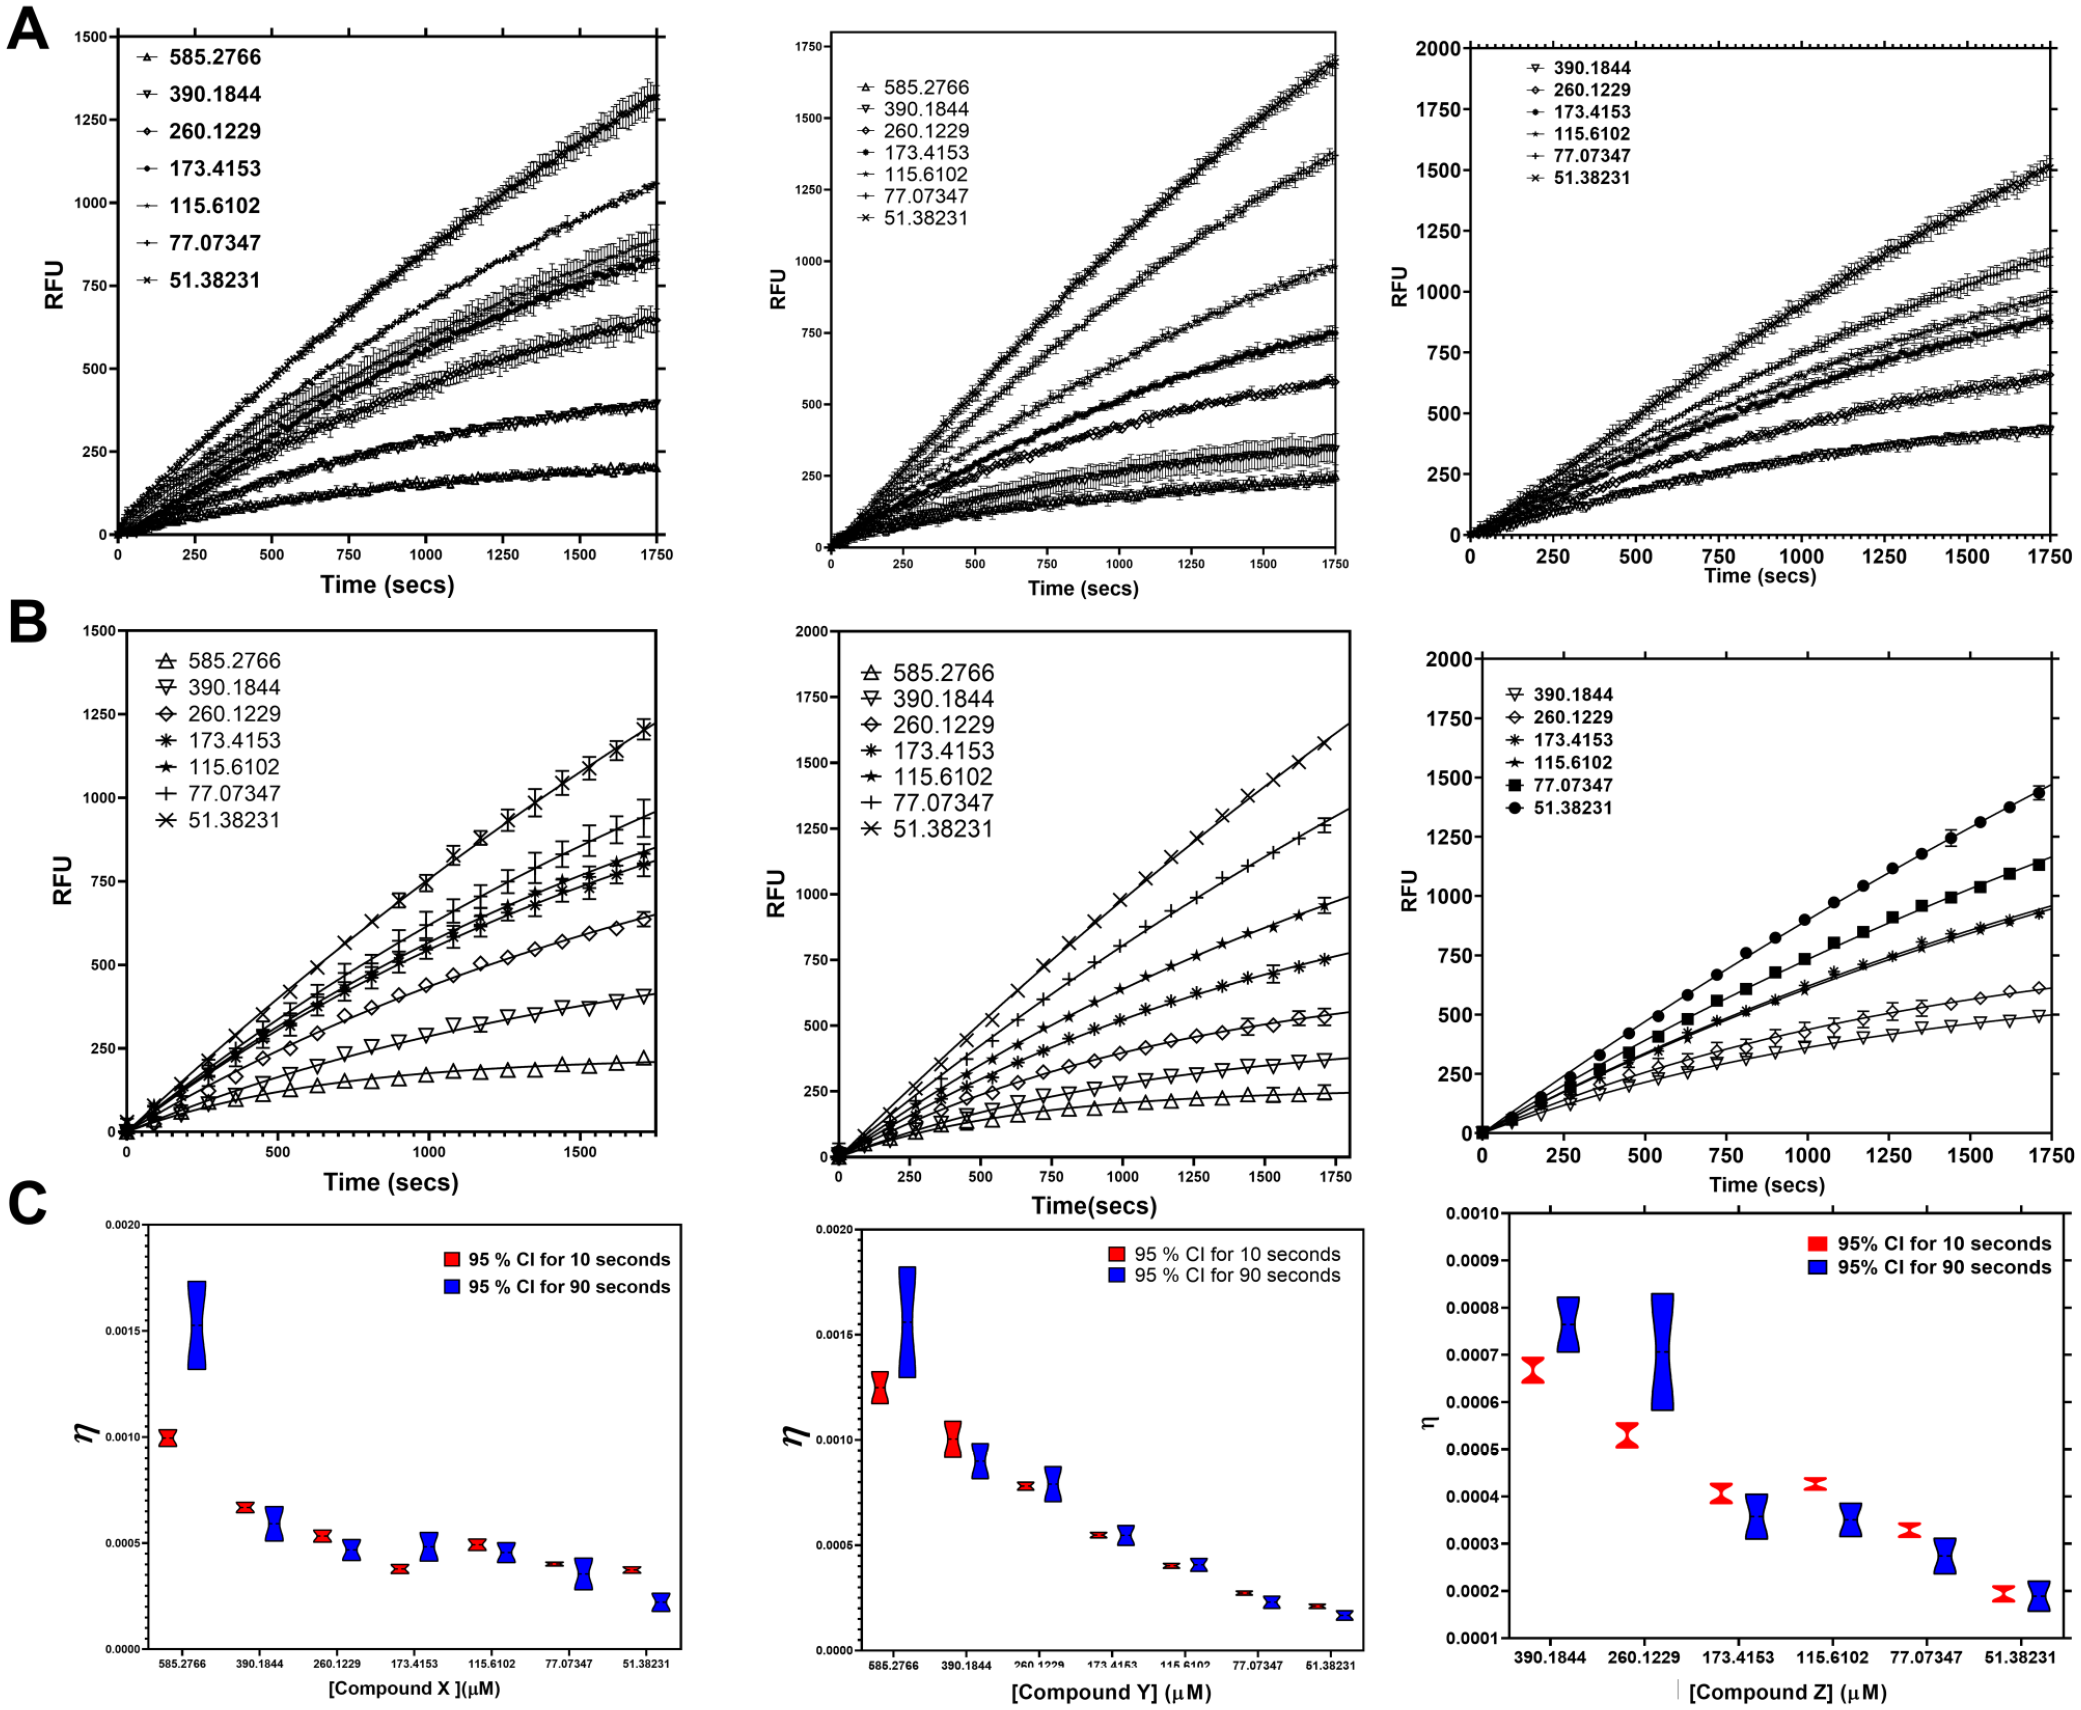
The contribution of data confluency to parameter estimation. (
As discussed above, covalent compounds and compounds with slow onset of binding usually show nonlinear progress curves distinguishing the binding step from the inactivation and conformational reordering steps, respectively. The confluence of data points at the zone of transition determines, to a large extent, the validity of kobs and, subsequently, konapp and koff derived from secondary replots. With this knowledge, we attempted to assess the data obtained from FLIPR Tetra at two different time intervals. The analysis was performed for three different compounds at 14 concentrations each. The time course measurements were carried out with four technical replicates at 10 s and 90 s confluence, respectively. Compound concentrations yielding zero activity as a function of time were eliminated for reliable global fits. The time courses were fit to Equation (1) for nonlinearity as a result of inhibition for both the 10 s and 90 s confluency data (
A typical progress curve for an inhibitor comprises a quantitative measure of enzyme activity plotted against time at continuously varying concentrations of inhibitor. As discussed above, the quality of the progress curve and the analyzed data improves by reducing the time interval of the kinetic reads. Standard PMT-based plate readers read one well at a time, and therefore for reading a full 384-well plate, the shortest time interval is usually ~1.5 min, which is unacceptably long. Likewise, a full 1536-well plate would be read in roughly 6 min on standard PMT readers. Using standard PMT-based plate readers, only three rows of a 384-well plate were read continuously to reduce time intervals to ~30 s per read. A maximum of four compounds (16 points) could be accommodated in three rows of a 384-well plate, limiting the throughput of biochemical kinetic assays. In contrast, the CCD camera within FLIPR captures whole-plate-level data per read, which allows reducing the time interval to as low as 1 s per read irrespective of the plate type, whether 384- or 1536-well. FLIPRs have been used extensively for cell-based assays for many years, but their application to biochemical kinetic assays for determination of mechanistic parameters like kinact/KI has never been reported. The current study validated FLIPR for biochemical kinetic assays based on 384-well plates and AssayQuant technology. The FLIPR method reads whole plates comprising 18 compounds every 10 s, whereas standard PMT readers could not accommodate more than one compound (16 points) in a 10 s time interval. Therefore, an 18-fold increase in throughput is achieved using FLIPR as a reader.
High-Throughput Data Analysis and Reporting in the GeneData Package
Raw data SEQ. files were automatically exported from FLIPR in a fixed format compatible with a FLIPR GeneData kinetic parser. Data files were imported into a predefined GeneData template for calculating kinact/KI values of covalent inhibitors of kinase target 1. Data quality was assessed using signal intensity, linearity, and variability of progress curves from both neutral controls (100% activity) and inhibitor controls (100% inhibition). Data were normalized for background noise by subtracting the average of inhibitor controls from the whole dataset. The template is defined with equations for both one-step and two-step binding, which calculate the observed rate constant (kobs) for all 16 concentrations (10 µM–0.0175 µM) of a particular inhibitor. As a standard practice, kobs values for progress curves showing full or no inhibition were invalidated. The shape of kobs versus [Inhibitor] was visually examined to decide one-step or two-step binding. Efforts are ongoing, however, to remove the subjectivity of this analysis by instituting appropriate statistical parameters to assess the curves, such as AIC- or F test–based assessments, as indicated elsewhere in the article.
Figure 5 shows a screenshot of visualization from a standard GeneData analysis session. On the top right, a plot named “Kinetic Traces” shows visualization of progress curves for a 16-point serial dilution of a tested inhibitor compound. Concentration-dependent reduction in signal intensity is evident without any noticeable increase in noise. Plots named “Local 1-step” and “Local 2-step” show kobs for all progress curves against inhibitor concentration, fit to the one-step and two-step models, respectively. In this case, the central panel shows a compound showing one-step behavior, and the panel on the extreme right shows a compound showing two-step behavior. The models were confirmed by fits to a one-step model (line) or by a hyperbolic fit in the “Local 2-step” plot. Likewise, kinact/KI values of all 18 tested inhibitors preferring either the one-step or two-step model were determined.
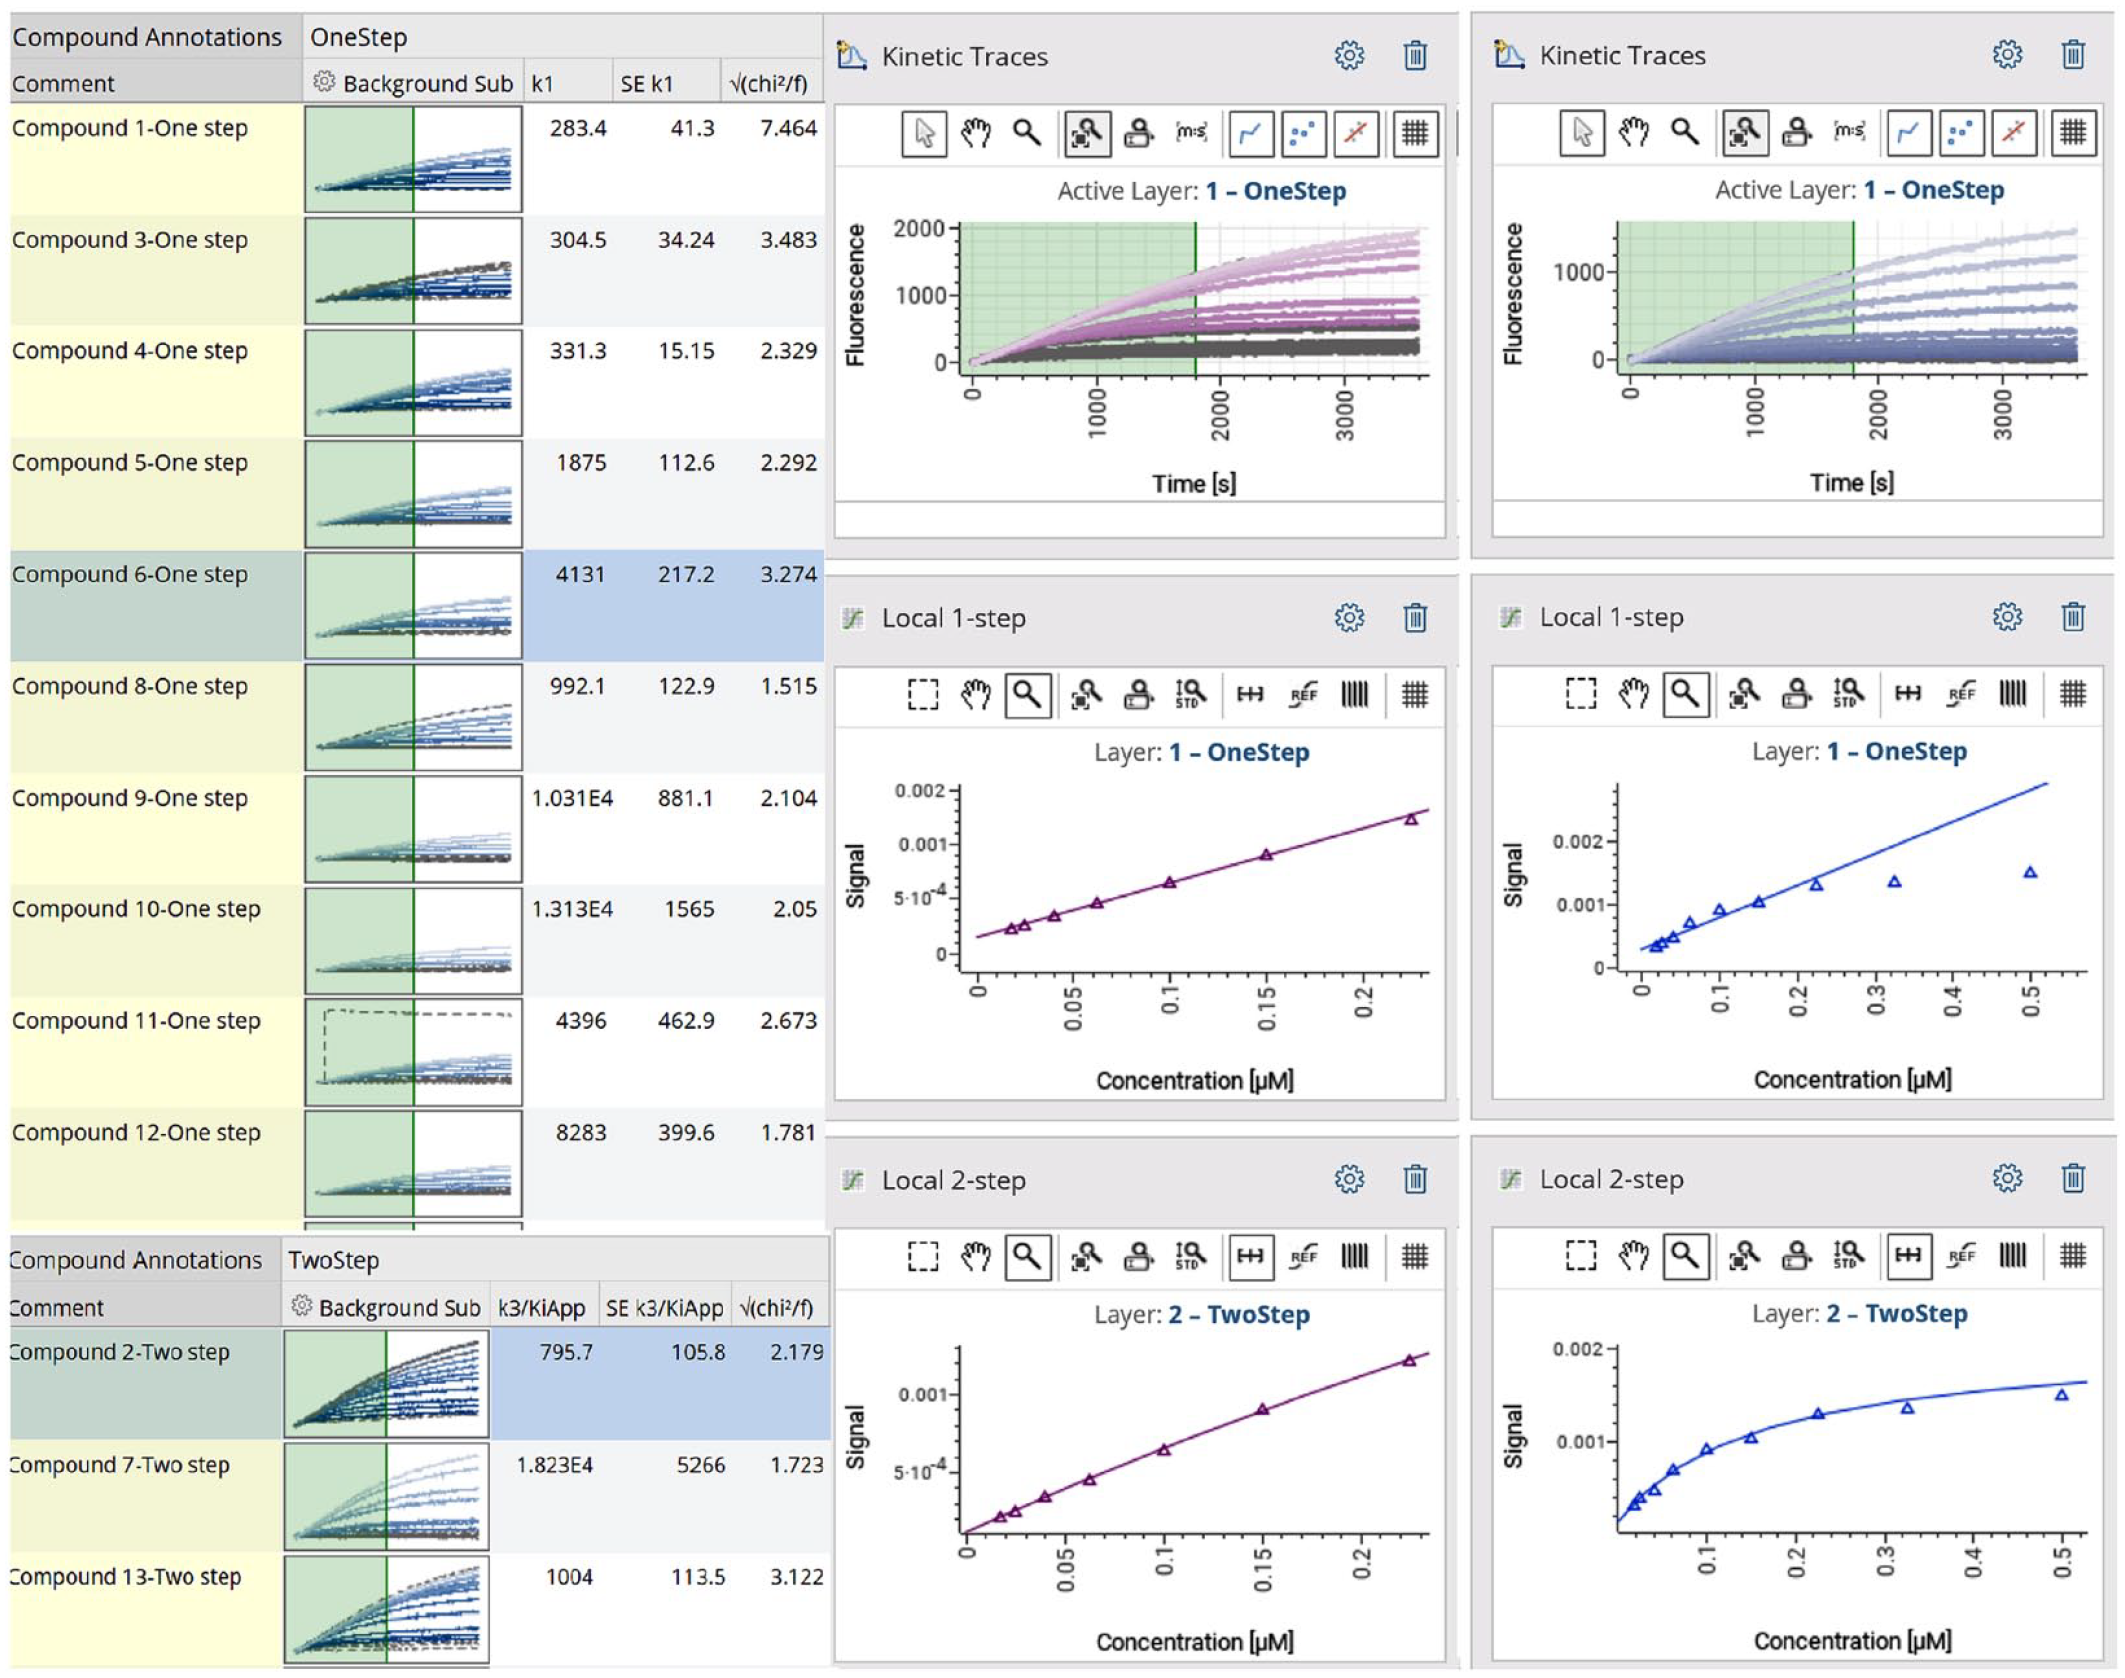
A snapshot of the GeneData session showing high-throughput analysis of the data generated by fluorescence imaging plate reader (FLIPR). The left panel shows the progress curves of the enzyme’s conversion of substrate to product as a function of varying inhibitor concentrations. Two different layers are used to analyze the data as either one-step or two-step inhibition, respectively. The right panel indicates secondary replots of the kobs as a function of inhibitor concentration for inhibitors showing one-step and two-step inhibition, respectively. For one-step inhibition, the notation k1 indicates the slope of the line and gives the kinact/KI value. For two-step inhibition, the notation k3/Kiapp indicates the parameter kinact/KI.
Assay reproducibility was investigated by comparing kinact/KI from four independent occasions, as listed in Table 1 along with mean ± SEM (standard error of the mean) values. Low standard errors among a broad range of kinact/KI values (50 M−1s−1 to 15,000 M−1s−1) confirmed excellent assay reproducibility.
kinact/KI from Quadruplicate Biological Tests to Establish the Reproducibility of the Fluorescence Imaging Plate Reader (FLIPR) Tetra–Based Assay Format.

Discussion
Assays are a vital part of biomedical research. Design, assembly, and execution of an assay that is sturdy, sensitive, and capable of detecting a specific metabolite accurately play an important part in the modern drug discovery process. 35 It is pivotal that, apart from the core aspects of the assay, a systematic work plan is instituted that takes into consideration aspects such as sample preparation and the data analysis pipeline. Moreover, a strong balance would have to be achieved between data fidelity and the high-throughput nature of the assay. Here, we have specifically implemented FLIPR as a platform to perform high-throughput kinetic assays. FLIPR was initially developed with an aim to carry out quantitative screening for cell-based kinetic assays.36–38 FLIPR has been used in applications, such as estimation of intracellular calcium concentrations, G protein–coupled receptor (GPCR) and ion channel activity, changes in intracellular pH, and membrane potential.39–41 The unique aspect of FLIPR that has been exploited extensively in the current work is that all the wells of a standard microplate are primed and optically measured simultaneously. Data from all the wells can be obtained in less than 1 s, allowing for transient signals to be quantified. This feature is an absolute must for carrying out kinetic studies requiring the acquisition of highly confluent data points in a time-dependent manner.
There is an increased appreciation for incorporating biochemical kinetic data in early drug discovery. This is done with the intent of integrating the BK of the drug with its pharmacokinetics and pharmacodynamics to get a unified perspective on how the drug molecule navigated through its ingestion, incorporation, interaction, and clearance (I3C) cycle to bring about the desirable therapeutic outcome. This has been exemplified by an increased research thrust within the pharmaceutical industry to achieve this objective and efforts at establishing academia–industry incubators to accelerate the innovation of new toolkits for its speedy realization. A prominent example is the Kinetics for Drug Discovery (K4DD) consortium funded by the Innovative Medicines Initiative (IMI) in partnership with major pharmaceutical companies. 21
An appreciation for the kinetics of target–inhibitor interaction would inform the rational optimization of leads as drugs. This is exemplified by two relevant case studies given here. First, let us assume a case in which the clearance (pharmacokinetics) of the drug from the system is rapid, while sustained target engagement is a desirable trait for disease amelioration or dosing decisions. A program optimizing for drug residence time (very slow koff rates) would essentially decouple pharmacodynamics from pharmacokinetics, resulting in longer residence time (1/koff) of the drug on the target (conferring the needed therapeutic modality) and, thus, optimal and desirable pharmacological benefits. A prominent example of this is the drug desloratadine. Desloratadine is a Histamine H1 receptor antagonist that is approved for the treatment of hayfever. The beneficial effect of desloratadine is because of its long residence time (190 ± 40 min). 42 The second case study is of drug molecules that show target interaction-mediated toxicity. In this case, optimizing for drug molecules with fast on and off rates, respectively, would yield the desirable benefits of reducing toxicity and faster clearance. An example of the above modality is quetiapine. The drug is an antagonist for the dopamine D2 receptor that is administered for treating schizophrenia and bipolar disorders. An extremely slow koff rate, leading to prolonged drug target residence time, can lead to undesirable clinical outcomes of drug administration revealed as movement disorders (muscle contraction, spasms, etc.). In retrospect, it is known that quetiapine is a successful drug to treat this condition because of its reasonably fast koff rates that prevent the undesirable side effects, while being an effective cure for blocking D2 receptors. Hence, knowledge on, and incorporation of, the SKR between a small molecule and its target’s interaction are absolute requirements for the success of a small-molecule therapeutic modality in a clinical indication-oriented manner.
We believe that implementation of the FLIPR-based assay platform for generating kinetic data will improve the throughput significantly, supporting drug discovery projects with this critical information at an early stage in the drug discovery process. The optimization efforts reported in this article were done with a 384-well plate format. Going forward, we would like to implement this with 1536-well plates. This has the distinct advantages of further reducing the volume of the assay and increasing the throughput significantly, while at the same time greatly increasing the assay confluence compared to the PMT-based plate readers (note that in PMT-based detectors, the confluence between subsequent data points cannot be less than one per 6 min if used at full-plate capacity). Furthermore, with the 384-well-based assay format, we use low settings within FLIPR to avoid signal saturation. We hypothesize that reduced volume or concentration of the analyte in 1536-well plates will be sufficient to generate sufficient signals in a high-setting mode for the ChEF assay. In contrast, care would have to be exercised when undertaking other types of fluorescence-based assay readouts with the 1536-well plate format. The reduced amount of the fluorophore (because of lesser reaction volumes) coupled with increased frequency of excitation can potentially result in photobleaching of the reporter fluorophore. This can result in collapse of the assay window (poor signal-to-noise ratio) or artefactual signals with reduced Z’ value for the assay. In addition, the small size of wells in 1536-well plates and its unique shape can contribute to problems like air bubble entrapment, improper mixing, evaporation-induced concentration changes, and so on. This would require added steps like sealing and centrifugation (to get rid of the bubbles) and, hence, can neutralize the gain in confluence by the time lost in reading the first data point. Furthermore, we started the optimization exercise with the FLIPR Tetra pipetting head. We noticed, however, that the tip types can potentially contribute to an artefactual spike in the signal and would require optimization. In addition, an assay signal discontinuity necessitated sealing the plate. This step took away the incentive of using the FLIPR Tetra pipetting head for the studies reported in this article. Moving forward, we desire to implement the “simultaneous add and read” feature that can be enabled only if the FLIPR Tetra pipetting head is used. Care would have to be exercised, however, and optimization would need to be carried out to reduce evaporation, interference by tip types, and a homogeneous reaction mix that is not limited by diffusion alone.
Furthermore, the current study reported the implementation of ChEF assay technology and used kinase targets to demonstrate the utility of this assay format. Going forward, attempts would be made to demonstrate the target-agnostic nature of this assay platform applicable among several different targets and continuous-read assay formats. A few examples of assays that can be optimized on FLIPR Tetra are (1) phosphate sensor assays for monitoring the activity of ATPase, GTPase, phosphatases, and diesterases, to mention but a few. Any reaction resulting in the generation of an inorganic phosphate can be monitored using this assay in real-time kinetic mode. (2) A redox cluster of reactions that generate or consume the nicotinamide adenine mono- or dinucleotide or its derivatives. (3) 2-aminopurine-based assays to monitor the activity of DNA and RNA polymerases, 43 and so on. In principle, any assay that is amenable to continuous monitoring as a function of time with fluorescence or luminescence readouts, including coupled assays, can be optimized to function with FLIPR Tetra.
Apart from all the advantages mentioned above, the use of FLIPR Tetra poses some challenges. Although the instrument can handle direct readouts, it is not equipped to deal with measurements like fluorescence polarization (FP) and time-resolved fluorescence resonance energy transfer (TR-FRET) measurements. In addition, the platform is not versatile, like available PMT-based readers, to accommodate different readouts. For instance, PheraStar can be used to carry out fluorescence, homogeneous time-resolved fluorescence (HTRF), absorbance, and luminescence measurements with a broad spectrum of wavelengths. Having said that, the industry is innovating on the design and span of application for FLIPR by introducing improved models like FLIPR Penta.
Summary
In summary, we have increased the quality and confluence of high-throughput kinetic data by using FLIPR as a reader. We validated that CCD-based camera technology could be one of the ways forward for capturing fast biochemical kinetics with which laser-based plate readers usually struggle. The next step for us would be optimizing 1536-well plate reads on FLIPR for a biochemical kinetic assay that would further increase throughput from 18 compounds to 72 compounds per run. Also, our future attempts would be to use the “simultaneous pipette and read” capability within FLIPR.
Supplemental Material
sj-pdf-1-jbx-10.1177_24725552211000676 – Supplemental material for A Novel High-Throughput FLIPR Tetra–Based Method for Capturing Highly Confluent Kinetic Data for Structure–Kinetic Relationship Guided Early Drug Discovery
Supplemental material, sj-pdf-1-jbx-10.1177_24725552211000676 for A Novel High-Throughput FLIPR Tetra–Based Method for Capturing Highly Confluent Kinetic Data for Structure–Kinetic Relationship Guided Early Drug Discovery by Puneet Khurana, Lisa McWilliams, Jonathan Wingfield, Derek Barratt and Bharath Srinivasan in SLAS Discovery
Footnotes
Acknowledgements
We would like to acknowledge Rachel Grimley, Geoff Holdgate, James Robinson, Paul Hemsley, Argyrides Argyrou, Ray Finley, Dynes Therese, Gavin Collie, Michaelides Iacovos, Anne Jackson, Xiang Zhai, and Omar Alkhatib for their help during this work and/or for their critical inputs on the manuscript that enabled its improvement.
Supplemental material is available online with this article.
Abbreviations
BK, Binding kinetics; CCD, charge-coupled device; CHEF, chelation-enhanced fluorescence; FI, fluorescence intensity; FLIPR, fluorescent imaging plate reader; HTS, high-throughput screening; LI, lead identification; MoA, mechanism of action; SAR, structure–activity relationship; SKR, structure–kinetic relationship.
Declaration of Conflicting Interests
The authors declared the following potential conflicts of interest with respect to the research, authorship, and/or publication of this article: All authors are employed by AstraZeneca, and their research and authorship of this article was completed within the scope of their employment with AstraZeneca.
Funding
The authors received no financial support for the research, authorship, and/or publication of this article.
References
Supplementary Material
Please find the following supplemental material available below.
For Open Access articles published under a Creative Commons License, all supplemental material carries the same license as the article it is associated with.
For non-Open Access articles published, all supplemental material carries a non-exclusive license, and permission requests for re-use of supplemental material or any part of supplemental material shall be sent directly to the copyright owner as specified in the copyright notice associated with the article.