
Abstract
The transcription factor, nuclear factor erythroid 2-related factor 2 (Nrf2), plays a major role in regulating the antioxidant defense system through the Kelch-like ECH-associated protein 1–Nrf2–antioxidant response element (Keap1–Nrf2–ARE) pathway. Small-molecule inhibitors targeting Keap1–Nrf2 protein–protein interaction (PPI) decrease the rate of Nrf2 degradation by the 26S proteasome and thus increase the intracellular level of Nrf2, which translocates into the nucleus, leading to upregulated expression of cytoprotective and antioxidant enzymes. Such inhibitors can be developed into potential preventive and therapeutic agents of diseases caused by oxidative damage. To more effectively identify promising Nrf2 activators through the inhibition of Keap1–Nrf2 PPI, a homogeneous time-resolved fluorescence resonance energy transfer (TR-FRET) assay was developed in this work by indirectly labeling the Keap1 Kelch domain protein with Tb-anti-His antibody as the donor and using, as the acceptor, fluorescein isothiocyanate (FITC)-labeled 9mer Nrf2 peptide amide, the same fluorescent probe that was used in an earlier fluorescence polarization (FP) assay. Assay conditions, including concentrations of the various components, buffer type, and incubation time, were optimized in the TR-FRET competition assay with known small-molecule inhibitors of Keap1–Nrf2 PPI. Under the optimized conditions, the Keap1–Nrf2 TR-FRET assay exhibited great sensitivity with a high dynamic range and considerable stability for as long as 5 h. The Z’ factor was determined to be 0.82, suggesting that the assay is suitable for high-throughput screening and lead optimization of inhibitors of Keap1–Nrf2 PPI. Furthermore, the TR-FRET assay is capable of differentiating potent inhibitors of Keap1–Nrf2 PPI down to the subnanomolar inhibition constant (Ki) range.
Introduction
Sustained oxidative stress conditions such as an unbalanced production of reactive oxygen species (ROS) are associated with developing inflammation and a variety of diseases, including cancer, neurodegenerative disease, and chronic obstructive pulmonary disease (COPD), through damage to DNA and cellular structures in the human body.1–3 Accordingly, an antioxidant defense system can be a promising target for the treatment of oxidative stress-related diseases by modulating the level of oxidative stress. The Keap1–Nrf2–ARE (Kelch-like ECH-associated protein 1–nuclear factor erythroid 2-related factor 2–antioxidant response element) pathway plays an important role in the antioxidant defense system to protect cells from oxidants and electrophiles generated during oxidative stress by upregulating detoxification enzymes (e.g., superoxide dismutase and catalase) and antioxidant enzymes [e.g., NAD(P)H:quinone oxidoreductase 1 (NQO1), glutathione reductase (GSR), glutathione peroxidase (GPx), and heme oxygenase-1 (HO1)].2,4,5 Under basal conditions, the Keap1 homodimer forms a complex with a single molecule of Nrf2 through interactions between the Kelch domain of Keap1 and the Nrf2–ECH homology (Neh2) domain of Nrf2 and with two cullin3 (Cul3)-based E3 ubiquitin ligase complexes through a BTB (Broad-complex, Tramtrack, and Bric-a-Brac) domain.6,7 The Cul3-based E3 ligase induces Nrf2 ubiquitination, which is rapidly degraded by 26S proteasome, lowering the level of Nrf2 in the cytoplasm.8,9 Under conditions of oxidative stress, an inducer such as ROS modifies reactive cysteine residues (e.g., C273 and C288) located in the intervening region (IVR) domain of Keap1, 7 leading to the disruption of the protein–protein interaction (PPI) between Keap1 and Nrf2 through three possible mechanisms: (1) the Cul3 dissociation model, 10 (2) the hinge and latch model, 11 and (3) the conformational cycling model. 12 The accumulated or newly formed Nrf2 translocates into the nucleus and activates the expression of ARE-controlled genes, leading to upregulated expression of related detoxification and antioxidant enzymes.13,14
One type of Nrf2 modulator discovered during the past decade is small-molecule direct inhibitors of Keap1–Nrf2 PPI, such as monoacidic 1,2,3,4-tetrahydroisoquinolines (THIQ) [e.g., LH601A (
Yamamoto et al. carried out the first SPR assay to study the interaction between the Keap1 Kelch domain and glutathione S-transferase (GST)–Nrf2 Neh2 domain in 1999. 21 In 2011, our group developed an SPR-based solution competition assay using an immobilized biotin-16mer Nrf2 peptide (biotin-AFFAQLQLDEETGEFL-OH) to measure the binding affinity of Nrf2 peptides containing the ETGE motif to the Kelch domain of Keap1 and eventually determine the minimal Nrf2 sequence needed for Keap1 binding. 22 It was demonstrated that the 9mer Nrf2 peptide (H-LDEETGEFL-OH) is the minimal sequence in terms of binding to Keap1 and that acetylation of the N-terminal NH2 of the 9mer Nrf2 peptide increased its binding affinity to the level of the longer 16mer Nrf2 peptide [dissociation constant (Kd) of 21~24 nM]. 22 While the SPR assay benefits from label-free detection and full automation, it is not suitable for high-throughput screening (HTS) because of the need for a separate measurement for each test sample or concentration.
One of the methods widely used for evaluating activity of small-molecule inhibitors of biomolecular interactions is the FP assay, which is a powerful fluorescence-based assay technique measuring the change in polarization of emitted light on excitation of a fluorescent probe with plane-polarized light as a result of protein binding. Based on the binding affinities of short Nrf2 peptides obtained by the SPR assay,
22
our group designed fluorescently labeled Nrf2 peptides containing the ETGE motif as a probe, and developed an FP competition assay using a fluorescein isothiocyanate (FITC)-9mer Nrf2 peptide amide (FITC-LDEETGEFL-NH2).
23
The FP assay has proven to be robust and was used in HTS of the U.S. National Institutes of Health (NIH) Molecular Libraries Probe Production Centers Network (MLPCN) library to discover the first-in-class THIQ inhibitors of Keap1–Nrf2 PPI as represented by LH601A (
Besides FP, time-resolved fluorescence resonance energy transfer (TR-FRET) is another homogeneous fluorescence-based method frequently used for HTS, because these TR-FRET assays have a number of advantages such as automation, simple protocol, no use of radioisotopes, high reproducibility, and conservation of assay reagents. 24 In 2013, Wells and colleagues first reported the development of a steady-state FRET assay consisting of a yellow fluorescent protein (YFP)-conjugated Keap1 Kelch domain protein and a cyan fluorescent protein (CFP)-conjugated Nrf2 ETGE motif–derived 16-mer peptide. 25 Bresciani and colleagues developed TR-FRET Kelch domain binding assays using a biotinylated Kelch domain and a streptavidin labeled with europium (Eu) as the donor. 26 The acceptor was either a fluorescently labeled ETGE-containing peptide, AF647-9-mer, or biotin-16-mer bound to streptavidin labeled with a fluorescence acceptor, SA-Ulight. Recently, GlaxoSmithKline reported two types of TR-FRET competition assays that measure the inhibition of Cul3–Keap1 and Nrf2–Keap1 complexes. 27 The assay components used in these Keap1–Nrf2 TR-FRET assays are Flag-His-tagged full-length Keap1, biotinylated full-length Nrf2, Eu-labeled streptavidin, and allophycocyanin (APC)-labeled anti-Flag antibody.27–29
Herein, we report the development of a simple, convenient, and cost-effective Keap1–Nrf2 TR-FRET assay using the same FITC-9mer Nrf2 peptide amide reported in our previous FP assay (see Ref. 23 ) to evaluate the inhibitory activity of non-covalent inhibitors against the interaction between the Keap1 Kelch domain and Nrf2 ETGE motif. The optimized conditions in the TR-FRET competition assay consisted of 0.5 nM Tb-anti-His antibody, 5 nM Keap1 Kelch domain protein, and 25 nM fluorescein-labeled 9mer Nrf2 peptide amide in 10 mM 4-(2-hydroxyethyl)-1-piperazineethanesulfonic acid (HEPES) pH 7.4 buffer containing 1% DMSO. We demonstrated that the new assay is robust, reproducible, and highly sensitive with a great dynamic range. In addition, the TR-FRET assay can differentiate inhibitors over a wider range of affinities down to the subnanomolar inhibition constant (Ki) range, while the FP assay can differentiate inhibitors only down to submicromolar binding affinities. Thus, the Keap1–Nrf2 TR-FRET assay would complement the FP assay for hit identification and lead optimization when more potent inhibitors need to be compared.
Materials and Methods
Reagents
LanthaScreen anti-His antibody was purchased from Thermo Scientific (Waltham, MA). The fluorescein-labeled 9mer Nrf2 peptide amide (FITC-LDEETGEFL-NH2) was synthesized from the purified 9mer Nrf2 peptide amide through labeling with FITC, as reported in Refs. 22,23. The concentration of the peptide probe was determined based on the ultraviolet absorbance of a diluted sample (50–100 dilution) at 494 nm and molar extinction coefficients of 68,000 M−1cm−1. Small-molecule inhibitors (1S,2R)-2-[(S)-1-(phthalimidomethyl)-1,2,3,4-tetrahydroisoquinoline-2-carbonyl]cyclohexane-1-carboxylic acid (LH601A,
Measurement of Binding of FITC-Labeled 9mer Nrf2 Peptide Amide to Keap1 Kelch Domain in the TR-FRET Assay
All TR-FRET assays were performed in a white, nonbonding-surface 384-well plate (cat. no. 3574, Corning, Corning, NY) in a total volume of 20 µL per well. All TR-FRET signals were recorded on a Wallac Victor 3V multilabel plate reader (PerkinElmer, Shelton, CT) with excitation at 340 nm and emissions at 495 and 520 nm. Unless otherwise stated, the final assay mixture contained 1% DMSO, and the assay buffer solution used was 10 mM HEPES pH 7.4 buffer containing 0.5 mM ethylenediaminetetraacetic acid (EDTA), 150 mM NaCl, and 0.005% Tween-20. All experiments were performed in triplicate with the exception of the evaluation of the assay performance, and all assay plates were centrifuged at 2500 rpm for 2 min at room temperature before and after incubation. TR-FRET signals were expressed as a ratio of fluorescence intensity at 520 nm to fluorescence intensity at 495 nm, multiplied by 104.
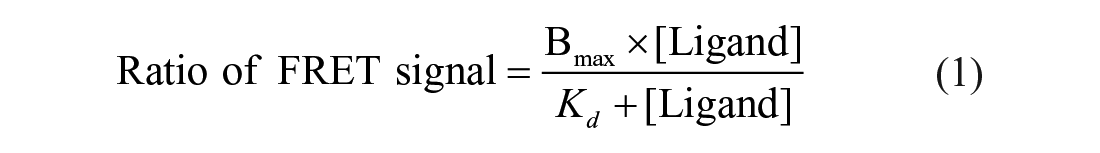
To determine the binding affinity between the fluorescein-labeled 9mer Nrf2 peptide amide and His-tagged Keap1 Kelch domain, titration of the Keap1 Kelch domain protein with the fluorescent peptide was performed in the presence of 1% DMSO. An equal volume mixture of 20 nM Keap1 Kelch domain (final, 5 nM) and 2 nM Tb-anti-His antibody (final, 0.5 nM) was pre-incubated for 30 min at room temperature. Two hundred nanoliters of neat DMSO (final, 1%) were first dispensed into a 384-well white plate, followed by the addition of 10 µL of the Keap1 Kelch domain/Tb-anti-His antibody mixture to all wells. After incubation at room temperature for 30 min, 9.8 µL of serially diluted FITC-labeled 9mer Nrf2 peptide amide (twofold dilutions; final, 100 to 0.8 nM) in the buffer was added, while the wells in the absence of the probe received 9.8 µL of the assay buffer to give a 20 µL volume of final assay mixture that contains 5 nM Keap1 Kelch domain protein, 0.5 nM Tb-anti-His antibody, varying concentrations of FITC-9mer Nrf2 peptide amide, and 1% DMSO in 10 mM HEPES pH 7.4 buffer. The plate was allowed to incubate for 1 h at room temperature, and then fluorescence was measured at 495 and 520 nm with excitation at 340 nm using a Wallac Victor 3V plate reader. The TR-FRET signal ratios (Em520 / Em495 × 104), after subtracting the background ratio in the absence of the fluorescent Nrf2 peptide probe, were plotted against the concentration of FITC-9mer Nrf2 peptide amide and fitted to the one-site binding/saturation equation (Eq. 1) to derive the Kd 27 using SigmaPlot (SPSS, Chicago, IL):
Optimization of Keap1 Kelch Domain Protein Concentration for a TR-FRET Competition Assay
The optimal concentration of the Keap1 Kelch domain in the TR-FRET competition assay was determined by varying the concentration of the Keap1 Kelch domain protein in the presence of a fixed concentration of FITC-labeled 9mer Nrf2 peptide amide and Tb-anti-His antibody. To wells containing 0.2 µL of neat DMSO, 5 µL of serially diluted Keap1 Kelch domain protein (twofold dilutions) in the assay buffer was dispensed, followed by the addition of 5 µL of 2 nM Tb-anti-His antibody. The background signals were measured in the presence of 5 µL of the buffer solution without Keap1 Kelch domain protein. As described in the procedure of the titration of the fluorescent Nrf2 peptide, the plate was incubated at room temperature for 30 min before addition of FITC-labeled 9mer Nrf2 peptide amide to all wells to give a 20 µL volume of final assay mixture that contains varying concentrations (0.1 to 50 nM) of Keap1 Kelch domain protein, 0.5 nM Tb-anti-His antibody, 20 nM FITC-9mer Nrf2 peptide amide, and 1% DMSO in 10 mM HEPES pH 7.4 buffer. The assay mixtures were incubated for another hour before TR-FRET signals were measured using the plate reader.
TR-FRET Competition Assay of Two Known Keap1–Nrf2 PPI Inhibitors
For the competition assay, two known small-molecule inhibitors (
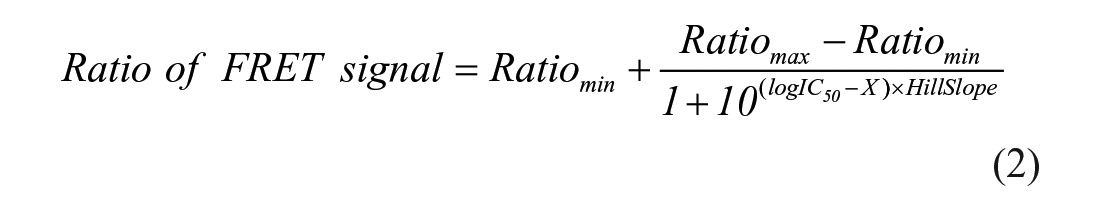
where IC50 is the concentration of an inhibitor needed to inhibit 50% binding of the fluorescently labeled peptide probe, and X is the log of the inhibitor concentration.
Buffer Selection for the TR-FRET Assay
For the selection of buffer conditions for the TR-FRET assay, we performed the competition assay using compound
The Effect of DMSO on the TR-FRET Assay
DMSO tolerance in the TR-FRET assay was evaluated by measuring dose–response curves of compound
Optimization of Incubation Time
The equilibration time required for the assay was determined by comparing the 11-point dose–response curves of compound
Optimization of Tb-anti-His Antibody Concentration for the TR-FRET Assay
To optimize the concentration of Tb-anti-His antibody, the TR-FRET competition assay was carried out with the potent inhibitor
Evaluation of TR-FRET Assay Performance
Robustness of the assay was evaluated through the determination of the Z’ factor. The potent inhibitor

where SDp and SDn are the standard deviation of the positive and negative control wells, respectively; and µp and µn are the mean TR-FRET signal values of the positive and negative controls, respectively.
IC50 as a Function of Ki under the TR-FRET Competition Assay Conditions
For comparison of the TR-FRET assay with the previous FP assay, we also derived the relationship of IC50 as a function of Ki in a similar fashion to the way it was done for the FP assays.23,32 Equation 4 was used to calculate f0, the fraction of Keap1 Kelch domain protein bound to FITC-9mer Nrf2 peptide amide, using the Kd we obtained previously in the FP assay 23 and standard optimized TR-FRET assay conditions.
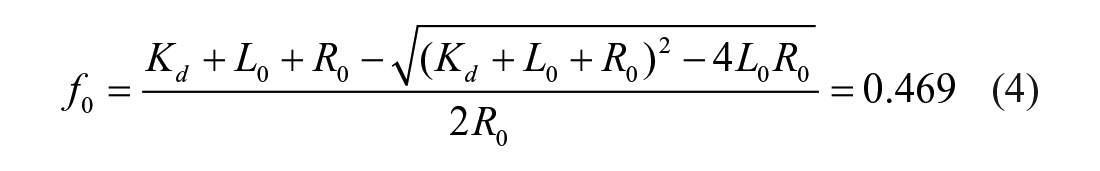
where L0 is the concentration of total FITC-9mer Nrf2 peptide amide used, which was fixed at 25 nM; and R0 is the concentration of Keap1 Kelch domain protein, which was the limiting reagent and fixed at 5 nM for the competition assay.
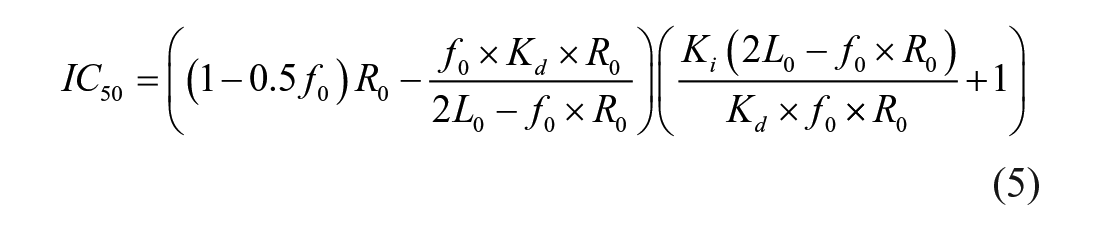
The IC50 values determined have the following relationship with Ki of the inhibitors:
Results and Discussion
Our group previously developed an FP assay using the FITC-9mer Nrf2 peptide amide, 23 which has been applied by other labs in their discovery and optimization of direct small-molecule inhibitors of the Keap1–Nrf2 PPI. Small fluorescent molecules tumble within their fluorescence lifetime and have lower value of polarization when they are excited by a plane-polarized light. A large complex of the small fluorescent probe bound to Keap1 Kelch domain protein would tumble with the large protein and, thus, has a higher value of polarization due to the slower rate of molecular rotation. 33 Addition of an inhibitor allows the FITC-labeled Nrf2 peptide to be displaced from the Keap1 Kelch domain protein. Fluorescence polarization or anisotropy is measured as a function of inhibitor concentration and used to derive IC50 values for the comparison of various inhibitors. 34 There are several advantages of the FP assay, such as its simple and fast “mix-and-read” format, relatively low cost, and robust performance. The homogeneous FP assay does not require wash, filtration, and separation steps because it provides a direct analysis of the equilibrium binding process in solution without separation.35,36 In addition, this quantitative technique requires lower amounts of sample relative to the isothermal titration calorimetry (ITC) and SPR assays. FP is a ratiometric assay that is relatively insensitive to absorptive interferences or inner filter effects. Because of these advantages, FP assays have been successfully applied to HTS of chemical libraries in drug discovery.
An alternative to the FP assay is a TR-FRET assay as outlined in Figure 1 . The TR-FRET assay uses a distance-dependent transfer of excited state energy from a donor fluorophore to an acceptor fluorophore by a dipole–dipole interaction, when the pair of fluorophores with a spectral overlap is brought within close proximity. 37 For the evaluation of Keap1–Nrf2 PPI, we decided to use the commercially available Tb-anti-His antibody to indirectly label the His-tagged Keap1 Kelch domain protein in our TR-FRET assay development. This selection is based on the fact that terbium (Tb) offers such advantages as high sensitivity, long lifetime, and multiple emission peaks (centered between 485 and 505 nm) with large Stokes shifts (excitation and emission wavelengths are 340 nm and 495 nm, respectively).38,39 In the first step, the His-tagged Keap1 Kelch domain protein is non-covalently labeled with the primary antibody, Tb-anti-His antibody, acting as the donor. When the acceptor FITC-labeled 9mer Nrf2 peptide amide is added in the second step, binding of the FITC-labeled 9mer Nrf2 peptide amide to the Keap1 Kelch domain protein brings two fluorophores closer, resulting in an energy transfer from Tb to fluorescein and consequently generating the fluorescence emission at 520 nm from the acceptor fluorescein. When the FITC-labeled 9mer Nrf2 peptide amide is displaced from the Keap1 Kelch domain protein by an inhibitor, the distance between the Tb and the free fluorescent probe in solution is too large for the energy transfer to occur. Consequently, the effect of the test inhibitor against Keap1–Nrf2 PPI can be determined by measuring fluorescence intensities at 520 nm and 495 nm.
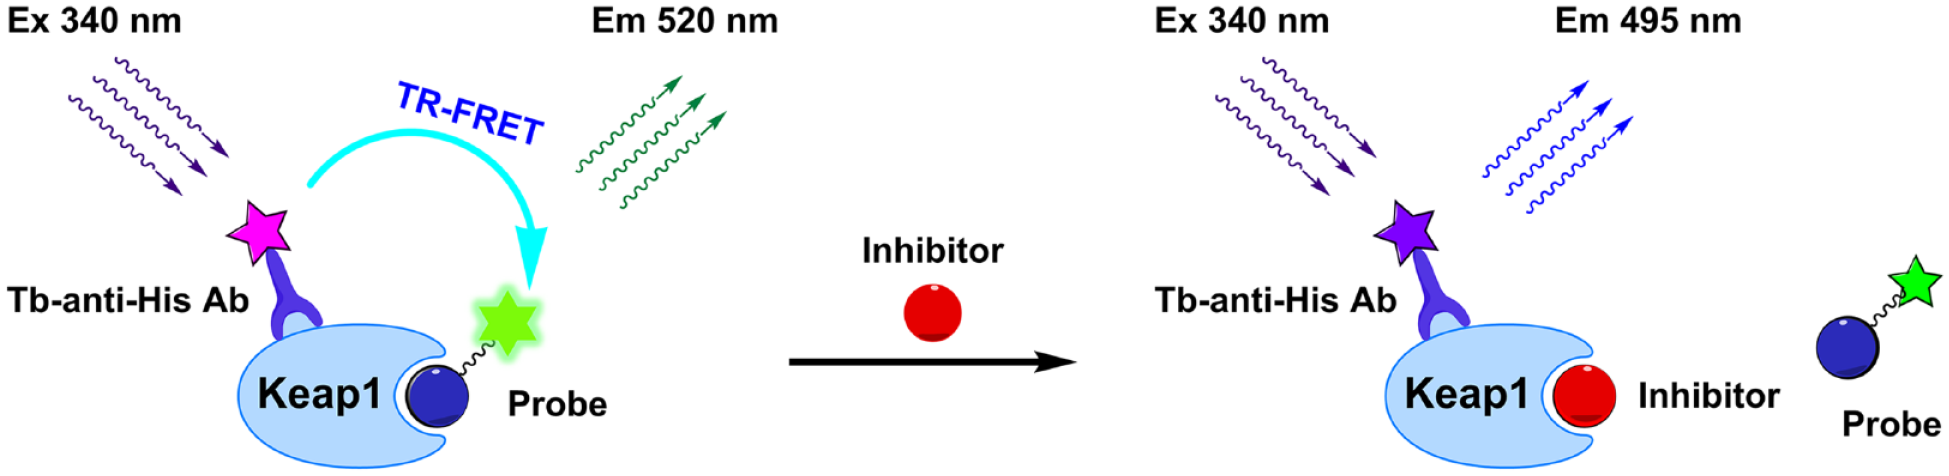
Principle of a proximity-based time-resolved fluorescence resonance energy transfer (TR-FRET) assay. Two fluorophores are used for detection and quantitative analysis of FRET signals: Terbium (Tb) serves as the donor and has a maximum emission peak at approximately 495 nm; fluorescein is used as the acceptor and has a maximum emission peak at 520 nm. The binding between Kelch-like ECH-associated protein 1 (Keap1) and fluorescein isothiocyanate (FITC)-9mer nuclear factor erythroid 2-related factor 2 (Nrf2) peptide amide results in an increase in the emission of the acceptor fluorescein at 520 nm by energy transfer from the donor Tb, while the displacement of the probe from the Keap1 Kelch domain protein by an inhibitor leads to decreased emission of the acceptor at 520 nm and increased emission of the donor at 495 nm.
These homogeneous fluorescence-based assays allow for the rapid and convenient quantitation of inhibitory activities of new compounds against Keap1–Nrf2 PPI, because they do not require the separation of bound molecules from unbound partners. More specifically, the TR-FRET assay has a distinct advantage over the FP assay in terms of time-resolved measurement of fluorescence, leading to low background and high signal-to-background ratio. The luminescence lifetime of a Tb is in the millisecond range, while the lifetime of background fluorescence from sample components such as organic compounds, proteins, and cells is no longer than the nanosecond range.37,40 The enormous difference in the emission lifetime enables a time delay (approximately 50 to 150 µsec) between the excitation of a donor and fluorescence measurement, which eventually allows for all interfering signals from the short-lived emissions to decay before measurement. 41 In addition, the proximity-based method using a donor–acceptor pair contributes to fewer false positives or negatives that are commonly encountered in FP assays. 42
Binding Affinity of the FITC-Labeled 9mer Nrf2 Peptide Amide to the Keap1 Kelch Domain in the TR-FRET Assay
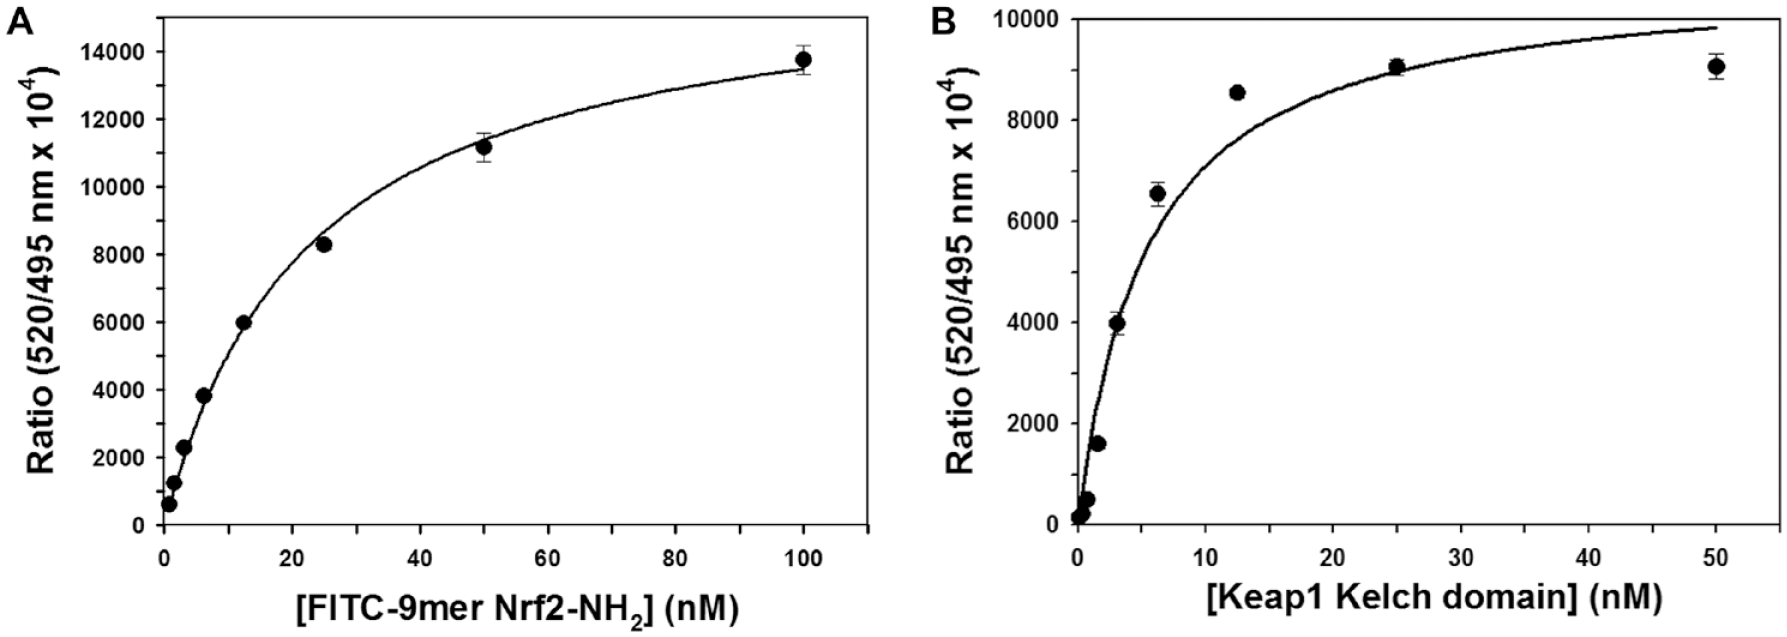
We first conducted the titration of 5 nM Keap1 Kelch domain with FITC-9mer Nrf2 peptide amide (100 to 0.8 nM) in the presence of 1% DMSO and 0.5 nM Tb-anti-His antibody to determine the binding affinity of the fluorescent Nrf2 peptide as one way to validate our TR-FRET assay. As shown in Figure 2A , the addition of increasing concentrations of the fluorescent probe led to increased TR-FRET signals in a dose-dependent manner, which eventually plateaued at high probe concentration. The Kd value for the binding of FITC-9mer Nrf2 peptide amide to the Keap1 Kelch domain protein was determined to be 22.6 ± 1.7 nM, which is in good agreement with that obtained previously by FP assay (Kd = 25.6 ± 10.8 nM) 23 and an SPR assay (Kd = 22.3 ± 4.2 nM). 22
Time-resolved fluorescence resonance energy transfer (TR-FRET) binding assay (
Determination of Keap1 Kelch Domain Protein Concentration for TR-FRET Competition Assay in a 384-Well Format
To select an optimal concentration of Keap1 Kelch domain protein for the TR-FRET competition assays, varying concentrations (50 to 0.1 nM) of Keap1 Kelch domain protein were used to titrate against 20 nM FITC-9mer Nrf2 peptide amide in the presence of 1% DMSO and 0.5 nM Tb-anti-His antibody in 10 mM HEPES pH 7.4 buffer. Similar to the previous titration experiment with the fluorescent Nrf2 peptide, the assay signals were determined by considering the background signal in the absence of the Keap1 Kelch domain. The FRET signal in Figure 2B displayed a dose-dependent increase with increasing concentrations of the Keap1 Kelch domain protein and reached a plateau at high Keap1 Kelch domain protein concentrations. Considering the dose–response curve of the Keap1 Kelch domain protein to the FITC-labeled Nrf2 peptide and the desire to differentiate more potent inhibitors in the competition assay, we chose 5 nM Keap1 Kelch domain protein for the TR-FRET competition assay.
TR-FRET Assay Validation with Known Keap1–Nrf2 PPI Inhibitors
With 5 nM of Keap1 Kelch domain protein and 25 nM FITC-9mer Nrf2 peptide amide used, the calculated fraction (f0) of Keap1 Kelch domain protein bound to FITC-9mer Nrf2 peptide amide using Equation 5 is 0.469, providing a TR-FRET competition assay with a great dynamic range and the ability to differentiate highly potent inhibitors. We then used two well-characterized small-molecule direct inhibitors of Keap–Nrf2 PPI, compounds
As shown in
Figure 3
, the two inhibitors exhibited the typical sigmoidal dose–response curves, because the test compounds displayed comparable signals at the lowest and highest concentrations, thereby providing a similar dynamic range from 1000 to 8500 in the competition assay. As expected, compound
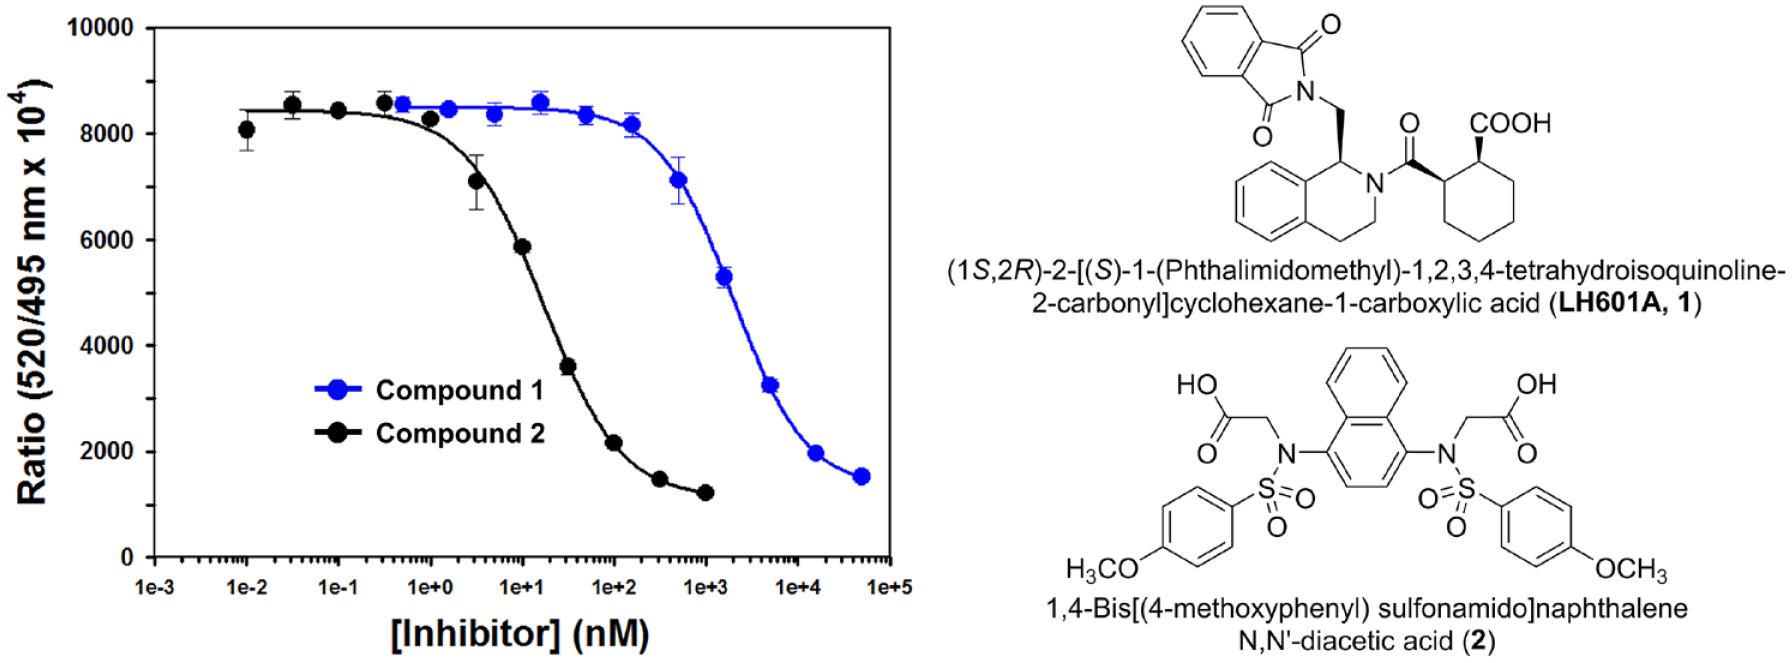
Validation of time-resolved fluorescence resonance energy transfer (TR-FRET) competition assay with compounds
Comparison of Buffer Solutions
To confirm the buffer selection for our TR-FRET assay, we performed the TR-FRET competition assay with
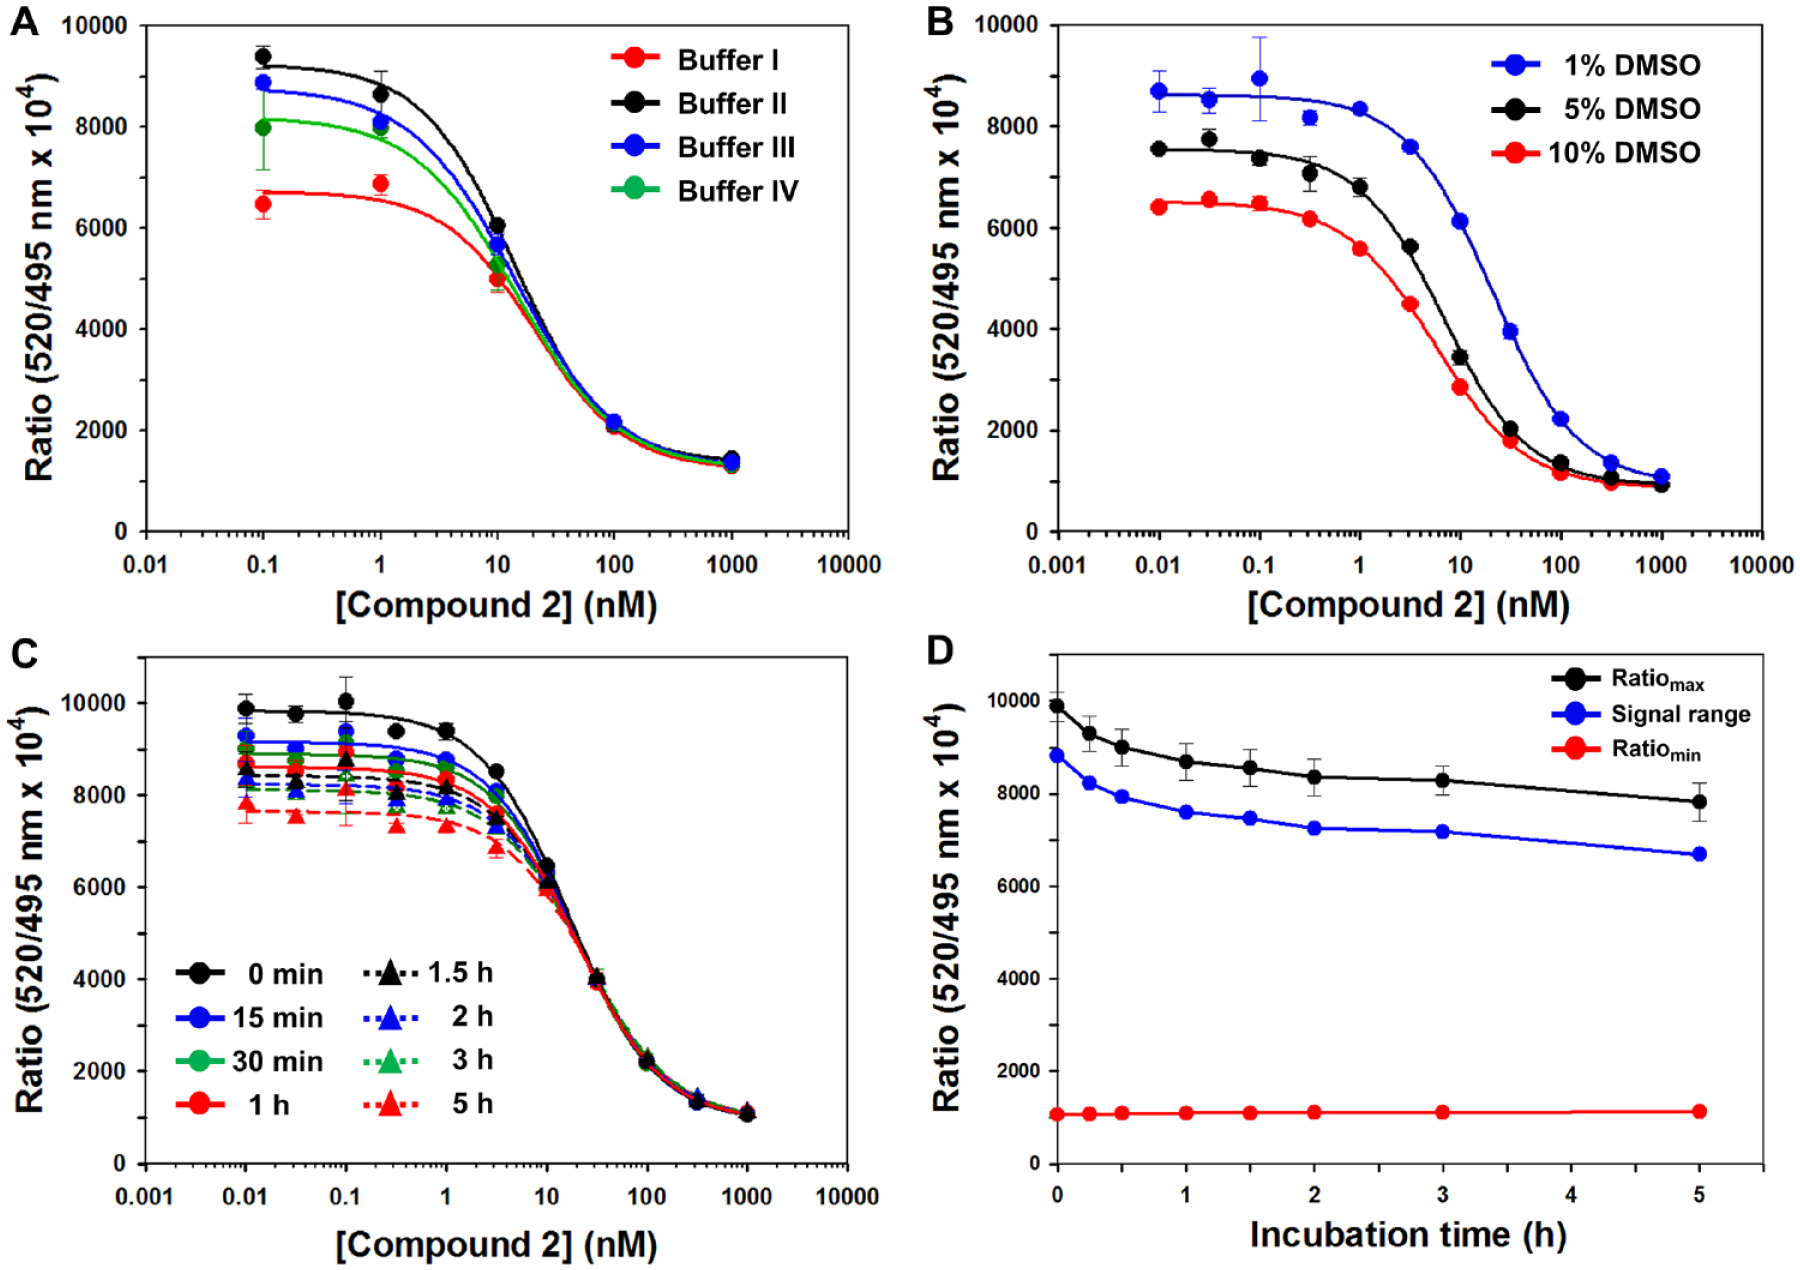
The effects of buffer solutions, DMSO, and incubation time on the dose–response curves of compound
DMSO Tolerance in the TR-FRET Assay
In early drug discovery, test compounds are generally dissolved in DMSO. Therefore, we carried out a DMSO tolerance study to determine the effect of DMSO on our TR-FRET assay to enable the selection of an appropriate concentration of DMSO. The final mixture consists of assay components and serially diluted test compounds in the presence of three concentrations (1%, 5%, and 10%) of DMSO, because the DMSO concentration used in HTS usually ranges from 0.5% to 5%. As shown in
Figure 4B
, the TR-FRET signal did drop significantly among the various concentrations of
The Effect of Incubation Time on the TR-FRET Signal
TR-FRET signal dependence on incubation time after addition of the FITC-labeled 9mer Nrf2 peptide amide was investigated at room temperature throughout a 5 h period, in an effort to determine the optimal time required and to evaluate assay stability. As shown in
Figure 4C
, the inhibitory effect of
The Effect of Tb-Anti-His Antibody Concentration on the TR-FRET Competition Assay
To determine the optimal concentration of Tb-anti-His antibody needed for indirect labeling of the Keap1 Kelch domain protein, the dose–response curves of
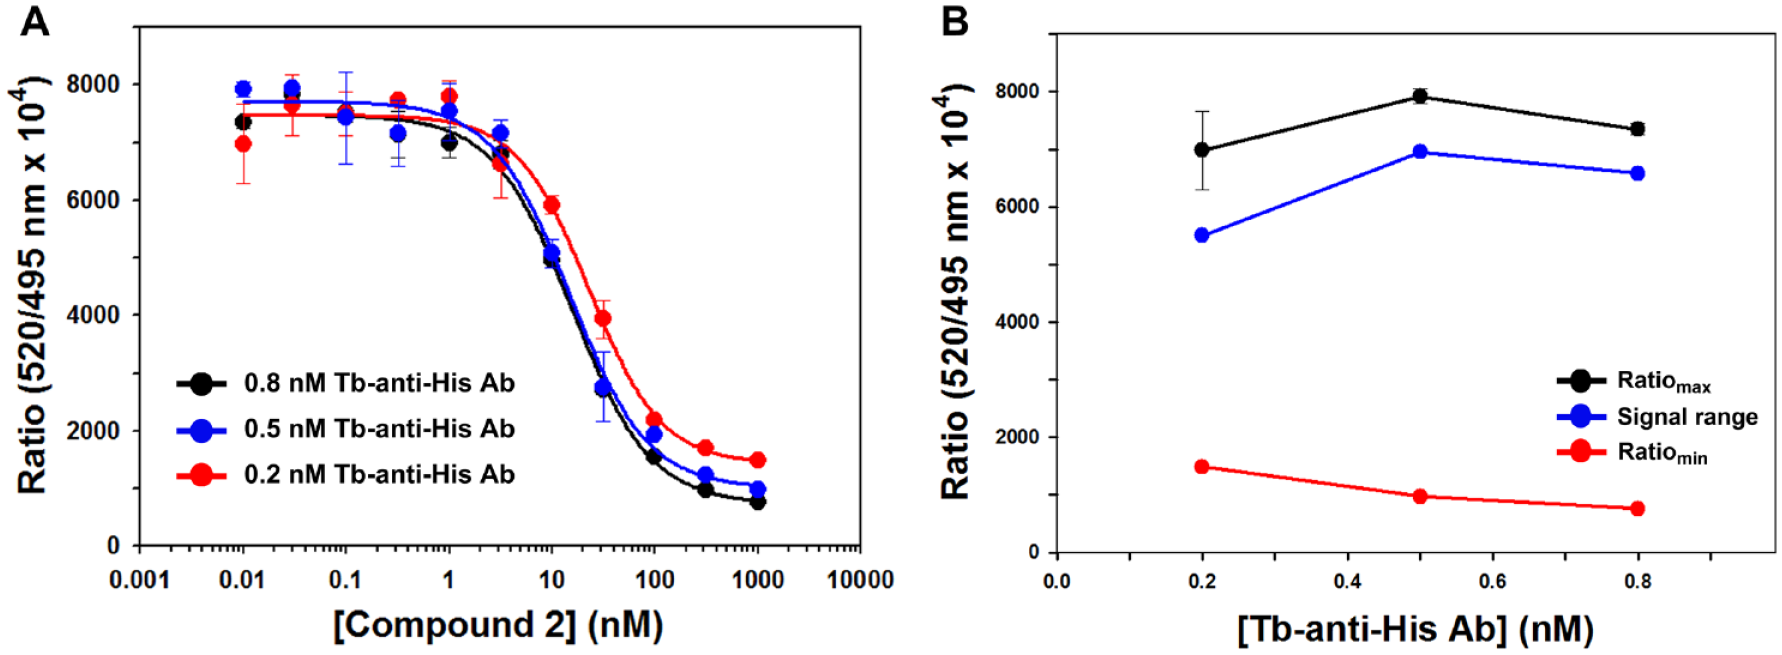
Determination of the Tb-anti-His antibody concentration in the time-resolved fluorescence resonance energy transfer (TR-FRET) competition assay. (
Suitability of the TR-FRET Assay for HTS
To evaluate the suitability of the TR-FRET assay for HTS, the Z’ factor was calculated from TR-FRET signals of a series of negative and positive controls. The Z’ factor, which incorporates the dynamic range and variability in the TR-FRET measurements, quantifies the performance of a biological assay. A Z’ value in the range between 0.5 and 1 is required for an assay to be reliably used in HTS applications.
44
In this study, 1 µM of
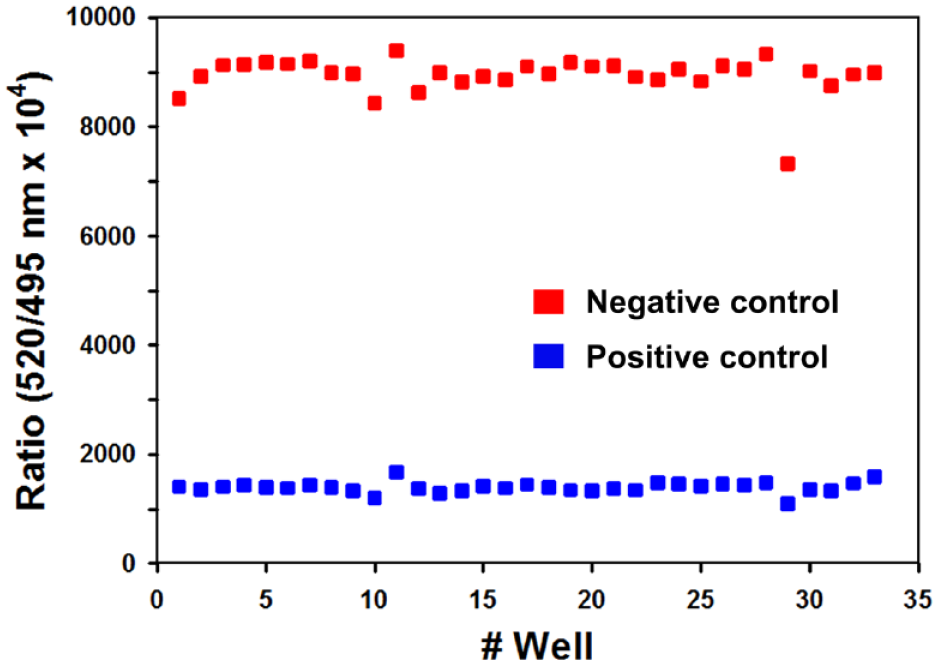
Variability of the time-resolved fluorescence resonance energy transfer (TR-FRET) assay signals for 33 replicates of the positive (1 µM
IC50 as a Function of Ki under the TR-FRET Competition Assay Conditions
As shown in Figure 7 , the relationship between IC50 and Ki under our TR-FRET conditions indicates that our TR-FRET assay can be used to differentiate potent inhibitors of the Keap1–Nrf2 PPI down to the nanomolar range. This is quite different from the FP assay conditions we published previously, 23 in which the lowest IC50 value possible is only 50 nM, no matter how tight the binding is between an inhibitor and the Keap1 Kelch domain protein. As a matter of fact, the IC50 of approximately 200 nM is about the lower limit, corresponding to a Ki of ~30 nM, suggesting that the FP assay is more suitable for HTS when the hits are generally less potent. Therefore, the current TR-FRET assay has greater utility in the evaluation of more potent inhibitors of the Keap1–Nrf2 PPI with Ki’s down to the subnanomolar range. Furthermore, the TR-FRET assay uses much less (20-fold less) Keap1 Kelch domain protein than the FP assay (5 nM vs. 100 nM).
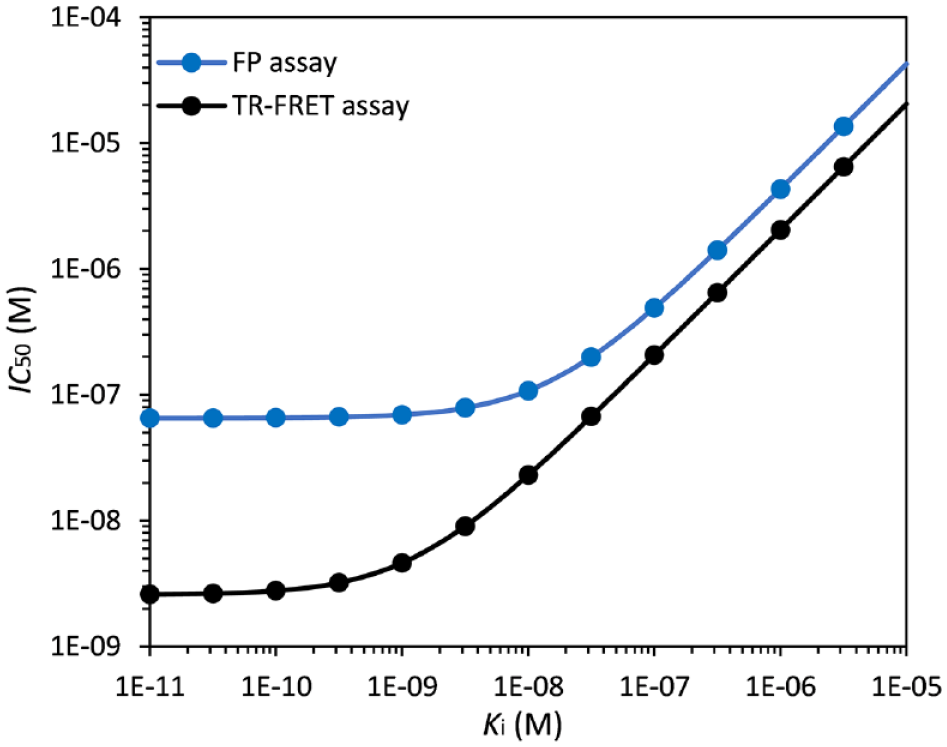
The simulated plots of IC50 versus the inhibition constant (Ki) of inhibitors under the time-resolved fluorescence resonance energy transfer (TR-FRET) assay conditions used in this study (Eq. 5) and the fluorescence polarization (FP) assay conditions we reported in Ref. 22
In summary, we developed a robust, simple, and effective TR-FRET competition assay for the evaluation of direct inhibitors of Keap1–Nrf2 PPI using, as the acceptor, a fluorescein-labeled Nrf2 peptide containing the ETGE motif and, as the donor, a Tb-anti-His antibody that indirectly labels the His-tagged Keap1 Kelch domain protein. The fluorescein-labeled Nrf2 peptide was the FITC-9mer Nrf2 peptide amide, the same peptide that we developed and used as the fluorescent probe in an FP assay. 23 The homogeneous TR-FRET assay showed excellent sensitivity with a high dynamic range and considerable stability throughout several hours of incubation. With a Z’ factor of 0.82, the TR-FRET competition assay was robust and highly effective for such applications as high-throughput screening of molecular libraries and evaluations of potent inhibitors of the Keap1–Nrf2 PPI during lead optimization when the less sensitive FP assay was insufficient to differentiate more potent inhibitors. The lowest IC50 value measurable in the FP assay could not be less than 50 nM, which was 50% of the concentration of the Keap1 Kelch domain protein used. In contrast, the lower limit for the IC50 in the TR-FRET assay is 2.5 nM. Indeed, when we used the two known direct inhibitors of Keap1–Nrf2 PPI with Ki’s in the submicromolar to nanomolar range, both inhibitors were shown to display the typical sigmoidal dose–response curves, indicating that this TR-FRET assay could be used to identify active compounds with a broader range of potency. The difference between this TR-FRET assay and the earlier FP assay was clearly evident from Figure 7 , in which the relationships between IC50 and Ki for both the TR-FRET and FP assays are simulated: The two lines are much closer together at high Ki values, while the TR-FRET line reaches the subnanomolar range before it plateaus, suggesting that TR-FRET here is a more attractive assay for the differentiation of more potent direct inhibitors of the Keap1–Nrf2 PPI in the nanomolar range. Furthermore, our new TR-FRET assay requires only three components rather than the four components that are usually needed for many TR-FRET assays, contributing to the simplified protocol, operational ease of use, and lower assay cost. The new TR-FRET assay will be very useful and complementary to the existing FP, SPR, and other TR-FRET assays during HTS and lead optimization campaigns for the discovery of direct inhibitors of the Keap1–Nrf2 interaction.
Footnotes
Declaration of Conflicting Interests
The authors declared the following potential conflicts of interest with respect to the research, authorship, and/or publication of this article: Some of the authors are inventors of patents on the FP assay and one of the inhibitors of Keap1–Nrf2 PPI mentioned in this article. Rutgers University has filed a provisional patent application on the current TR-FRET assay with the US Patent and Trademark Office.
Funding
The authors disclosed receipt of the following financial support for the research, authorship, and/or publication of this article: We gratefully acknowledge the financial support of Grant CA133791 (to L.H.) from the National Institutes of Health.