The determination of signaling pathways and transcriptional networks that control various biological processes is a major challenge from both basic science and translational medicine perspectives. Because such analysis can point to critical disease driver nodes to target for therapeutic purposes, we combined data from phenotypic screening experiments and gene expression studies of mouse neurons to determine information flow through a molecular interaction network using a network propagation approach. We hypothesized that differences in information flow between control and injured conditions prioritize relevant driver nodes that cause this state change. Identifying paths likely taken from potential source nodes to a set of transcription factors (TFs), called sinks, we found that kinases are enriched among source genes sending significantly different amounts of information to TFs in an axonal injury model. Additionally, TFs found to be differentially active during axon growth were enriched in the set of sink genes that received significantly altered amounts of information from source genes. Notably, such enrichment levels hold even when restricting the set of source genes to only those kinases observed to support or hamper neurite growth. That way, we found a set of 71 source genes that send significantly different levels of information to axon growth-relevant TFs. We analyzed their information flow changes in response to axonal injury and their influences on TFs predicted to facilitate or antagonize axon growth. Finally, we drew a network diagram of the interactions and changes in information flow between these source genes and their axon growth-relevant sink TFs.
The determination of signaling pathways and transcriptional networks that control various biological processes is a major challenge from both basic science and translational medicine perspectives. Functional genomics approaches using gene overexpression and knockdown/knockout have high false-positive and false-negative rates due to off-target effects, gain-of-function effects, and gene compensation. Such approaches also usually fail to find networks of targets that work synergistically. Complex networks, such as biological molecular networks, have many driver nodes and cannot be altered significantly by disrupting a single node.1-3 Consequently, using highly specific chemical probes, it is often difficult to alter complicated cellular processes or even identify their relevant networks.
Alternatively, computational approaches to identifying driver nodes in complex biological networks are dependent on the richness and reliability of the source data.3 Information on protein–protein interactions and signaling cascades is often collected from immortal cell lines with different gene expression patterns than those of primary cells, especially considering specific types of neurons at a given developmental stage. These cell lines also typically lack information required to understand the functions of highly polarized cells like neurons.
Previously, we have conducted phenotypic knockout, overexpression, and small-molecule screens to identify kinases that influence neurite outgrowth.4,5 We have also used machine learning strategies to analyze epigenetic and transcriptional information to predict differential gene expression.6 Here, we combine network approaches with results from phenotypic screens to determine the directed flow of information through a molecular interaction network to prioritize putative nodes for targeting in challenging therapeutic areas where the states of cells need to be fundamentally altered, such as in regenerative medicine and cancer.
Through a network propagation approach, we simulate a random walker that traverses a molecular interaction network that was weighted by gene expression to identify paths from potential information source nodes to a set of transcription factors (TFs) in an axonal injury model.7-9 Generally, kinases were enriched among source genes that send either significantly more or less information to TFs in an axonal injury model. Furthermore, TFs that were differentially active during axon growth were enriched in the set of sink nodes, receiving significantly altered amounts of information from source genes. When we considered source nodes that sent significantly altered levels of information to such axon-relevant TFs, we found a significant enrichment of kinases that support or hamper neurite growth in knockout and overexpression phenotypic screens. Building on these observations, we mapped source–sink pairs of genes with significantly altered information flow in axonal injury and found a set of 71 source genes that sent altered levels of information to axon growth-relevant TFs. Notably, we found that such genes mostly interacted directly with TFs, pointing to a kernel of kinases and TFs that govern growth in an axonal injury model.
Materials and Methods
Absorption at Sinks
We represent a directed interaction network as G = (V, E), where V is a finite set of vertices of size n, and E ⊆ V × V is a set of edges and defines . Let P denote the n × n transition stochastic matrix that we define as , where Pij is the probability of a random walk moving from a vertex i to j.
Considering a set of sink nodes S and the remainder as a set of transient nodes T = V\S, the transition matrix changes to , where, for example, PTS holds the probabilities that random walkers start from a node in the transient set and end up in a sink node.
Assuming that information can dissipate at a transient node, we use gene expression as a proxy for dissipation of information. In particular, we define vectors eC, eI of length n, such that is the mean expression of gene j in all control samples C, and is the mean expression of gene j in all injury samples I. We then form a matrix P′ with entries , indicating that information being passed forward by any gene is proportional to its expression in the data set.
We suppose that any information reaching a sink vertex is absorbed and cannot leave it. Assuming that m = |T| and n = |V|, we define an -dimensional matrix F(t) such that Fij(t) holds the probability that information from a given transient node i ∈ T emanates and was absorbed in a sink node j ∈ S in t or fewer steps. Node j can absorb information in t or fewer steps in two ways, either j can be reached in the first step or it can be moved to some other transient vertex k in first step and absorbed by j in at most t – 1 steps. Therefore, we can represent . Considering the limit of infinite steps, we obtain , so that , where and I is the identity matrix.10
Calculating the difference between the injured and control cases, I and C, we define ▵D, where each entry in ▵Dij indicates the difference of information flow from transient node i to a sink node j. We then use the Z score to find the significant pairs of difference in information flow between injured and control cases through , where are the mean and standard deviation of F values.
Mouse Kinases and TFs
We utilized a set of 608 mouse kinases that have human orthologs from Caenepeel et al.11 Furthermore, we utilized a total of 126 kinases with an experimentally observed effect on the growth of neurites when they were knocked down.4 Specifically, we utilized the union of the kinases found in Table 1 and Supplementary Table 5 (kinases were selected when MAXIS score > 20) of ref. 4 and Supplemental Table 3 of ref. 5, allowing us to find a set of 71 kinases that supported, as well as 55 kinases that hampered, neurite growth. In addition, we accounted for a set of 226 kinases that were found to influence axon growth when overexpressed. Utilizing the kinases found in Supplemental Table 1 of Buchser et al.,5 we obtained 66 kinases that supported growth, while we found 160 kinases that hampered growth when overexpressed. In particular, kinases were selected when p value of primary neurite growth, neurite total length or average branch point count per primary neurite was < 0.05.
Among the 1726 mouse TFs, we accounted for a set of 488 TFs measured for differential activity during mouse axon regeneration.6 From that set, we considered a set of 104 TFs as significantly differentially active during axon growth, which were identified in Figure 6A,C and Supplementary Table 6 of Palmisano et al.6 In particular, we averaged the Bagfoot scores of these TFs that were obtained from ATAC-seq data after injury at the level of enhancers and promoters and considered a set of 58 agonist TFs with a Z score > 1 and 46 antagonist TFs with a Z score < –1.
Protein Interactions
We collected mouse-specific protein interaction information from the KEGG12 and Reactome13 databases that was parsed with the graphite R tool.14 In particular, we utilized 299 KEGG and 1608 Reactome pathways, which allowed us to establish a directed network of 335,183 interactions among 10,573 mouse genes.
Expression Data
We utilized an expression set of 7845 mouse genes in neuronal injury and a noninjury control case.6 The neuronal injury was a peripheral axotomy to dorsal root ganglion neurons, which results in axonal regeneration following injury. Three biological replicates of each condition were measured using a total of 12 mice: 6 injured and 6 uninjured, with pairs of mice being pooled together for each replicate. Samples were collected 24 h after either axonal injury or sham surgery.
Enrichment Analysis
In a group i of proteins, we determined the number of proteins with a certain characteristic A (e.g., being a kinase), . Randomly sampling the same number of proteins in group i, we calculated the corresponding random number of proteins with characteristic A, . We defined the enrichment of proteins with characteristic A in a group i of proteins as .
Furthermore, the enrichment of proteins with a certain characteristic A was determined as a function of the number of links k. In particular, is the number of proteins with A that had links. Randomly sampling a set of proteins with characteristic A, we calculated the corresponding random number of . The enrichment of these proteins in a group of proteins with at least k links was then defined as . In both cases, points to an enrichment of feature A and vice versa. In particular, proteins with feature A were sampled 10,000 times and averaged enrichment values thus obtained.
Results
Here, we consider a network of mouse-specific protein interaction information that we collected from the KEGG12 and Reactome13 databases using the graphite R tool.14 Utilizing 299 KEGG and 1608 Reactome pathways, we established a directed network of 335,183 interactions among 10,573 mouse genes. To determine the flow of information in the underlying network, we applied a network propagation approach.10 In particular, we calculated the probability that a random walker emanated from a node i and ended in a node j. Furthermore, we stipulated that random walks needed to end up in a set of sink nodes, which walkers cannot leave.10 Specifically, we curated a set of mouse TFs as a putative set of sink nodes. Remaining nodes in the underlying interaction network act as potential source nodes where random walkers emanate and end in a mouse TF. To account for the strength of expression of genes, we assume that a random walker’s move forward is attenuated as a function of the expression of the gene the walker moves to. To determine the differences that distinguish the flow of information between genes in an injury and noninjury case, we utilized a gene expression set of 7845 mouse genes in an axonal injury case and a noninjury control case6 and annotated each node in our interaction network with the average expression of each gene.
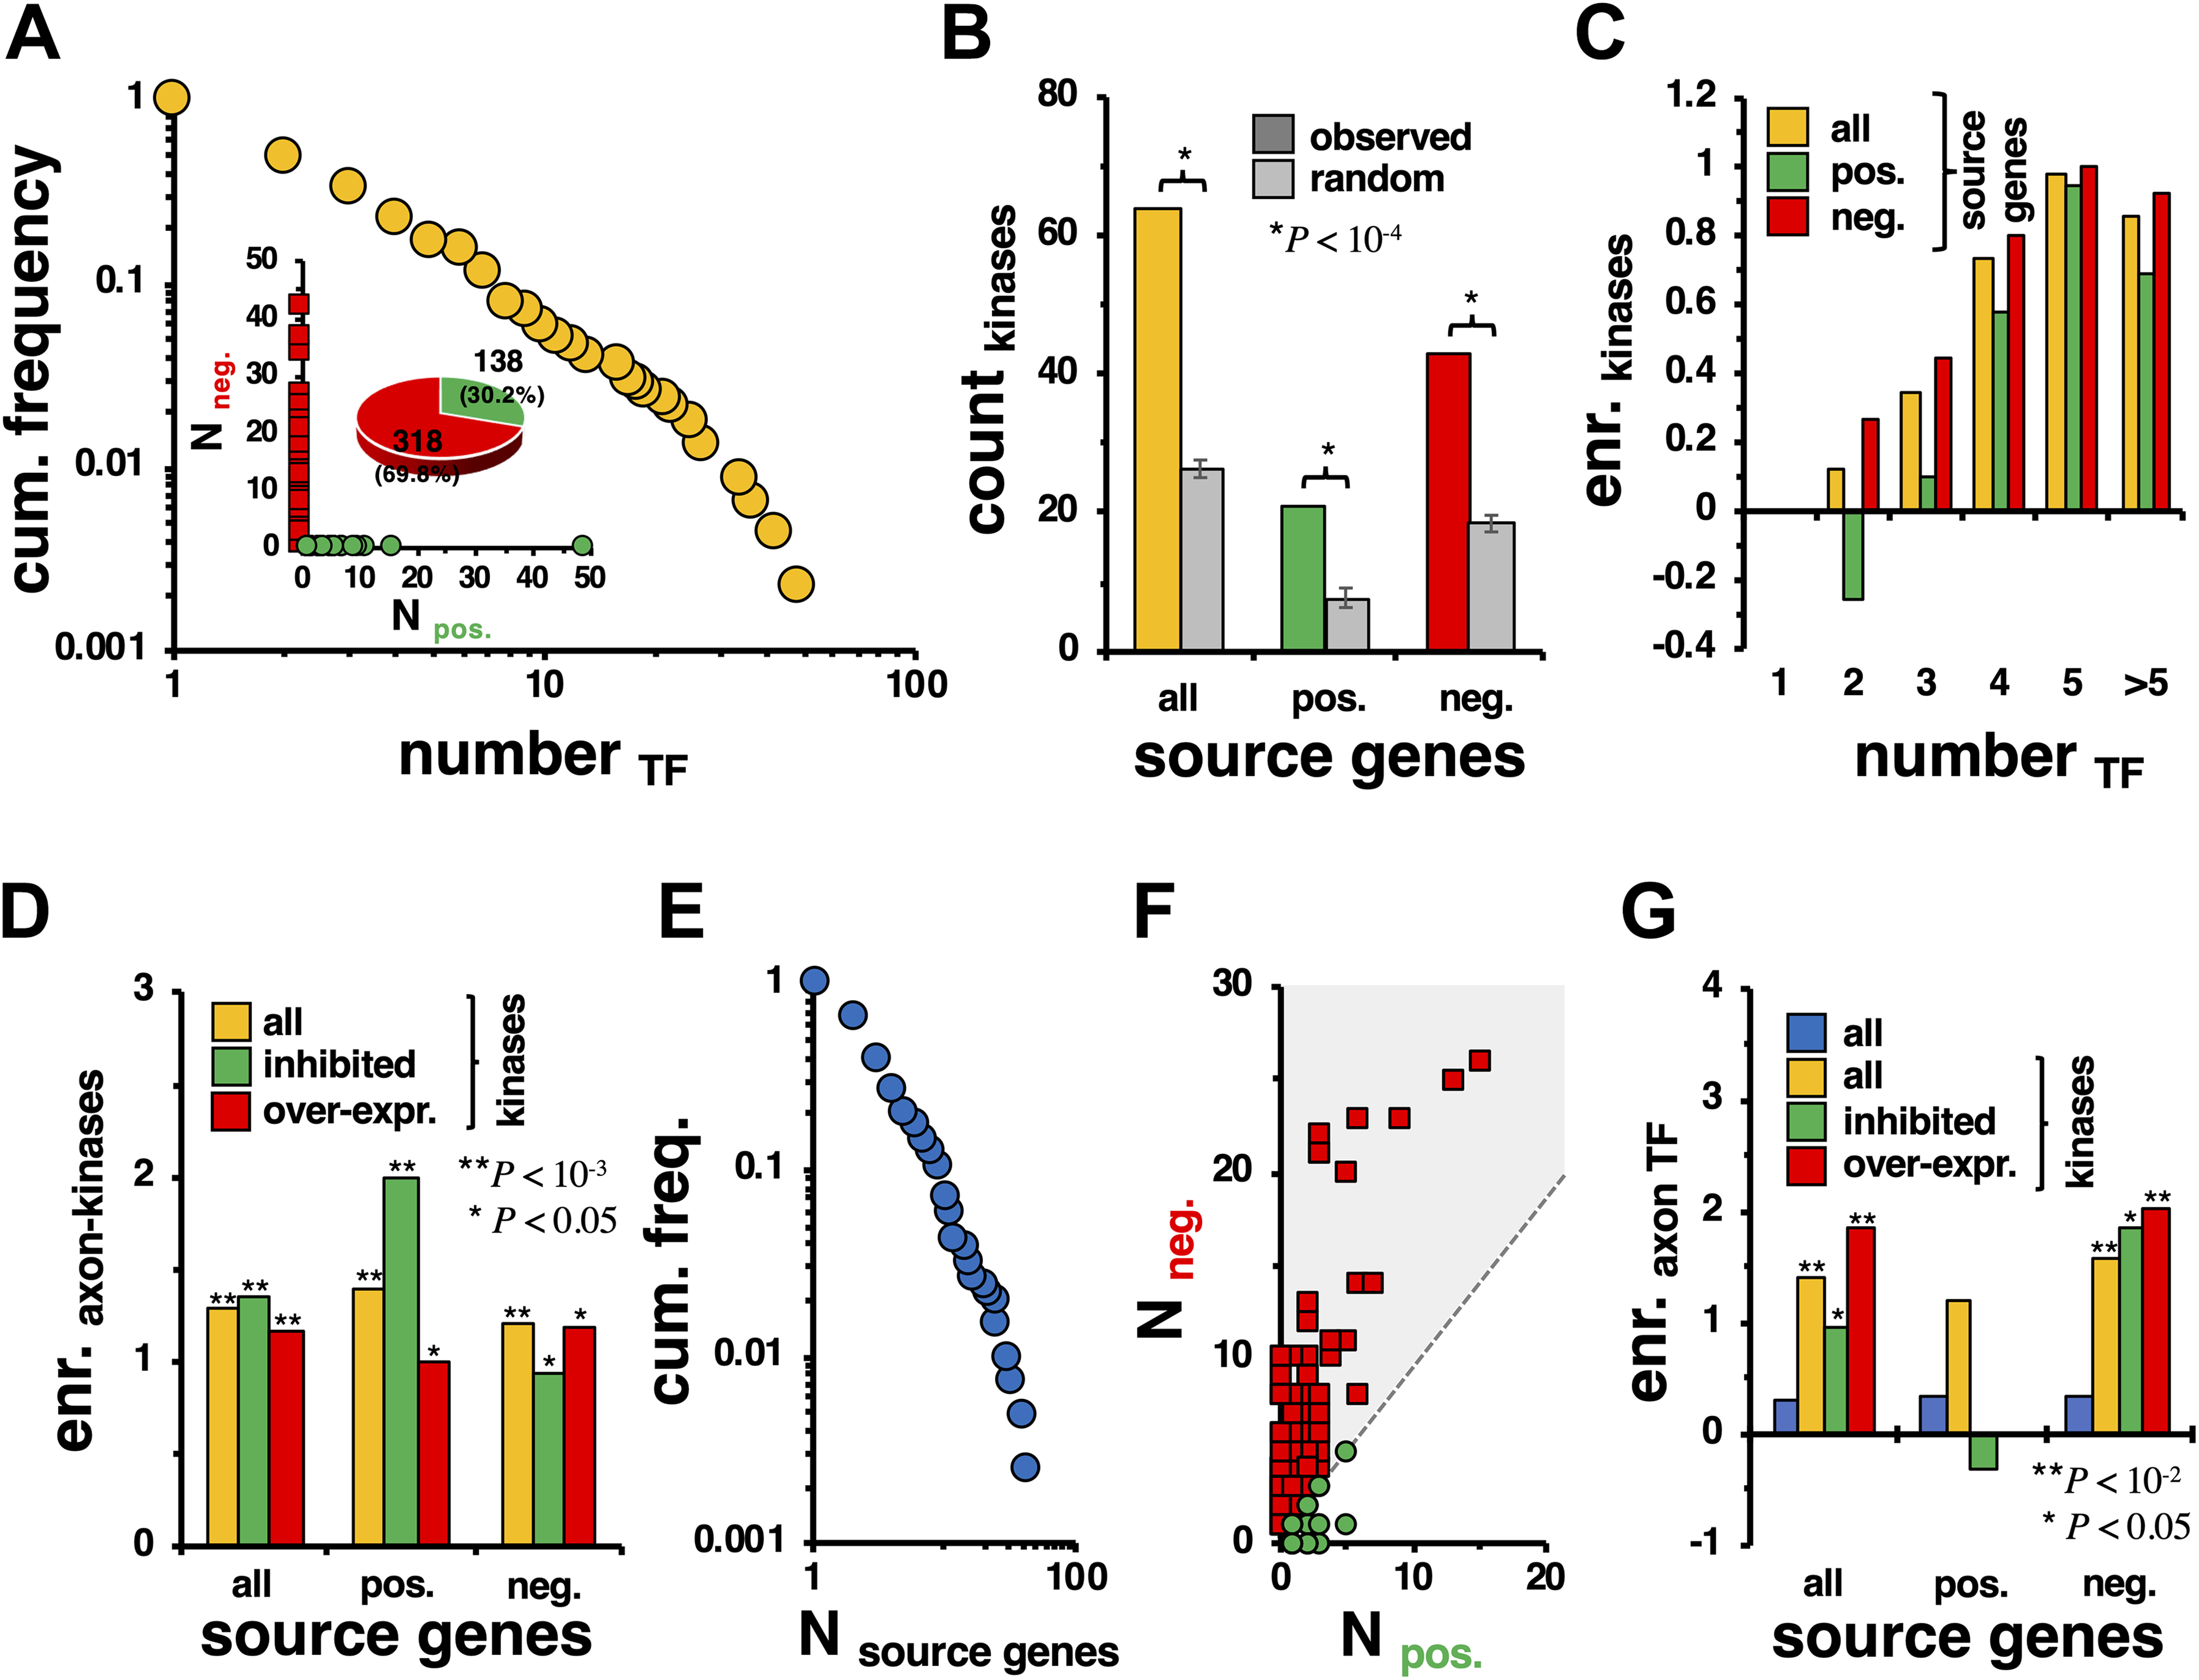
Applying our approach, we obtained two matrices of probabilities, determining the probability that a walker emanated from a gene i and ended in a TF j as a function of the gene’s expression in the injured and noninjured cases. To determine the pairs of sources and sinks that differ significantly between the injured and the noninjury cases, we calculated a Z score for every source–sink pair and considered links significantly different if |Z| > 2. Specifically, we obtained a bipartite network that consisted of 1509 links among 454 source genes and 418 mouse TFs. Analyzing this bipartite network, we counted the number of TFs to which any given source gene is connected. In Figure 1A, we observed that the corresponding cumulative frequency distribution has a fat tail, suggesting that a minority of source genes are connected to a large number of TFs. As each link indicates more (positive) or less (negative) information flowing from the source to TFs, we counted the number of positive/negative links a source node was involved in. Surprisingly, the inset of Figure 1A indicates that source genes are entirely involved in either positive or negative interactions. In particular, we found that roughly 70% of source genes provided less information in the injured case compared with the noninjury case (Fig. 1A, inset). As numerous kinases are known to be regulators in axon injury response and growth,4,5 we determined the enrichment of kinases in the set of source genes. Utilizing a general set of more than 600 mouse kinases, we observed that kinases were generally enriched when we randomly sampled from genes in the underlying network (Fig. 1B). Such an observation was corroborated when we considered sets of source genes that sent more or less information to their corresponding TFs. As a corollary, we found that such kinases were enriched in bins of increasingly connected source genes (Fig. 1C), indicating that kinases in particular tend to regulate many TFs. Independently from the number of connected TFs, we determined the enrichment of kinases that influenced neurite growth when knocked out.4,5 In particular, we considered 71 kinases that were experimentally shown to support neurite growth, while 55 hampered growth. Figure 1D suggests that source genes were more enriched with kinases that affect neurite growth when knocked out, compared with kinases in general. Furthermore, we confirmed the initial observations when we considered neurite growth-affecting kinase enrichment in groups of source genes that sent less/more information to TFs in the injured case. To corroborate our results, we additionally considered a set of 66 kinases that supported axon growth, as well as 160 kinases that hampered growth when overexpressed.5 Notably, we obtained similar results, indicating that “growth-relevant” kinases are significantly enriched in bins of source genes that sent more/less information to TFs in the injury case (Fig. 1D).
(A) Counting the number of TFs that are connected to source genes, we observed that a minority of source genes were linked to a large number of TFs and vice versa. In the inset, we considered the number of links of source genes that had positive (>2) or negative (<–2) Z scores. Notably, source genes uniformly sent either more or less information to their corresponding TFs in the injured case compared with the noninjury control case. Furthermore, we observed that roughly 70% of source genes were connected to TFs that received significantly less information flow in the injured case. (B) We counted the number of mouse kinases that appeared in the set of source genes that significantly differed in information emanation from TFs in the injured case. We corroborated our finding, observing that kinases were also enriched in sets of source genes that sent either more (positive) or less (negative) information to their corresponding TFs. (C) As a corollary, we found that kinases were further enriched in bins of more connected source genes, an observation that held for both types of source genes. (D) As a refinement, we determined the enrichment of axon-related kinases that influence axon growth, when knocked out. Furthermore, we considered a set of kinases that affect axon growth when overexpressed. In comparison to all kinases, axon-related kinases were significantly enriched in the set of source genes, a result that applied to positive and negative sets as well. (E) In this frequency distribution, we found that a minority of TFs significantly received more/less information from a large number of source genes and vice versa. (F) As a corollary, TFs largely were connected to source genes that emanated less information flow in the injured case. (G) We determined the enrichment of TFs that play a role in axon regeneration in sets of sink genes. When we considered all TFs that were entangled in links to source genes that significantly sent more/less information and compared injury to the noninjury control cases, we observed that axon-related TFs were weakly enriched. When we limited the set of source genes to kinases in general, we found that axon-related TFs were significantly enriched in the set of corresponding sink genes. Such enrichment signals were confirmed when we considered kinases that sent either significantly less or more information to their corresponding sink genes. Notably, we found a strengthened enrichment signal when we considered axon-related kinases that were knocked out or overexpressed. However, this enrichment signal applied only to source genes that sent significantly less information to their sink genes as we did not find any overexpressed axon-related kinases that sent more information to the corresponding TFs.
Next, we counted the number of source genes connected to each TF. In Figure 1E, we observed that the corresponding frequency distribution has a fat tail as well, indicating that a minority of TFs are connected to a large number of source genes and vice versa. Recalling that source genes are entirely emanating either less or more information to their corresponding TFs, we counted the number of positive and negative source genes that a given TF is connected to. In Figure 1F, we found that the TFs are mostly connected to source genes that sent less information to the corresponding TFs. To corroborate the significance of the TFs that were linked to source genes, we determined the enrichment of TFs found to be differentially active during axon growth.6 Considering a set of 104 TFs that play a role in axon growth, we found that such a set is weakly enriched in the set of sink nodes that source genes send significantly different amounts of information to (Fig. 1G). Focusing on kinases as source genes, we notably found an increased enrichment of axon-related TFs, an observation that held for positive and negative source kinases as well. Notably, when we considered kinases that play roles in neurite growth when knocked out or overexpressed, we found an amplification of the enrichment of axon-related TFs. Such an observation was driven by source kinases that sent less information to their corresponding TFs, as we did not find any enrichment for kinases in the set of sources that sent more information to the corresponding axon-related TFs.
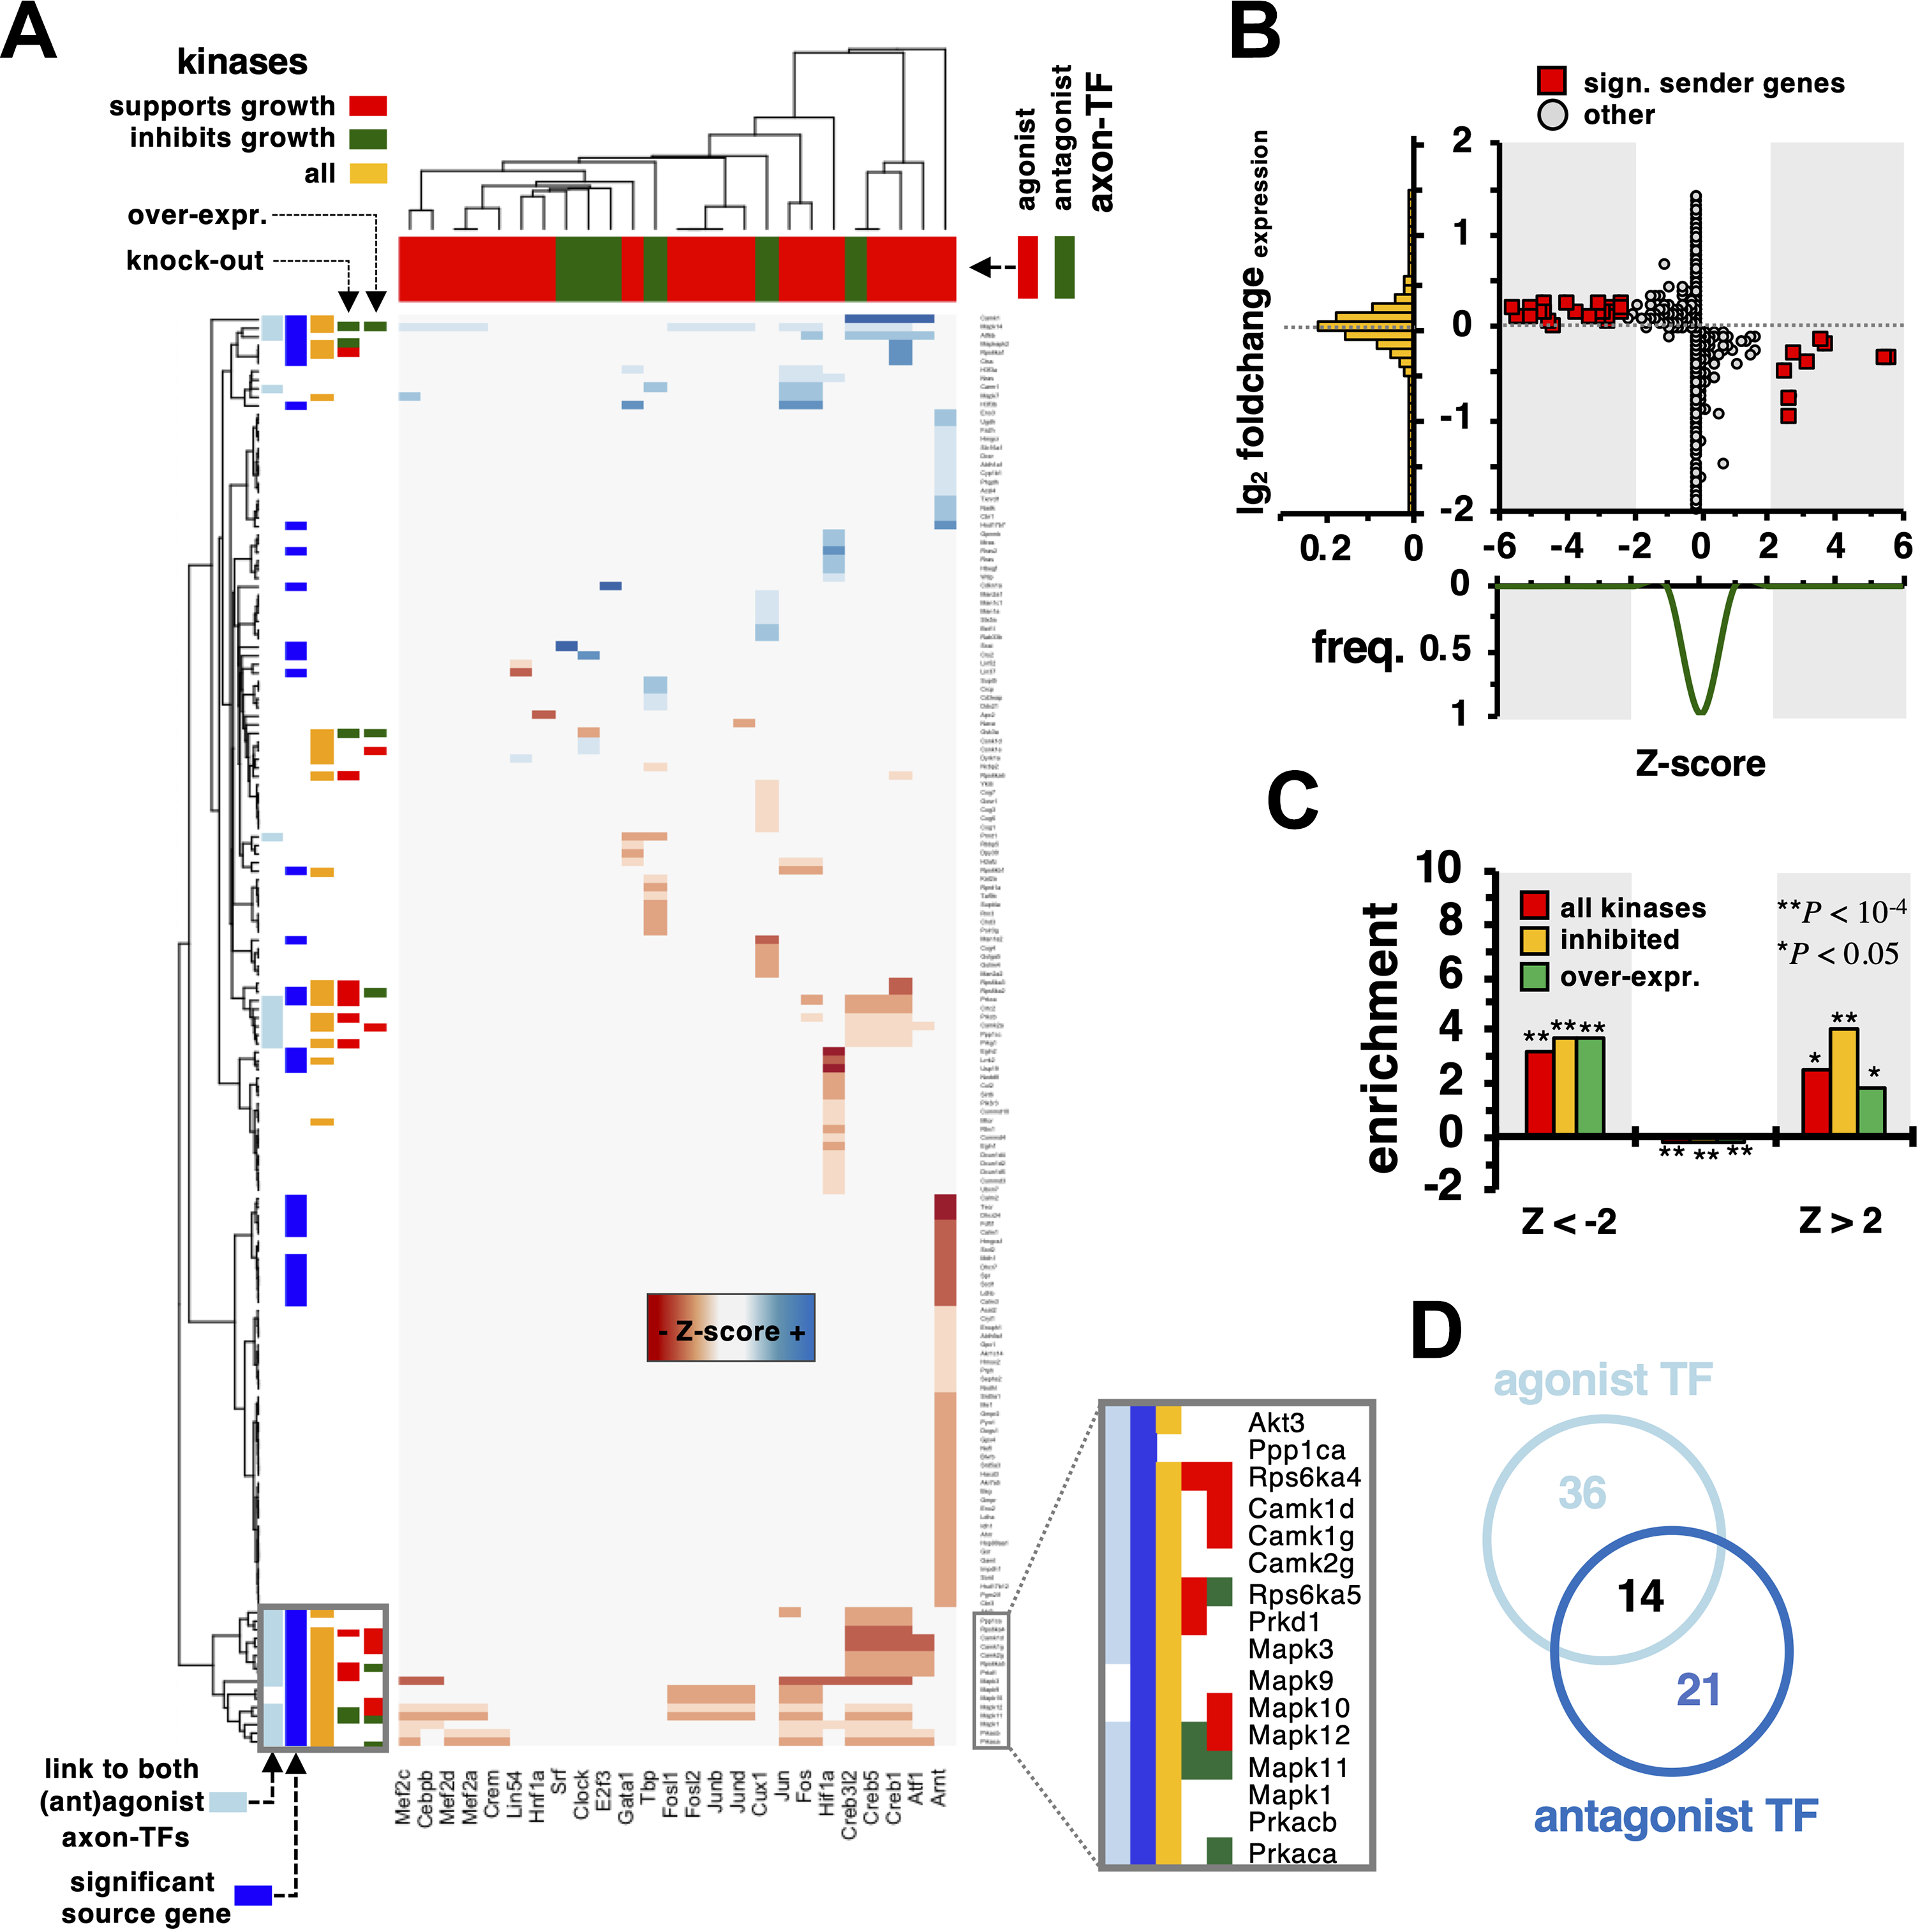
Mapping pairs of genes that sent significantly less (Z < –2) or more (Z > 2) information into axon-related TFs in Figure 2A and Supplementary Table S1, we observed a cluster of kinases that sent less information into TFs of the Creb/ATF/AP-1 superfamily (Creb1, Creb5, Creb3l1, Atf1, Fos, and Jun). Furthermore, we found that this cluster of source genes contained neurite growth-related kinases that support as well as hamper neurite growth. Notably, these genes also sent significant information into TFs that both support (agonist) and hamper (antagonist) axon growth. As we only considered pairs of axon-related TFs and genes where significantly different amounts of information were flowing, we determined the set of 47 source genes that significantly sent less/more information to any axon-related TF. In particular, we summed the probabilities that genes sent information to axon-related TFs in the injury case and the noninjury control case, separately. To find a set of source genes that sent more/less information to TFs, we determined the difference and considered source genes if the corresponding Z score was |Z| > 2, allowing us to obtain 12 (35) source genes that sent more (less) information to axon-related TFs. Notably, we observed that this set of significant source genes was enriched in the previously found cluster in the heatmap as well. In Figure 2B, we determined the expression fold change in the injury case compared with the noninjury control case. Surprisingly, we found that members of the set of 12 source genes that sent more information into TFs were mildly downregulated, while we found the opposite for 35 source genes that sent more information. In comparison, nonsignificant source genes appeared to have increased levels of expression variation. Furthermore, sets of significant source genes were enriched with kinases in general and kinases that were relevant for axon growth in particular, while we observed a weak dilution of kinases when we considered nonsignificant source genes (Fig. 2C). Extending sets of source genes, we considered genes that sent more/less information to positive (agonist) TFs only, allowing us to find 50 source genes. Analogously, we determined 35 source genes that sent significantly different amounts of information into negative (antagonist) TFs. In the Venn diagram in Figure 2D, we observed that the sets of source genes that separately sent information to agonist and antagonist TFs shared 14 source genes.
(A) In the heatmap, we indicated pairs of axon-related TFs and their corresponding source genes, if information flow from sources to TFs was significantly larger (Z > 2) or lower (Z < –2) in the injured compared with the noninjury control case. In addition, we annotated kinase source genes that support or hamper axon growth when knocked out or overexpressed. We further determined a set of 47 source genes that significantly sent less/more information to all axon-related TFs (dark blue boxes) as well as indicated if a source gene connects to both axon-related TFs that support (agonist) as well as hamper axon growth (antagonist) (light blue boxes). In particular, we observed a cluster of kinases that sent less information into TFs Creb1, Creb5, Creb3l1, Atf1, Fos, and Jun. (B) Out of the set of 47 significant source genes, we found 12 that sent more information to axon-related TFs (Z > 2), while 35 sent less information (Z < –2). Determining their expression fold change in the injured case, we observed that source genes that sent less information were slightly overexpressed and vice versa, compared with the expression of remaining genes. (C) As a corollary, we observed that the set of 12 and 35 source genes that significantly sent less/more information to axon-related TFs were significantly enriched with kinases as well as kinases that significantly hampered/supported axon growth when knocked out or overexpressed. (D) Furthermore, we determined a set of 50 significant source genes that sent information to TFs that supported axon growth (agonist). Analogously, we obtained a set of 35 significant source genes that connected to TFs that hampered (antagonist) axon growth. The Venn diagram indicates the existence of 14 source genes that were linked to both agonist and antagonist TFs.
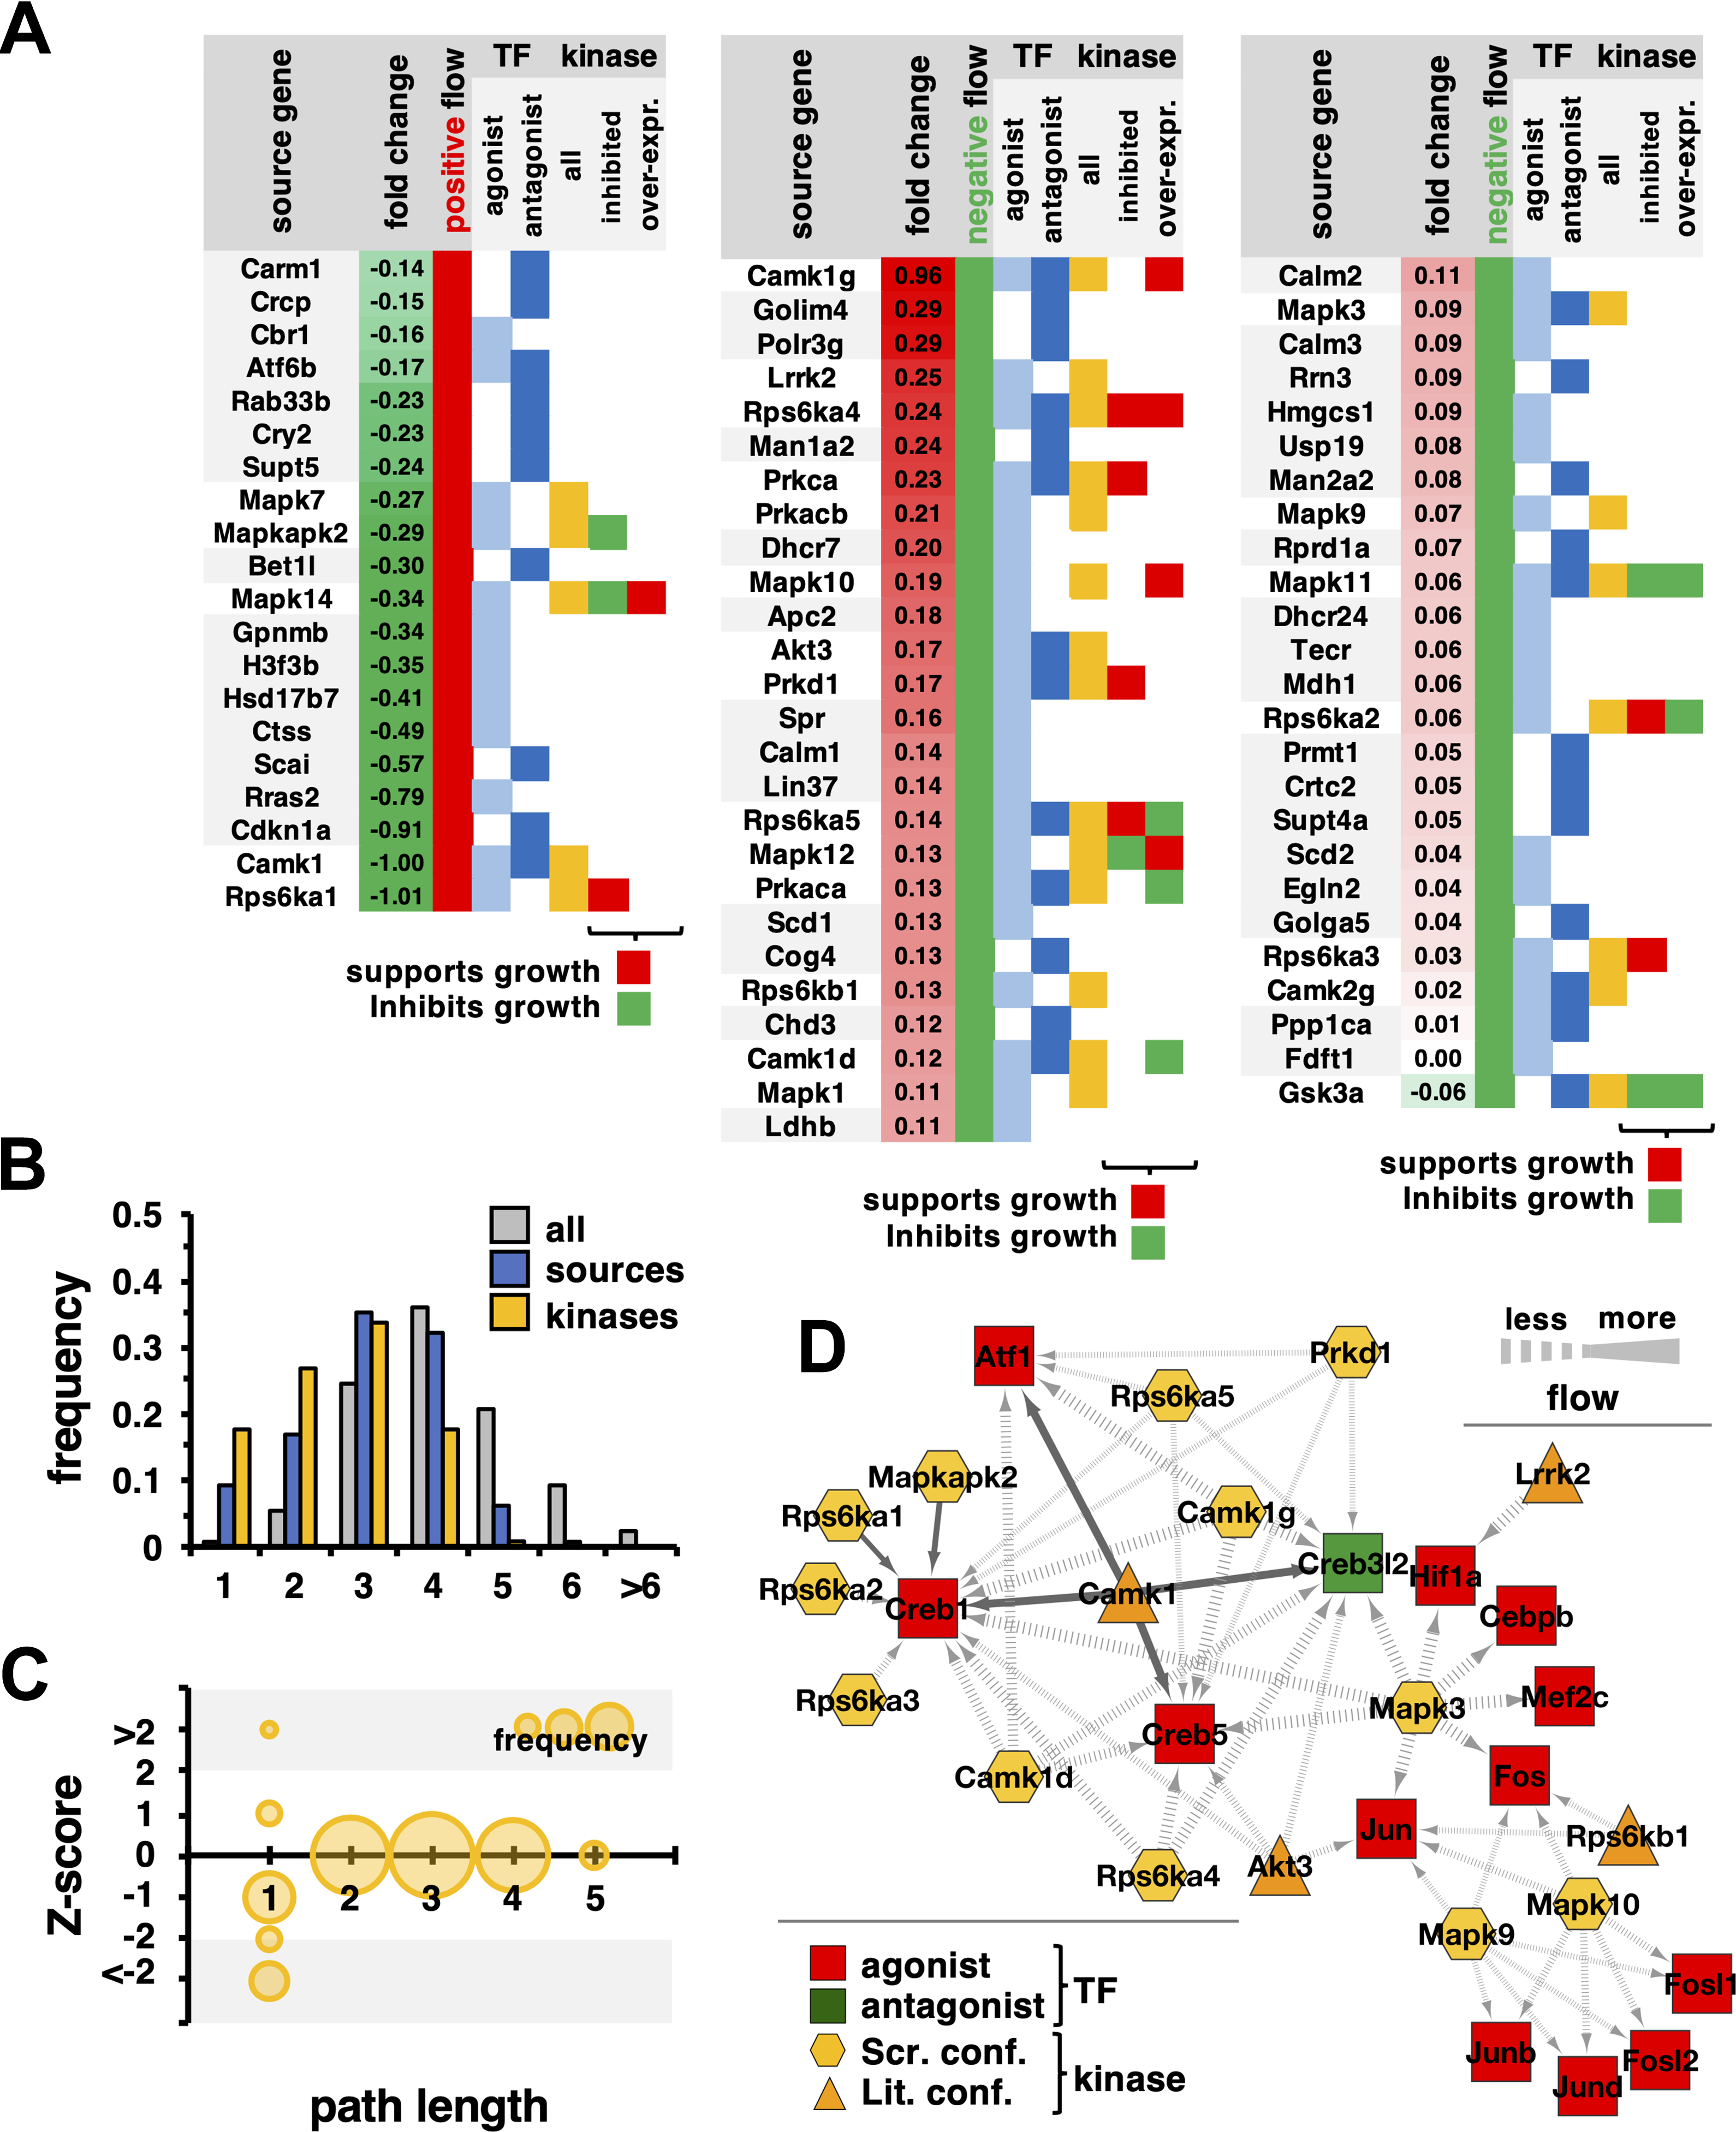
Combining these sets, we obtained a final set of 71 source genes that differentially send information to axon-related TFs (Fig. 3A). Generally, we observed that most source genes sent less information to the corresponding TFs. Notably, we found that such genes were strongly populated with kinases (21/51). Furthermore, source genes that sent less information were generally slightly upregulated and, conversely, source genes that sent more information were usually slightly downregulated. In Figure 3B, we first determined a background frequency distribution of lengths of the shortest paths from all genes in the underlying network to axon-related TFs. To find out how far away significant source genes are from their TFs in the underlying interaction network, we determined the shortest paths from 71 source genes to axon-related TFs. Notably, we observed that such distribution was significantly shifted to smaller path lengths compared with the background (p < 10–20, Student t test). Such an observation was reinforced when we focused on kinases in the underlying set of source genes, suggesting that source genes are connected to corresponding axon-related TFs through a direct molecular interaction. In Figure 3C, we corroborated this hypothesis, by calculating the shortest path lengths from source genes to TFs as a function of the Z score of the corresponding kinase–TF pair. We clearly observed that pairs with |Z| > 2 were directly connected. In the network in Figure 3D, we mapped all such direct interactions between kinases and axon-related TFs with |Z| > 2. Interestingly, this group of direct-interacting kinases consisted entirely (16/16) of those experimentally confirmed to influence axon growth, including S6 kinases,15 MAP kinases,16 Cam kinases,17 Akt3,18 and Lrrk2.19,20 A minority of these axon growth-regulating kinases (4/16) either were not tested or did not have effects in the phenotypic screening data that we used as the basis for our analysis. Nevertheless, this approach was able to resolve their importance based on the network analysis and the gene expression data.
(A) We annotated 71 source genes that sent significantly more or less information to axon-related TFs. Sorted by their expression fold change, we observed that source genes that were overexpressed in the injured case tend to send significantly less information to their corresponding axon-related TFs and vice versa. As indicated in the Venn diagram in Figure 2D, we observed 14 source genes that sent significant information to both agonist and antagonist TFs. Furthermore, we observed that a sizable fraction of all source genes were kinases, including kinases that influenced axon growth when knocked out or overexpressed. (B) We determined a background frequency distribution of lengths of the shortest paths from all genes in the underlying network to axon-related TFs. Refining our approach, we determined the shortest paths from 71 source genes as well as all kinases in the source gene set to axon-related TFs. Notably, we observed that such distribution was significantly shifted to smaller path lengths compared with the background (p < 10–20, Student t test). (C) Focusing on pairs of kinase source genes and axon-related TFs, we determined corresponding shortest paths. Notably, we observed that pairs with |Z| > 2 were directly connected by molecular interactions (shaded areas). (D) In the network we mapped direct interactions between kinase source genes and axon-related TFs that had |Z| > 2. We labeled the kinases to identify the source of experimental validation of their influence on axon growth, based on either screening data or external literature confirmation.
Discussion
Using a network propagation approach, we took advantage of a rich and diverse data set, combining information about protein–protein interactions and differential gene expression after neuronal injury with knowledge from several sources about which proteins in two specific classes (kinases and TFs) are involved in the regulation of axon outgrowth. Our approach made several key assumptions: kinases are among the important sources of signaling network information in neurons; TFs, because of their ability to regulate the expression of large numbers of genes, are important “sinks” for network information; and we have an initial understanding of some of the kinases and TFs that are involved specifically in axon growth regulation.
Our experimental analysis has some known limitations. While our model assumes that the information absorbed in TFs cannot leave, they may actually regulate source genes, creating a cyclic effect. However, since we consider gene expression to reflect the strength of a gene’s ability to pass the information forward, we believe that it sufficiently captures the feedback effect for a given snapshot of the expression data. Also, since the gene expression data we use are from a single time point, our analysis could be made more comprehensive by considering expression data from different phases of the neuronal injury response.
Our analysis indicates that source genes in the network transmit either more information to each of their TF sinks after injury or less information, but not a mixture, and that most “sources” provide less information to TFs after injury. Interestingly, kinases are more likely to be “strongly connected” than other sources (larger numbers of TF sinks), and kinases (especially growth-relevant kinases) are overrepresented in the source genes that signal changes in the network after injury. Conversely, TFs implicated in axon growth regulation are enriched in the set of sinks for these growth-relevant kinases. Finally, source genes that changed information flow to TFs, especially kinases, were connected to growth-relevant TFs by shorter paths than the “background.” In fact, kinases with significantly changed information flow after injury were directly connected to axon-relevant TFs in the network. Overall, our findings indicate that combining computational network approaches with the rich data sets available from RNA sequencing and phenotypic screens provides insight into the sets of proteins that are important for information flow in specific neuronal states. In particular, they implicate a set of kinases as important nodes for signaling state changes with neuronal injury, and a set of TFs as relevant targets for these signals. The approach used here is generally applicable as a way to leverage the results of several disparate types of experiment to study the flow of information through biological networks and should be relevant to many other disease and developmental situations.
Supplemental Material
Supplemental Material, SupplTable1 - Computational Identification of Kinases That Control Axon Growth in Mouse
Supplemental Material, SupplTable1 for Computational Identification of Kinases That Control Axon Growth in Mouse by Prajwal Devkota, Matt C. Danzi, Vance P. Lemmon, John L. Bixby and Stefan Wuchty in SLAS Discovery
Footnotes
Declaration of Conflicting Interests
The authors declared no potential conflicts of interest with respect to the research, authorship, and/or publication of this article.
Funding
The authors disclosed receipt of the following financial support for the research, authorship, and/or publication of this article: This work was supported by National Institutes of Health grants HD057632 and NS100531 (J.L.B. and V.P.L.), the Buoniconti Fund (J.L.B. and V.P.L.), the Miami Project to Cure Paralysis (J.L.B. and V.P.L.), and the Walter G. Ross Foundation (V.P.L.).
ORCID iD
Vance P. Lemmon
Supplemental material for this article is available online.
References
1.
LiuY. Y.SlotineJ. J.BarabasiA. L. Controllability of Complex Networks. Nature2011, 473, 167–173.
2.
YuanZ.ZhaoC.DiZ., et al.Exact Controllability of Complex Networks. Nat. Commun. 2013, 4, 2447.
3.
LiM.GaoH.WangJ., et al.Control Principles for Complex Biological Networks. Brief Bioinform. 2019, 20, 2253–2266.
4.
Al-AliH.LeeD. H.DanziM. C., et al.Rational Polypharmacology: Systematically Identifying and Engaging Multiple Drug Targets to Promote Axon Growth. ACS Chem. Biol. 2015, 10, 1939–1951.
PalmisanoI.DanziM. C.HutsonT. H., et al.Epigenomic Signatures Underpin the Axonal Regenerative Ability of Dorsal Root Ganglia Sensory Neurons. Nat. Neurosci. 2019, 22, 1913–1924.
7.
ChandranV.CoppolaG.NawabiH, et al.A Systems-Level Analysis of the Peripheral Nerve Intrinsic Axonal Growth Program. Neuron2016, 89, 956–970.
8.
HerdegenT.KummerW.FiallosC. E., et al.Expression of c-JUN, JUN B and JUN D Proteins in Rat Nervous System Following Transection of Vagus Nerve and Cervical Sympathetic Trunk. Neuroscience1991, 45, 413–422.
9.
NadeauS.HeinP.FernandesK. J., et al.A Transcriptional Role for C/EBP Beta in the Neuronal Response to Axonal Injury. Mol. Cell. Neurosci. 2005, 29, 525–535.
10.
StojmirovicA.YuY. K. Information Flow in Interaction Networks. J. Comput. Biol. 2007, 14, 1115–1143.
11.
CaenepeelS.CharydczakG.SudarsanamS., et al.The Mouse Kinome: Discovery and Comparative Genomics of All Mouse Protein Kinases. Proc. Natl. Acad. Sci. U.S.A. 2004, 101, 11707–11712.
12.
OgataH.GotoS.SatoK., et al.KEGG: Kyoto Encyclopedia of Genes and Genomes. Nucleic Acids Res. 1999, 27, 29–34.
13.
JupeS.AkkermanJ. W.SoranzoN., et al.Reactome—A Curated Knowledgebase of Biological Pathways: Megakaryocytes and Platelets. J. Thromb. Haemost. 2012, 10, 2399–2402.
14.
SalesG.CaluraE.CavalieriD., et al.Graphite—A Bioconductor Package to Convert Pathway Topology to Gene Network. BMC Bioinform. 2012, 13, 20.
15.
Al-AliH.DingY.SlepakT., et al.The mTOR Substrate S6 Kinase 1 (S6K1) Is a Negative Regulator of Axon Regeneration and a Potential Drug Target for Central Nervous System Injury. J. Neurosci. 2017, 37, 7079–7095.
16.
HammarlundM.NixP.HauthL., et al.Axon Regeneration Requires a Conserved MAP Kinase Pathway. Science2009, 323, 802–806.
17.
WaymanG. A.LeeY. S.TokumitsuH., et al.Calmodulin-Kinases: Modulators of Neuronal Development and Plasticity. Neuron2008, 59, 914–931.
18.
DiezH.GarridoJ. J.WandosellF. Specific Roles of Akt Iso Forms in Apoptosis and Axon Growth Regulation in Neurons. PLoS One2012, 7, e32715.
19.
SepulvedaB.MesiasR.LiX, et al.Short- and Long-Term Effects of LRRK2 on Axon and Dendrite Growth. PLoS One2013, 8, e61986.
20.
KaplanA.OttmannC.FournierA. E. 14-3-3 Adaptor Protein-Protein Interactions as Therapeutic Targets for CNS Diseases. Pharmacol. Res. 2017, 125, 114–121.
Supplementary Material
Please find the following supplemental material available below.
For Open Access articles published under a Creative Commons License, all supplemental material carries the same license as the article it is associated with.
For non-Open Access articles published, all supplemental material carries a non-exclusive license, and permission requests for re-use of supplemental material or any part of supplemental material shall be sent directly to the copyright owner as specified in the copyright notice associated with the article.