
Abstract
Genomic approaches provide enormous amounts of raw data with regard to genetic variation, the diversity of RNA species, and protein complement. High-throughput (HT) and high-content (HC) cellular screens are ideally suited to contextualize the information gathered from other “omic” approaches into networks and can be used for the identification of therapeutic targets. Current methods used for HT–HC screens are laborious, time-consuming, and prone to human error. The authors thus developed an automated high-throughput system with an integrated fluorescent imager for HC screens called the AI.CELLHOST. The implementation of user-defined culturing and assay plate setup parameters allows parallel operation of multiple screens in diverse mammalian cell types. The authors demonstrate that such a system is able to successfully maintain different cell lines in culture for extended periods of time as well as significantly increasing throughput, accuracy, and reproducibility of HT and HC screens.
Introduction
N
High-throughput screens (HTS) and high-content (HC) screens (HCS) can facilitate our understanding of the information gathered from other “omic” approaches into networks and function in an appropriate time scale. 2 Combined with effective methods to systematically modify gene expression/function (e.g., shRNA genome-wide libraries, overexpression libraries), many laboratories have successfully completed HT–HC screens in a variety of cellular models to identify novel pathways and genes involved in cellular processes. 3
Nevertheless, several issues have precluded HT–HC screening from delivering on its full potential of aiding genomic annotation and drug discovery.4,5 Limited throughput, high cost, environmental variation, and human error have led to low screen reproducibility and significant concerns about type I and II errors. To manipulate and detect changes in various cellular processes in the time and scale that are necessary, new methods have to be developed. These methods have to decrease variation, error, and cost while increasing sensitivity and reproducibility. To address these issues, we have developed the AI.CELLHOST. The system is a fully automated cell culture robot with an integrated fluorescent imager, which allows one to conduct HCS in a variety of cell types with increased precision and reproducibility.
Methods
Human cell culture
SH-SY5Y, BE(2)M17, and HEK293T (European Collection of Cell Cultures) cell lines were maintained in Opti-MEM I (Invitrogen, Carlsbad, CA) supplemented with 10% fetal bovine serum (FBS; Gibco, Carlsbad, CA) and incubated at 37 °C with 5% CO2. Prior to the trypsinization of the cells with trypsin (Gibco), cells were washed with prewarmed phosphate-buffered saline (PBS; Gibco). As cells began to detach, trypsin was neutralized with Opti-MEM I containing 10% FBS. Cells were reseeded into T75 flasks at 1.4 × 10⁶ per flask.
Differentiation of SH-SY5Y cells
One day after seeding the cells, media were replaced with Opti-MEM I containing 0.5% FBS and 0.1 µM retinoic acid (Sigma-Aldrich, St. Louis, MO; day 0). Media were then refreshed on day 3, and cells were fully differentiated after 5 days. For the cell viability assay, 1 × 10⁵ cells were seeded per well of a 96-well plate. For HC assays, 5 × 10⁴ cells were seeded per well of a 96-well plate.
Robotic cell culture
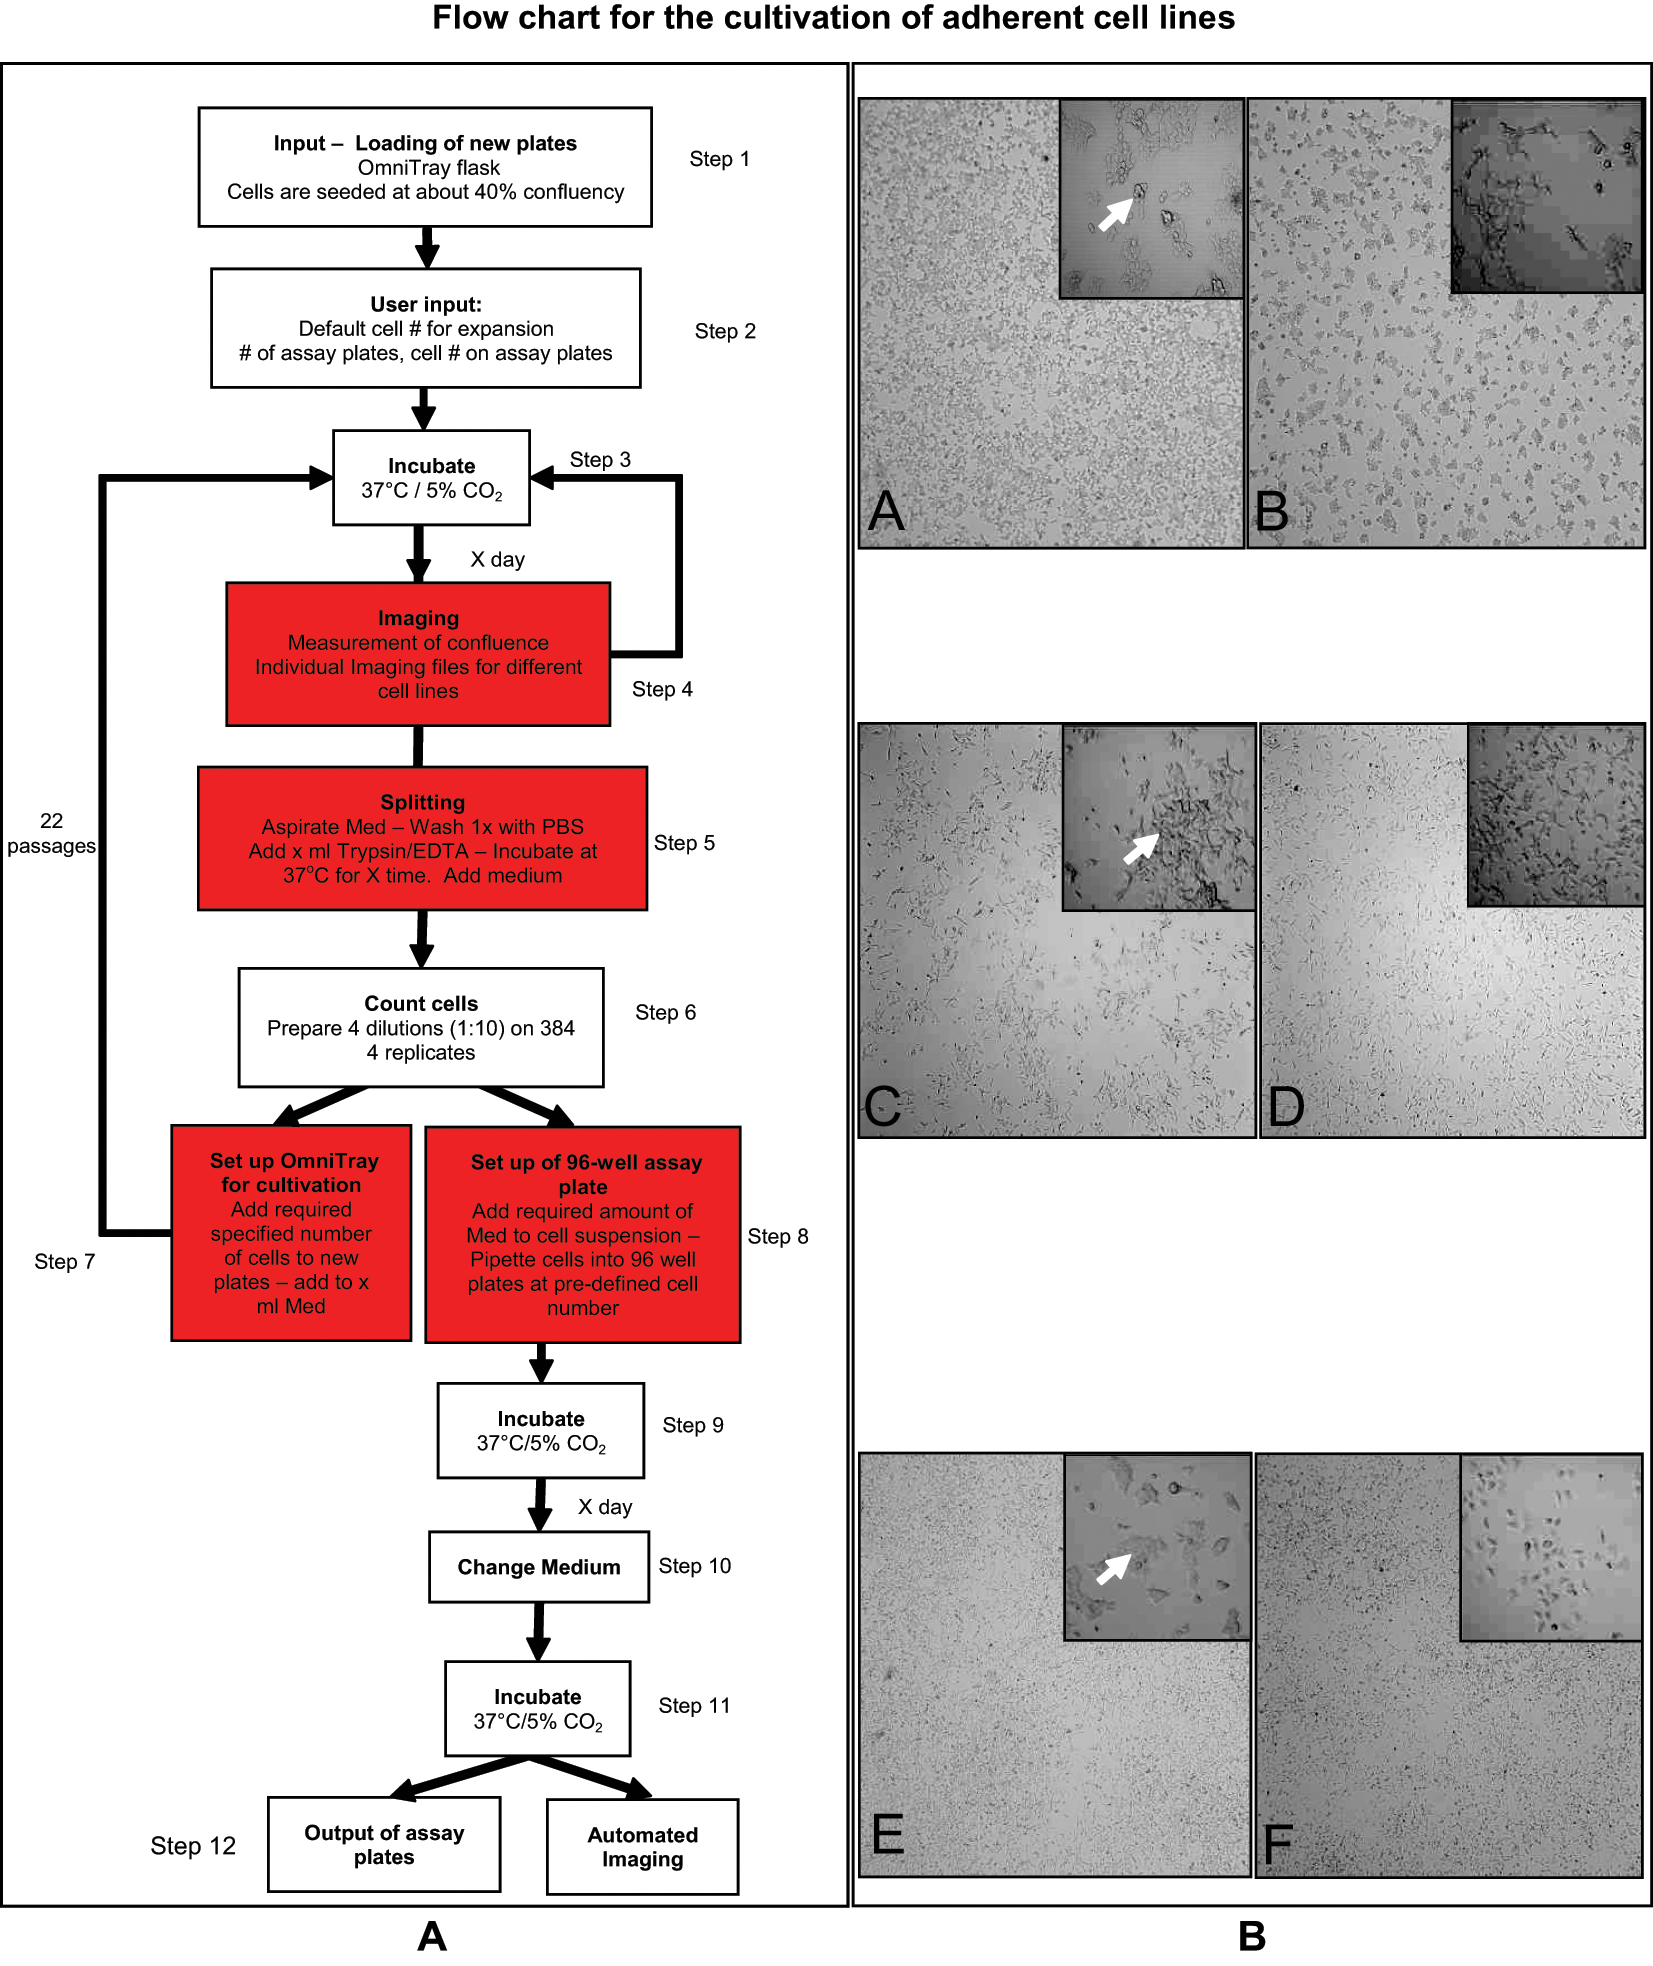
The Cell Culture Software (Hamilton Bonaduz AG, Bonaduz, Switzerland) controlled the cell culture process ( Fig. 1A ). Two OmniTray plates (NUNC, Rochester, NY) were seeded with 1.6 × 10⁶ cells per plate and entered into the system using the Graphical User Interface (GUI). Confluence measurements were obtained using the Cellavista (Roche, Basel, Switzerland) and images analyzed using its confluence algorithm. Approximately 42 cm2 of the surface area was imaged using brightfield microscopy with the 4× objective lens. Image analysis parameters were adjusted to each of the three cell lines to ensure accurate quantification. The threshold for splitting (confluence threshold) and the times for trypsinization for each cell line were 80% and 30 s for HEK293T cells and 70% and 80 s for BE(2)M17 and SH-SY5Y cells, respectively. Once cells had reached the desired confluence threshold, the Hamilton Scheduler Software (Hamilton Bonaduz) executed methods developed within the Venus One Software (Hamilton; http://www.hamiltonrobotics.com/en-uk/hamilton-robotics/liquidhandling/venus-one-software/). The AI.CELLHOST split, counted, and reseeded cells into new OmniTray and assay plates ( Fig. 1A ). Cells were seeded at the densities described above (differentiation of SH-SY5Y cells). The SQL Database (Microsoft, Redmond, WA) recorded all information on the plate history and processes performed on the cells. Weekly cleaning protocols were implemented to sterilize the system and replenish consumables. All liquid lines and pipetting needles were rinsed with 70% ethanol. All other areas were cleaned using Deconex (Hamilton Bonaduz).
(
shRNA screen
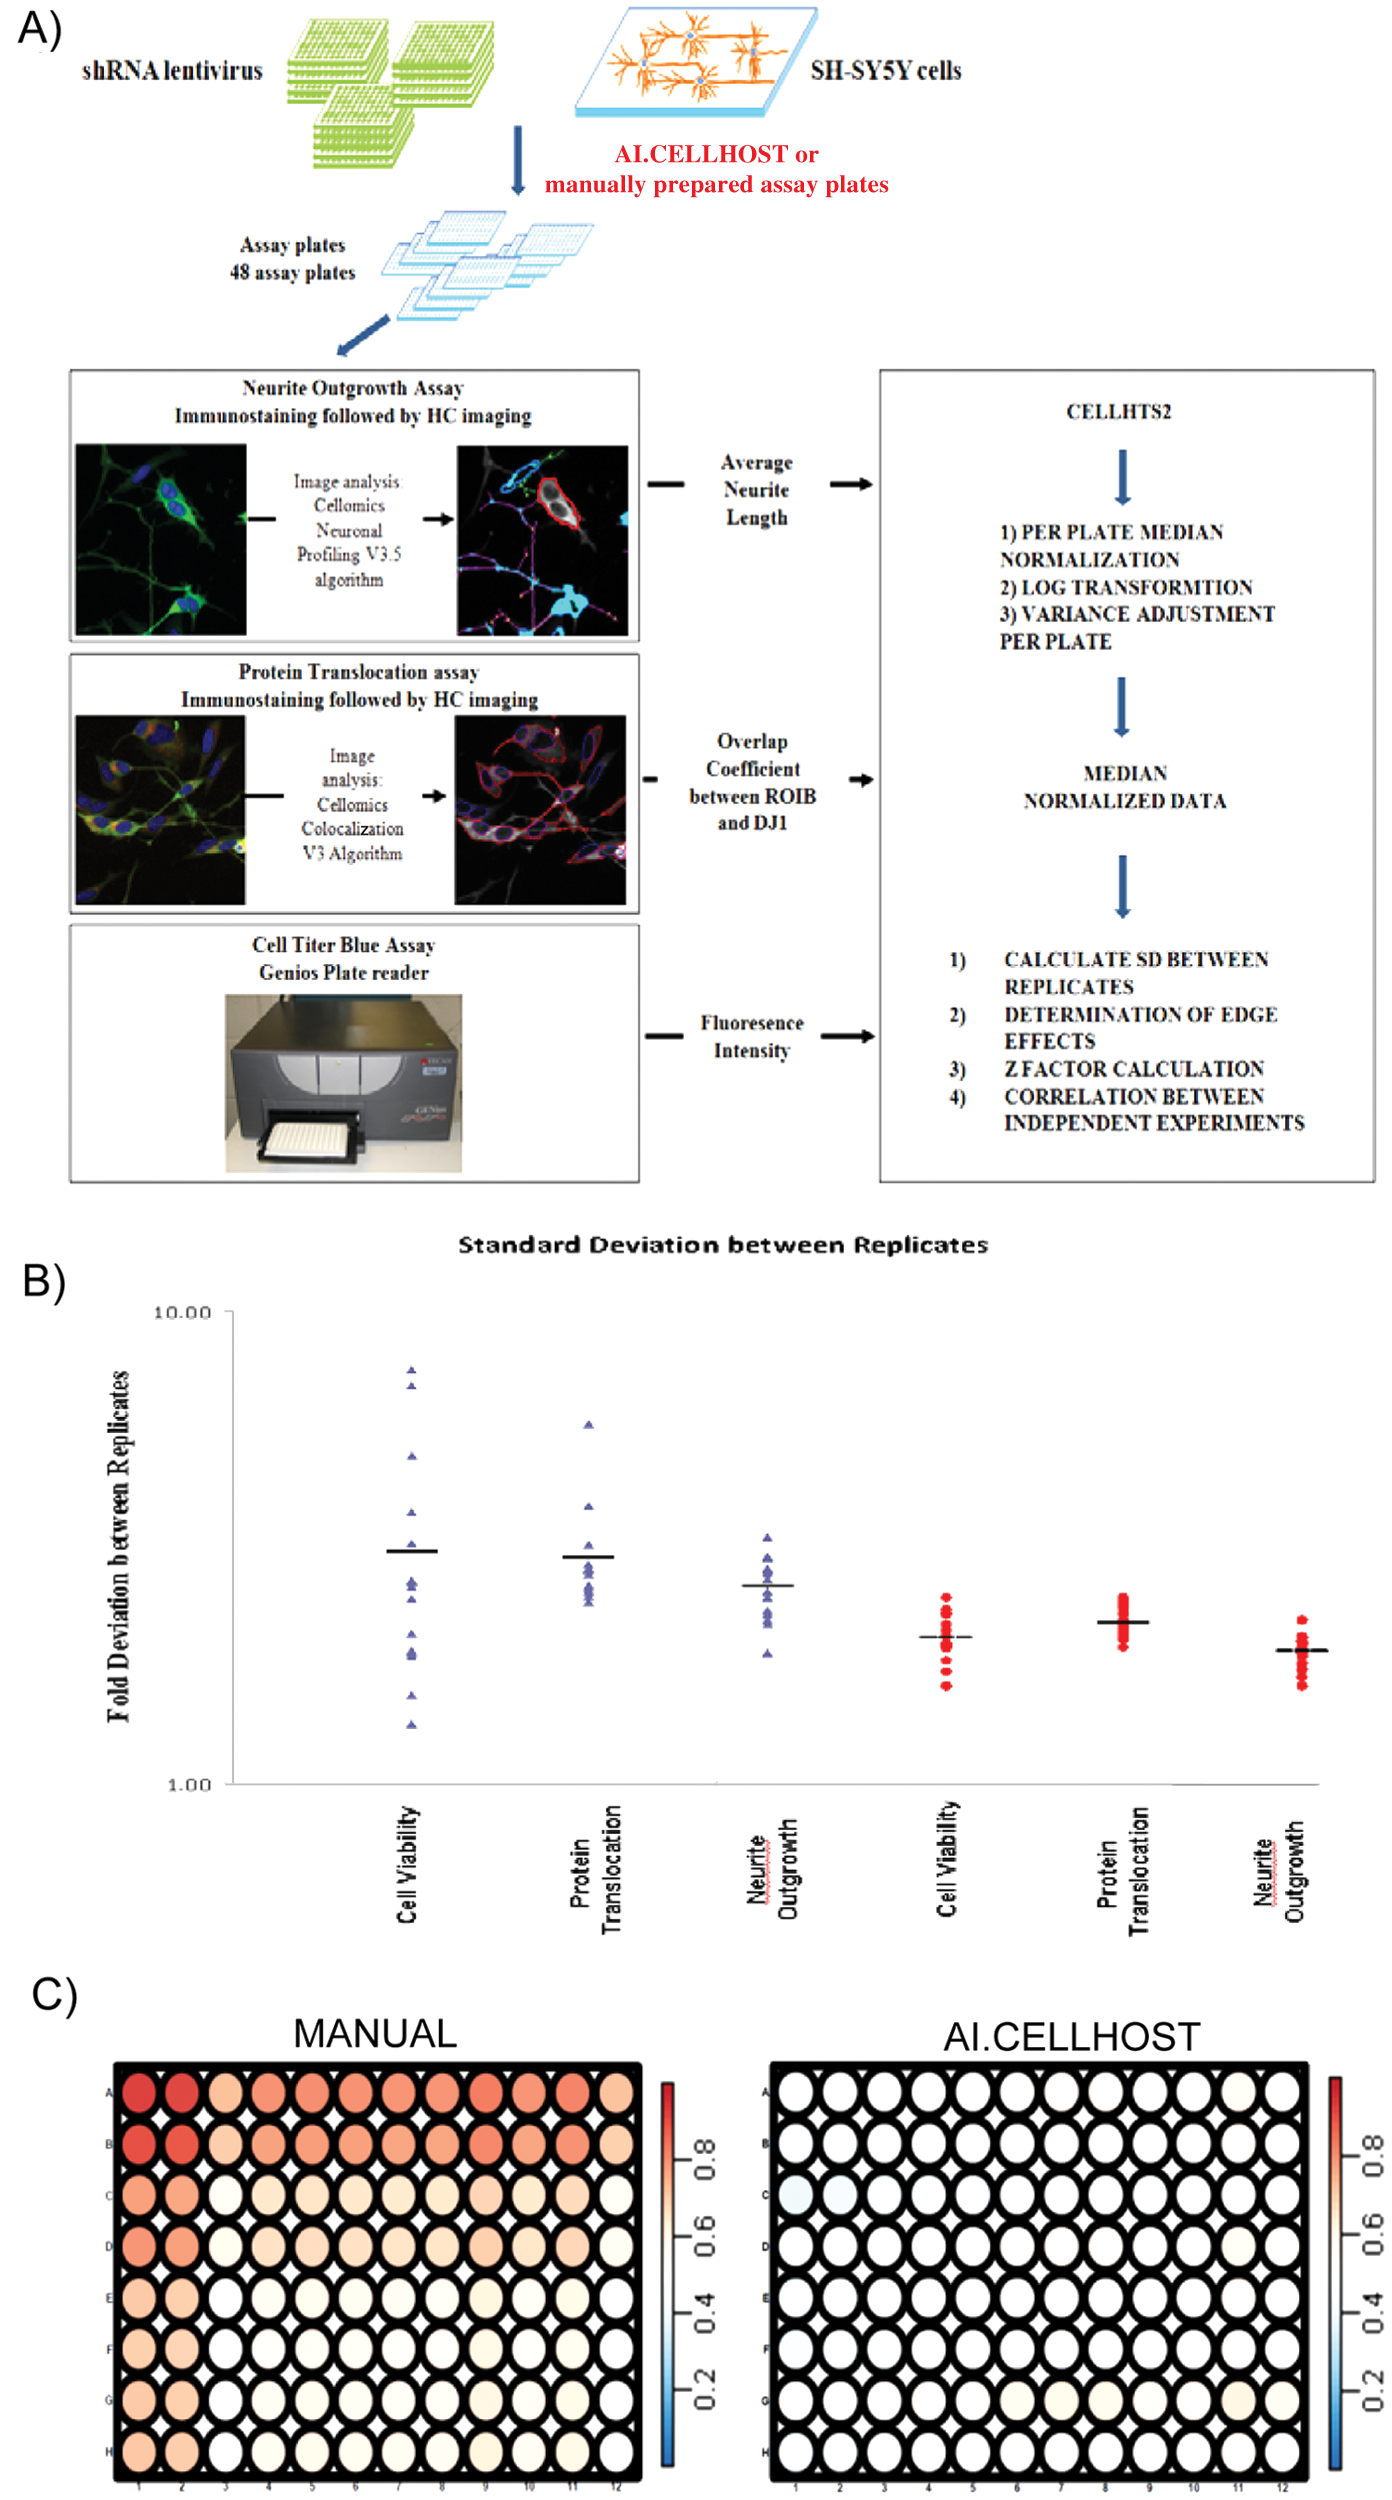
To determine if the system was able to increase the precision of a manual HTS–HCS, an shRNA screen consisting of 170 clones targeting 35 genes was conducted in the SH-SY5Y cell line ( Fig. 2A ). The screen was performed manually, by an experienced screener, and also using the AI.CELLHOST. Each experiment consisted of 4 plates and was conducted in triplicate (total of 12 plates). Half of the plates were used for determining cell viability and the remainder for high-content imaging. Biological replicates were on separate plates with positive and negative controls on each plate. Each experiment was conducted four times in one day (total of 48 plates). The entire protocol was repeated three weeks later to determine reproducibility of the experiment over time.
(
shRNA virus production
Bacterial glycerol stocks containing the shRNA vectors (TRC1; Open Biosystems, Huntsville, AL) were grown overnight in LB media containing 100 µg/mL of ampicillin (Sigma-Aldrich). Plasmids were extracted according to the manufacturer’s protocol (Wizard MagneSil Tfx; Promega, Madison, WI). Virus was produced following the RNAi Consortium High-Throughput Lentiviral Production (96-well plate) protocol. 6 The multiplicity of infection (MOI) of the lentivirus was calculated by using the pLKO.1 green fluorescent protein (GFP) plasmid (Sigma-Aldrich) and determining the percentage of GFP-positive cells.
SH-SY5Y cells were infected with shRNA lentivirus by using an MOI of 3 and differentiated for a total of 5 days. After 5 days, plates were processed for the different assays.
Cell viability assay
Cell viability was quantified using CellTiter Blue (Promega). The same processing procedure was used for assay plates prepared by hand and the robot. Of the CellTiter reagent, 20 µL was added to each well, and plates were incubated for a further 3 h at 37 °C. Fluorescence readings were collected using the GeniosPlus (Tecan, Männedorf, Switzerland) and the Ex 560 nm (20) and Em 590 nm (10) filters.
High-content protein translocation and neurite outgrowth assay
Cells were treated with 50 µM hydrogen peroxide for 24 h prior to immunostaining of the cells to stimulate translocation of DJ1 to the mitochondria. Immunostaining of robotic and manually prepared assays plates was performed by the SciClone 3000 (Caliper Life Sciences, Hopkinton, MA) to minimize cell layer damage. Cells were fixed with 4% paraformaldehyde (PFA) for 10 min, washed three times with 1× PBS, and incubated for 10 min with 0.5% PBST (PBS with Tween-20). Cells were then washed a further three times with 1× PBS and blocked in 5% FBS/PBST for 1 h at room temperature. The following antibodies were added to the plates and incubated overnight at 4 °C: goat DJ1 N20 (5 µg/mL; Santa Cruz Biotechnology, Santa Cruz, CA), mouse COXIV (1 µg/mL; Abcam, Cambridge, UK), rabbit beta III tubulin (1 µg/mL; Sigma-Aldrich). The following day, plates were washed three times with 1× PBS, and secondary antibodies were added for 1 h at room temperature: Alexa Fluor donkey anti-goat 488 (2 µg/mL; Invitrogen), Alexa Fluor 594 goat anti-mouse (2 µg/mL; Invitrogen), and Alexa Fluor 647 goat anti-rabbit (2 µg/mL; Invitrogen). Cells were washed three times with 1× PBS and incubated with Hoechst (1 µg/mL; Invitrogen) for 10 min. Cells were washed a further three times and stored at 4 °C until imaging.
High-content imaging
A total of 20 fields per well were taken using the 20× objective. DJ1 (the translocating protein) was imaged using the FITC filter, mitochondria with the TRITC filter, beta III tubulin with the Cy5 filter, and nuclei using UV. Images were analyzed using the Cellomics colocalization bioapplication (Cellomics, Pittsburgh, PA). Objects were identified using the fixed threshold method to avoid analysis of images that were blank. The degree of overlap between DJ1 and the mitochondria was determined by using the overlap coefficient. Regions of interest (ROI) were defined as follows: ROI A—nucleus and ROI B—mitochondria; mitochondria was defined as target region 1 and nucleus target region II.
Images gathered for protein translocation were reanalyzed using the neuronal profiling bioapplication (Cellomics) to trace the average lengths of the neurites.
Statistical Analysis
Data from HC imaging and cell viability assays were analyzed using the BioConductor CellHTS2 package for the R software environment (R version 2.11.1, BioConductor version 2.6).7,8 Data were base (2) logarithm transformed and median based normalized. The standard deviation between normalized replicate values was calculated. The Kolmogorov-Smirnov test was used to determine if the AI.CELLHOST showed significantly less variation between replicate plates than the manual screen. To assess the reproducibility of experiments, the Spearman rank correlation coefficient was used (n = 4). The Fisher r-to-z transformation was used to test for a significant difference between the correlation coefficients.
Each plate contained three positive and three negative controls. The Z factor was calculated as previously described, 9 using the normalized values for the controls from all plates (total of 96 positive and 96 negative controls per assay). For the cell viability and neuronal outgrowth assays, negative controls were cells infected with scrambled shRNA, whereas positive controls were cells infected with an shRNA known to decrease cell viability or neuronal outgrowth. For the colocalization assay, negative controls were cells that had not been treated with a toxin, whereas the positive control was defined as cells treated with the toxin H2O2 at 100 µM. Data were renormalized using the B score method to identify spatial effects. 10
Results And Discussion
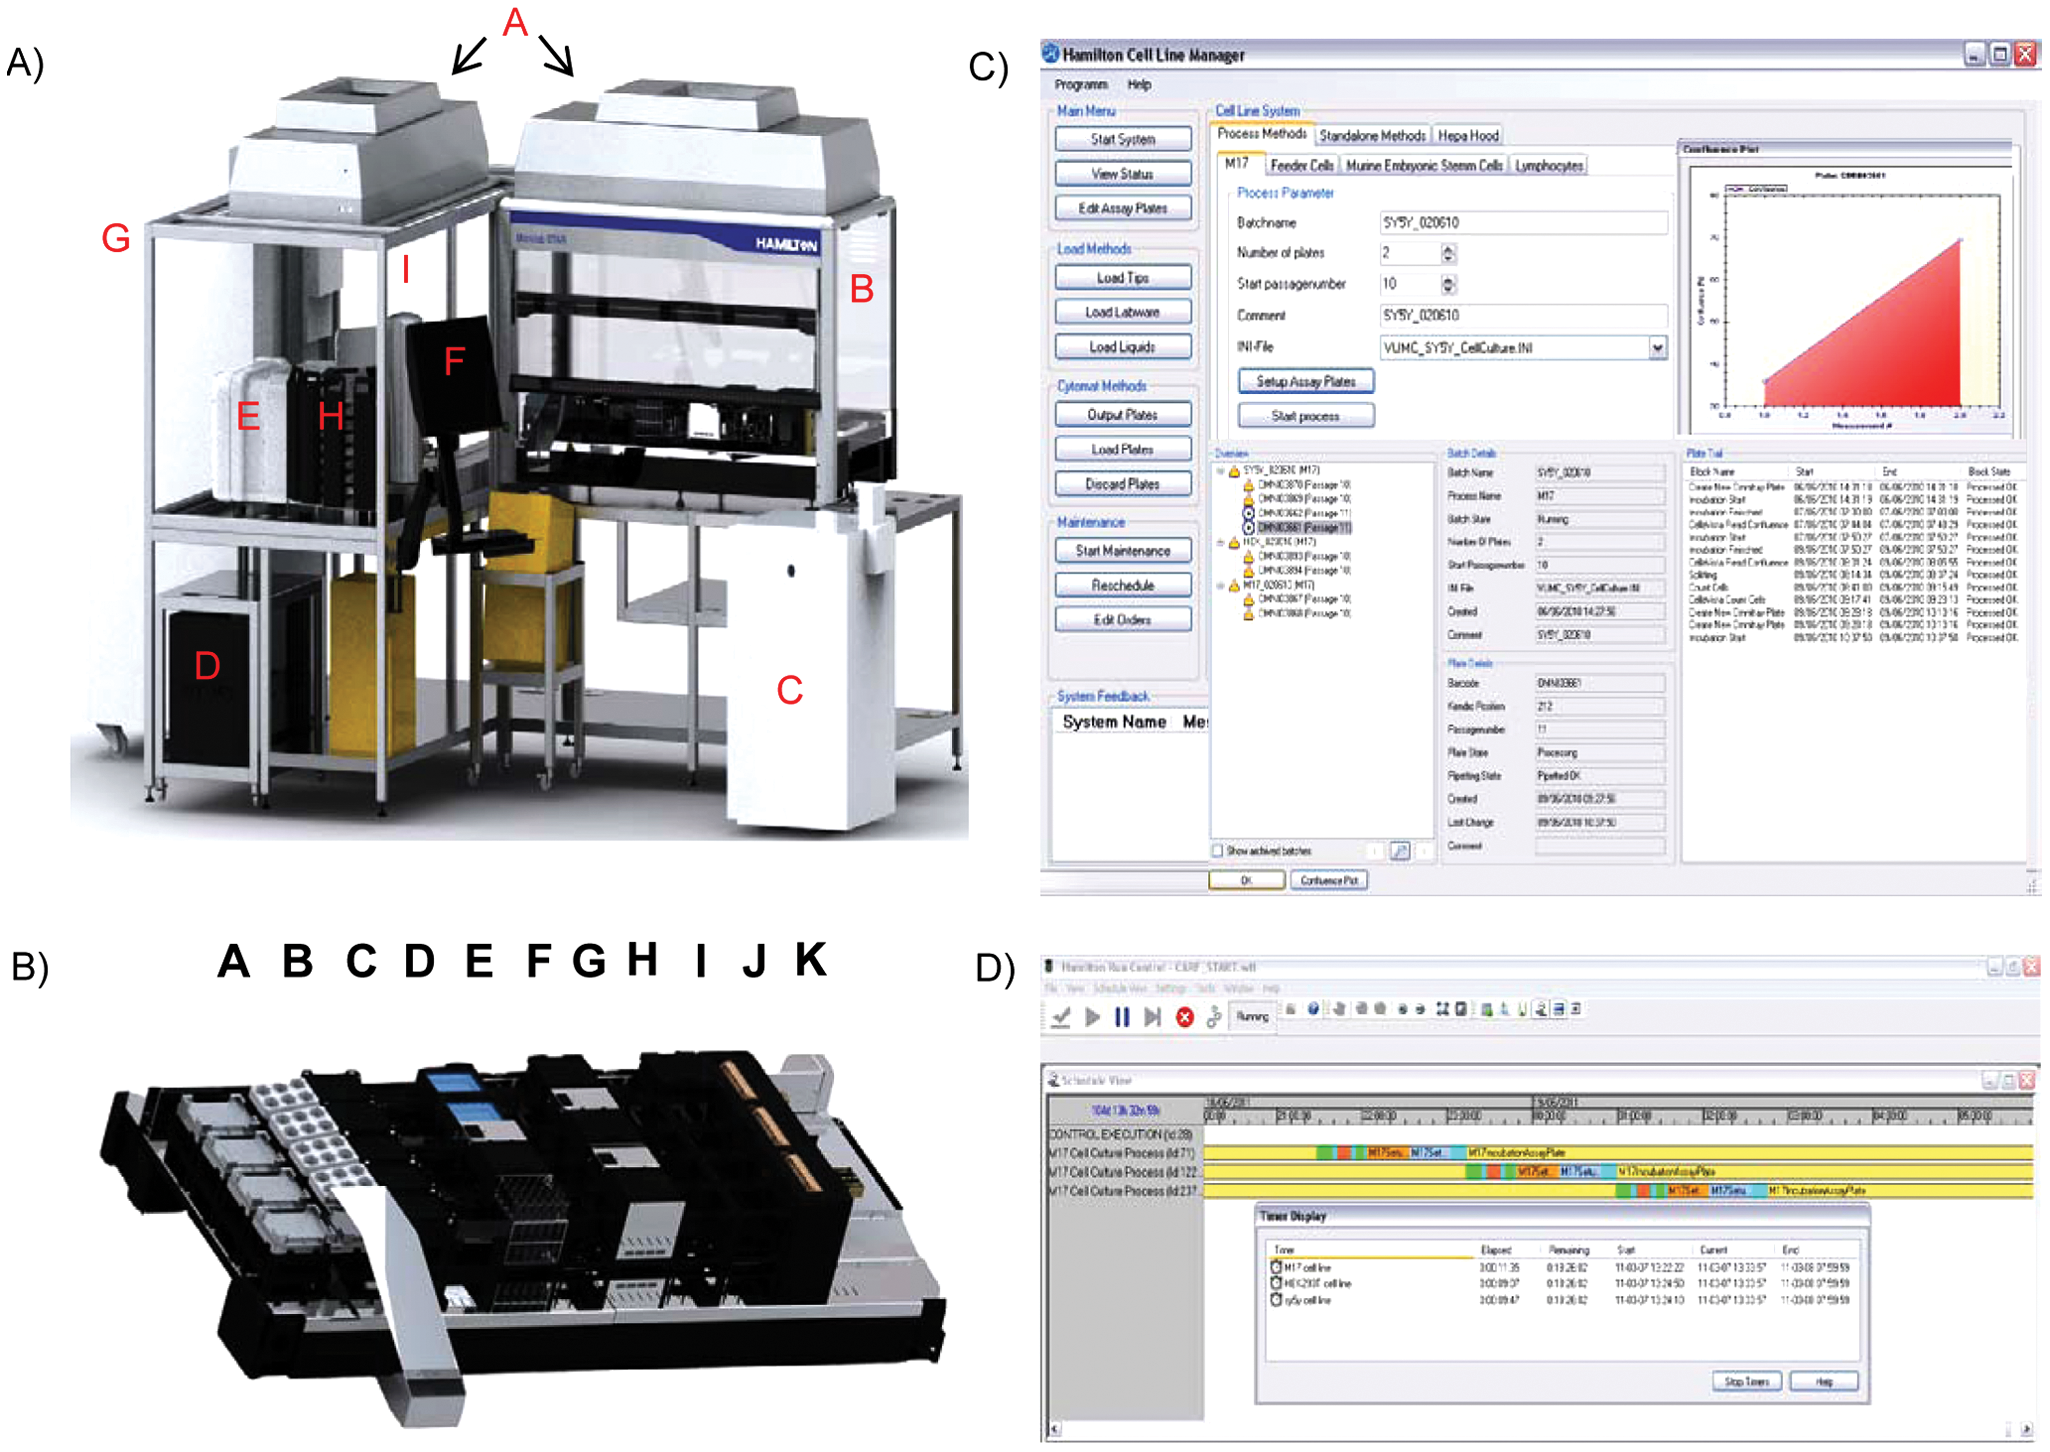
Although many screens have identified novel players in crucial cellular processes, 11 the scale of conducting such experiments is daunting. For example, a genome-wide shRNA screen using the TRC1 library (110 000 clones) would need approximately eleven hundred 96-well plates. Furthermore, biological and experimental variation can mask the effects of important genes/modifiers. To obtain robust data with the sensitivity necessary to detect subtle effects, it is essential to increase throughput while minimizing error and costs. Thus, we developed the Automated Imaging CELLHOST (AI.CELLHOST; Fig. 3A , B ).
(
The system is designed for the autonomous culturing of several adherent cell lines, as well as suspension cells and embryonic stem (ES) cells. The Cell Culture Software developed by Hamilton Bonaduz AG controls the AI.CELLHOST. It consists of four parts: the Venus One Software (Hamilton), the Hamilton Scheduler Software (Hamilton), a SQL Database (Microsoft), and a customized GUI (Hamilton). The different parts of the methods (e.g., media change, imaging of culture plates) are programmed in the Venus One Software. All plates in the system are tracked by barcode, and information such as passage number, plate history, and processes that have been performed is stored in the SQL database. The GUI allows users full control of the system without the need for technical programming knowledge and provides a comprehensive overview of all the plates in the system and their history ( Fig. 3C ). The dynamic preemptive scheduler software streamlines and schedules all processes (Database) and methods (Venus One Software) that have to be performed ( Fig. 3D ). This will ensure that there will never be a conflict of resource usage. Error detection and automated error handling with full recovery options guarantee the highest possible running security.
Overall, the system allows the hands-free simultaneous culturing of several mammalian cell lines, as key parameters, such as cell density and trypsinization times, can be adjusted independently for each cell type. Furthermore, the addition of the automated imager confers several benefits as only cells that have reached the specified criteria (e.g., morphology, confluence, and cell number) are parsed into the next step. Processes are then automatically rescheduled to make the most efficient use of available time, which allows the production of up to 160 assay plates per day. There is also a reduction in the usage of tips, plates, and media as they are only used when the cells are ready, which ultimately reduces costs. This flexibility and throughput allow one to run several HT–HC experiments in parallel.
As the system was able to reliably complete all steps of the culturing protocol ( Fig. 1A ), we determined if the AI.CELLHOST was capable of culturing three cell lines in parallel, without compromising cell growth and viability. Three different cell lines (HEK293T, SH-SY5Y, BE(2)-M17) were entered into the system, with predefined parameters specific for each cell line. Cells were processed according to a preprogrammed protocol ( Fig. 1A ), and growth of the cells was successfully maintained for 22 passages without human intervention except for general maintenance of the robot (i.e., replace tips and cleaning). Typical yields from OmniTray plates were comparable to human cell culture, with 1.5 × 10⁵ per cm2 HEK293T cells harvested and 1 × 10⁵ per cm2 for SH-SY5Y and BE(2)-M17 cell lines. All three cell lines showed consistent growth rates and no bacterial contamination, and cellular morphology was similar to that of cells cultured by hand ( Fig. 1B ).
During the culturing of the three cell lines, the system was instructed to prepare a total of sixty 96-well assay plates throughout the 22 passages. The cell density per well across all manually prepared plates showed a coefficient of variation (CV) of 8.7%, whereas those prepared by the robot showed a CV of 5.3%. Thus, the system is able to culture, split, count, and dispense cells into 96-well plates with a greater degree of accuracy and reproducibility than manual pipetting.
Many screens are conducted in immortalized cell lines as they are simple to culture and can be expanded to the numbers that are needed for whole-genome screens. However, the applicability of hits identified in immortalized cell lines to their function in vivo is limited. 12 More sophisticated and physiologically relevant cellular models, such as primary neurons and differentiated ES cells, are generally reserved for smaller screens, confirmation of hits, or detailed molecular follow-up. 13 To facilitate usage of different cellular models either for screening or hit confirmation, we have developed additional protocols for the automated culturing and expansion of ES cells on mouse feeder cells as well as suspension cells such as patient lymphoblasts.
As the AI.CELLHOST was able to reliably maintain cells in culture and accurately prepare assay plates, we determined if this would decrease the variation of HTS–HCS by conducting an shRNA screen consisting of three assays in the SH-SY5Y cell line ( Fig. 2A ). We conducted an HT whole-well cell viability assay as well as an HC protein translocation and neuronal outgrowth assay. HC assays have the added advantage that quantification of several cellular phenotypes simultaneously provides a much better profile of the biological process in question. Furthermore, nonrelevant effects are less likely to affect all the different readouts, reducing type I errors while increasing the chances of identifying real hits that have high variability in single readout assays.2,13
To successfully conduct an HCS, image quality is paramount for accurate object identification and analysis. Damaged or irregular cellular monolayers can lead to spurious and inconsistent results. Plates prepared by AI.CELLHOST appeared to show a better degree of object separation and less cell layer damage upon manual inspection, although the differences were not quantified ( Fig. 1B ). In addition, as the AI.CELLHOST demonstrated greater accuracy and consistency in counting and pipetting cells into the assay plates, we determined if this could reduce the variability between replicates for all assays. The precision of the AI.CELLHOST system was greater than that of a human, as variation between replicates was significantly reduced ( Fig. 2B ).
As the AI.CELLHOST did not demonstrate any pipetting biases (established during the assay plate setup) and environmental conditions within the incubator showed small fluctuations in temperature and humidity levels, spatial effects within plates prepared by the robot were reduced compared to manually prepared plates ( Fig. 2C ). Spatial plate effects can arise for several reasons such as pipetting biases and incubation conditions. They can be so severe that data from particular wells or the outer edges have to be discarded or extensive plate normalization procedures used, which can mask true “hits.” 14
As variation was reduced in plates prepared by the AI.CELLHOST, we determined if the Z factor improved for both HT and HC assays. The Z factor quantifies the robustness and sensitivity of the assay and its suitability for HT–HCS. 9 The closer the Z factor is to 1, the better the assay. The AI.CELLHOST increased the Z factor of all three assays ( Table 1 ), especially for the protein translocation assay. DJ1, the protein visualized in the translocation assay, translocates to the mitochondria when cells undergo stress. Cells within the AI.CELLHOST are processed and maintained within stable environmental conditions. Therefore, cells produced by the AI.CELLHOST may be under less stress, which was also demonstrated by a corresponding decrease in the colocalization between DJ1 and the mitochondria in the negative controls from plates prepared by robot compared to the negative controls present on manually prepared plates. This leads to a greater dynamic range between the controls and a dramatic improvement in the Z factor.
Spearman Rank Correlation Coefficient and Z Factor
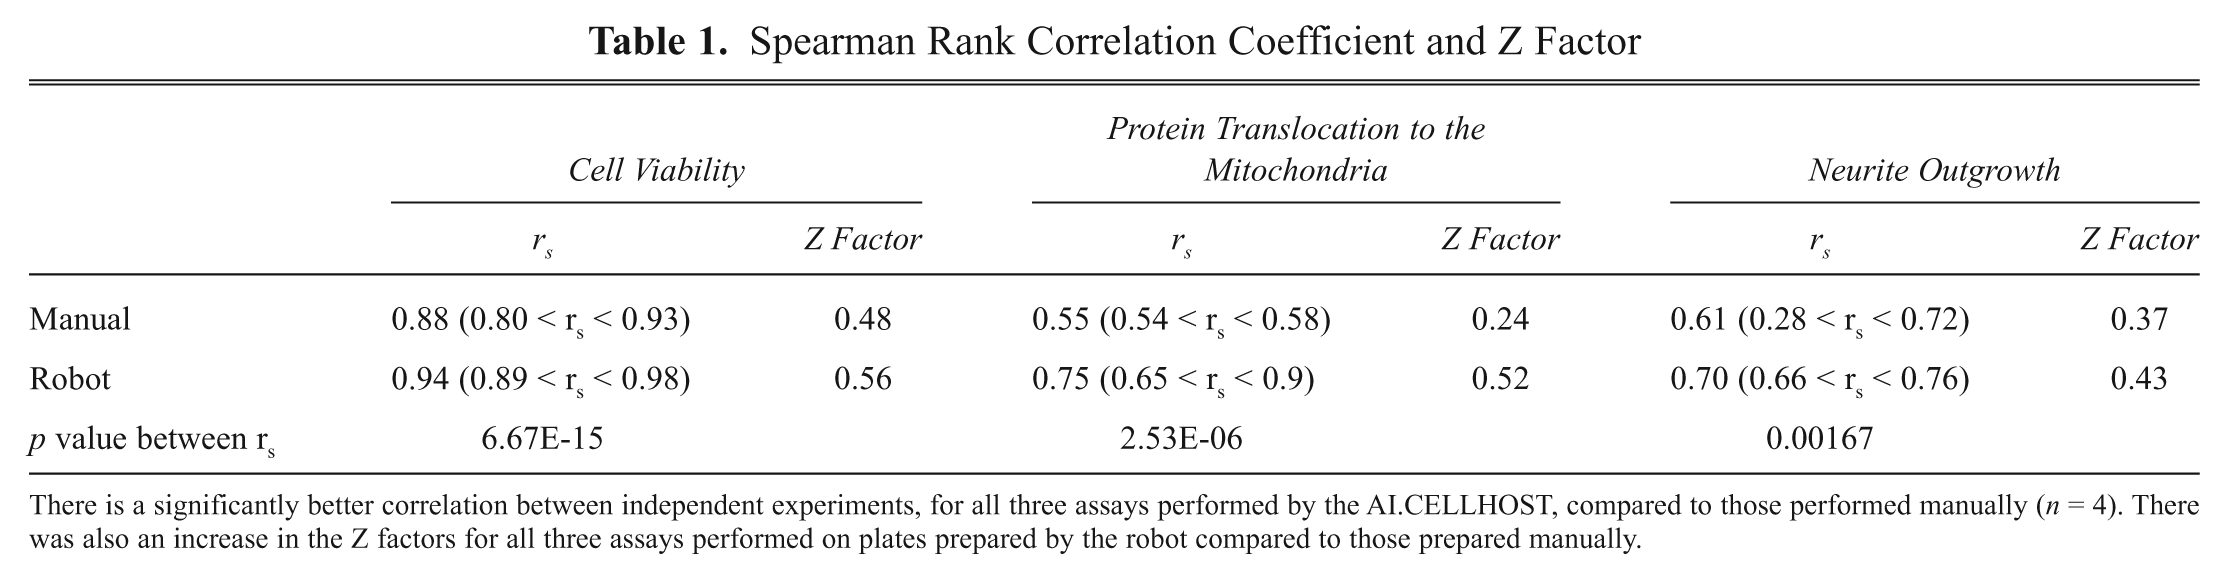
There is a significantly better correlation between independent experiments, for all three assays performed by the AI.CELLHOST, compared to those performed manually (n = 4). There was also an increase in the Z factors for all three assays performed on plates prepared by the robot compared to those prepared manually.
As the same factors that influence variation between replicates also influence reproducibility of results, we expected the technical reproducibility between experiments would be greater for those conducted on the robot. Thus, we repeated the screen three weeks later and calculated the correlation between the two experiments. The correlation between independent experiments was significantly higher for those conducted by the robot compared to the screens done by hand ( Table 1 ).
In summary, with the use of the AI.CELLHOST, one can significantly reduce the experimental variation in HT–HC screens, thereby increasing the power and reliability to detect subtle biological effects.
To functionally decipher gene networks and translate pathogenic mechanisms to a suitable drug target, one will have to conduct tens of thousands of experiments using multidimensional HC assays in a variety of complex models. Using a combination of automated cell culturing and HT–HC screening, as described here, one hopes to expedite the functional validation of data from other “omic” approaches as well as identify better targets for therapeutic development.
Footnotes
Acknowledgements
We thank R. van Kesteren and A. B. Smit for critical reading of the manuscript and constructive comments. We thank the Hamilton programmers and specialists for continuing support. This work was supported by the Investment Subsidy NWO Medium grant 911-07-031, The Prinses Beatrix Fonds Wetenschapsprijs 2009, and the Neuroscience Campus Amsterdam; S.J. is supported by Ti-Pharma: T5-207.
S.J. designed and performed experiments and analyzed data. S.J., P.H., and D.C. wrote the article. Z.B. analyzed the data. S.J., P.R., D.S., P.H., and D.C. designed and tested the system.