
Abstract
Migration is a fundamental aspect of leukocyte behavior and represents a significant therapeutic target clinically. However, most migration assays used in research are relatively low throughput and not easily compatible with rapid analysis or high-throughput screening (HTS) protocols required for drug screening assays. We therefore investigated the quantification of the migration of human leukocytes using the Molecular Devices high-content Discovery-1 platform or PerkinElmer ATPlite assay compared to manual counting. We have conducted extensive assay validation, investigating the detection limits, sensitivity, and precision of each method to count human leukocytes. Leukocyte migration assays were conducted using 96-well HTS-Transwell plates and the potent chemokine stromal cell–derived factor-1 (SDF-1). We reveal that the Discovery-1 and ATPlite methods developed here provide useful approaches to quantify leukocyte migration in an HTS manner with high levels of detection, sensitivity, and precision.
Keywords
Introduction
Chemotaxis is the regulated movement of cells along a concentration gradient toward a chemical mediator. Chemotaxis represents a major therapeutic target in the human immune system, to target recruitment of beneficial cells 1 or to block infiltration of leukocytes that have a detrimental influence during inflammation.1,2 Multiple platforms exist to study cell migration, which differ considerably in application and adaptability for drug screening studies. The Transwell system is frequently used to measure cell migration and in principle is adaptable for drug screening or high-content analysis. We aimed to develop a method that would accurately quantify the extent of leukocyte migration and could overcome a number of the limitations associated with the Transwell system in combination with manual cell counting. These include the potential for poor precision and experimenter bias from manual cell harvesting and counting, considerable handling time, and technical issues that arise as migrated cells become more adherent and thus more difficult to harvest. With these end points in mind, our overall aim was to develop a platform enabling rapid and sensitive quantification of leukocyte migration ideally using the 96-well plate high-throughput screening (HTS)–Transwell system, which would allow for future pharmacological assessment or drug screening. In addition, we set the prerequisites that living cells should be quantified with minimal exchange of solutions and without the need for labels or dyes to avoid label cytotoxicity, activation of cells, or loss of populations during wash steps.
The Discovery-1 platform (see http://www.moleculardevices.com; Molecular Devices, Sunnyvale, CA) is a wide-field microscopy system capable of automated image acquisition of live or fixed cells at multiple fluorescent wavelengths and bright field. The microscope is equipped with a motorized stage compatible with imaging 96-well plates. We have previously used the Discovery-1 platform to quantify positively stained cell populations in tissues or cell cultures at high throughput.3–6 Here we investigate the ability of Discovery-1 to conduct live-cell imaging of nonlabeled human leukocytes. In addition, a second assay system was assessed and compared with Discovery-1. The ATPlite luminescence assay is used to measure intracellular adenosine triphosphate (ATP) as a function of cell number 7 and/or viability. 8 The ATPlite assay has been used previously for ligand screening, 8 indicating the potential for HTS applications. In addition, it has been used to quantify cell migration, 9 but these studies have not detailed important parameters of detection, sensitivity, and precision.
Our main assessment criteria were the ability of these methods to quantify migration of human leukocytes using the detection limits, sensitivity, and precision as comparative measures, and assess the suitability of the methods for future drug/pharmacological screening.
Materials and Methods
Tissue Culture Reagents
Culture media and fetal bovine serum (FBS) were purchased from Invitrogen (Carlsbad, CA). Bovine serum albumin (BSA) was obtained from ICPbio (Auckland, NZ). SDF-1 was purchased from PeproTech (Rocky Hill, NJ). The ATPlite assay was purchased from PerkinElmer (Waltham, MA). General tissue culture plastic ware was purchased from Nunc (Rochester, NY) and Greiner Bio-one (Monroe, NC).
Preparation of Peripheral Blood Mononuclear Cells from Human Blood
Collection of human blood and preparation of peripheral blood mononuclear cell (PBMC) cultures was performed exactly as described previously.10,11 Blood samples were collected from healthy volunteers after written informed consent (ethical approval from the University of Auckland human ethics committee #2009-101) and confirmation that they had no chronic inflammatory conditions or any recent acute infections or cold-like symptoms. Cryopreserved PBMCs 10 (henceforth referred to as leukocytes) were revived by rapidly thawing in a 37 °C water bath, diluted in RPMI 1640 with 10% FBS and 1× penicillin-streptomycin-glutamine (R10 media), and washed gently with R10 media. The leukocytes were incubated in R10 media at 37 °C with 5% CO2 for 18 to 24 h prior to experimentation.
Method Validation and Migration Experiments
To validate the proposed methodologies, leukocytes were seeded in 96-well flat-bottom plates at 11 concentrations between 10 and 100 000 cells per well (10, 50, 100, 500, 1000, 3125, 6250, 12 500, 25 000, 50 000, 100 000; prepared by serial dilution). A media-only control was also included (0 cells). Cells were incubated at 37 °C with 5% CO2 for 4 to 5 h prior to being assayed with the methods described below. These dilution series also served as calibration curves for the migration experiments (curves fitted with weighted linear regression, excluding nonlinear points).
For migration experiments, recombinant human SDF-1 or vehicle (20 µg/mL BSA) diluted in R10 media was added to 96-well culture plates (300 µL per well). A 96-well HTS-Transwell permeable support (3 µm pore polycarbonate membrane; Corning, Corning, NY) was prewetted with 10 µL media and inserted into the acceptor plate to create upper and lower chambers (see
Cell Counting and Analysis
Manual Counting
The majority of the media was carefully removed to leave 30 µL in the well with the undisturbed cells. Then, 5 µL/well 0.4% trypan blue stain (Invitrogen) was added to facilitate identification of live versus dead cells. The cell suspension was counted in a Neubauer-improved hemocytometer (four 1-mm2 regions counted) and the number of cells in each well calculated according to standard conversion factors.
Discovery-1 Imaging and Analysis
Prior to application of cells or assay medium, culture plates were coated with poly-L-lysine (0.2 mg/mL in phosphate-buffered saline for at least 1 h at 37 °C; Sigma-Aldrich, St. Louis, MO). This treatment did not influence basal or stimulated migration, but cells appeared to remain more evenly spread in the well during time course experiments, and between-replicate error was reduced in comparison with experiments in noncoated plates.
A Discovery-1 automated wide-field inverted microscope was used to take bright-field images of the migrated cells settled on the surface of the lower chamber. Four images from adjacent sites in the center of each well were acquired with a 10× objective lens, representing a total area of approximately 2.2 mm2, or 7.4% of the well area. Microscope illumination and autofocus algorithms were calibrated such that cells appeared phase-bright and were readily distinguishable from debris.
Cells in each image were counted at high throughput with MetaMorph image analysis software (version 6.2r6; Molecular Devices). The “Border Objects” morphology filter with “Suppress Light Objects” parameter was applied to enhance the contrast between cells and the background. Subsequently, the “Find Spots” drop-in assay was used to count the number of bright spots (cells) in the image (see
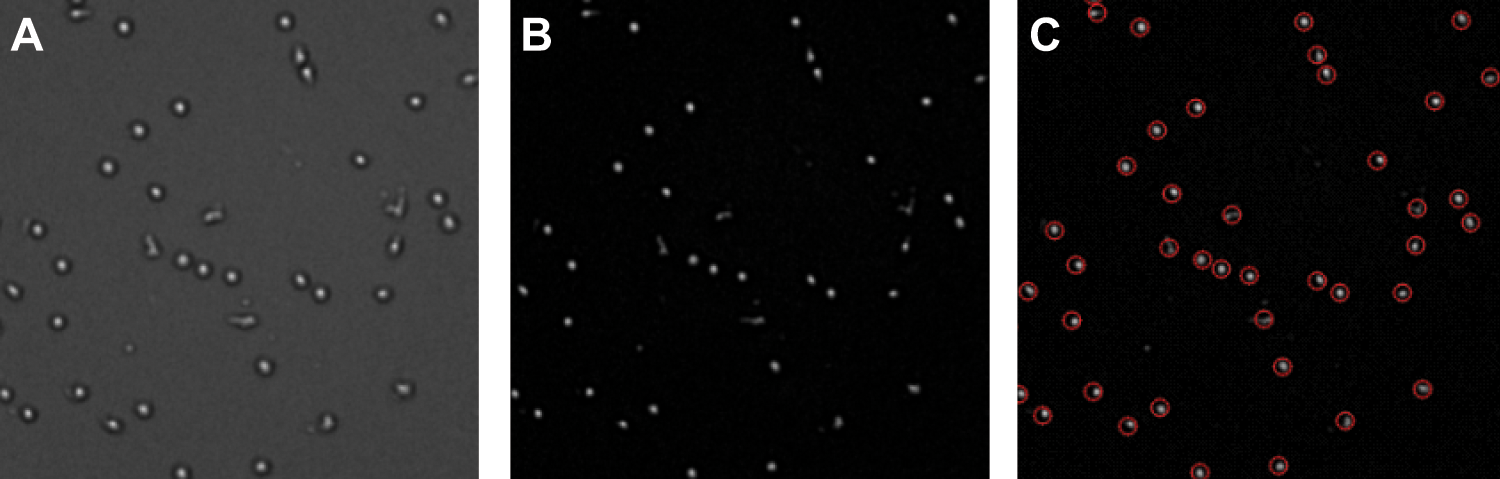
Discovery-1 and MetaMorph image processing. The panels show an image of leukocytes acquired by the Discovery-1 microscopy platform and processed using MetaMorph. Note that these are live unlabeled leukocytes imaged using bright field, and images were acquired through the polycarbonate Transwell inserts (as shown in
ATPlite Luminescence Assay
To perform a direct comparison with results from Discovery-1 counting, we coated culture plates with poly-L-lysine prior to application of cells or assay medium, but equivalent results were obtained when plates were not coated.
At the conclusion of migration, the Transwell upper chamber insert was carefully removed. The acceptor plate was centrifuged at 200 g for 3 min to collect the cells at the bottom of the plate, and the media volume was reduced to 100 µL. The ATPlite assay was performed according to the manufacturer’s instructions (ATPLT-0408 Revision F). Luminescence was measured with a VICTOR X Light luminescence plate reader (PerkinElmer).
Assay Validation and Comparison
Each of the above cell counting methods was expected to produce a linear relationship between the raw data and actual cells per well. Qualitative inspection of the raw data for the dilution series suggested this was true over the majority of the range tested (including the maximum), with the exception of some apparently nonlinear points at the lower end of the range. These were likely below the limit of detection and were removed from subsequent analysis by excluding points that were not significantly greater than the measurement for zero cells per well. Residual plots from nonweighted linear regression curves also revealed that variances tended to increase with cell density for all three methods. It was therefore appropriate to fit curves using weighted linear regression (1/y2) to accommodate this nonconstant variance. 12
These curves were subsequently analyzed with four parameters to validate the methods and compare between them. Pearson’s R2 provides an indication of the degree to which the data fit a linear relationship, with 1 representing a positively correlated perfect straight line and 0 representing no linear relationship. The detection limit was defined as the smallest number of cells per well that could be identified, measured, and reported with 95% confidence that the true number of cells per well was greater than zero. This value was calculated by establishing the upper 95% confidence limit of the y-intercept and determining the corresponding number of cells per well from the equation for a straight line using the lower 95% confidence limit for y, as described previously.12,13 Sensitivity refers to the capability of the methods to discriminate small differences in cell number and is represented as the number of cells (per well) that can be distinguished by a unit change in the assay readout. This is calculated by taking the inverse of the slope of the curve. The coefficient of variation, or relative error, is an indicator of the precision of an assay. To calculate this, dilution series data were calibrated to their own curves so that the raw values for the three methods were comparable, and the error was divided by the mean value for each measured cell concentration in the assay. The overall coefficient for each experiment was calculated by averaging the coefficients for the dilution series points above the previously determined detection limit.
Statistical Analysis
GraphPad Prism (version 4.02; GraphPad Software, La Jolla, CA) and SigmaStat (version 3.5; Systat Software, San Jose, CA) were used to generate graphs, fit appropriate models, and perform statistical tests. Normality of data and equality of variance were assessed with Kolmogorov-Smirnov and Levene tests, respectively. When the assumptions of normality and equal variance were not met, data were log transformed, which corrected the nonnormality or heteroscedasticity. Comparisons were performed using one-way analysis of variance (ANOVA) with Dunnett or Tukey posttesting when significance was reached (for comparison to a control group or between all groups, respectively).
Results and Discussion
Cell migration is a widely studied topic and a very important aspect of immune cell behavior. There are, however, few assays available for conducting medium- to high-throughput analysis using immune cells or leukocyte subsets in conjunction with Boyden chamber (Transwell-type) migration assays. To our knowledge, there are currently no widely available assays that combine important aspects of sensitivity, precision, cost-effectiveness, and ease of use and that are suitable for high-content or high-throughput applications. With these as our primary considerations, we investigated the potential of the Discovery-1 platform and the ATPlite assay coupled with an HTS 96-well Transwell system to quantify human leukocyte migration in a sensitive, reliable, and cost-effective manner.
Discovery-1 and MetaMorph Image Processing
An important objective of the present method development was to avoid the need for labeling cells so as not to inadvertently influence the migration response through activation or label toxicity. We therefore pursued bright-field imaging of live unstained leukocytes and found that the Discovery-1 microscope could indeed apply automated focusing algorithms to find the correct focal plane and acquire clear images of the cells (
Assay Validation
To validate the Discovery-1 and ATPlite assays, the first series of experiments investigated the linear correlation coefficients, limits of detection, sensitivity, and assay variation. The same parameters were assessed for an established method, manual cell counting. These validation steps were conducted on the data from the serial dilution curves generated for each method (see Materials and Methods).
Pearson’s R2 (linear correlation coefficient)
For all three methods, the R2coefficient was close to 1, indicating a strong positive linear correlation. The Discovery-1 and ATPlite quantification methods had better R2 values of ~0.98, which were significantly greater (p < 0.05) than for manual counting (0.92 ± 0.02) (
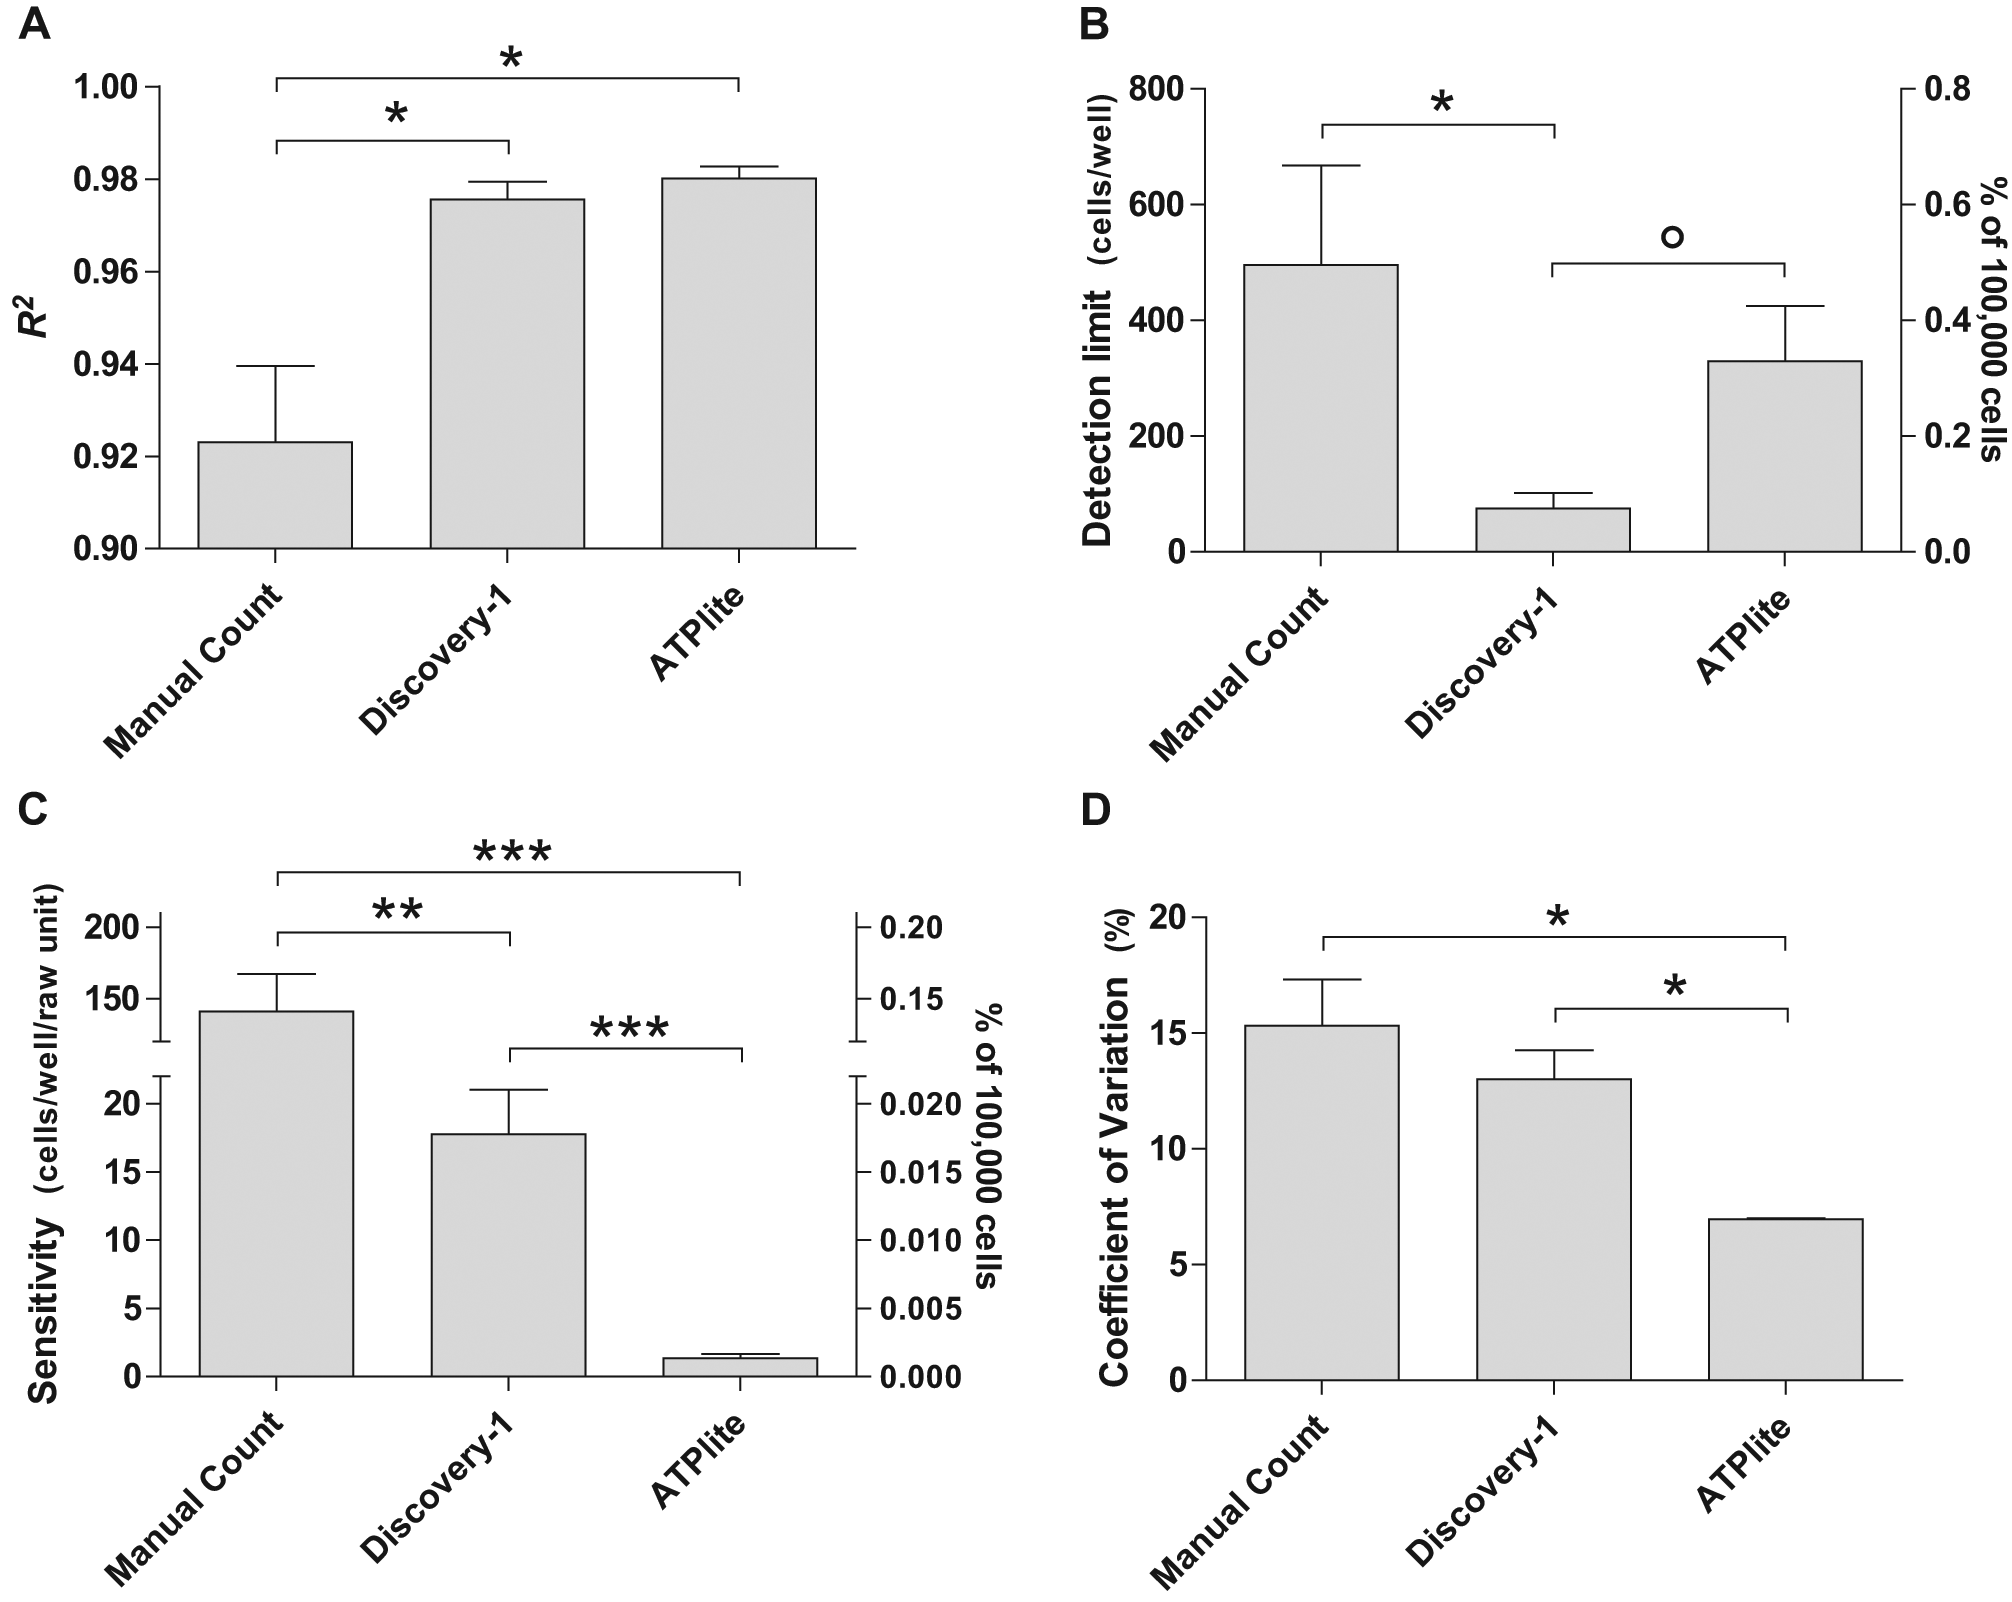
Assay validation of quantification methods. To determine the capability of each method to quantify leukocyte numbers, initial experiments were conducted using a dilution series of leukocytes seeded into standard 96-well plates. Cells were seeded at 0,10, 50, 100, 500, 1000, 3125, 6250, 12 500, 25 000, 50 000, and 100 000 cells per well. Each method (manual counting, Discovery-1, and ATPlite assay) was used to count cells and generate standard curves, which were subsequently analyzed to establish the validity and variation between methods. The four parameters compared were (A) Pearson’s R2 (linear correlation coefficient), (B) detection limit, (C) sensitivity, and (D) coefficient of variation (CV; % error). Data are presented as the mean ± standard error (SE) from three independent experiments. Significance: °p < 0.06 (close to significance). *p < 0.05. **p < 0.01. ***p < 0.001.
Limits of detection
Ideally, we sought to develop a method with a good lower detection limit, which is especially useful when studying rare cell populations. Discovery-1 had the best limit of detection of ~100 cells per well, whereas the ATPlite assay could reliably detect just under 400 cells per well. The detection limit of Discovery-1 was significantly better than manual counting (detecting approximately ~500 cells per well; p < 0.05) but did not reach significance in comparison to the ATPlite assay (p = 0.052;
Assay sensitivity
Developing an assay with high sensitivity was an important requisite. The ATPlite assay provided the best sensitivity, with a unit change in the assay readout corresponding to around two cells per well. This was significantly better than Discovery-1 (p < 0.001). Manual counting was the least sensitive method (p < 0.001) and was two orders of magnitude less sensitive than the ATPlite assay (
Precision (coefficient of variation)
We assessed between-replicate assay variation by calculating the percentage error relative to the mean at each point, a measure known as the coefficient of variation (CV). The ATPlite assay had the best CV, which was significantly smaller than the other two methods (
Assay time
For HTS applications, the time required to complete the terminal method is very important. Manual counting requires approximately 1.25 min per well. For Discovery-1, setup time for imaging and analysis was approximately 20 min for the first plate in each experiment (requiring initialization and setup of microscope parameters such as motorized stage calibration, light intensity, Koehler illumination, focal plane, and selection of analysis parameters) and 5 min for subsequent plates (e.g., later time points when parameters need only be confirmed or adjusted slightly before proceeding). Automated image acquisition and processing took approximately 1 min per well (but would be considerably influenced by the computer specifications at individual facilities). The ATPlite assay can be completed within 30 min, most of which is incubation steps.
Thus, overall, the ATPlite had the better precision, and its sensitivity was exceptional, but its detection limit was not as good as the Discovery-1 method. As expected, the manual counting method was outperformed by both HTS methods.
Ability of Discovery-1 System to Quantify Time Course of Leukocyte Migration
To select an appropriate time point for subsequent experiments, we measured the extent of migration of human leukocytes in response to the potent chemokine SDF-1 across a 12-h time course using Discovery-1. This assay also provided the opportunity to demonstrate the ability of Discovery-1 to conduct time course migration experiments on the same wells, which was not possible with either of the other two quantification methods.
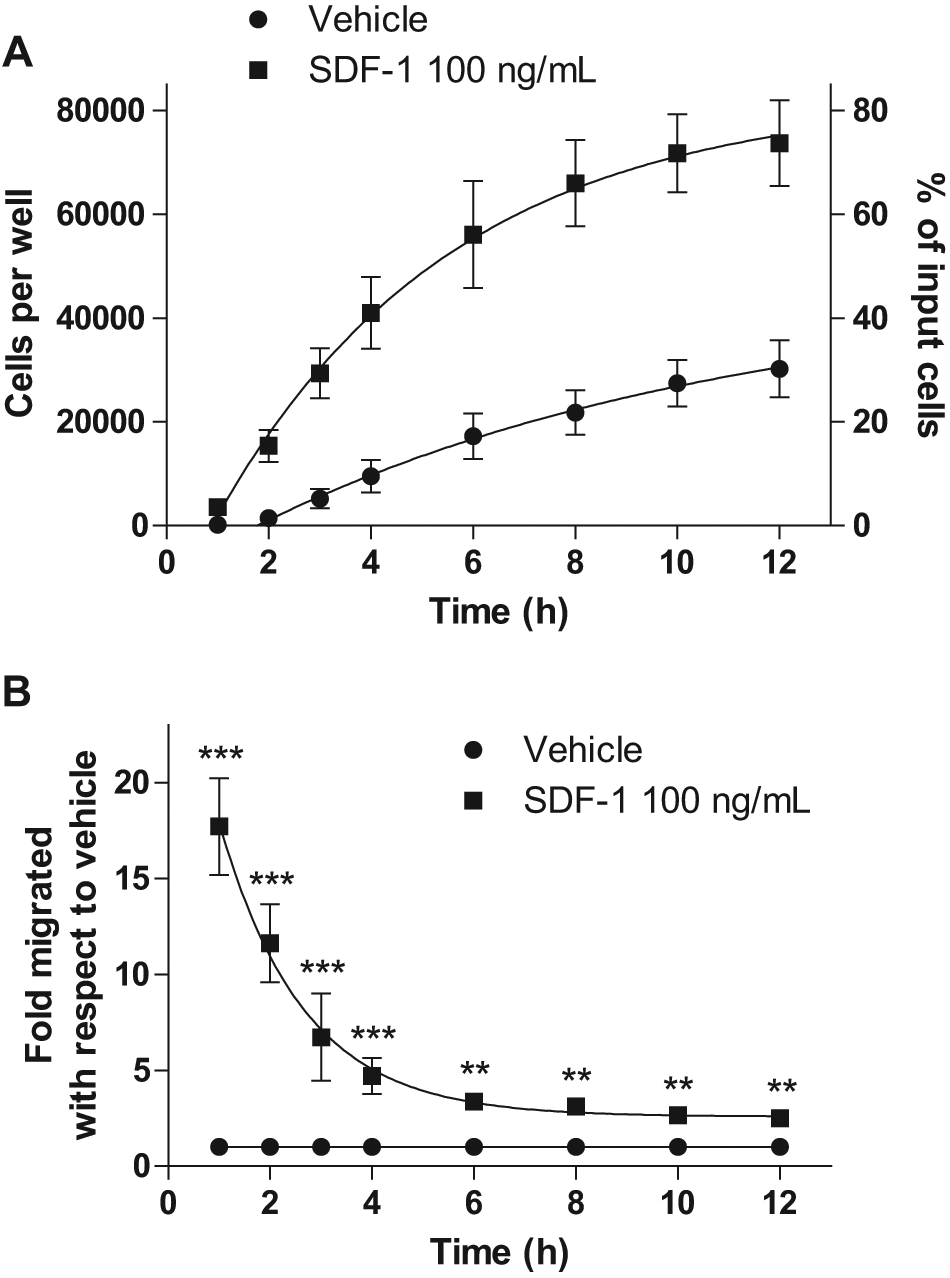
Quantification of SDF-1-mediated leukocyte migration time course using Discovery-1. Migration of leukocytes was conducted across a 12-h time course in response to 100 ng/mL SDF-1 or vehicle and number of migrated cells quantified using the Discovery-1 method. (A) Actual cell number (and % of input cells migrated) as calculated from the Discovery-1 standard curve and (B) the fold-change mediated by SDF-1. Note that the fold difference is greatest at the earlier time points (p < 0.001). This highlights the ability of Discovery-1 to quantify time course experiments and the importance of the migration duration. Data are presented as the mean ± SE from three independent experiments. Significance: **p < 0.01. ***p < 0.001.
Direct Comparison of Discovery-1 and ATPlite Assays to Measure SDF-1-Mediated Leukocyte Migration
In this series of experiments, leukocyte migration was conducted for 4 h using 3.0-µm Transwells (96-well HTS format) and SDF-1 across a concentration range of 100 pg/mL to 1 µg/mL. Migrated cells were imaged using Discovery-1, and then immediately afterward, the Transwell insert was carefully removed and the same plate was used for the ATPlite measurements. Therefore, the two quantification methods measured the same experimental data.
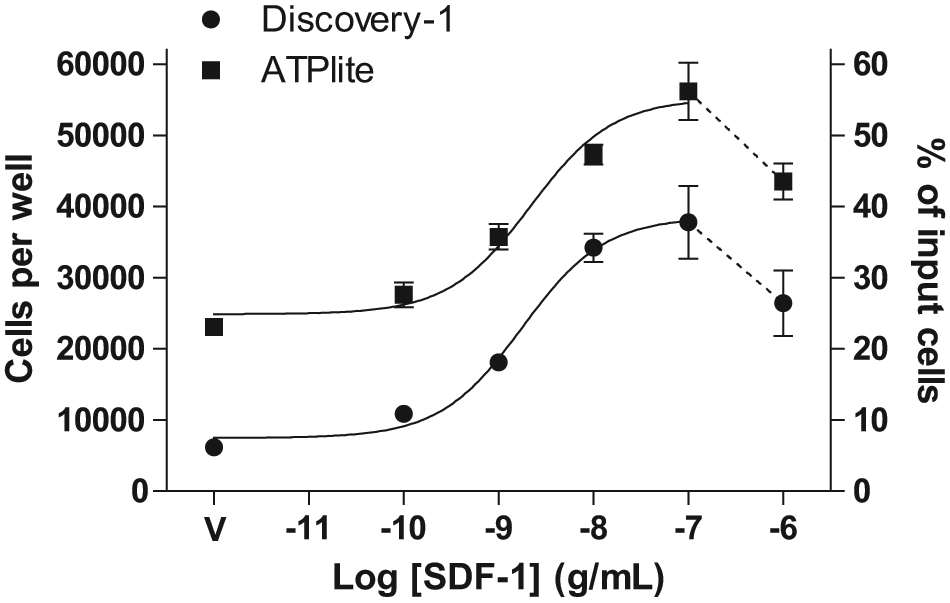
Quantification of SDF-1 concentration response using Discovery-1 and ATPlite assay. Leukocyte migration experiments were conducted using a range of SDF-1 concentrations (100 pg/mL to 1 µg/mL) or vehicle (V) for 4 h and then the number of migrated cells quantified using the Discovery-1 method followed by the ATPlite assay. It is important to note that following migration, images of respective wells were acquired by Discovery-1, and then the plate was processed in the ATPlite assay. Thus, the data show the direct comparison of both methods using the same experimental data, which indicates that Discovery-1 underestimates the actual cell number in comparison with the ATPlite assay. Data are presented as the mean ± SE from one representative experiment.
Advantages, Disadvantages, and Future Applications
In terms of creating a true HTS drug screening platform to study leukocyte migration, the disadvantages of Discovery-1 are the significant prerequisite level of expertise in operating the system and the considerable initial equipment cost. However, Discovery-1 had the novel ability to conduct time course experiments on the same wells, which is useful for some high-content applications, and had the best limit of detection. The ATPlite assay has a number of distinct advantages, including its simplicity, immediacy of results, and compatibility with standard plate-reading luminometers. Technically, the assay offers a good linear dynamic range for quantification, and we routinely achieved a detection limit of 300 to 400 leukocytes, which was not as good as the Discovery-1 method but impressive nonetheless. In addition, the ATPlite assay had the best sensitivity and precision. As such, the ATPlite assay is highly suited for conducting large-scale pharmacological migration studies or comparing migratory responses of leukocytes from multiple donors simultaneously. In this regard, the ATPlite assay could be used for initial HTS drug screening, with positive hits confirmed using Discovery-1 or coupled with high-content analysis (e.g., flow cytometry) for phenotypic analysis of migrated leukocyte subsets. The ATPlite assay would also have the potential to integrate easily into a robotics platform (e.g., for routine analysis or clinical diagnostic labs).
An important consideration for all migration assays, particularly quantification methods such as ATPlite that are sensitive to cell viability, is the potential for cellular or drug-mediated cytotoxicity occurring over prolonged periods of migration. The methods we detail here provide two possible approaches to conducting migration assays using short (1–4 h) migration periods, thus reducing secondary cytotoxicity effects that may occur during prolonged culture periods.
In conclusion, the methods we have developed for Discovery-1 or ATPlite quantification would be applicable for HTS migration studies using human leukocytes. Both have very good detection limits and sensitivity. ATPlite is the easiest to conduct and offers a very rapid, widely available method. Both Discovery-1 or ATPlite assays would be applicable for the study of less abundant leukocyte subsets (e.g., antigen-presenting cells or regulatory T cells) or rare sources of cells extracted from human tissue (e.g., human brain, skin, tumors, or lymph nodes) where yields are often very low. Previous studies have developed HTS methods for investigating the migration of adherent cells during scratch/wound-healing models16,17 or extravasation of cells through tissue. 18 However, these are quite distinct from the methods and applications we have developed here. Our methods have been developed for nonadherent cells (e.g., blood leukocytes) with migration through the Transwell barrier, which models the initial chemotactic response of cells to chemokines. The ability to conduct HTS migration assays using human immune cells (or similar) to identify drug candidates of immunoregulatory processes is an exciting area of research and is now available to more researchers using the methods we have established here.
Footnotes
Acknowledgements
We thank all donors who contributed blood for this study.
The authors declared no potential conflicts of interest with respect to the research, authorship, and/or publication of this article.
The author(s) disclosed receipt of the following financial support for the research and/or authorship of this article: This research was funded by the Auckland Medical Research Foundation (MG and ESG), a Hercus Fellowship from the New Zealand Health Research Council (ESG), and a University of Auckland Faculty Research Development Fund grant (KM). Discovery-1 and MetaMorph (see ![]() ) analysis facility was established through the National Research Centre for Growth and Development, New Zealand.
) analysis facility was established through the National Research Centre for Growth and Development, New Zealand.
References
Supplementary Material
Please find the following supplemental material available below.
For Open Access articles published under a Creative Commons License, all supplemental material carries the same license as the article it is associated with.
For non-Open Access articles published, all supplemental material carries a non-exclusive license, and permission requests for re-use of supplemental material or any part of supplemental material shall be sent directly to the copyright owner as specified in the copyright notice associated with the article.