
Abstract
Aggresomes are subcellular perinuclear structures where misfolded proteins accumulate by retrograde transport on microtubules. Different methods are available to monitor aggresome formation, but they are often laborious, time-consuming, and not quantitative. Proteostat is a red fluorescent molecular rotor dye, which becomes brightly fluorescent when it binds to protein aggregates. As this reagent was previously validated to detect aggresomes, we have miniaturized its use in 384-well plates and developed a method for high-throughput imaging and quantification of aggresomes. Two different image analysis methods, including one with machine learning, were evaluated. They lead to similar robust data to quantify cells having aggresome, with satisfactory Z′ factor values and reproducible EC50 values for compounds known to induce aggresome formation, like proteasome inhibitors. We demonstrated the relevance of this phenotypic assay by screening a chemical library of 1280 compounds to find aggresome modulators. We obtained hits that present similarities in their structural and physicochemical properties. Interestingly, some of them were previously described to modulate autophagy, which could explain their effect on aggresome structures. In summary, we have optimized and validated the Proteostat detection reagent to easily measure aggresome formation in a miniaturized, automated, quantitative, and high-content assay. This assay can be used at low, middle, or high throughput to quantify changes in aggresome formation that could help in the understanding of chemical compound activity in pathologies such as protein misfolding disorders or cancer.
Introduction
Aggresomes may be defined as subcellular structures where misfolded and aggregated proteins are accumulated by retrograde transport on microtubules, involving histone deacetylase 6 (HDAC6) and dynein. 1 Aggresomes are described as perinuclear cytoplasmic inclusions at the microtubule-organizing center (MTOC), often containing polyubiquitinated misfolded proteins, a proteasome, and molecular chaperones in a vimentin cage.2,3 The function of aggresomes is primarily protective because misfolded proteins are kidnapped and may then be processed by the autophagy pathway. 4 So it is generally recognized that aggresomes contribute to cell survival.4,5 It has also been observed that the incubation of cells with toxic compounds such as proteasome inhibitors increases the load of misfolded proteins and induces aggresome formation.5,6 In this case, probably because the capacity of the cell to cope with misfolded proteins is exceeded (for instance, in case of prolonged cellular stress or when the autophagy pathway is disturbed), aggresome formation is followed by cell death.
Different methods are available to monitor aggresome formation, such as transmission electron microscopy, which consists in visualizing electron-dense particles close to the nucleus3,7 or to image fluorescent mutant proteins expected to aggregate.3,8 A classical method is to characterize aggresome formation by immune fluorescence of involved proteins, such as γ tubuline (a major MTOC component), ubiquitin, HSP70 (heat shock protein 70 kDa) chaperone, and vimentin.3,5,8 However, these methods require protocols that are often laborious and time-consuming with many optimization steps, to finally obtain results that are most of the time not quantitative.
The Proteostat detection reagent has been shown to detect aggresomes. This is a red fluorescent molecular rotor dye, which becomes brightly fluorescent when it binds to aggregated proteins. 9 It has proven to be useful to detect aggresome formation related to cancer 6 or to neurodegenerative diseases. 10 This reagent was initially developed for cell analysis by flow cytometry or by fluorescence microscopy with glass slides. Consequently, it is not suitable for testing many conditions, such as when studying kinetic effects or for a library screening in a phenotypic assay.
In this paper, we show how we have optimized the use the Proteostat aggresome detection reagent to easily monitor aggresome formation in a miniaturized, automated, and quantitative phenotypic assay. We decided to compare two different approaches for the image analysis. Indeed, we wanted to know if they would lead to the same results and to assess if one of them was quantitatively more robust. The first one was to detect and specifically segment the aggresome itself in each cell, which leads to having three masks, one for the nuclei, one for the cytoplasm, and one for the aggresome. We performed this with the predefined building blocks available in Columbus software (PerkinElmer, Courtaboeuf, France). The second method used both texture measurements in the cytoplasm and a machine learning-based method with no need to specifically segment the aggresome. The texture measurements allowed us to detect cells with and without aggresome. We performed this with the machine learning-based Phenoglyph module available in IN Carta software (GE Healthcare Life Sciences, Vélizy-Villacoublay, France). Both have led to the same robust quantification of cells with aggresomes. This assay was finally validated by screening a chemical library of 1280 compounds, using Columbus.
Materials and Methods
Cell Culture and Reagents
All media and cell culture reagents were purchased from Gibco, Life Technologies (Courtaboeuf, France). HeLa cells (human cervical cancer cell line)were provided by the American Type Culture Collection (ATCC; Manassas, VA) and were grown in monolayer culture at 37 °C and 5% CO2 in Dulbecco’s modified Eagle’s medium (DMEM) GlutaMAX, high glucose, pyruvate medium supplemented with 10% heat-inactivated fetal bovine serum, and 1% penicillin-streptomycin.
OPM2 cells (human multiple myeloma cell line) were purchased from DSMZ Leibniz Institute (Braunschweig, Germany) and cultured in suspension culture at 37 °C and 5% CO2 in Roswell Park Memorial Institute (RPMI) 1640 GlutaMAX medium, supplemented with 10% heat-inactivated fetal bovine serum and 1% penicillin-streptomycin.
Carfilzomib was purchased from Selleck Chemicals (Houston, TX). Tunicamycin was from Sigma (St. Quentin Fallavier, France). Stock solutions from all compounds were made in DMSO. A Proteostat aggresome detection kit was purchased from Enzo (Villeurbanne, France).
Adherent Cell Treatment
HeLa cells were seeded with the BioTek MicroFlo dispenser in CellCarrier-384 black, optically clear-bottom microplates (PerkinElmer) at the density of 37,500 cells/mL in 40 µL. The next day, nanodrops of compounds in DMSO were dispensed onto cells with an acoustic nanodispensor (Echo 550; Labcyte, Sunnyvale, CA) and medium completed to achieve the target concentration in a final volume of 70 µL. The final concentration of DMSO did not exceed 0.3%. To avoid edge effect, plates were covered with respiring seal during incubation.
Suspension Cell Treatment
Nanodrops of compounds were dispensed with an acoustic nanodispensor (Echo 550) in µClear black 384-well plates (Greiner, Kremsmüster, Austria). Then 70 µL of OPM2 cells, in suspension at 171,000 cells/mL, were dispensed. Assay plates were incubated at 37 °C, 5% CO2. After treatment time, cells were transferred to a polylysine-coated, CellCarrier-384 black, optically clear-bottom plate and left to adhere at 37 °C during 30 min.
Aggresome Labeling
Cells were fixed by adding formaldehyde at 37%, directly in the 70 µL medium to achieve a final concentration of 3.8%, with the BioTek MicroFlo dispenser. After 15 min, cells were washed two times with 90 µL phosphate-buffered saline (PBS) with a plate washer (Hydrospeed, Tecan, Lyon, France). If needed, plates with PBS can be stored at 4 °C for a few days. PBS was removed and cells were permeabilized with 0.5% Triton X-100, 3 mM EDTA, pH 8.0, in 1× assay buffer of the Proteostat aggresome detection kit. After 30 min, cells were washed four additional times with 50 µL PBS. After removing PBS, 20 µL of a mixture of Proteostat detection reagent (1/1000) and Hoechst 33342 (500 ng/mL, Thermo Fisher, Courtaboeuf, France) was added manually to the cells. They were diluted in 1× assay buffer of Proteostat aggresome detection kit or in 0.5% PBS/bovine serum albumin (BSA; Sigma, St. Quentin Fallavier, France) if reagent sticking was detected. After 30 min protected from light, wells were washed three times with 50 µL of PBS. Plates were stored at 4 °C before imaging.
Image Acquisition and Analysis
Images were acquired on a high-content screening platform (Equipex Imaginex BioMed; Institut Pasteur de Lille, Lille, France) automated by Agilent Technologies (Santa Clara, CA) with the IN Cell Analyzer 6000 microscope (GE Healthcare Life Sciences) at 60× magnification in the nonconfocal mode with a DAPI filter set (excitation 405 nm/emission 455 nm) and Texas Red filter set (excitation 488 nm/emission 605 nm). Six to 12 images per well were collected. A screening 384-well plate was totally acquired in approximatively 2 h 30 min. Images were analyzed either with Columbus software or with IN Carta software.
Compound Library
The Prestwick Chemical Library was provided by Prestwick Chemical (Illkirch, France). This is a collection of 1280 chemical compounds mainly composed of approved drugs with high chemical and pharmacological diversity. For convenience, after reception, we distributed the compounds in 10 mM DMSO in either 96-well plates or 384-well Echo-qualified source plates that we stored at −20 °C. In the case of the screening detailed in this paper, we have made an intermediate plate with the compounds diluted at 70 µM in culture medium, before transferring them to the cell plates with a Bravo liquid handler (Agilent). The final concentration was 10 µM.
Data Analysis
Z′ factors were calculated according to Zhang et al. using means and standard deviations from DMSO and 60 nM carfilzomib controls. 11 Plates were validated if their respective Z′ factors were ≥0.4 and if the percentage of positive cells with 60 nM carfilzomib was ≥70%.
EC50 values of compounds were calculated from concentration–response curves by a nonlinear regression analysis of four parameters with GraphPad Prism 7 (La Jolla, CA).
Hit Analysis
The 1280 screened compounds were clustered by chemical similarity. First, the molecular similarities were computed for each molecule pair using the Fingerprint ECFP4. These fingerprints were calculated using the Maya Chem Tools package.
12
Then, we generated a similarity matrix that we used to cluster the compounds using a hierarchical cluster analysis using the “complete” method to build the dendrogram (shown in
Different physicochemical properties were calculated: molecular weight, cLogP, pKa, total surface area, relative polar surface area, number of H-bond donors, number of H-bond acceptors, number of rotatable bonds, number of aromatic rings, number of aromatic atoms, and number of rings. All properties except pKa were calculated with Datawarrior. 14 For the pKa prediction, the Cxcalc calculator plug-in, Marvin (v19.26.0; ChemAxon; http://www.chemaxon.com), was used.
Results
Aggresome Detection
We have designed procedures and conditions to use the Proteostat detection reagent for image-based high-content screening applications. HeLa cells were fixed in 384-well plates with formaldehyde and permeabilized with Triton X-100. After washing steps, the cells were stained with the Proteostat detection reagent diluted at 1/1000 in a 0.5% PBS/BSA buffer containing 500 ng/mL Hoechst 33342 (to label the nuclei). Images (60×) were acquired with the automated IN Cell Analyzer 6000 microscope with DAPI and Texas Red filters. Details about the protocol are shown in Table 1 . To measure the effect of compounds on aggresome formation, 24 h after cell seeding we added them directly in the medium by acoustic droplet injection with an Echo dispenser. Cells were then incubated at 37 °C, 5% CO2 and fixed after different periods of time.
HCS Aggresome Detection Protocol.
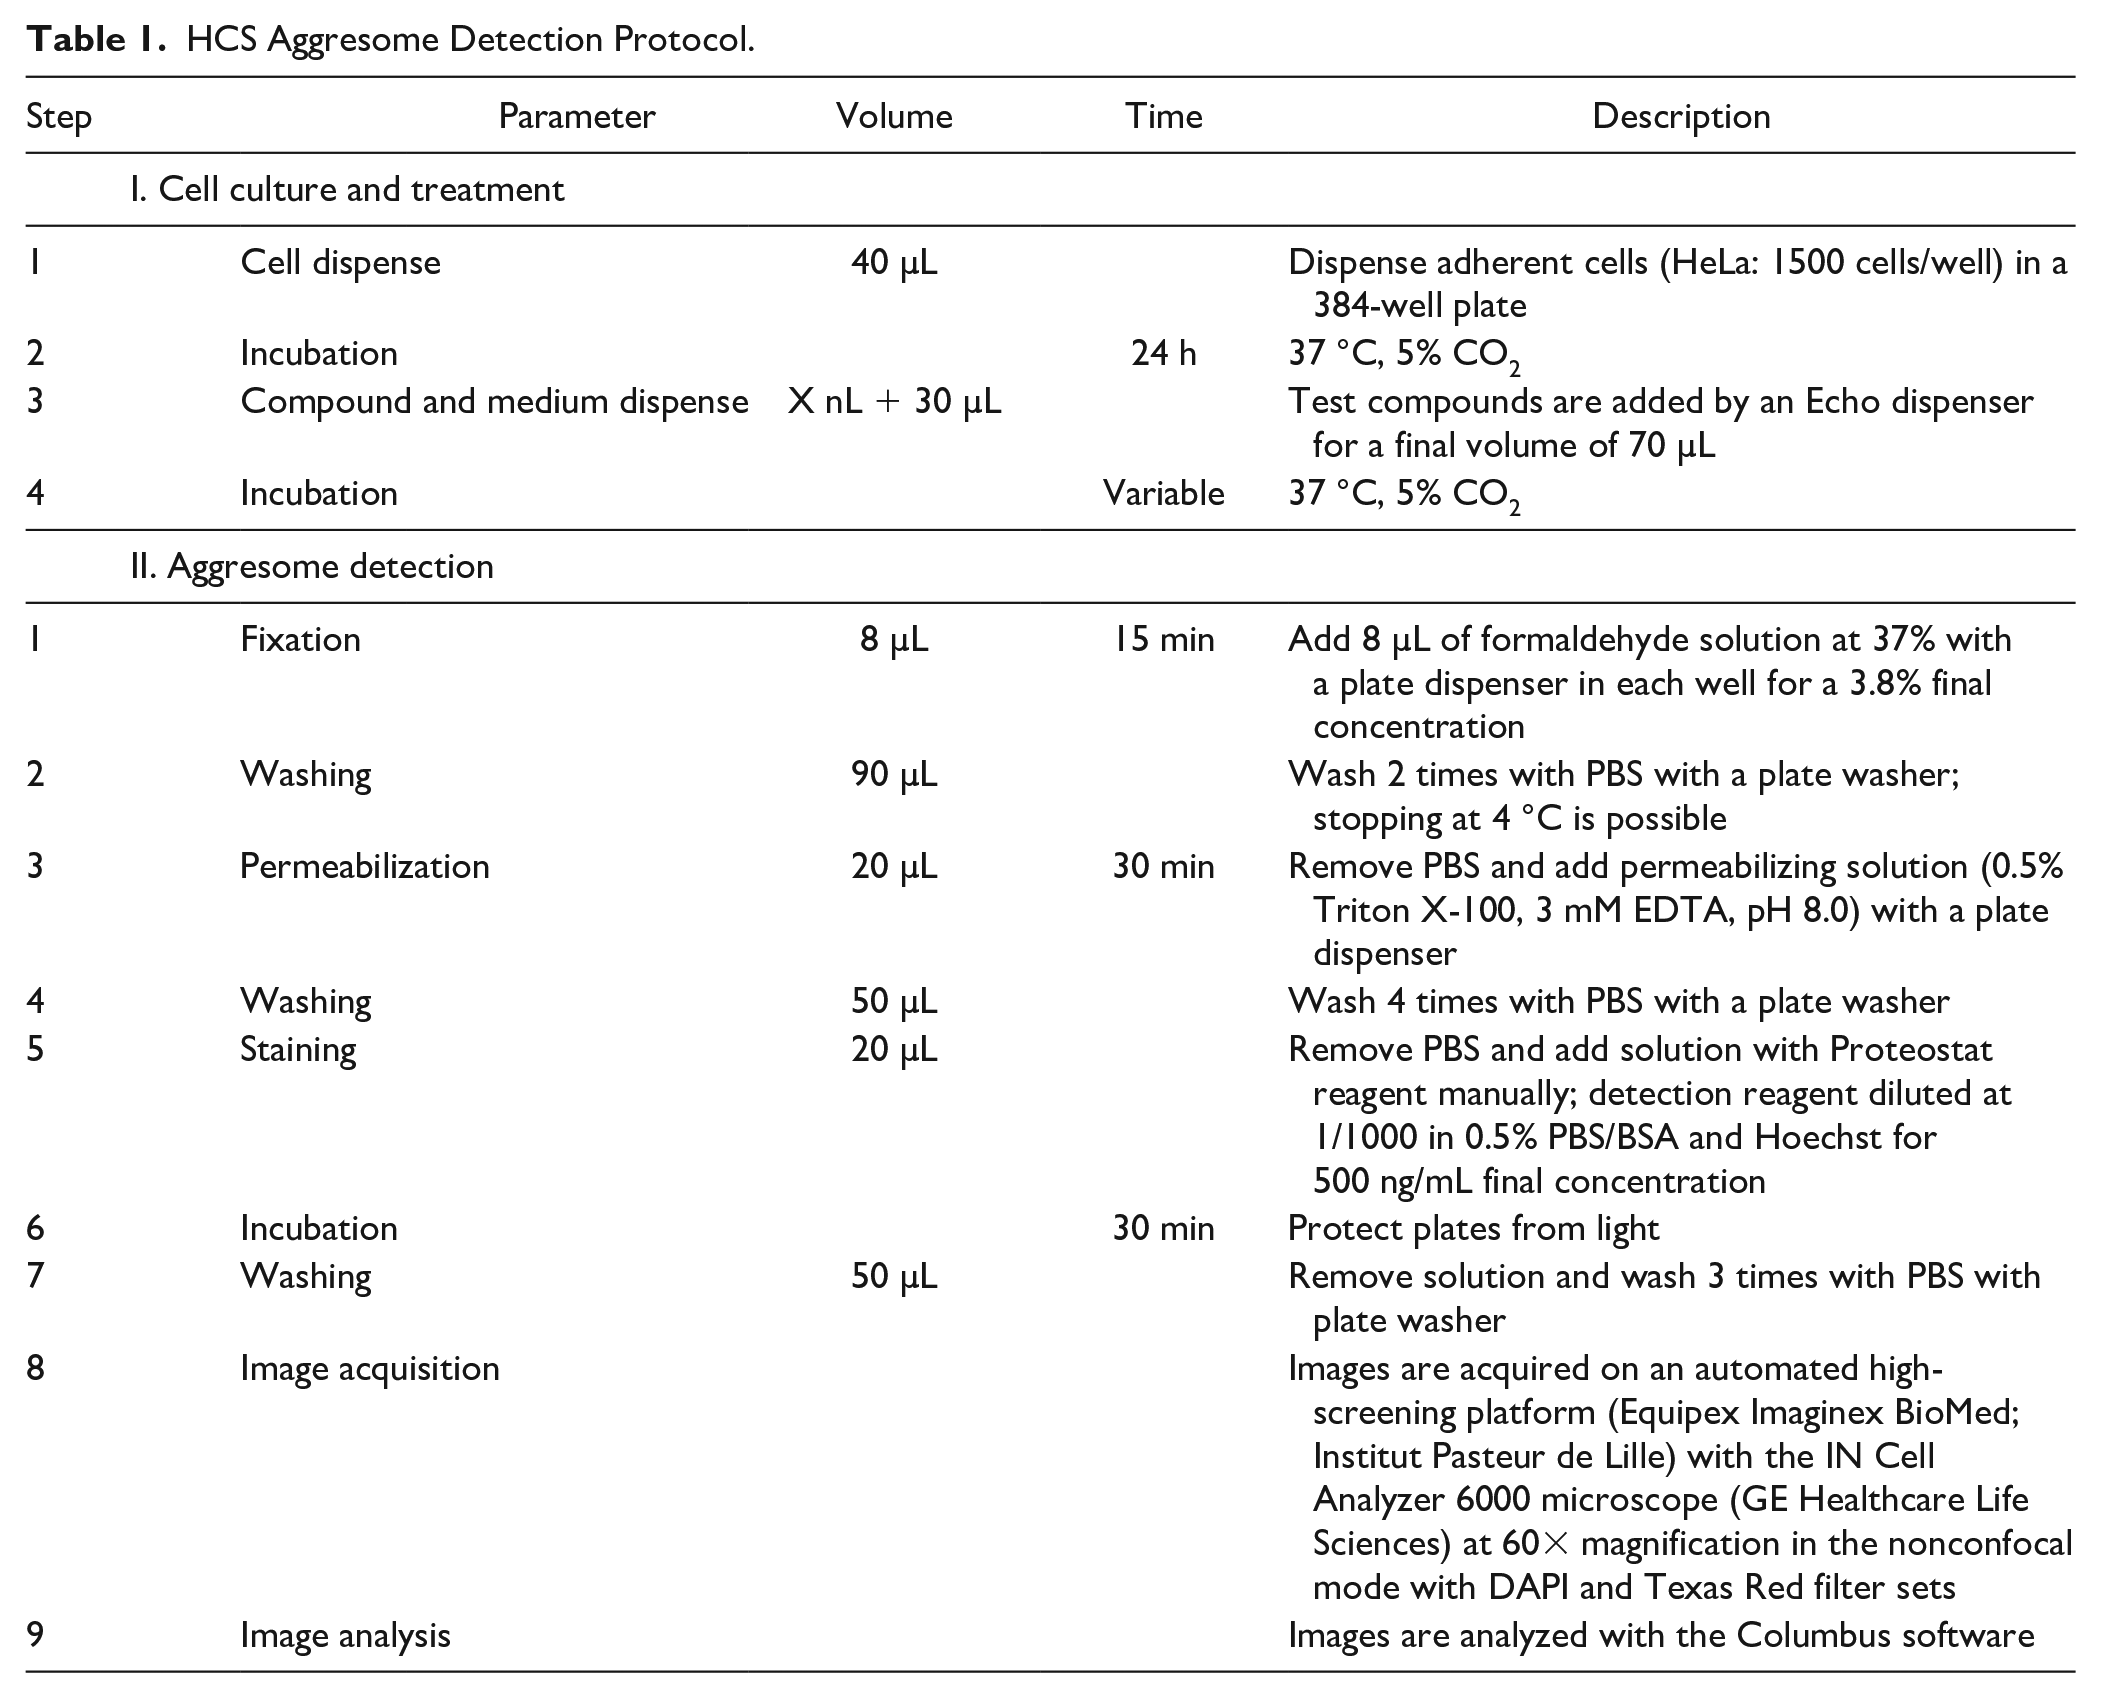
In comparison with the protocol given by the supplier, we have lowered by twofold the reagent concentration and found the sufficient fluorescent intensity to clearly label the aggresomes in cells treated with 10 µM MG132, which is used as a reference positive control (data not shown). The washing protocol was also changed to automate this step with a plate washer. Importantly, the use of 384-well plates instead of glass slides allowed us to increase the number of conditions simultaneously tested, as well as the throughput of the assay globally by using automated liquid handlers and plate readers.
Image Analysis for Aggresome Quantification
To analyze images, we have used two different software programs for high-content screening to generate statistically significant quantitative and multiparametric data in a fast and automated way.
First, we created a script with the Columbus software developed by PerkinElmer. In this system, we used predefined building blocks to perform image segmentation and analyze the cell phenotype. As described in Figure 1 , the script starts by identifying nuclei using the Hoechst 33342 channel (e.g., emission 405 nm/excitation 455 nm). Different nuclei parameters were measured at this step because they are indicators of cell viability: for instance, nuclei count and nuclei area decrease with apoptosis and death, when Hoechst intensity generally increases. A second time, we defined the cytoplasm using the Proteostat channel (e.g., emission 488 nm/excitation 605 nm) and measured the mean intensity of Proteostat reagent in the cells. However, we observed that the variation of the mean fluorescence intensity between positive cells (treated with proteasome inhibitors at concentration and time that induce aggresome formation) and negative control cells (treated with vehicle DMSO) was low. In consequence, the mean fluorescence intensity in cells would not be a robust discriminating parameter for screening applications, and we went further in the script development using another Columbus functionality to detect spots of aggregated proteins in the cells. By comparing Proteostat intensity in positive and negative control cells, we have considered that an intense and wide fluorescent spot localized at the perinuclear level should correspond to an aggresome. So, we placed two thresholds based on spot intensity and spot area, to select and count specific aggresome spots. In particular, we used the corrected spot intensity provided by the Columbus software, which corresponds to the difference between mean spot intensity and spot background intensity. By dividing the number of aggresomes by the number of nuclei, we obtained the percentage of cells with aggresome, which was a better parameter for the screening application than the mean fluorescence intensity in cells value. It is possible that this improvement is related to the fact that the spot detection is based on corrected spot intensity, which takes into account the background intensity of the spot. Most of the time, the script found one aggresome per cell, but it happened that two spots were selected in the same cell. That explains why sometimes we obtained a value for the percentage of cells with aggresome that was slightly higher than 100%.
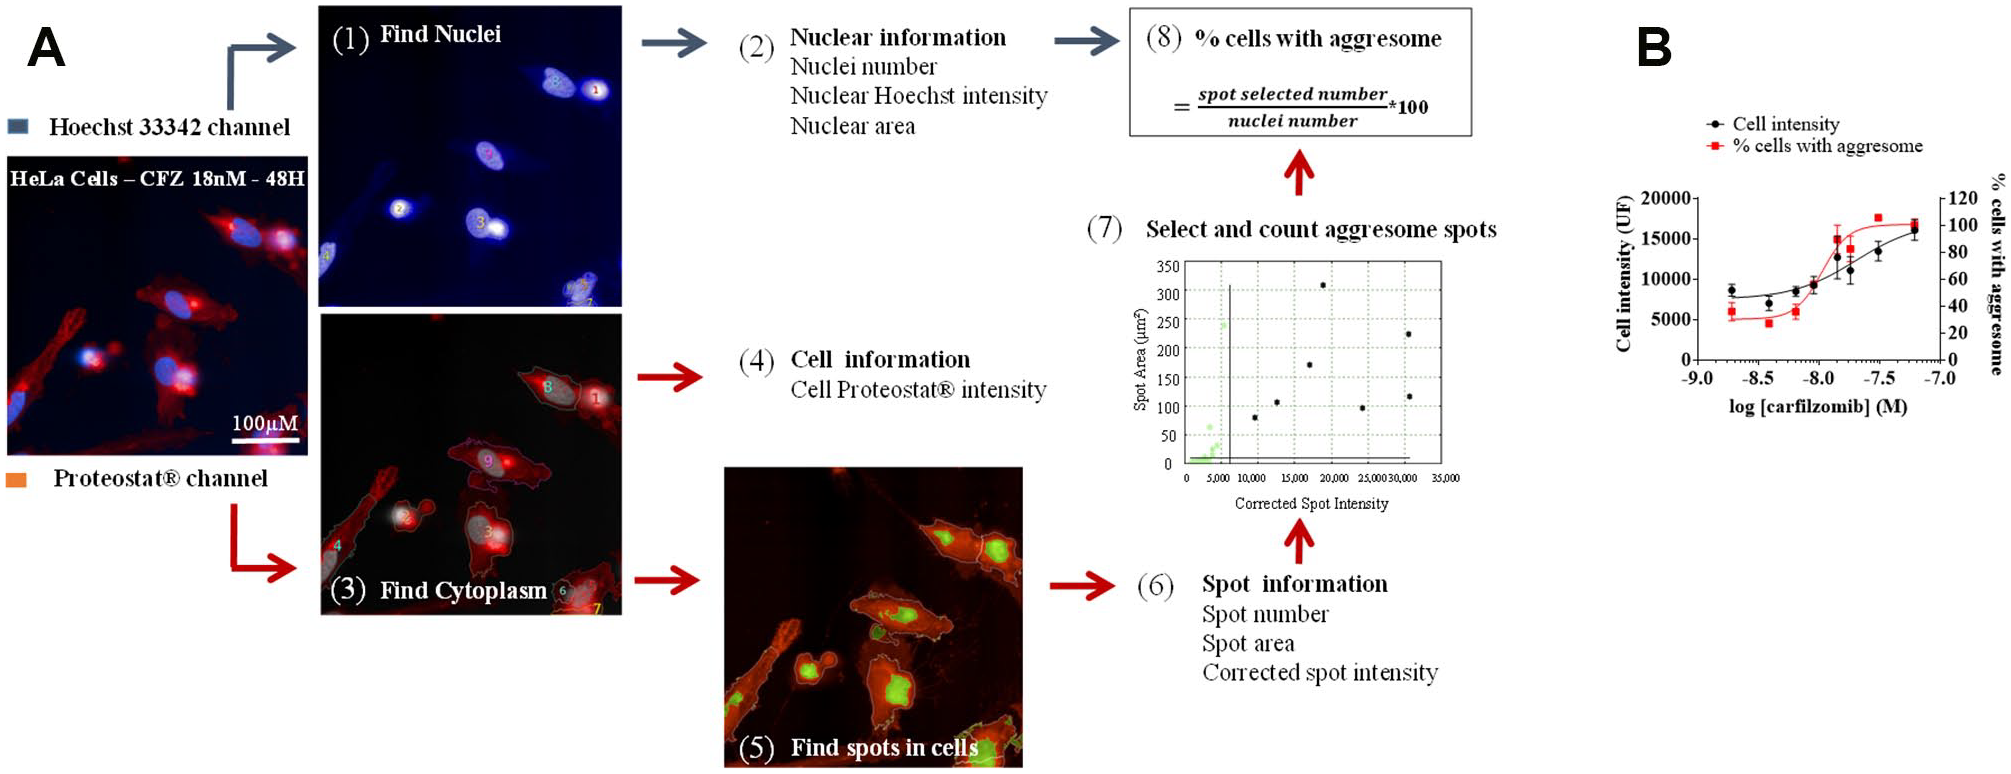
Image analysis for aggresome quantification with Columbus. HeLa cells were incubated for 48 h with various concentrations of carfilzomib. After labeling with Proteostat and Hoechst 33342, images (60×) were acquired with IN Cell Analyzer 6000. (
Alternatively, a plate with cells treated or not with various concentrations of carfilzomib have been analyzed with IN Carta software using the Phenoglyph module. Each treatment was performed in triplicate wells and six images containing from 31 (for the high concentration of carfilzomib) to 197 total nuclei (for vehicle treatment) were acquired per well. Phenoglyph is a machine learning-based classification combining several features that allows the integrating and addressing of phenotypic cell complexity. In this case, only nuclei and the cytoplasm were detected and all possible features including texture measurement were extracted to be processed by this module. After a first unsupervised step where the software shows the different cell populations found, we trained the module to recognize cells with aggresome based on positive and negative control phenotypes (
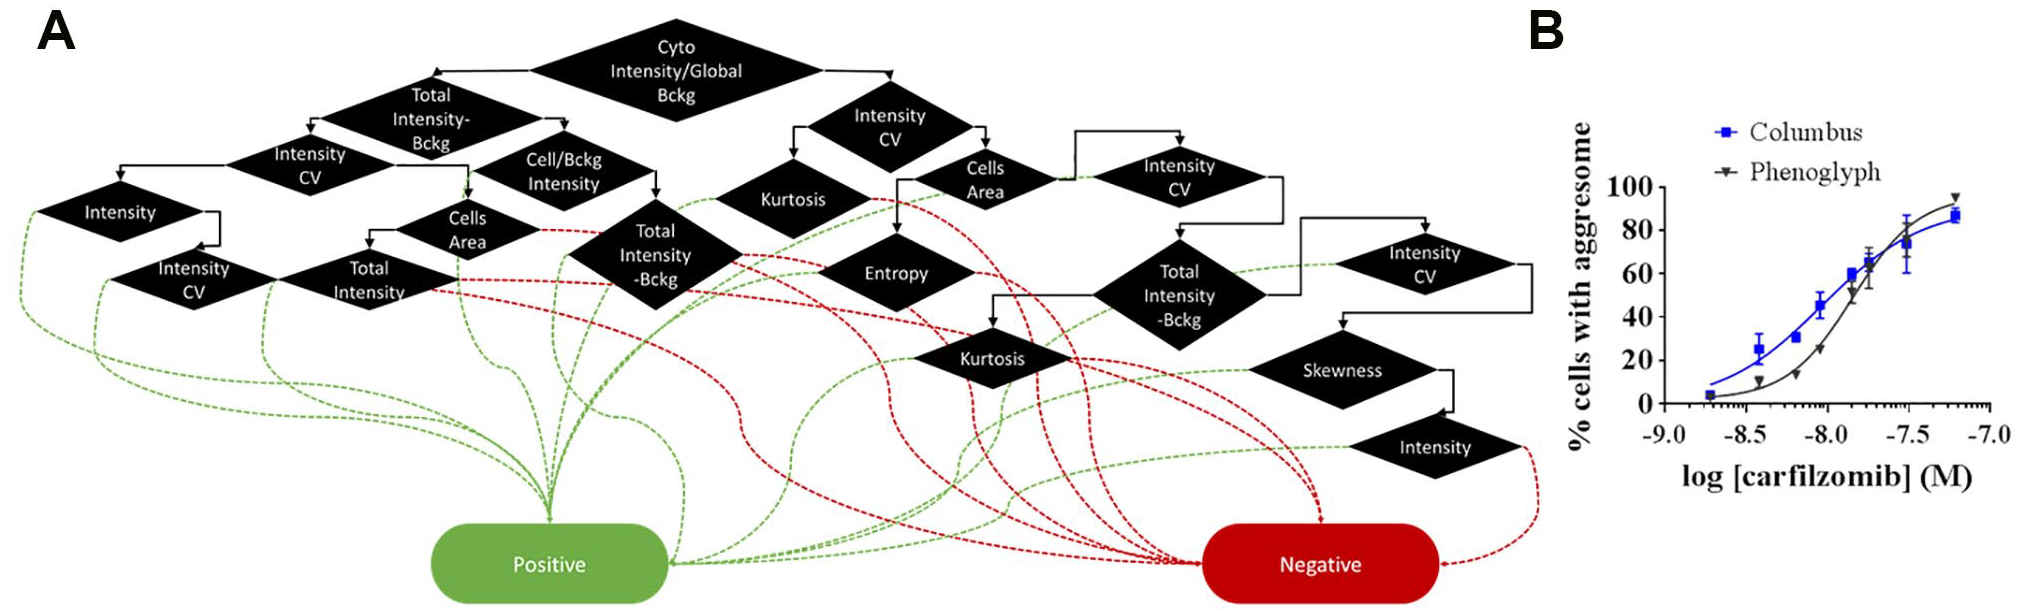
Image analysis for aggresome quantification with Phenoglyph. (
In the following experiments presented, images were analyzed with the Columbus software because of its availability in our laboratory.
To evaluate our method, we performed several separate dose response experiments using carfilzomib and tunicamycin as reference compounds because they were expected to induce aggresome formation. It is known that the inhibition of proteasome by some compounds, like MG132 or carfilzomib, leads to the accumulation of misfolded proteins in the cytoplasm. These misfolded, and possibly toxic, proteins can then be transported toward the MTOC to form the aggresome before their degradation via the autophagic pathway. 2 Figure 3 shows that aggresome detection in our miniaturized image-based assay leads to a fine quantification of positive cells that allows the determination of robust EC50 values. An equivalent conclusion comes from the results obtained with tunicamycin, a N-glycosylation inhibitor, reported to also induce the formation of misfolded proteins.15,16 In these experiments the pEC50 values (95% confident intervals) were 7.9 (7.7–8.0) and 6.3 (6.2–6.4) for carfilzomib and tunicamycin, respectively. So, with this method we can determine the potency and efficacy of compounds in a reproducible manner despite the variation of reagent intensity between the experiments.
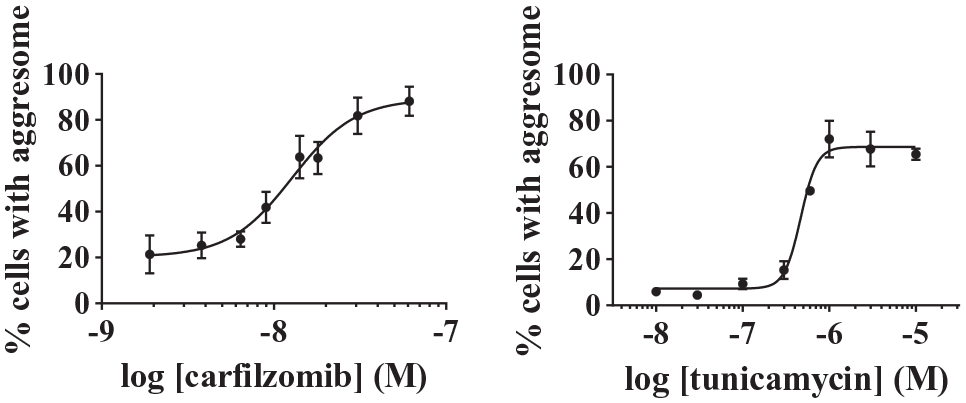
Dose response of carfilzomib and tunicamycinin HeLa cells after 48 h of treatment. Images were analyzed on Columbus software. The percentage of cells with aggresomes is given as the mean ± SEM of three (tunicamycin) to four (carfilzomib) independent experiments, each performed with triplicate incubates.
HeLa cells are adherent cells that are quite easy to image. So, we wanted to know if this method could apply to cells in suspension, such as OPM2 cells, a multiple myeloma cell line (
High-Content Screening for Aggresome Modulator Identification
After finding that our method was quantitative, we went further into the evaluation of the applicability of the assay to screen chemical libraries. But first it was required to check for possible plate effects. So, we performed a checkerboard experiment with HeLa cells treated or not with 60 nM carfilzomib for 48 h and we calculated the Z′ factor. In the first experiment, we observed border effects and some Proteostat reagent binding to plastics. To deal with these problems, we decided to seal the plates during the incubation with the compound and we diluted the reagent with 0.5% BSA. Using these new conditions, we obtained a satisfactory Z′ value of 0.5 and no border effects.
A total of 1280 compounds from the Prestwick library were screened at a concentration of 10 µM for 48 h in order to measure their capacity to induce aggresome formation. Twelve images were acquired per well and analyzed with the script developed on the Columbus software. A Z′ factor of 0.57 and an average percentage of aggresome-positive cells of 96.6% ± 1.3% for the reference compound carfilzomib were obtained (
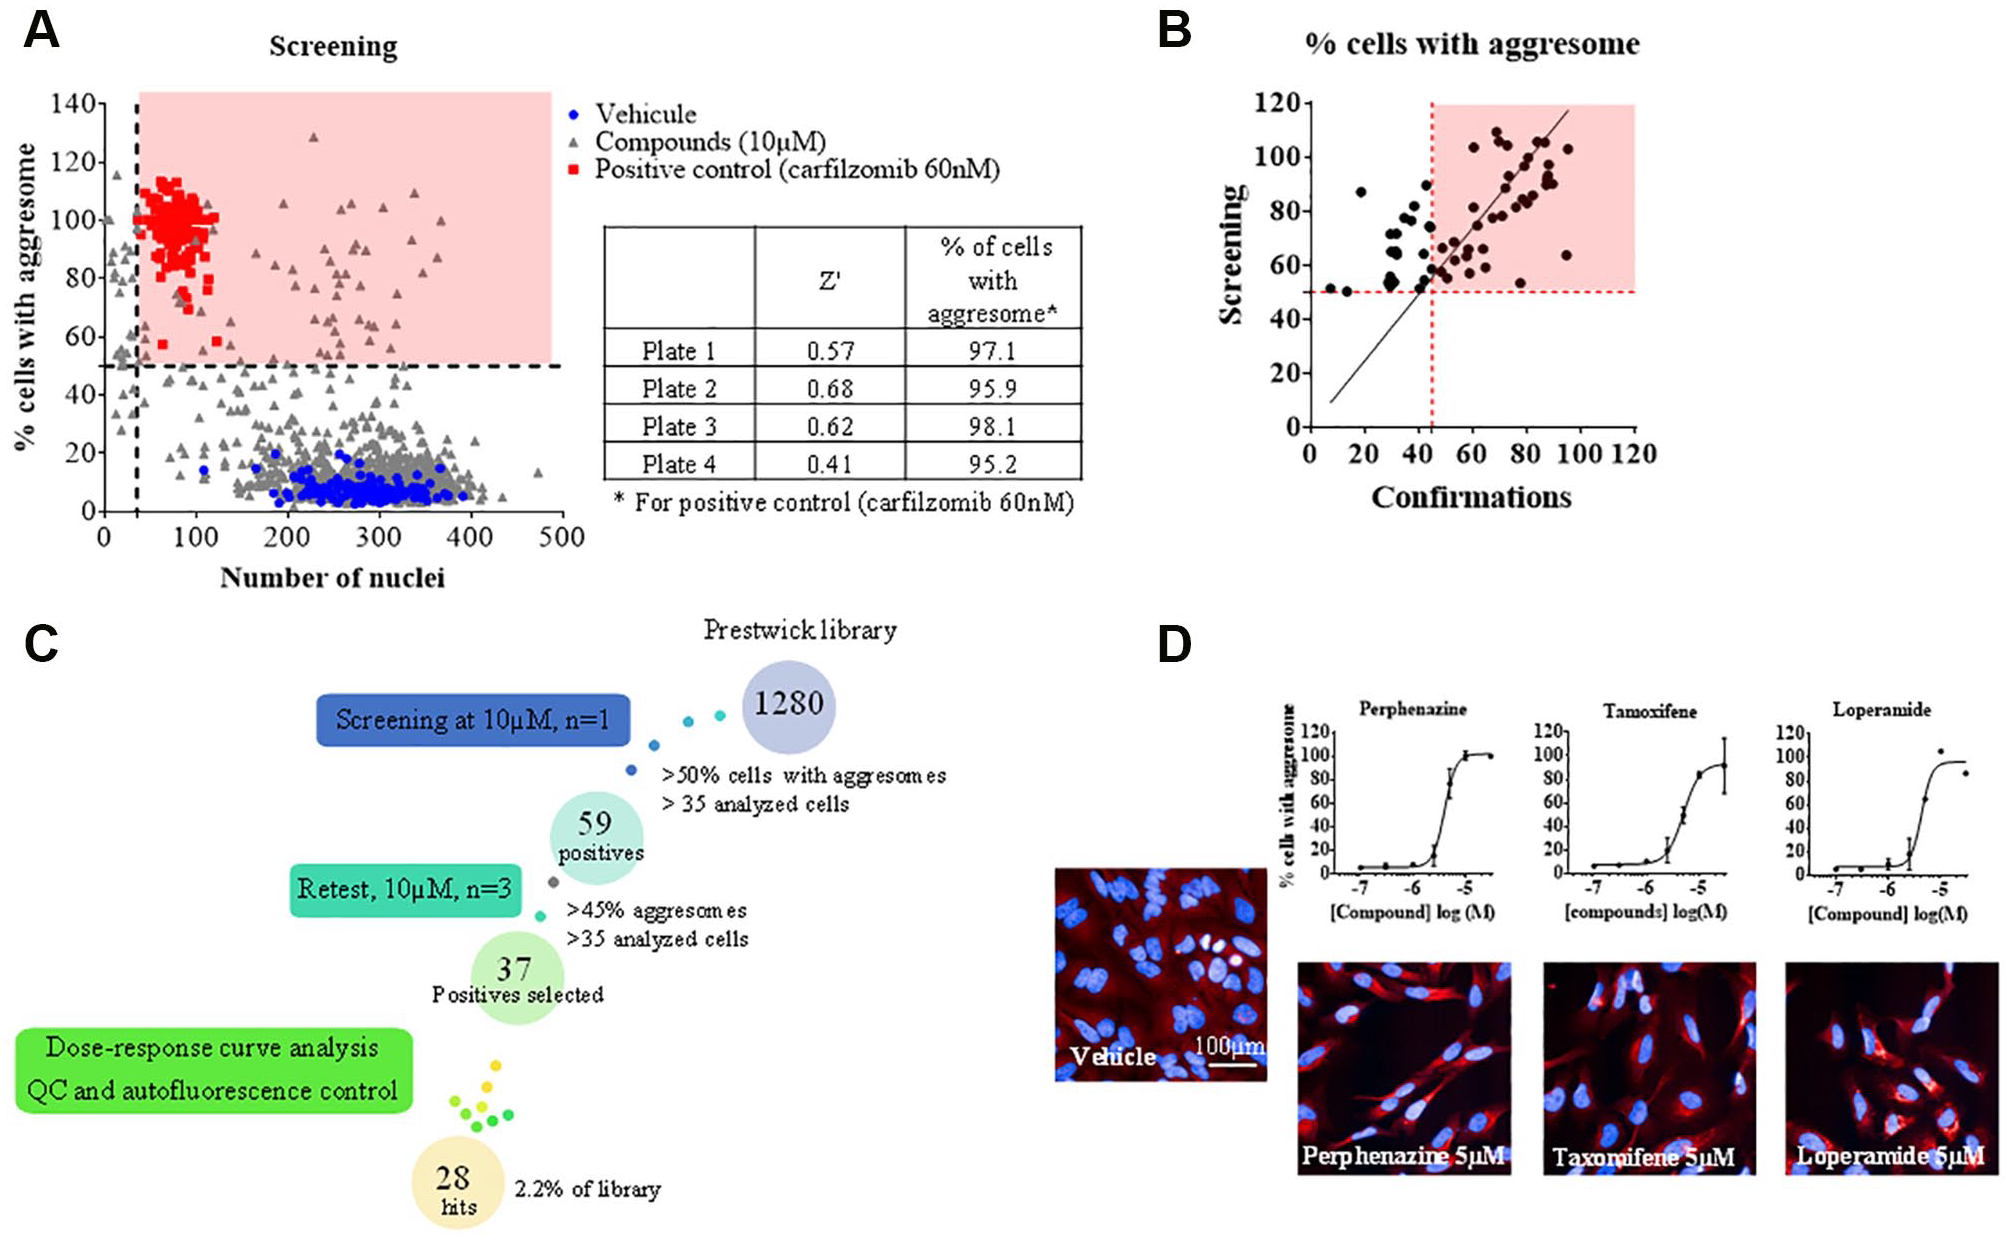
Screening of the Prestwick Chemical Library. HeLa cells were treated with 10 µM compounds for 48 h and then labeled with Proteostat and Hoechst 33342. Images were acquired with the IN Cell Analyzer 6000 and analyzed with the script developed using Columbus. (
Aggresome Modulator Characterization
The hits found from this screen belong mainly to the anti-H1 and antipsychotic pharmacological classes of drugs (
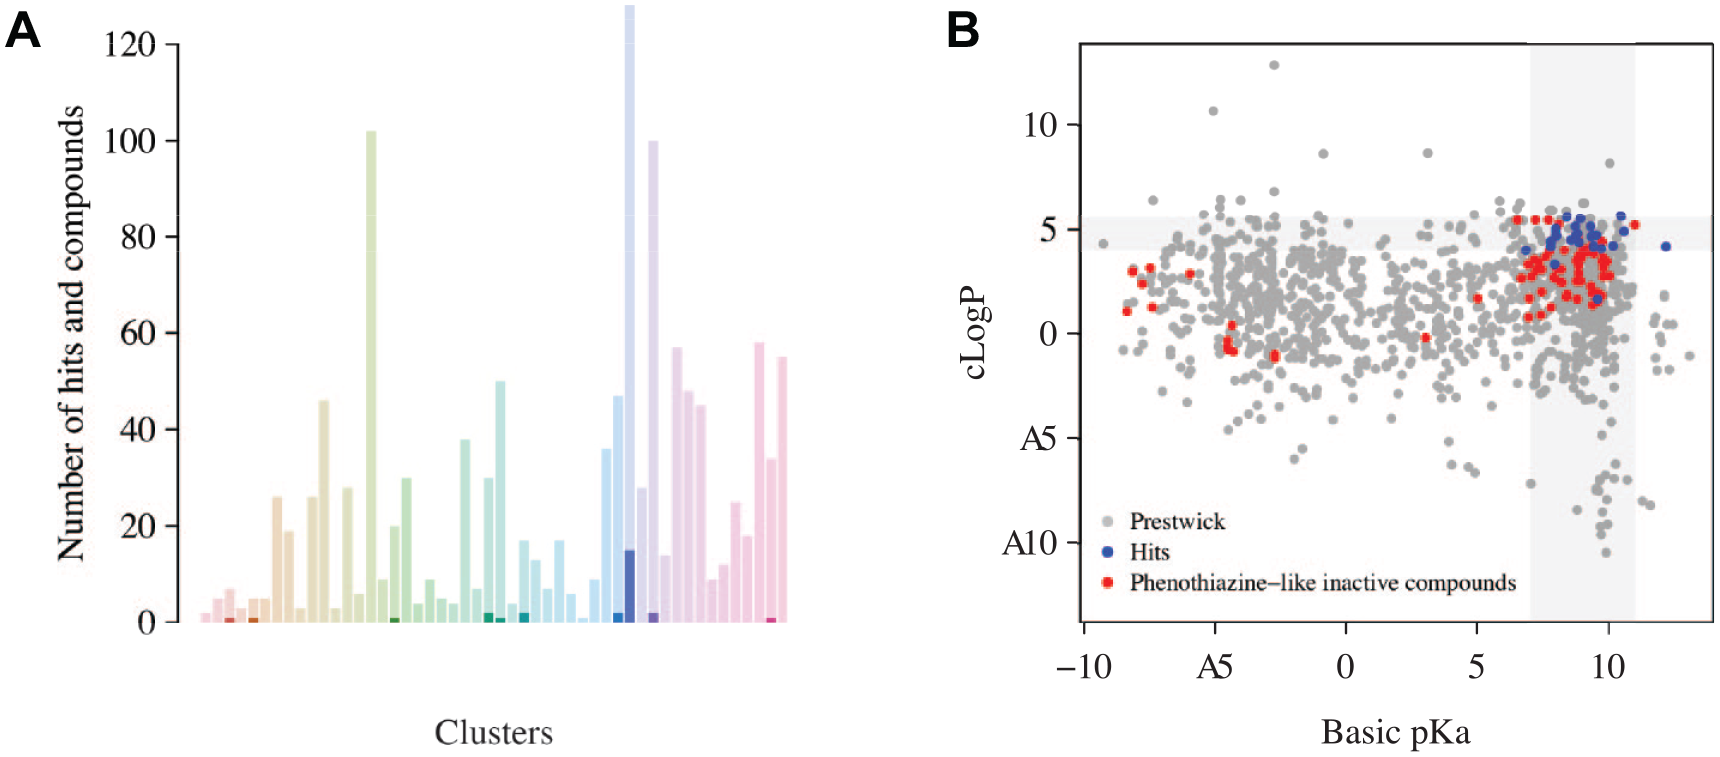
Indeed, we performed a hierarchical ascendant clustering in order to group the 1280 screened compounds by structural similarities. We clustered the library into 50 clusters and identified a cluster that gathers 15 of 28 hits. Other hits clustered into different clusters (
(
The cLogP values of almost all of the 28 hits are gathered in a narrow range around 4.0 and 5.6. These 28 hits also exhibit characteristic pKa values, most of them lying between 7 and 11 (
These hits could correspond to lysosomotropic compounds.17,18 Lysosomotropic molecules are characterized as basic compounds that accumulate in acidic organelles like lysosomes. In particular, due to their high lipophilicity, these compounds could belong to class II lysosomotropic compounds. Interestingly, some of the hits are already described as lysosomotropic compounds, like perphenazine, fluphenazine, desloratadine, and astemizole.17,19 These compounds are known to perturb cholesterol transport and autophagy flux, 19 which could explain the observed increase in aggresome formation. Moreover, the structure of these hits could correspond to the scaffold described to modulate autophagy, with two biphenyl hydrophobic cores and a linker with a tertiary amine. 20 Interestingly, most of the hits that we obtained are described in the literature to modulate autophagy, a phenotype that is more studied than aggresome modulation. 21 One of our hits is tamoxifen, a selective estrogen receptor modulator (SERM), which was already described to induce aggresome formation. So, our results are in line with the literature. 9 We found two other SERM drugs as aggresome inducers, clomiphene and raloxifene. All these SERMs are described in the literature to modulate autophagy flux.22 –24 Unexpectedly, loperamide was found active in our assay, whereas it is described by others to not induce aggresomes. 9 This difference might be due to the different treatment time, more extended in our case. It is important to remember that aggresome structures are dynamic and depend on a balance between the aggresome’s formation and degradation by the autophagy pathway. Having in hand a miniaturized, automated protocol allows us to perform comprehensive and experimental plans combining various time points and compound concentrations. This should improve the description and understanding of the pharmacological effect(s) of compounds.
To go further, several neurodegenerative diseases, such as Alzheimer’s disease and Parkinson’s disease, are characterized by accumulated aggregates25,26 that have been shown to be labeled in cells by the Proteostat reagent.9,27 We therefore believe that our miniaturized and quantitative method could be helpful to screen and find compounds that decrease these harmful aggregates. In addition, this image-based assay allows multiple fluorescent readouts and thus the simultaneous analysis of other relevant markers.
Supplemental Material
Supplemental_Material_for_screening_aggresome_by_Lesire,_et_al – Supplemental material for High-Throughput Image-Based Aggresome Quantification
Supplemental material, Supplemental_Material_for_screening_aggresome_by_Lesire,_et_al for High-Throughput Image-Based Aggresome Quantification by Laetitia Lesire, Ludovic Chaput, Paulina Cruz De Casas, Fanny Rousseau, Catherine Piveteau, Julie Dumont, David Pointu, Benoît Déprez and Florence Leroux in SLAS Discovery
Footnotes
Acknowledgements
We thank Misha Bashkurov and Prashanth Dumpuri, GE Healthcare, for assistance with IN Carta. We thank Enzo Life Sciences, Inc. for advice about Proteostat use and commercial support. We thank Alexandre Vandeputte for its help with the automated HCS ImaginEx platform (supported by the Feder 12001407 D-AL and the Agence Nationale de la Recherche ANR-10-EQPX-04-01).
Declaration of Conflicting Interests
The authors declared no potential conflicts of interest with respect to the research, authorship, and/or publication of this article.
Funding
The authors received no financial support for the research, authorship, and/or publication of this article.
Supplemental material is available online with this article.
References
Supplementary Material
Please find the following supplemental material available below.
For Open Access articles published under a Creative Commons License, all supplemental material carries the same license as the article it is associated with.
For non-Open Access articles published, all supplemental material carries a non-exclusive license, and permission requests for re-use of supplemental material or any part of supplemental material shall be sent directly to the copyright owner as specified in the copyright notice associated with the article.