
Abstract
The leptin receptor, OBR, is involved in the regulation of whole-body energy homeostasis. Most obese people are resistant to leptin and do not respond to the hormone. The prevention and reversal of leptin resistance is one of the major current goals of obesity research. We showed previously that increased OBR cell surface expression concomitantly increases cellular leptin signaling and prevents obesity development in mice. Improvement of OBR cell surface expression can thus be considered as an interesting anti-obesity therapeutic strategy. To identify compounds that increase the surface expression of OBR, we developed a cell-based, phenotypic assay to perform a high-content screen (HCS) against a library of 50,000 chemical compounds. We identified 67 compounds that increased OBR cell surface expression with AC50 values in the low micromolar range and no effect on total OBR expression and cellular toxicity. Compounds were classified into 16 chemical clusters, of which 4 potentiated leptin-promoted signaling through the JAK2/STAT3 pathway. In conclusion, development of a robust phenotypic screening approach resulted in the discovery of four new scaffolds that demonstrate the desired biological activity and could constitute an original therapeutic solution against obesity and associated disorders.
Introduction
Obesity has become a major public health problem with approximately 500 million adults being considered obese (body mass index higher than 30). 1 Moreover, obesity is often associated with or is a risk factor for type 2 diabetes, cardiovascular diseases, and certain types of cancer. Leptin is a key hormone involved in body weight regulation and exerts its effect by activating the leptin receptor OBR, for which two main isoforms, OBRa and OBRb, exist. 2 Leptin is predominantly produced and secreted by white adipocytes, and its blood levels directly correlate with adipose tissue mass, thus reflecting the magnitude of the body’s energy stores that is decoded by OBR in the brain, particularly in the hypothalamic arcuate nucleus (ARC). Stimulation of OBR in this region decreases food intake and increases energy expenditure, which in turn decreases adipose mass. This regulatory feedback loop is disturbed in most obese people, shifting the energy balance toward exaggerated energy storage. Thus, the primary problem of obese people is not, as initially suspected, insufficient leptin plasma concentrations, but rather the incapability of OBR expressed in the ARC to decode high plasma leptin levels. Several hypotheses have been put forward to explain this so-called leptin-resistant state3,4: first, an impaired transport of leptin across the blood-brain barrier (BBB) toward the ARC, and second, the loss of leptin responsiveness of ARC neurons. 5 The latter includes the up-regulation of negative feedback regulators such as SOCS3, 6 the negative influence of ER stress on OBR signaling,7,8 and the availability of a sufficient amount of OBR at the cell surface.9–11 Despite this knowledge, few therapeutic strategies have been proposed to increase the leptin sensitivity of cells with the aim to prevent or treat leptin resistance. Until now, no strategy has been identified to selectively improve the leptin transport across the BBB without disturbing the overall intactness of this barrier. Although inhibitors of cellular ER stress have been shown to prevent the development of obesity in mice, the long-term therapeutic effect of such inhibitors remains challenging because of their numerous predictable side effects. 8
We recently identified a protein called OB-RGRP (for OBR gene-related proteins) or endospanin 1 that by directly interacting with OBR specifically regulates OBR cell surface expression by retaining a significant fraction of the receptor in intracellular compartments.10,12 Indeed, only 5% to 20% of OBRs are typically localized at the cell surface. 13 Consistently, silencing of endospanin 1 increases OBR surface expression two- to threefold and augments leptin-induced STAT3 phosphorylation in vitro and in vivo in the ARC, thus preventing the development of obesity in mice fed with a high-fat diet.10,12 Importantly, cell surface expression of several other receptors was not affected by endospanin 1 silencing, excluding a general effect on protein synthesis and trafficking. This indicates that cellular leptin sensitivity can be improved by mobilizing the intracellular OBR pool in a specific manner, suggesting a new therapeutic strategy to restore leptin sensitivity in obese patients. As silencing of endospanin 1 expression specifically in the ARC might be difficult to achieve in humans, we set out to identify small-molecular-weight molecules capable of increasing OBR cell surface expression. We anticipate that these compounds either interfere with the endospanin 1/OBR interaction or with any other cellular process that improves OBR cell surface expression. Such compounds would be expected to increase the signaling capacity of leptin to activate the STAT3 pathway that is involved in body weight regulation.
To identify this type of compound, we decided to use a phenotypic screening approach (or PhenomicScreen at IPK) that uses sophisticated image-mining tools to screen cellular disease models and cellular phenotypes for small molecules that change those observed phenotypes. 14 The advantage of this approach in comparison to a target-focused screen is that compounds can target any proteins or cellular components that could be involved in the formation of that phenotype. It is an especially valuable method for the identification of small molecules targeting biological areas previously lacking small molecule tools. 15 For the primary screen, we developed an assay designed to detect translocation of the OBR to the cellular surface. In-depth data analysis has to be used to characterize the full range of possible outcomes. To address this issue, a set of specific secondary assays was developed for confirmation of the observed phenotypic changes as well as to help narrow down hit candidates to the most interesting and relevant ones for our purpose. A total of 67 compounds were found active among 50,000 compounds screened in two independent runs. Of those compounds, four clusters were selected by secondary assays as potentiating the leptin-dependent JAK2/STAT3 signaling cascade.
Materials and Methods
Chemicals
All cell culture reagents, such fetal bovine serum (FBS), penicillin/streptomycin, and geneticin (G418), were purchased from Gibco (Carlsbad, CA).
Cell flasks (T75 and T175) were from BD/Falcon (San Jose, CA). DAPI was purchased from Molecular Probes/Invitrogen (Carlsbad, CA). The chemical library was purchased from Chembridge (Newark, NJ) and stored in 384-well polypropylene plates from Greiner (Frickenhausen, Germany). Clear plastic bottom poly lysine–coated 384-well Greiner plates were used as assay plates for imaging. The library of small chemical molecules was provided by GyeongGi Bio-Center (Gyeonggi-do, Korea). Before the beginning of the assay, compound plates were thawed at room temperature, and 250 nL of compounds was transferred using a CyBio Hummingbird liquid handler directly from compound plates into the Greiner clear-bottom assay plates already containing cells cultured for overnight. Assay wells already contained 40 µL of 1% serum containing cell culture medium, and the addition of 10 µL of same media to all wells, except positive control wells, helped to achieve a final 1:200 dilution of 2 mM compound stock, to achieve a final concentration of 10 µM in the wells. This one-step dilution reduced the risk of compound precipitation and kept the final DMSO concentration in the assay at 0.5%. At the same time, the positive control MG132 was solubilized at 20 mM in 100% DMSO and was diluted to an intermediate concentration of 100 µM in media with 1% serum. Ten microliters of that dilution was added to control wells to achieve a final concentration of 20 µM (0.5% DMSO) in the assay plate wells. The intermediate dilutions were prepared fresh before each experiment.
Establishing Cell Lines That Stably Express Leptin Receptor
HEK293 (ATCC, Manassas, VA) cells were transfected using FuGENE HD (Roche, Basel, Switzerland) with a DNA construct encoding the leptin receptor (OBR) fused to a Myc tag at the extracellular N-terminal end and an improved version of the Yellow Fluorescent Protein (Ypet) at the intracellular C-terminal end. 16 The cells were divided at 1:10 dilution 48 h after transfection and further incubated in medium containing 500 µg/mL of neomycin derivative G418 (Invitrogen) before individual colonies were picked and expanded into cell lines.
Leptin Binding Assay
OBR cell surface expression was quantified with the leptin–secreted alkaline phosphatase (SEAP) binding assay. 17 Adherent HEK293 cells stably expressing Myc-OBRa-Ypet were plated in a 96-well plate at a density of 40,000 cells/well the day before the assay. On the day of assay, cells were incubated with leptin-SEAP in 50 µL of DMEM culture medium supplemented with 0.5% bovine serum albumin (BSA) for 2 h at 4 °C to avoid receptor internalization. Nonspecific binding was determined by adding a large excess (500 nM) of unlabeled leptin (not fused to SEAP). After four washing steps with DMEM supplemented with 0.5% BSA and phosphate buffered saline (PBS), endogenous alkaline phosphatases were inactivated at 65 °C for 30 min, and secreted alkaline phosphatase activity was measured using the CSPD substrate method (PhosphaLight, Tropix) in a luminescence plate reader (F500, Tecan). Total receptor expression was quantified by measuring the fluorescence of myc-OBRa-Ypet in a lumino/fluorometer plate reader (Fusion; PerkinElmer, Waltham, MA).
OBR-Phenotypic Assay
Cellular clones were cultured in DMEM media supplemented 10% FBS, 1% penicillin streptomycin, and 200 µg/mL geneticin (G418). The day before assay, cells were harvested and plated at 20,000 cells/well in 40 µL of 1% serum containing cell culture medium using a Matrix WellMate into assay plates. Ten microliters of 100 µM MG132 (2.5% DMSO) was added to cells in wells to achieve 20 µM final concentration of positive control with 0.5% DMSO and 0.5% DMSO as a negative control. After incubation with control compounds for 4 h at 37 °C, 5% CO2, cells were fixed using 50 µL of 4% formalin solution for 15 min at 4 °C. After fixation, plates were washed three times with 50 µL PBS, and 40 µL of primary antibody (1:300, 0.6 µg/mL of mouse anti-Myc antibodies [9E10; Santa Cruz Biotechnology, Santa Cruz, CA]) containing 2% BSA was added and incubated overnight at 4 °C. After washing the primary antibody three times with 50 µL of PBS, 40 µL of secondary antibody (1:5,002 µg/mL Alexa Fluor 647 goat anti-mouse IgG [Invitrogen]) containing 2% BSA was added and incubated for 2 h at room temperature. The assay plates were washed three times using PBS, and 1 µM DAPI solution was added for nuclei staining. Confocal images of the cells in wells were acquired on an automated fluorescent confocal plate reader (PerkinElmer Opera) using 20× air-objective (NA 0.70), 405, 488 nm, 635 nm lasers and 405/488/635 dichroic mirror. Four fields were recorded for each well to acquire a statistically significant number of cells.
Image and Data Analysis
Four image fields were acquired for each well and saved as 16-bit TIFF files written directly to an external database. Images were read from the database for analysis using software designed in house for this purpose (IM, IPK; Fig. 1C ). Described briefly, the algorithm first was localizing and segregating all nuclei in the DAPI channel (405 nm excitation), masking them and counting as cells. Because c-Myc-ORB-Ypet was overexpressed in those cells, the Ypet signal (in YFP channel) was strong through the whole cell, including cytoplasm and membrane. That feature allowed us to use the YFP channel to extent nuclei mask, to outline the cytoplasm associated with each nuclei (cell; Fig. 1D(i) ) The edge of that mask was defined as a cellular membrane ring with constant thickness through the whole cell and for all cells ( Fig. 1D(ii) ). To avoid contamination of that area with the signal coming from the membrane ring, we separated those two masks by one pixel ring ( Fig. 1D(iv) ). The final algorithm allowed us to separate the signal from the membrane area and from the inner cytoplasm area. The OBR construct also included a c-Myc epitope that was used to quantify the amount of OBR located at the cell by performing immunostaining with Alexa-653 fluorophore-labeled secondary antibodies ( Fig 1A ). This Alexa-653 signal was analyzed in the membrane ring mask. All together, the algorithm was collecting measurements of the average intensity per pixel per cell in the image fields and generated multiple parameters that were used for imaging analysis, including total amount of cells (nuclei) per image, membrane ring of Ypet signal, membrane ring of Alexa-653 signal, and Ypet signal of the cytoplasmic area. Data collected from four fields for each well was averaged. We used the average intensity of the membrane ring Alexa-653 signal to measure the change in cell surface localization of OBR and the average intensity of the cytoplasm area of the Ypet signal to determine the changes in total OBR expression in cells.
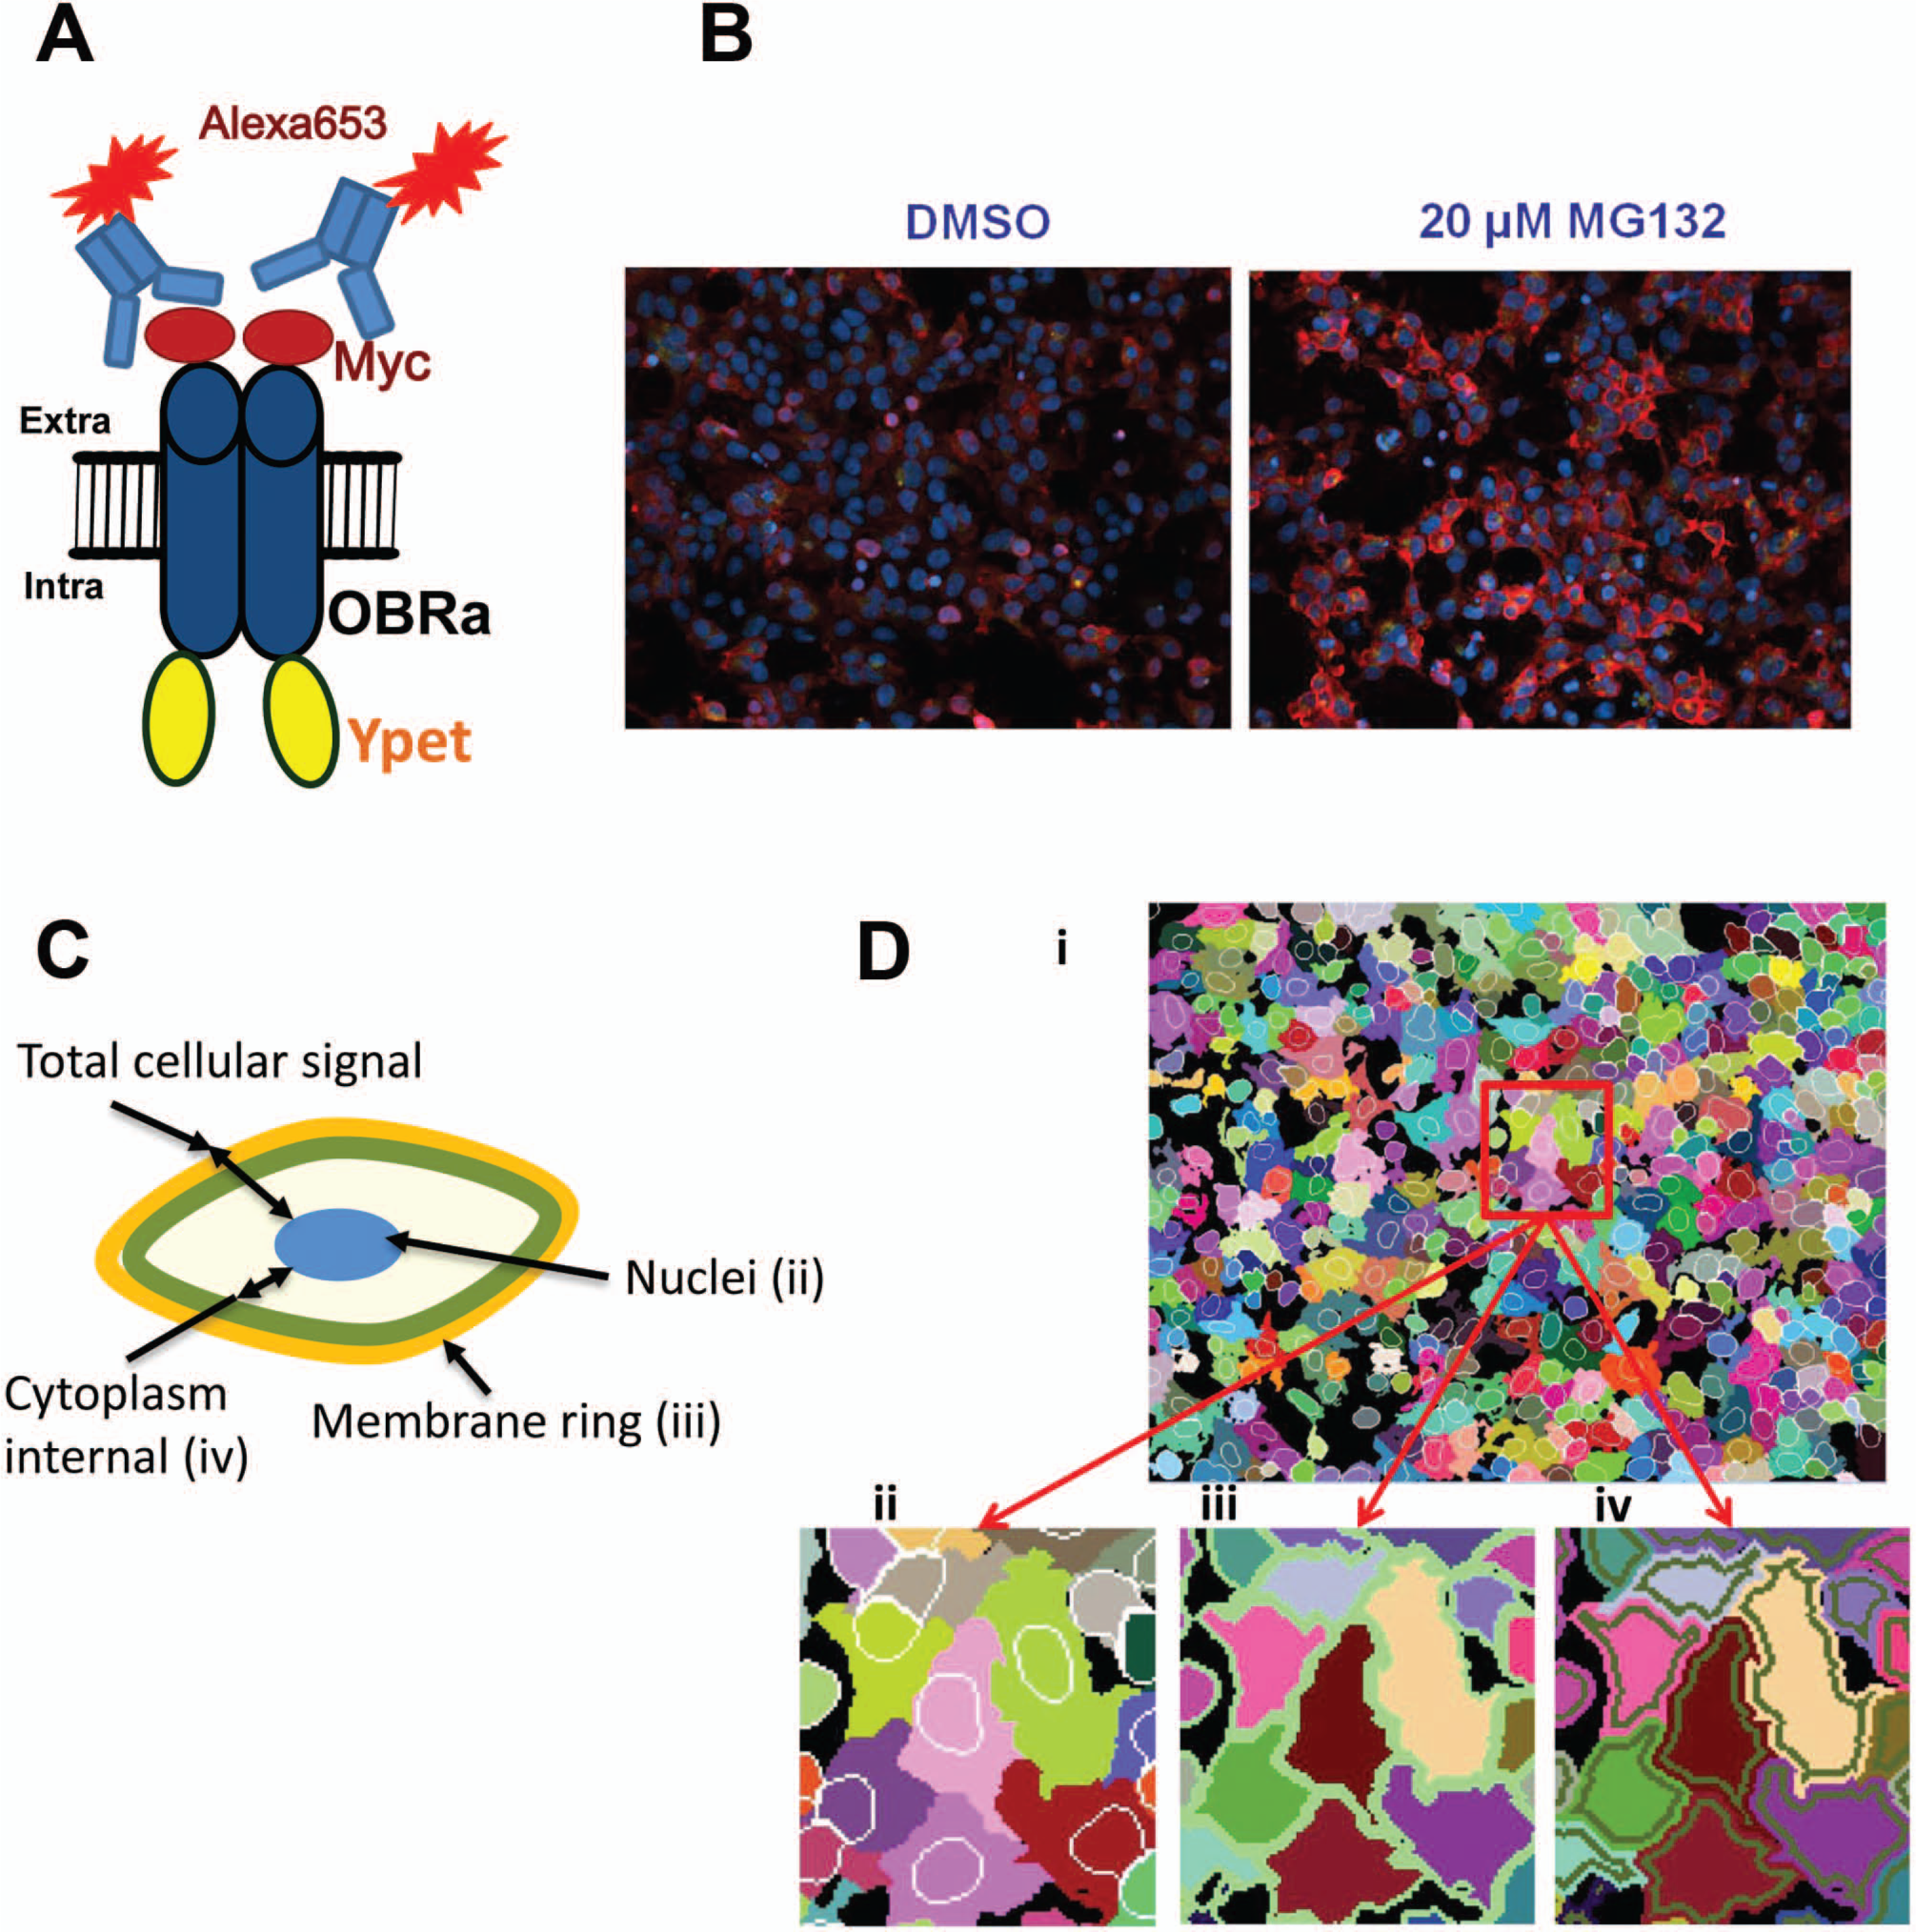
Phenotypic OBR assay. (
Phenotypic High-Throughput Screening
A total of 50,000 compounds were tested in the screening campaign. HEK293 clone B5 cells were plated using a Matrix WellMate into assay plates as described in the “Leptin Binding Assay” section. After 1 day of incubation at 37 °C, 5% CO2, assay plates were treated with compounds, and 10 µL of 1% serum containing cell culture medium was added using a Matrix WellMate. A total of 20 µM MG132 (0.5% DMSO) was used as positive and 0.5% DMSO as negative controls, and each was dispensed into 16 wells on every sample plate. Assay plates were incubated for 4 h at 37 °C, 5% CO2. The immunostaining with anti-Myc antibodies and nuclei staining with DAPI were carried as described in the “OBR-Phenotypic Assay” section. Confocal images of the cells in wells were acquired on an automated fluorescent confocal plate reader Opera integrated in a fully automated platform (Perkin Elmer Cell::explorer). The multiparametric data were collected from images for each well and transferred into IDBS/AB for analysis. The intensity of the Alexa-653 signal in the membrane ring was converted into percentage of activity: % Activity (sample) = (Sample Intensity – Average Intensity DMSO control)/(Average Intensity Positive Control – Average Intensity DMSO Control). The consistency of Z′ values 18 was used as a quality control criterion for the assay validation and screening campaign. Screening data collected from image analysis software were analyzed using IDBS/AB and Spotfire for visualization of data points in scatter plots.
Because MG132 is a nonphysiological positive control with an average increase of OBR cell surface expression of about 1.5-fold, the hit selection was done using the cutoff that allowed us to select the most significant hits with a percentage of activity similar or higher than MG132, which was greater than 4SD + median average intensity (samples) ≅ 70% activity for both runs.
Hit Confirmation within OBR-Phenotypic Assay
To confirm obtained hits, each selected compound was tested in a 10-point dose-response curve with twofold step serial dilution (from 20 µM to 39 nM) in duplicate using the same immunostaining imaging assay as for the primary screening.
Functional Hit Characterization
Western Blot Analysis of Leptin Signaling
HEK293 cells stably expressing OBRb were starved in DMEM without serum for 16 h and pretreated with each compound (5 µM) or DMSO (as a control) for 4 h, stimulated for 30 min at 37 °C with 1 or 2 nM of leptin (Protein Laboratories Rehovot [PLR], Rehovot, Israel), and lysed in Laemmli buffer supplemented with antiphosphatase inhibitors (2 mM orthovanadate and 10 mM NaF) and DTT (30 mM). Cell lysates were separated by sodium dodecyl sulfate–polyacrylamide gel electrophoresis (SDS-PAGE), transferred to nitrocellulose membranes, and immunoblotted with antiphosphotyrosine (Tyr-705) STAT3, anti-STAT3 (Cell Signaling, Beverly, MA), and antiphosphotyrosine (Tyr-1007-1008) JAK2 (Millipore, Billerica, MA) antibodies. Western blots were scanned on the Odyssey infrared imaging system (LI-COR, Lincoln, NE) and densitometry analyzed with ImageJ. At least three experiments were performed independently to evaluate the effect of the compounds on the leptin-regulated JAK2/STAT3 pathway. The percentage of increase or decrease of leptin-induced JAK2 and STAT3 phosphorylation was calculated after normalization with DMSO pretreatment; the mean percentage is calculated with at least three independent experiments and provided with the standard error of the mean (SEM).
Homogenous Time-Resolved Fluorescence (HTRF)–Based STAT3 Signaling Assay
The assay was carried out on adherent HEK293 cells stably expressing OBRb in a 96-well plate at a density of 100,000 cells/well. STAT3 phosphorylation was measured using the phospho-STAT3 HTRF kit (Cisbio Bioassays Ref. 62AT3PEG) according to the manufacturer’s instructions. Briefly, 16 h starved cells, pretreated with the compounds (5 µM) for 4 h, were stimulated for 30 min at 37 °C with 1 to 2 nM of leptin and lysed in 50 µL of lysis buffer (included in the kit) supplemented with antiphosphatase inhibitors. An anti-STAT3 antibody labeled with Tb (2 µL) and an antiphospho-STAT3 antibody labeled with d2 (2 µL) were added to 16 µL of cell lysate in a 384-well plate. The reaction was incubated for 24 h at room temperature. Signals at 665 and 620 nm were detected using a F500 Tecan fluorescence reader.
Results
Establishment of the OBR-Expressing Clones for Phenotypic Screening
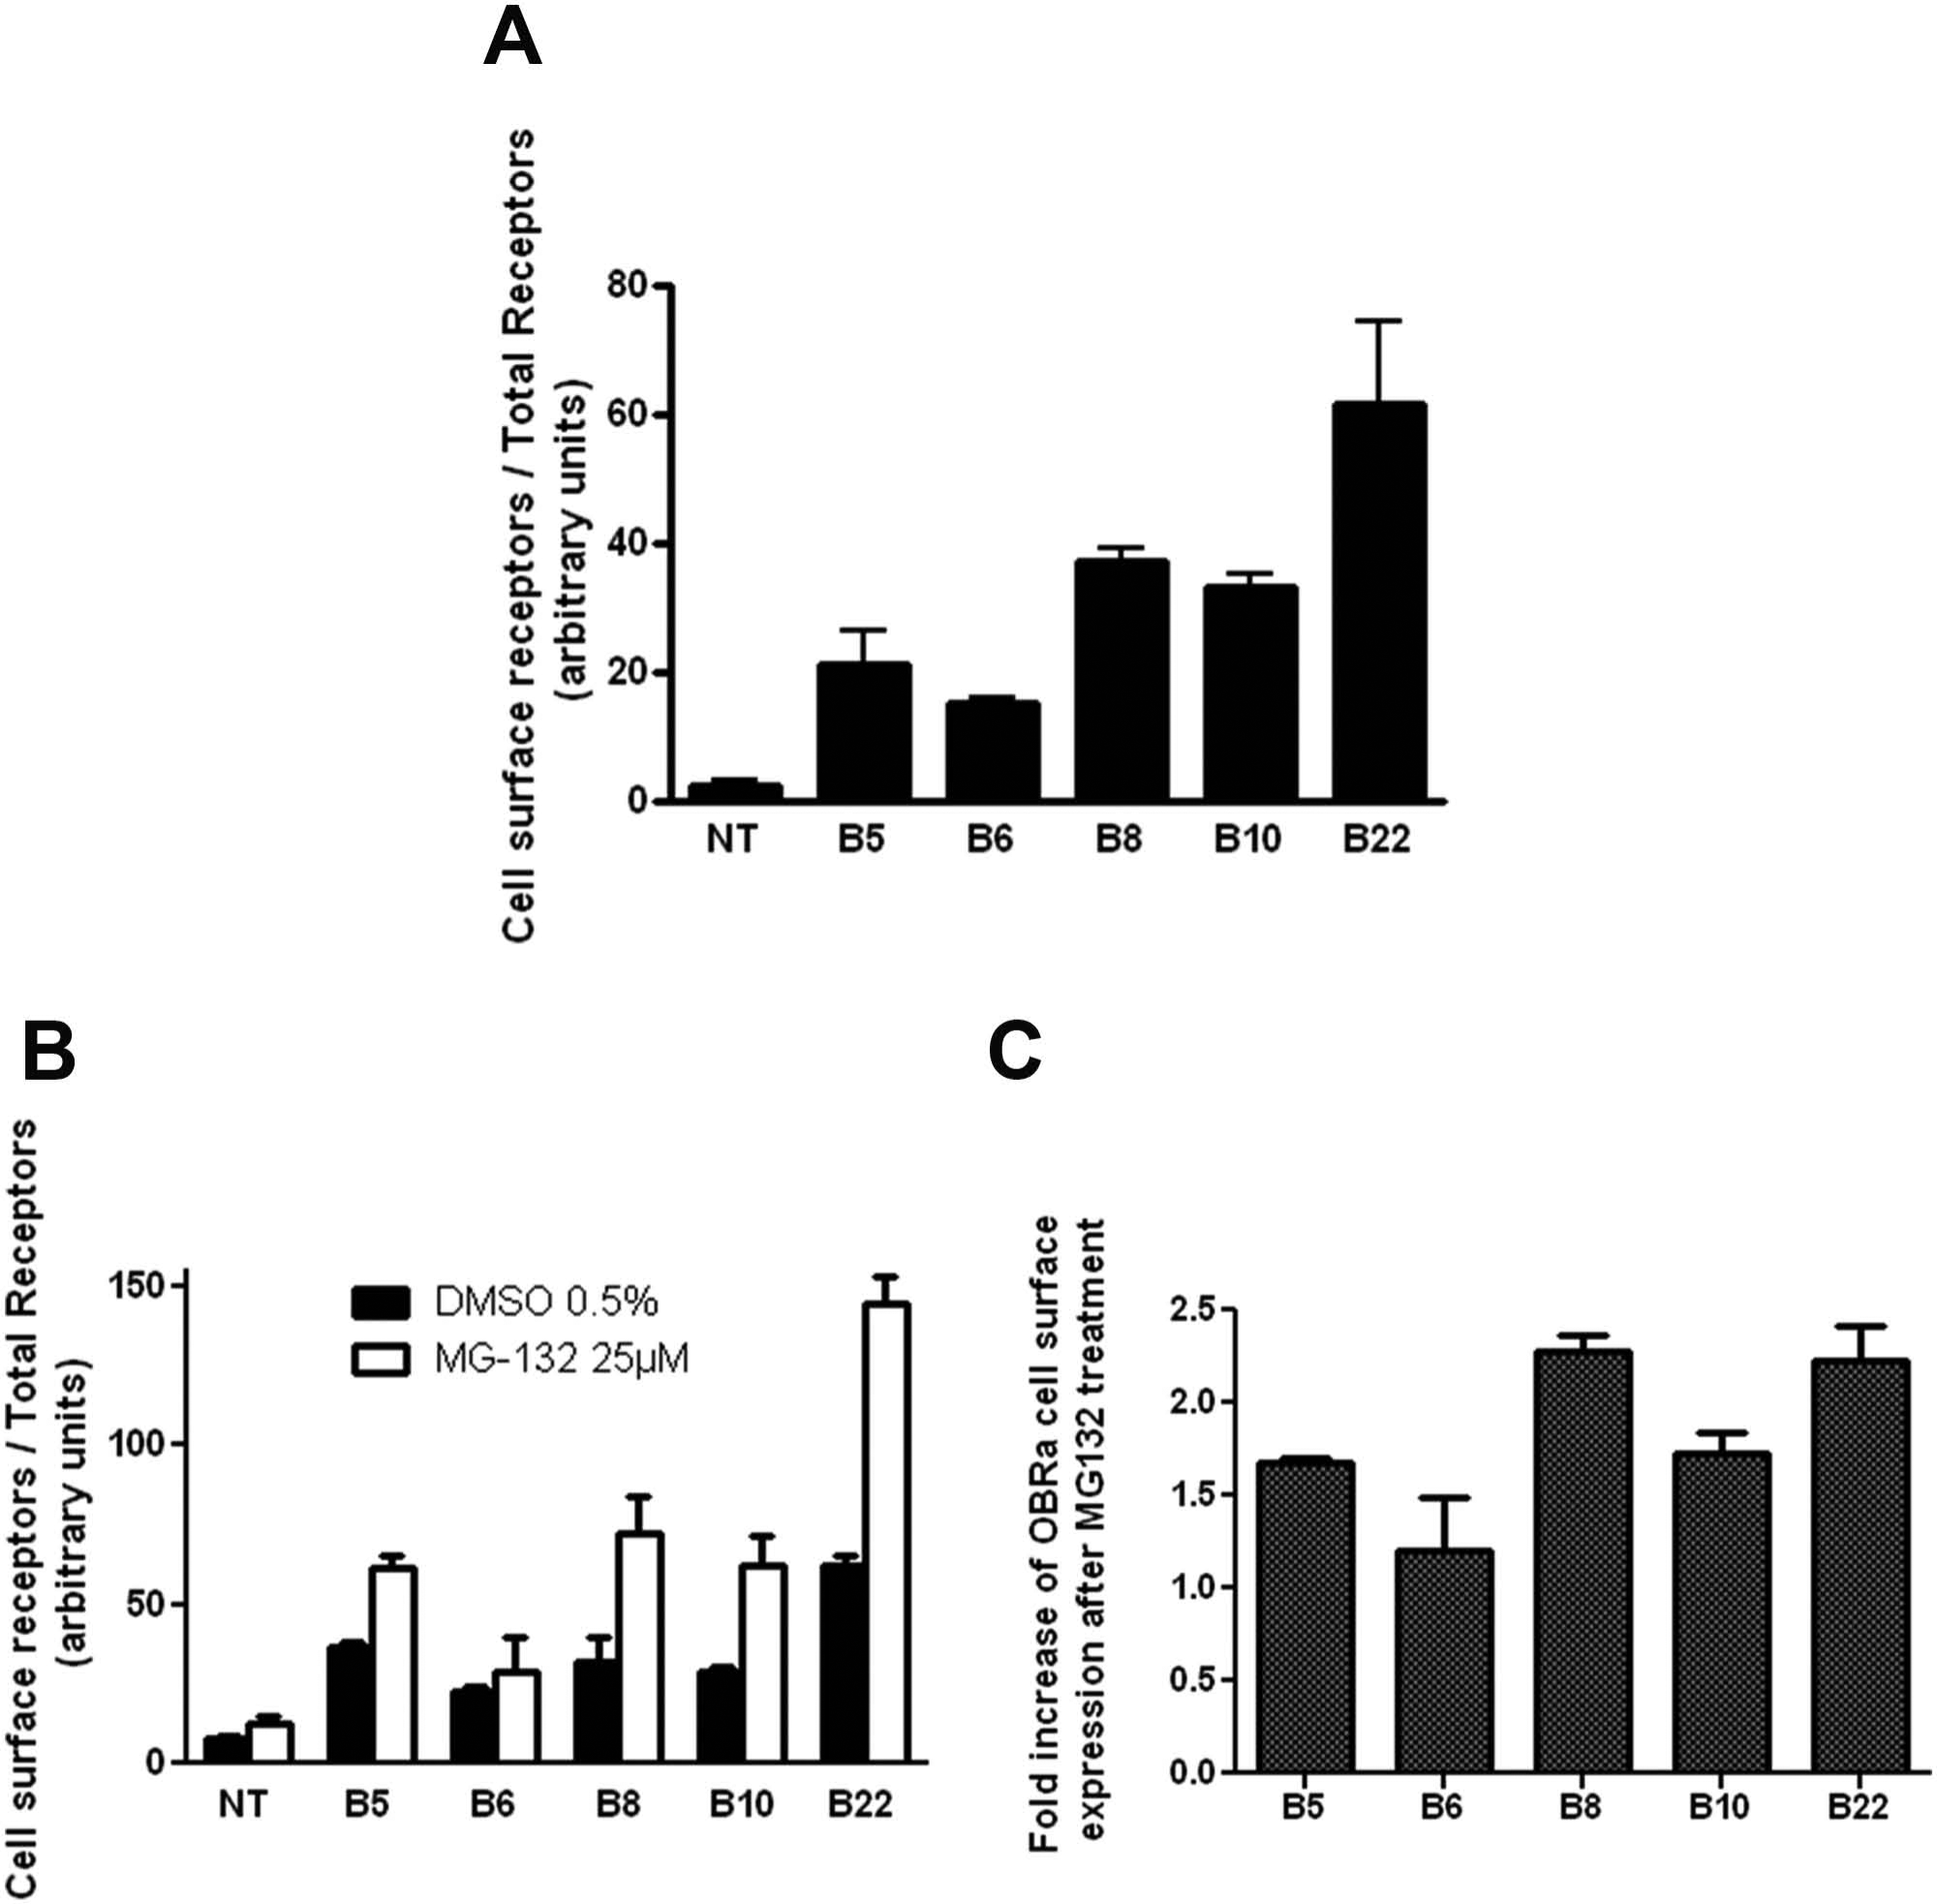
To identify small-molecular-weight compounds that would increase OBR cell surface expression, we built up a phenotypic assay that allows the analysis of OBR localization in cultured cells by microscopy imaging. We chose the short OBRa isoform in our assays, as this isoform has an identical binding affinity for leptin and similar trafficking properties 19 as the long OBRb isoform but is better expressed in cells than OBRb and thus more suitable for microscopic analysis. OBRa was flanked by a c-Myc epitope tag at the NH2 terminus and fused at its COOH terminus with Ypet, a bright monomeric form of the yellow fluorescent protein emitting fluorescence at 527 nm ( Fig. 1A ). 16 Staining of the extracellular Myc-tag with fluorescently labeled antibodies allows the quantification of the cell surface–exposed OBR pool, whereas the Ypet fluorescence signal allows the quantification of total OBR expressed in the cell, including the major intracellular pool. Ten HEK293 cell clones stably expressing the c-Myc-OBRa-Ypet construct were generated providing a large range of different OBR expression levels as determined by Western blot in total cell lysates with anti-Myc antibodies (data not shown). At this stage, five clones were eliminated from further studies because of low growth, fragility, or bad recovery from cell thawing. The remaining five clones were submitted to a preliminary microscopic immunofluorescence analysis for detecting OBR expression at the surface of nonpermeabilized cells with anti-Myc antibodies and total OBR by measuring Ypet fluorescence. All clones proved suitable for microscopic measurements showing that the majority of OBR is localized in intracellular compartments (Ypet signal) as expected, and a small fraction at the plasma membrane was labeled with anti-Myc antibodies (data not shown). To confirm that the weak cell surface staining observed in the five remaining clones corresponds to OBR, we used an alternative approach, the leptin-SEAP assay, which quantifies the amount of ligand-binding competent OBR at the surface. Clones were labeled with leptin-SEAP at 4 °C (to prevent receptor internalization), and OBR surface expression was quantified by adding a luminescent SEAP substrate. The total amount of OBR present in the cell was determined by measuring Ypet fluorescence, and the relative OBRsurface/OBRtotal ratio was calculated ( Fig. 2A ). The assay reliably confirmed the expression of functional OBR at the cell surface and revealed variations of about threefold in relative OBRsurface/OBRtotal ratios between clones.
Characterization c-Myc-OBRa-Ypet expressing clones. Cell surface expression of OBR was determined by measuring leptin–secreted alkaline phosphatase binding to intact HEK293 cells and total OBR expression by measuring Ypet fluorescence. (
Later, we used the same assay to monitor an increase in OBR cell surface expression in the selected clones after treatment with chemical compounds. In the absence of any OBR-specific positive control, we chose the proteasome inhibitor MG132 to increase OBR cell surface expression by inhibiting constitutive receptor endocytosis. Treatment of cells with MG132 most likely reduces free ubiquitin or stabilizes negative regulators of the ubiquitin ligase, two proteins necessary for receptor endocytosis. 20 As expected, MG132 pretreatment was able to increase the amount of OBR at the cell surface in all clones by a factor of 1.2 to 2.3 ( Fig. 2B , C ). Clone B5, showing the highest reproducibility, and clone B22, showing the highest increase, were selected for further optimization.
We then attempted to monitor the MG132-mediated increase of OBR cell surface expression with the phenotypic imaging–based screening assay. The analysis of the images was done as described in the “Materials and Methods” section. Table 1 summarizes the induction of the anti-Myc antibody-associated signals in cell membranes and total OBR expression detected by the Ypet (YFP) signal in wells treated with MG132 in comparison with DMSO-treated controls. Clone B5 shows an increase in the membrane Alexa-653 signal of 1.66- ± 0.15-fold with a coefficient of variation (CV) of 9.9% There was no significant change in total OBR expression, as detected by cytoplasmic YFP signal. Clone B22 showed a 1.47 ± 0.15 fold increase in the membrane Alexa-653 signal, with CV = 10% and also no significant change in the total OBR expression.
Characterization of clones B5 and B22 by using an OBR-associated signal in phenotypic assay.
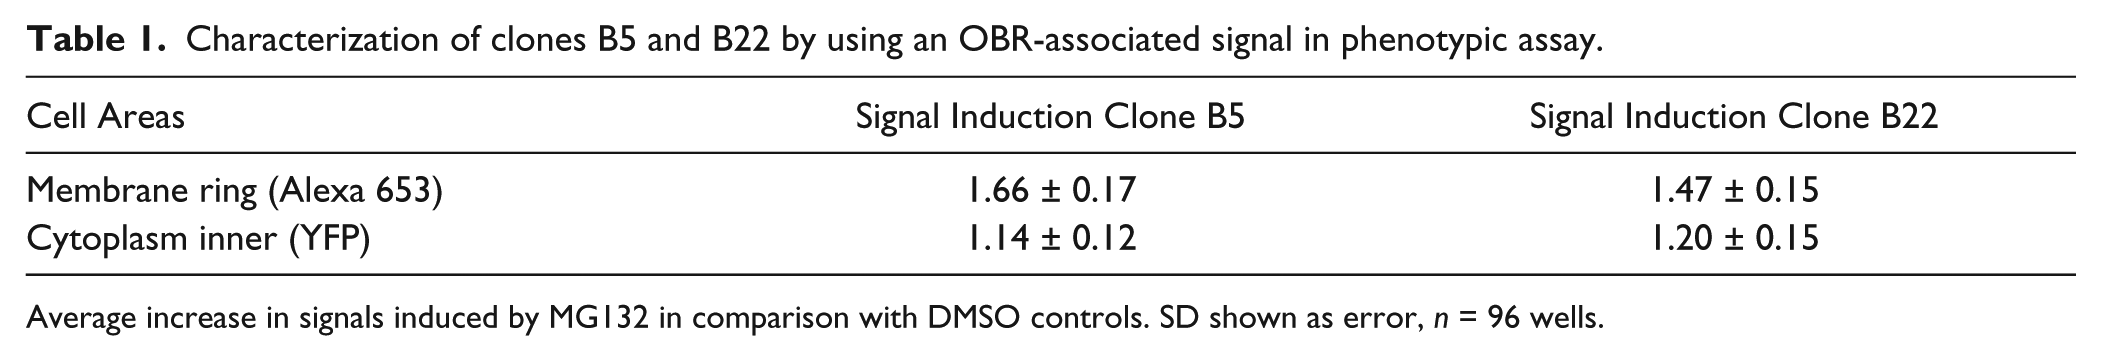
Average increase in signals induced by MG132 in comparison with DMSO controls. SD shown as error, n = 96 wells.
For clone B5, the measured MG132-induced increase of OBR cell surface expression was comparable in both assays, leptin-SEAP binding and image-based assay. This clone also showed a lower variability in both assays with a CV of about 10%. For clone B22, MG132-induced changes were more variable (1.5- vs 2.3-fold), and CV values were also higher (>15%). Thus, clone B5 was selected for the phenotypic assay validation and PhenomicScreen.
Results of PhenomicScreen
IPK created and uses a PhenomicScreen technology that allows for the visual measurement of various phenotypes within living cells. An image-based analysis of immunostaining signal associated with Myc-tagged OBR in cells was used as a phenotypic assay for OBR membrane localization. We were concerned about the relatively small assay window ~1.5- to 2-fold induced by MG132, which might result in low robustness of the developed screening assay. To ensure the best assay performance, we optimized different steps of the assay protocol such as the cell density for plating, the time and conditions of MG132 treatment, different type of fixation of cells for immunostaining, and so forth. The final protocol was validated in two independent experiments with batches of 11 plates. A total of 280 data points were acquired and analyzed for positive and negative controls on each plate. The Z′ value was calculated as 0.25 and 0.3 and was considered as the low end for the acceptance of a screening assay. However, the correlation of the data, R2 = 0.95, confirmed previously observed reliability of results. The other 320 wells on each plate were treated with DMSO to observe variability of the background signal through the plate. No significant variability or other artificial effects were detected during validation runs (data not shown). To ensure the best outcome of the screening, we decided to perform the campaign with a small number of compounds (50,000) but tested in two replicates. Screening was done in 384-well format. As illustrated in Figure 3A , the screening campaigns showed very similar overall quality to the validation runs with Z′ = 0.25 and 0.35 for the two independent replicate screens, R2 = 0.90. The cutoff of >70% activity (~mean of samples +4SD) in both replicates was chosen to ensure the selection of the hits with larger chance to be confirmed ( Fig. 3B ). A total of 67 hits (0.13% hit rate) were selected for confirmation. To confirm the activity of the selected compounds, 10-point dose-response curves (DRCs) were performed in duplicate for each compound. Figure 4 shows DRCs for four selected compounds from active clusters, and data are not shown for the rest of tested hits. As was expected due to the robust criteria for hit selection, a very small number of compounds (only three) did not confirm their activity at 10 µM. The DRCs provided not only the active concentration (AC50) but also early indications of toxicity by cell counts (CC50) for the tested compounds. AC50 values typically were in the low micromolar range, and compounds had no significant effect on total OBR expression in the cytosol. The cell number was not significantly affected within the chosen concentration range. Taken together, these results show that we identified positive hits that specifically increased OBR surface expression with low µM AC50 values without observed cellular toxicity.
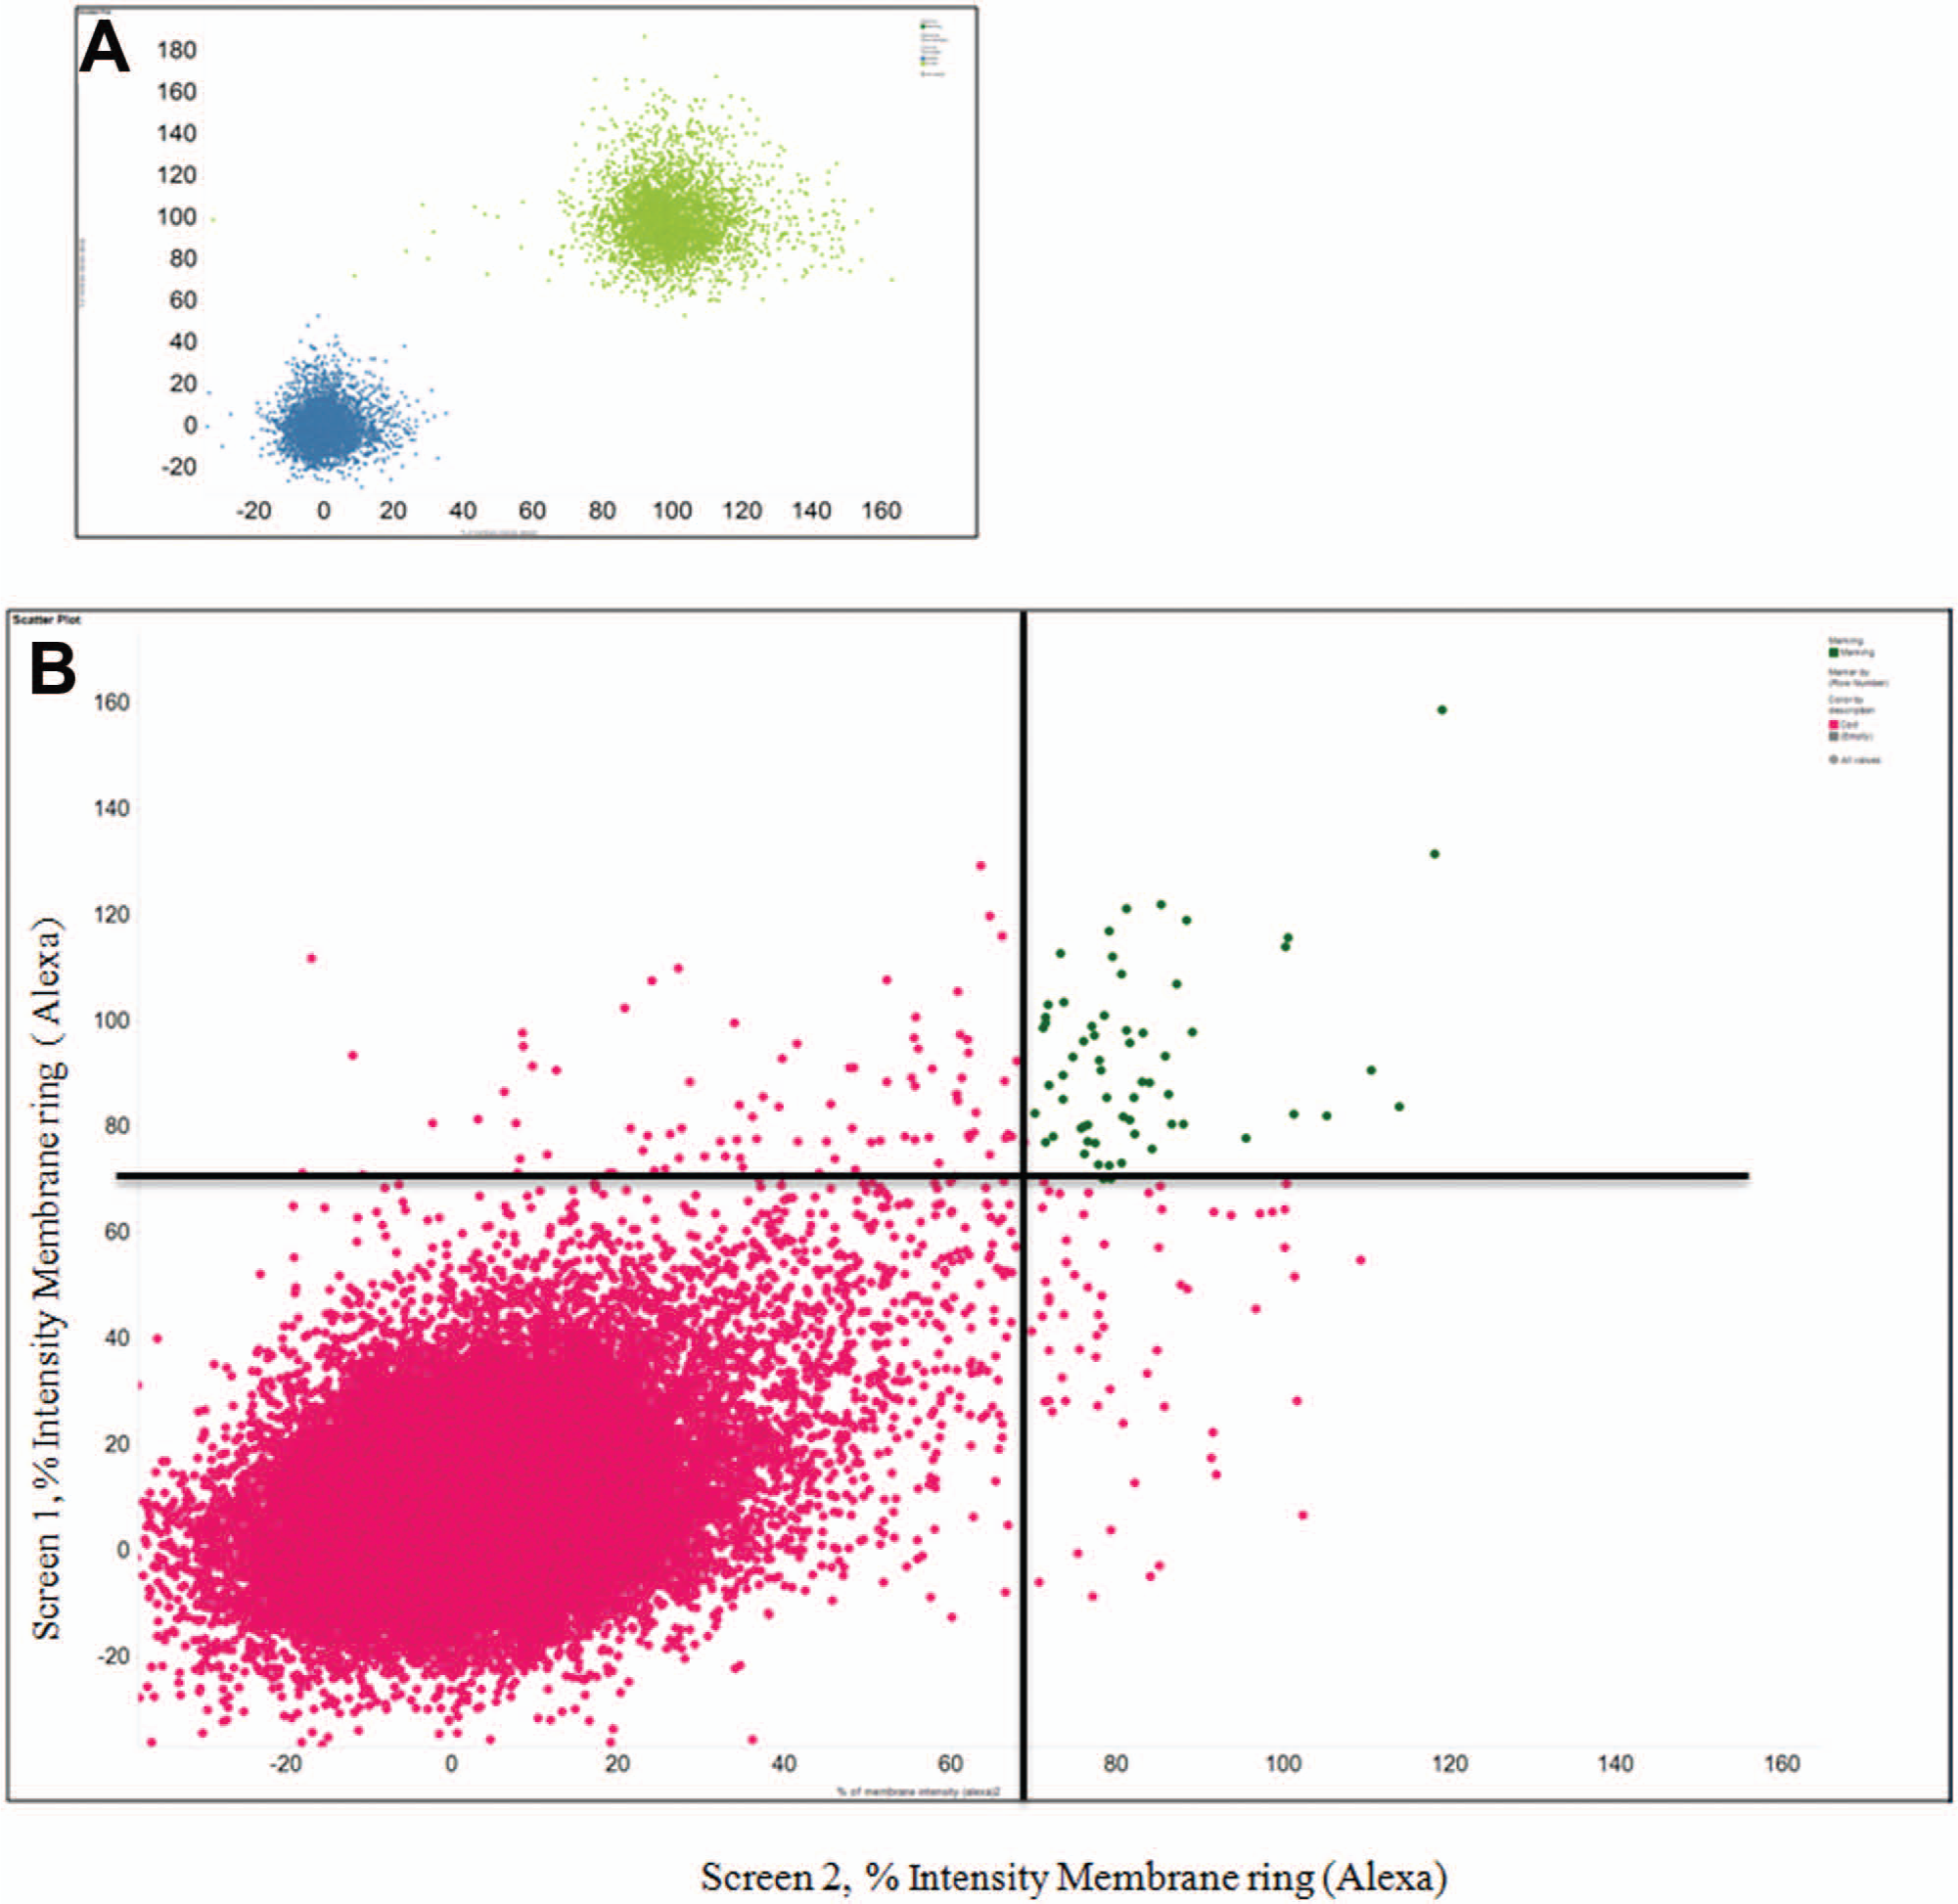
Scatter plot comparison of duplicate high-content screening experiments. (
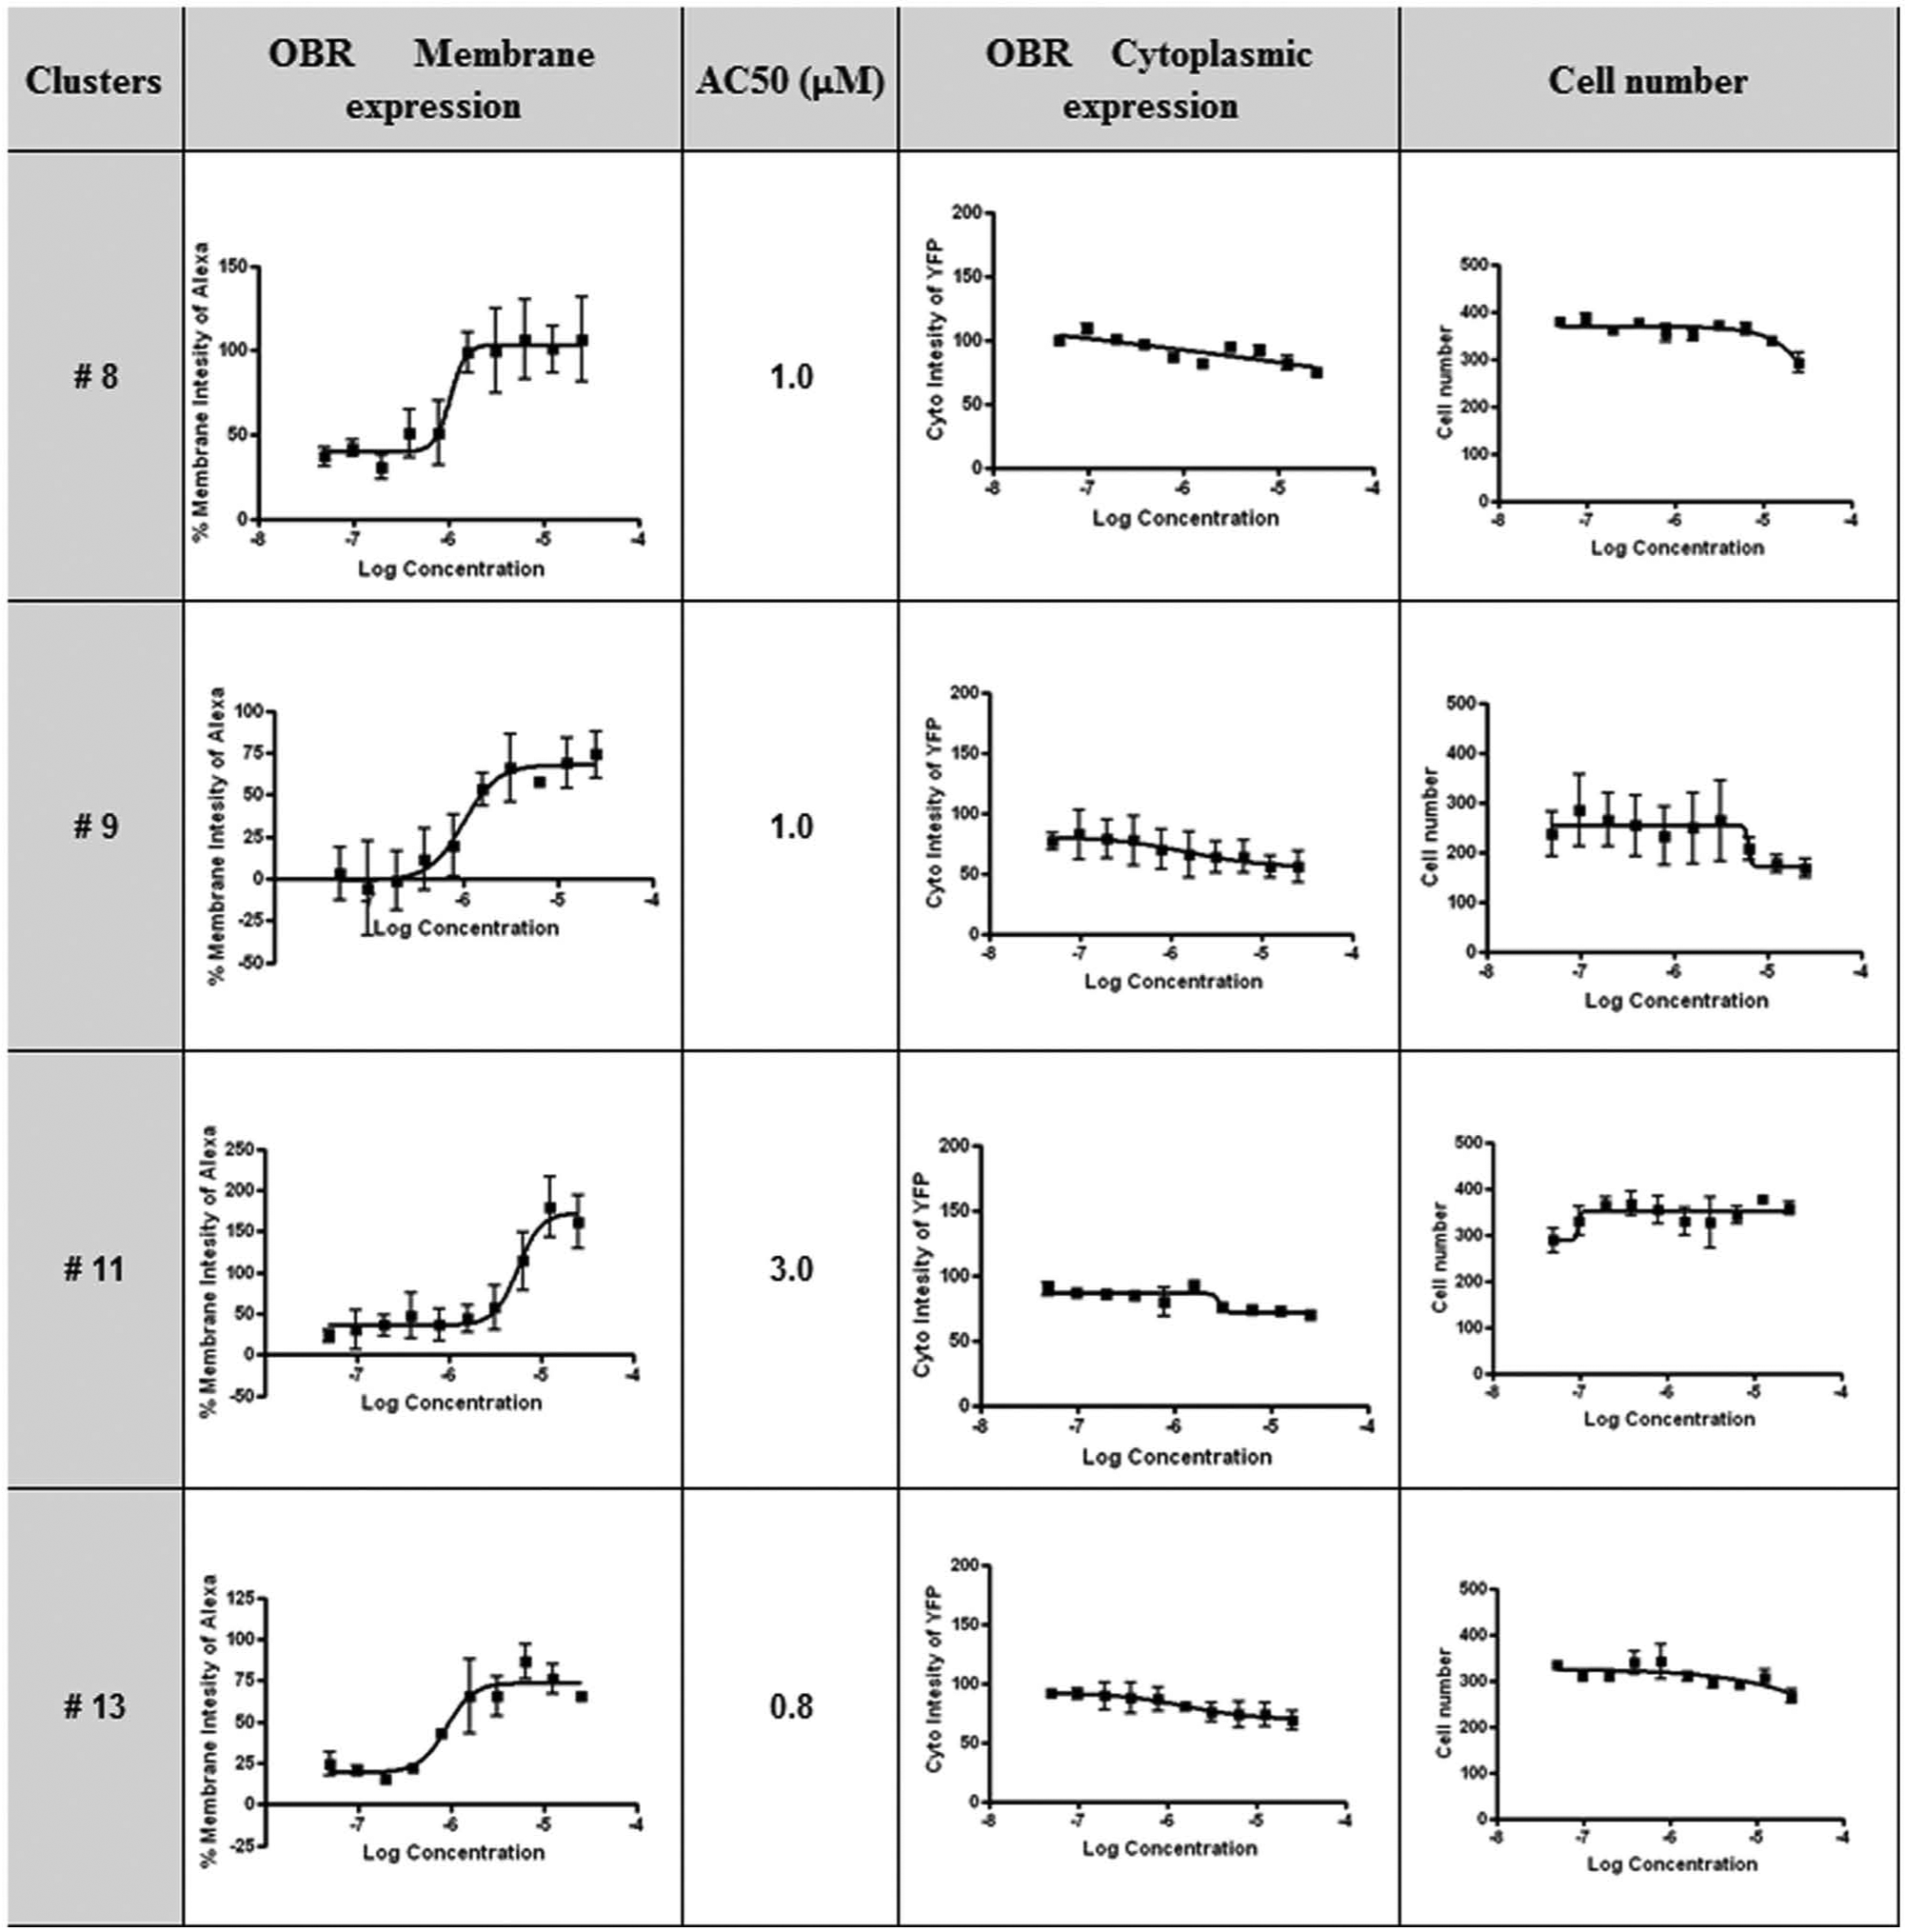
Hit confirmation of selected compounds. Dose-response curves of selected compounds from clusters 8, 9, 11, and 13 for c-Myc-OBRa-Ypet cell surface (Alexa signal) and cytoplasmic expression (Ypet signal) and total cell number of in wells. Data are mean signal ± SD (n = 2).
Characterization of Selected Compounds
Clustering of Active Compounds
All 65 active compounds were clustered based on topological descriptors (ECFP4 and FCFP4).21,22 The clustering results were obtained using PipelinePilot (Accelrys). 23 After clustering, hits were grouped into 16 scaffolds and 16 singletons. The selection of clusters for further studies was based on several parameters, including the correct four-parameter nonlinear fitting of DRC curves, the higher potency of AC50 values in clusters, and the absence of an observed cytotoxic effect at high concentrations. One representative compound from each of the 10 selected clusters, two compounds from cluster 1, and three singletons were reordered from the compound supplier for confirmation in the phenotypic assay and characterization in secondary assays ( Table 2 ).
Characterization of hits in secondary functional assays.
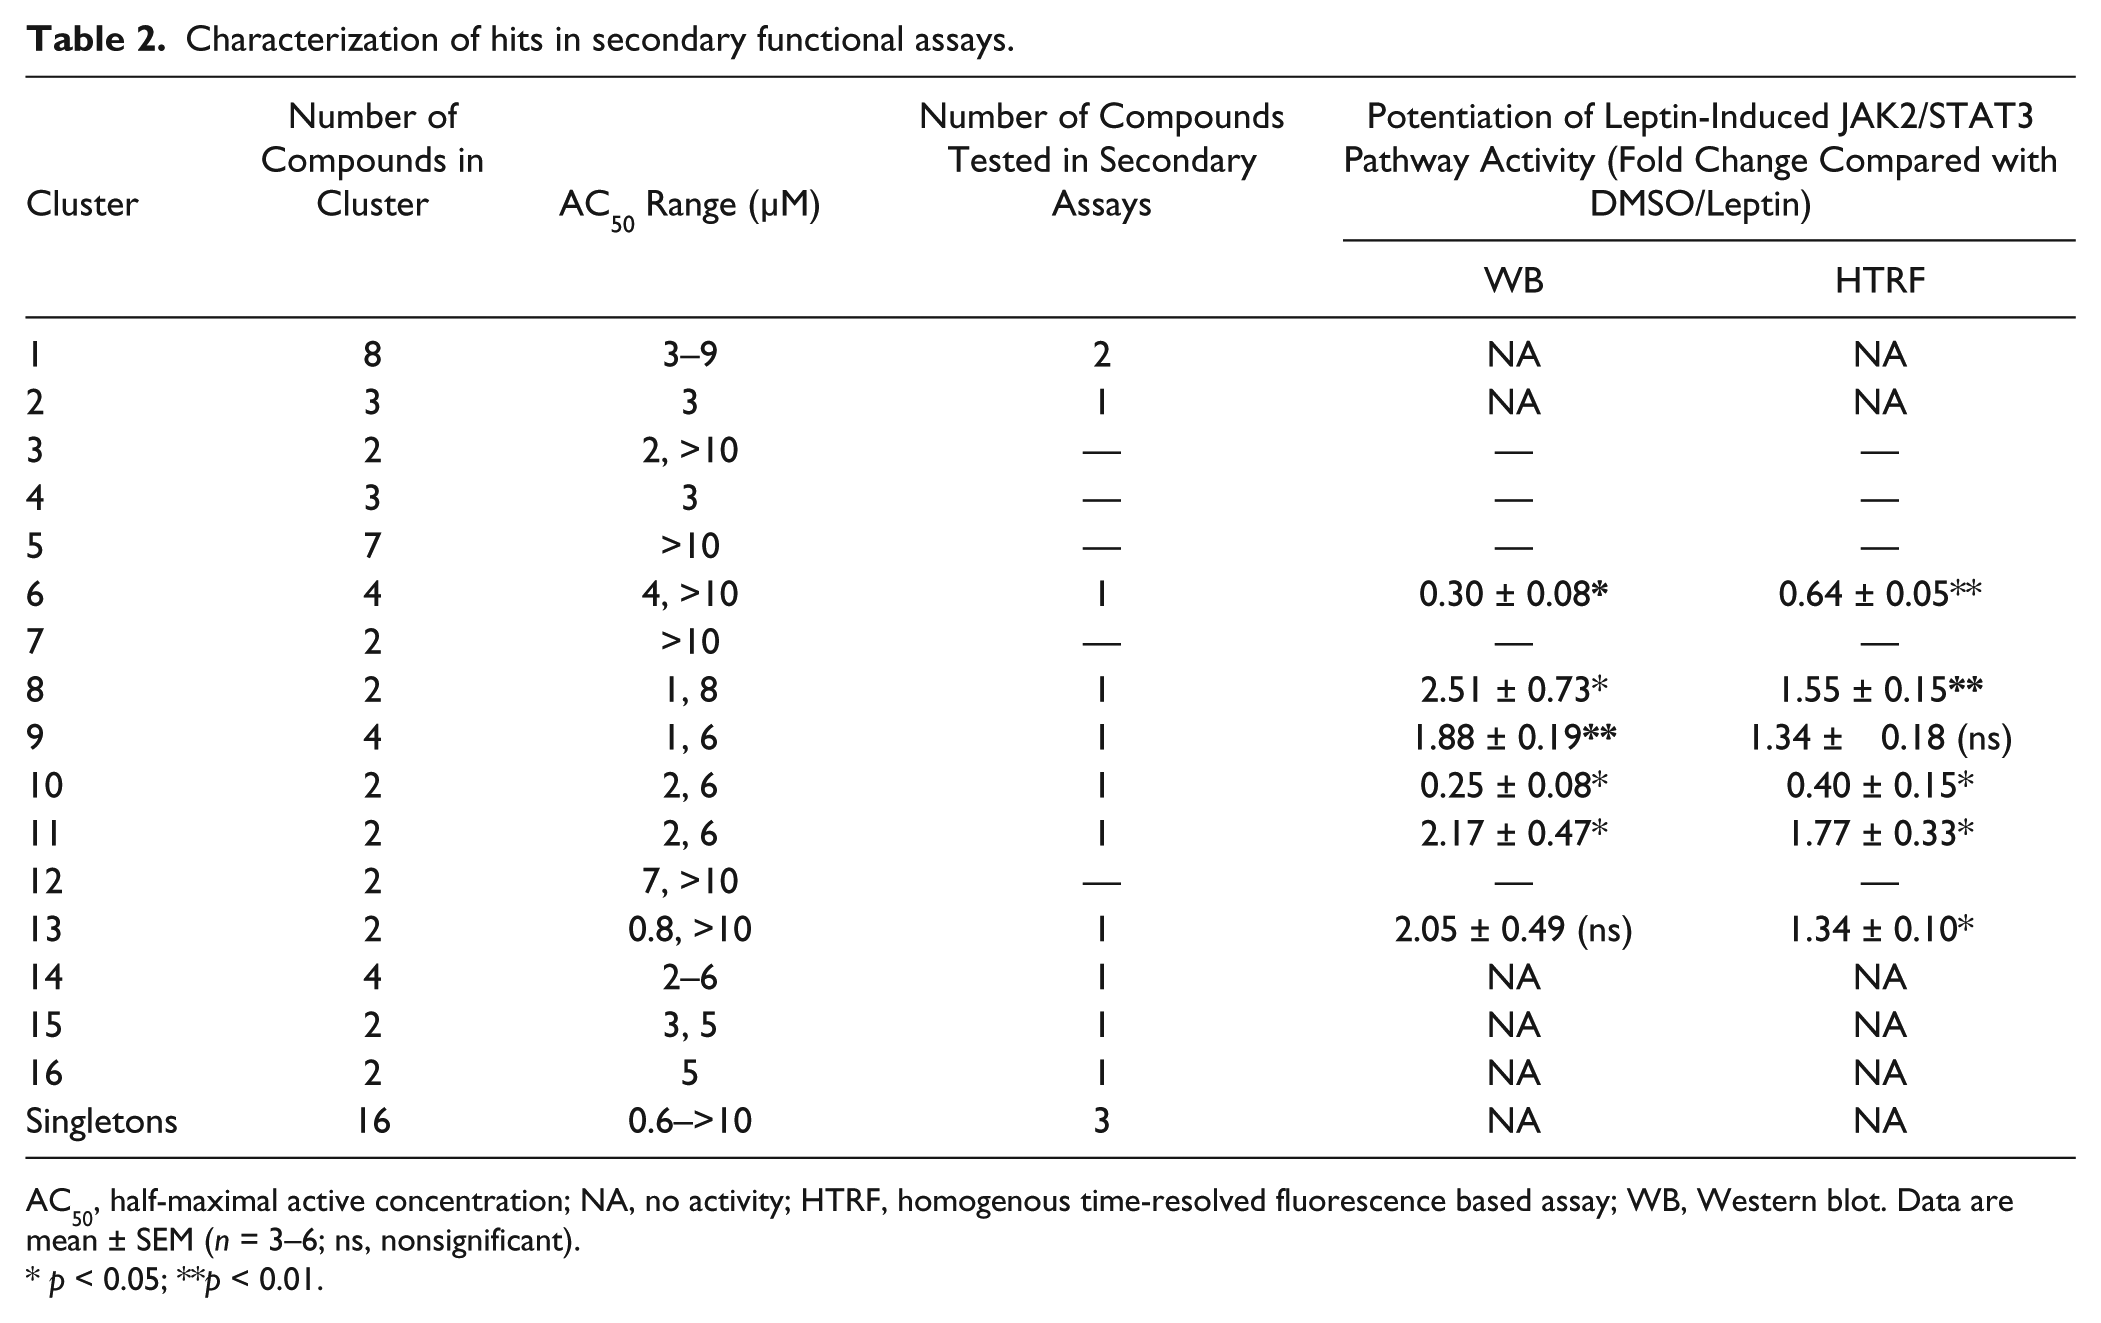
AC50, half-maximal active concentration; NA, no activity; HTRF, homogenous time-resolved fluorescence based assay; WB, Western blot. Data are mean ± SEM (n = 3–6; ns, nonsignificant).
p < 0.05; **p < 0.01.
Functional Characterization of Selected Hits
Based on previous observations, we anticipated that the increase in OBR cell surface exposure induced by the compounds would increase leptin signaling. 10 Selected compounds were tested in secondary functional assays to assess their capacity to increase leptin-induced signaling in an HEK293 cell line stably expressing the long OBRb isoform. Leptin binding to OBRb triggers intracellular signaling through the JAK2/STAT3 pathway. These events can be reliably monitored with antibodies directed against P-JAK2 and P-STAT3.
We used two functional assays in parallel (Western blot, HTRF) to assess the effect of a 4 h pretreatment with the selected compounds (5 µM) on JAK2 and STAT3 phosphorylation upon stimulation with suboptimal concentration of leptin for 30 min (
Discussion
Design of PhenomicScreen to Monitor Increased OBR Cell Surface Expression
Phenotypic approaches for small-molecular-weight compound-screening assays have become more popular in recent years in drug discovery as an alternative strategy to target-based approaches. 15 This approach is particularly powerful because of its ability to target any protein and nonprotein cellular components involved in the selected phenotype. The goal of this work was to identify compounds that would increase the expression of OBR at the cellular membrane and increase the responsiveness of the cells to leptin. Typically, only 5% to 20% of OBR are translocated to the cellular surface. Apart from endospanin 1 that retains OBR in intracellular compartments,10,12 the mechanism involved in receptor redistribution, in particular to the plasma membrane, is still poorly known. Importantly, it was shown previously that even a twofold increase of the presence of OBR on the cell surface causes significant improvements in cellular signaling and prevention of diet-induced obesity. 10 The fact that the receptor was overexpressed in HEK cells could be considered nonphysiological. However, multiple previous studies overexpressing recombinant OBR in cell lines such as HEK293, HeLa, or COS-7 confirmed that the receptor is still responsive to physiologically relevant regulatory mechanisms and signaling cascades.3,4,10,23 Selection of the best cell line for the primary assay was based on a combination of the characteristics from different tests such as OBR expression levels and reproducible responsiveness toward MG132, a compound that increases the number of OBR exposed at the cell surface. We then optimized the assay conditions with MG132 as positive control. A small but reproducible increase of 1.6-fold in the intensity of the membrane signal was obtained with a very good linear regression of R2 = 0.95 in two replicate experiments. Because the amplitude of the MG132 treatment is only indicative and does not necessarily represent the maximal amplitude of the assay, 24 we decided to move on to the screening campaign with 50,000 compounds. The screening was performed in duplicate to ensure a better chance of selecting true-positive hits. The two screening campaigns showed a very good correlation with R2 = 0.90. We selected 67 hits (or 0.13% of all samples) that had >70% of MG132 activity in both runs. Sixty-four of these hits were subsequently confirmed in full DRCs.
Potentiation of Leptin Response
The goal of secondary functional assays is to filter out all unrelated mechanisms and nonspecific effects. To reduce the number of compounds to be tested in secondary functional assays, we first clustered them by scaffold structures. Of the 16 identified clusters and 16 singletons, we further considered only those clusters with DRCs exhibiting a classic sigmoidal curve fit and AC50 values not exceeding 10 µM (with DRCs starting at 20 µM) and without any effect on total OBR expression. Selected compounds were tested in two secondary assays (Western blotting and HTRF) for their capacity to potentiate leptin-promoted activation of the JAK2/STAT3 signaling pathway in cell expressing OBRb. Because the screening assay was performed with the short OBRa isoform, we anticipated that we would exclude some compounds, which would be specific to OBRb containing an extended intracellular domain. However, OBRa and OBRb display very similar properties, and OBRa is better expressed than OBRb, making it more suitable for imaging analysis. This strategy was shown to be rewarding because four positive hits identified with the OBRa screen were demonstrated to increase OBRb signaling significantly in both secondary assays.
A challenge associated with phenotypic screening is the identification of the target(s) and action mechanism of confirmed hits. 25 Several cellular processes such as protein synthesis, degradation, and trafficking participate in the cell surface expression of membrane receptors. Based on our functional data, selected compounds are unlikely to modulate OBR neosynthesis or degradation because total OBR expression (Ypet signal) was unchanged upon compound treatment. The compounds most likely affect OBR trafficking and by inhibiting OBR endocytosis, activating OBR recycling, or favoring the transport of neosynthesized OBR to the cell surface. Inhibition of proteins participating in general cellular trafficking events may suffer from low specificity. However, the example of endospanin 1 that retains OBR but no other proteins in endosomal compartments illustrates that specific regulators of OBR trafficking exist. 10 A variety of strategies is available for the identification of protein(s) or cellular pathway(s)/process(es) targeted by an active compounds.25,26 One of them is screening a library of siRNA molecules in search for functional genes that are associated with the observed phenotype and could become a target for selected compounds.27,28 Even more challenging is to conduct siRNA in the presence of compounds. 29 Proteins targeted by the siRNA molecules that inhibit or potentiate the compound effect (increased OBR cell surface expression in our case) are likely components of the pathway(s)/process(es) targeted by the compound.
Several other issues have to be addressed in future studies. Preliminary patent analysis has been performed on the four selected scaffolds, and currently there is freedom to operate on all of them. Next, optimization of the chemical structures has to be performed to improve the cellular activity. Optimized compounds would then have to be tested in vivo to determine their toxicity in mice and their therapeutic potential to prevent obesity development in the well-established mouse model of diet-induced obesity that is accompanied with the development of cellular leptin resistance.
Taken together, we set up a phenotypic imaging-based screening assay that allowed us to identify four promising chemical clusters with high therapeutic potential in obesity treatment by improving the deleterious state of leptin resistance observed in most obese people.
Footnotes
Acknowledgements
We would like to acknowledge Lisa Cechetto, Dr. Gary Sweeney from IPK, and Dr. Yongmun Choi from GyeongGi Bio-Center for their help with the coordination of the work on this project. We thank Dr. J. Tavernier (University of Gent, Belgium) for providing the leptin-SEAP.
Declaration of Conflicting Interests
The authors declared no potential conflicts of interest with respect to the research, authorship, and/or publication of this article.
Funding
The authors disclosed receipt of the following financial support for the research, authorship, and/or publication of this article: This work was supported by a translational research program funded by the Gyeonggi local government, the Institut National de la Santé et de la Recherche Médicale (INSERM), Centre National de la Recherche Scientifique (CNRS), Inserm Transfert (JD&RJ), Proof of Concept Institut Cochin (JD&RJ), the “Who Am I?” laboratory of excellence No. ANR-11-LABX-0071 funded by the French government through its “Investments for the Future” program operated by the French National Research Agency (ANR) under grant ANR-11-IDEX-0005-01 (JD&RJ), the European Union's Seventh Framework Program (FP7/2007-2013) under grant agreement 241592, and a research fellowship from the Région Ile de France and of the Fondation pour la Recherche Médicale (to V.V.).
References
Supplementary Material
Please find the following supplemental material available below.
For Open Access articles published under a Creative Commons License, all supplemental material carries the same license as the article it is associated with.
For non-Open Access articles published, all supplemental material carries a non-exclusive license, and permission requests for re-use of supplemental material or any part of supplemental material shall be sent directly to the copyright owner as specified in the copyright notice associated with the article.