
Abstract
Arginase-1, which converts the amino acid L-arginine into L-ornithine and urea, is a promising new drug target for cancer immunotherapy, as it has a role in the regulation of T-cell immunity in the tumor microenvironment. To enable the discovery of small-molecule Arginase-1 inhibitors by high-throughput screening, we developed a novel homogeneous (mix-and-measure) fluorescence-based activity assay. The assay measures the conversion of L-arginine into L-ornithine by a decrease in fluorescent signal due to quenching of a fluorescent probe, Arginase Gold. This way, inhibition of Arginase-1 results in a gain of signal when compared with the uninhibited enzyme. Side-by-side profiling of reference inhibitors in the fluorescence-based assay and a colorimetric urea formation assay revealed similar potencies and the same potency rank order among the two assay formats. The fluorescence-based assay was successfully automated for high-throughput screening of a small-molecule library in 384-well format with a good Z′-factor and hit confirmation rate. Finally, we show that the assay can be used to study the binding kinetics of inhibitors.
Introduction
Although immunotherapeutics targeting the immune checkpoints CTLA-4, PD-1, and PD-L1 have contributed substantially to recent progress in cancer treatment, a considerable proportion of patients remains unresponsive. 1 The enzyme Arginase-1, converting the amino acid L-arginine into L-ornithine and urea, is a promising new drug target for cancer immunotherapy, based on its role in the regulation of T-cell activity in the tumor microenvironment.2,3 Arginase-1 secreted by myeloid cells in the tumor microenvironment depletes local L-arginine, causing T-cell anergy and the suppression of T-cell and natural killer cell proliferation.2,3
Arginase enzyme activity is commonly determined by measuring the rate of urea formation in a colorimetric assay.4,5 A disadvantage of the urea formation assay is that it requires strong acidic solutions (sulfuric acid), which are incompatible with the tubing of automated dispensers commonly used for high-throughput screening (HTS). Here we describe a novel fluorescence-based screening assay for Arginase-1 and its validation using reference inhibitors and by HTS. The assay is developed to be addition only, and consists of only two reaction steps: (1) incubation of the enzyme with compound and (2) addition of the Arginase Gold probe and the substrate L-arginine, followed by development of the reaction and measurement of the fluorescence. The fluorescence of the probe is quenched upon conversion of L-arginine into L-ornithine, resulting in a decrease of the fluorescent signal. Inhibition of Arginase-1 decreases this conversion and therefore causes a gain of the fluorescent signal compared with the uninhibited enzyme.
Materials and Methods
Inhibitors and Compound Library
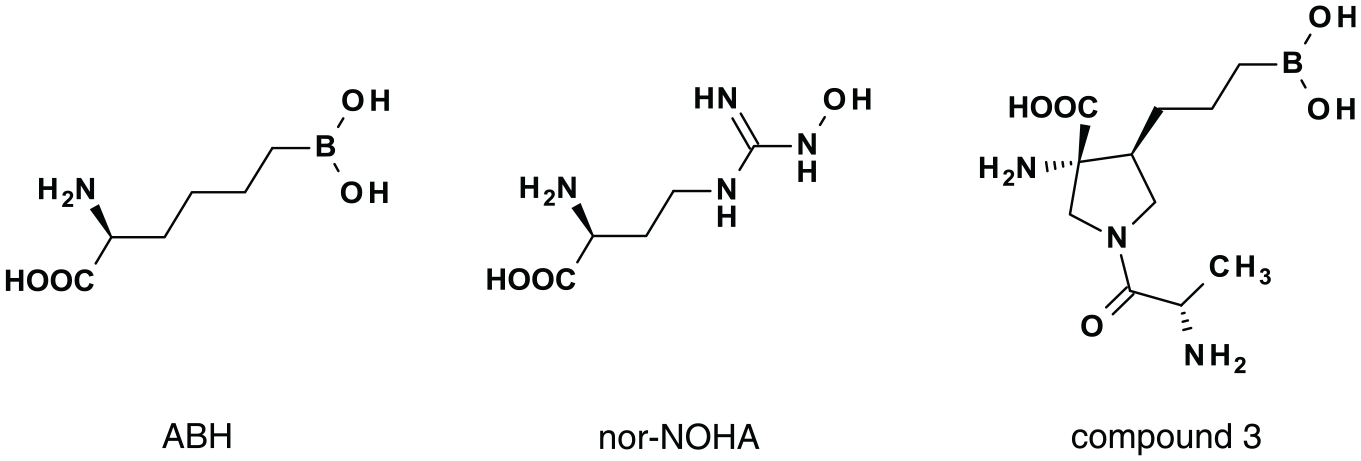
2-Amino-6-boronohexanoic acid (ABH) 6 was prepared according to patent WO 2016/037298. 7 Nw-hydroxy-nor-L-arginine monoacetate (nor-NOHA) 8 was purchased from Tocris Bioscience (cat. no. 6370; Bristol, UK). Compound 3 was synthesized according to procedures described for structure 10 from patent WO 2017/075363. 9 The compound library screened at the Pivot Park Screening Centre (Oss, The Netherlands; www.ppscreeningcentre.com) consisted of a diverse set of 87,000 leadlike compounds from a commercial supplier (Specs, Delft, The Netherlands) supplemented with 6000 compounds from another supplier (Mera Pharmaceuticals, Kailua-Kona, HI). The incorporation of desired molecular properties as well as their synthetic tractability was ensured by the Pivot Park Screening Centre.
Protein Expression
Full-length human Arginase-1 (L-arginine amidinohydrolase, EC 3.5.3.1) was expressed with an N-terminal hexa-histidine tag in Escherichia coli and purified by affinity chromatography using Ni-NTA agarose beads (Qiagen, Venlo, The Netherlands) to 95% purity, as determined by polyacrylamide gel electrophoresis. The purified protein was desalted on a PD-10 column (GE Healthcare Bio-Sciences AB, Uppsala, Sweden) and stored at −80 °C in aliquots in buffer containing 20% glycerol. The Michaelis-Menten parameters of the protein were characterized previously. 10
Fluorescence-Based Arginase-1 Assay
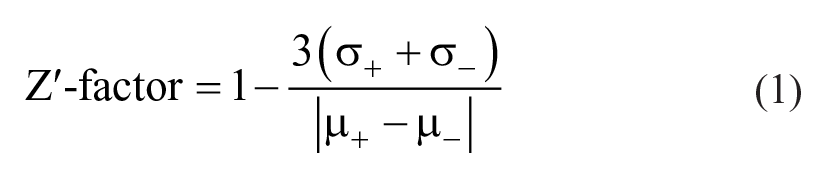
All components of the assay were diluted in assay buffer composed of either 5 mM glycine, pH 9.5, and 0.05% Tween-20 or 10 mM NaH2PO4, pH 7.4, and 0.01% Tween-20. Compounds were dissolved and diluted in DMSO or in MilliQ water and then further diluted in assay buffer to the desired concentrations. In a black 384-well plate (cat. no. 3573; Corning, Corning, NY), 10 µL compound solution and 10 µL of 40 nM (pH 9.5) or 80 nM (pH 7.4) Arginase-1 were combined and incubated for 90 min at room temperature. Then, 20 µL of fluorescent probe (Arginase Gold; prepared in-house and commercially available at The Netherlands Translational Research Center B.V.; www.ntrc.nl) combined with 5 mM L-arginine (cat. no. 105000250; Acros Organics, Geel, Belgium) was added to each well, followed by incubation for 30 min (pH 9.5) or 60 min (pH 7.4) at room temperature. To determine the conversion of L-arginine into L-ornithine, the fluorescence signal was read on an EnVision 2104 Multilabel Plate Reader (PerkinElmer, Waltham, MA; excitation filter X320 and emission filter M510W). The final concentration of Arginase-1 in the assay at pH 9.5 was 10 nM; at pH 7.4, it was 20 nM. The final concentration of L-arginine was 2.5 mM at both pH conditions. All experiments were performed with duplicate measurements. The Z′-factor of the assay was calculated using Eq. (1), 11 with σ and µ as the standard deviation and mean, respectively, of the positive control samples (including all reaction components except enzyme; denoted with +) and negative control samples (including all reaction components; denoted with –).
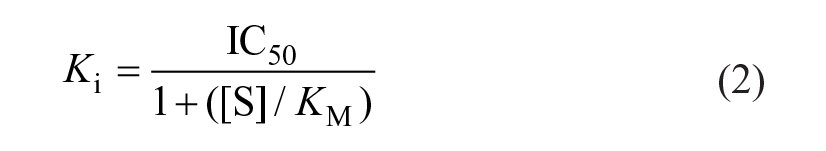
Dose-response curves were fit in XLFit (IDBS, Guildford, UK) with a four-parameter logistic regression to determine the IC50 values. IC50 values were then converted to inhibition constants (Ki) using the Cheng-Prusoff equation (Eq. [2]) with [S] as the L-arginine concentration and KM as the Michaelis constant of Arginase-1 for L-arginine.
The average Z′-factor of the assay at pH 9.5 was 0.70 ± 0.05, and the average signal-to-background ratio (S/B) was 1.67 ± 0.11 when performed on the lab bench. The assay was sensitive to the addition of 0.1% DMSO with a slight drop in assay performance (average Z′-factor of 0.67 ± 0.05 vs. 0.73 ± 0.04 with and without 0.1% DMSO, respectively), whereas the S/B remained identical for both conditions. At pH 7.4, the average Z′-factor was 0.62 ± 0.08, with an average S/B of 1.52 ± 0.11.
Colorimetric Urea Formation Assay
The colorimetric urea formation assay was performed as previously described, 10 with the exception of the assay buffers, which were composed of either 5 mM glycine, pH 9.5, and 0.05% Tween-20 or 5 mM NaH2PO4, pH 7.4, and 0.05% Tween-20.
High-Throughput Screening
The diversity compound library was screened using the Arginase-1 activity assay at pH 9.5 on a HighRes Biosolutions robotic system (Manchester, UK). Compounds were dissolved at 2 mM in DMSO, and 40 nL of the compound solutions was transferred to the assay plates using an Echo Liquid Handler (Labcyte, San Jose, CA). The compounds were diluted by addition of 10 µL assay buffer (5 mM glycine, pH 9.5, and 0.05% Tween-20) using a Flexdrop dispenser (PerkinElmer). The assay was further executed as described above, with all solutions added using the Flexdrop dispenser. Confirmation of active compounds was performed by plating the compounds using Echo acoustic dispensers and performing the assay manually on the bench. To determine potential interference by autofluorescent compounds, the background fluorescence signal was read prior to addition of the fluorescent probe. Alternatively, to correct for any interference of the library compounds in the assay, a deselection assay was performed with assay buffer added to all wells of the plates instead of the enzyme solution.
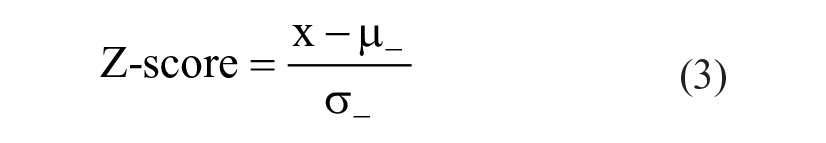
Assay quality was monitored by determining the Z′-factor and S/B for each 384-well plate. The Z-score for Arginase-1 inhibition in each well was calculated using Eq. (3) with x as the sample value and with σ- and µ- as the mean and standard deviation, respectively, of the negative control samples (including all reaction components).
The robustness of the assay was monitored by measuring dose-response curves of the inhibitor ABH throughout the screening campaign. Autofluorescent compounds and compounds interacting with the fluorescent probe were deselected based on the criteria that the increase in either the fluorescent background signal or the fluorescent signal in the absence of enzyme relative to the control samples must be less than 25% of the assay window (i.e., the difference between the minimal and maximal fluorescent signals in the complete assay).
Results
Fluorescence-Based Arginase-1 Activity Assay
Initial development of the fluorescence-based activity assay was performed at pH 9.5, which is the pH optimum of human Arginase-1. The assay was subsequently optimized at both pH 9.5 and physiological pH of 7.4 with regard to the enzyme concentration and reaction time. The L-arginine concentration was chosen at 2.5 mM for both pH values, which roughly equals KM at pH 7.4 and half of KM at pH 9.5.
10
The fluorescent response of the assay was confirmed to be linear up to this concentration at both pH values by measurement of a calibration curve consisting of decreasing L-arginine concentrations combined with increasing L-ornithine concentrations (
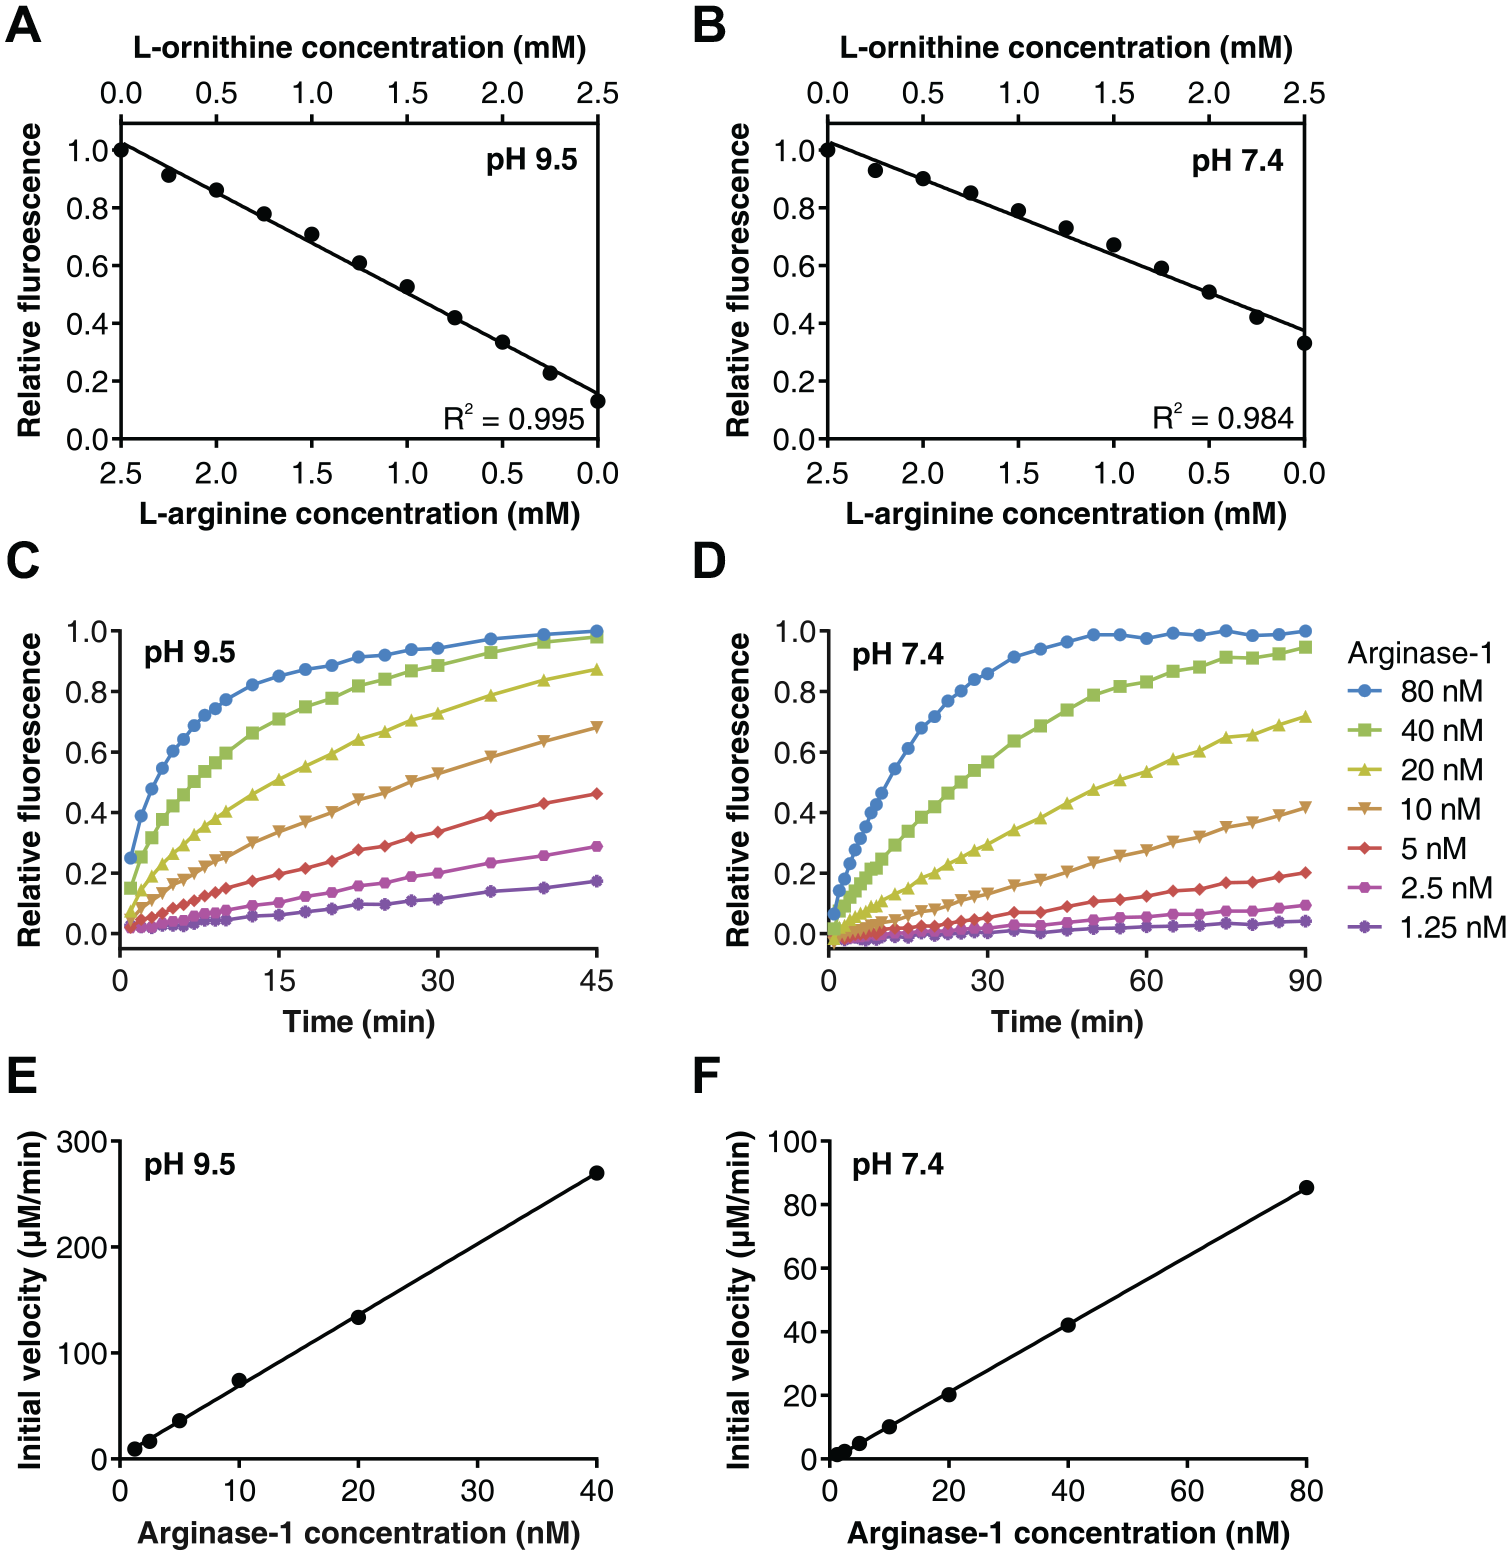
Development and optimization of the fluorescence-based Arginase-1 activity assay. (
Pharmacology and HTS
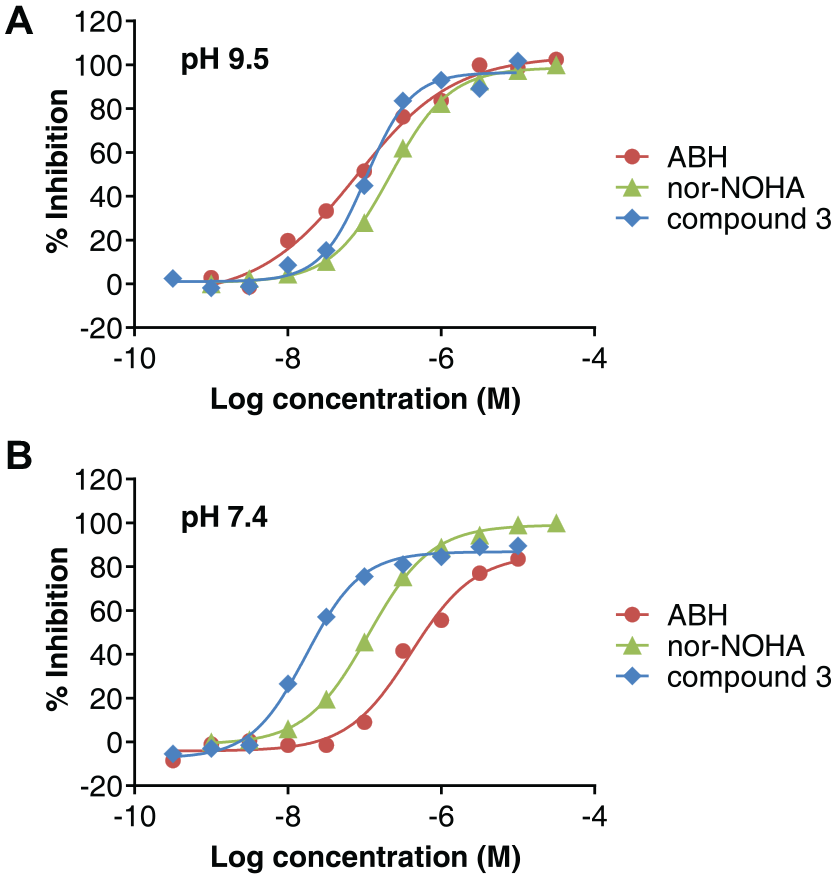
The pharmacology of the assay was validated by testing three reference inhibitors and comparing their potencies with those determined in a colorimetric urea detection assay. The chemical structures of the three compounds are shown in Figure 2 . ABH 6 and nor-NOHA 8 are two different synthetic chemical derivatives of L-arginine and are widely used reference inhibitors of Arginase-1. Compound 3 is a mixture of the Arginase-1 inhibitor CB-1158 (INCB001158), which is currently in clinical trials, 3 and one of its diastereomers. Figure 3 shows representative dose-response curves of the three compounds in the assay performed at pH 9.5 and at pH 7.4. The inhibition constants (Ki) are compared with those determined in the colorimetric urea assay ( Table 1 ). All Ki values showed maximally a 2.5-fold difference between the two assay formats ( Table 1 ). Moreover, the inhibitors maintained the same potency rank order in both assays. These results confirm the correct assay pharmacology of the fluorescence-based assay.
Representative dose-response curves of inhibitors in the Arginase-1 fluorescence-based activity assay. (
Inhibition Constants of Inhibitors in the Arginase-1 Fluorescence-Based and Colorimetric Urea Formation Assays at pH 9.5 and pH 7.4. a
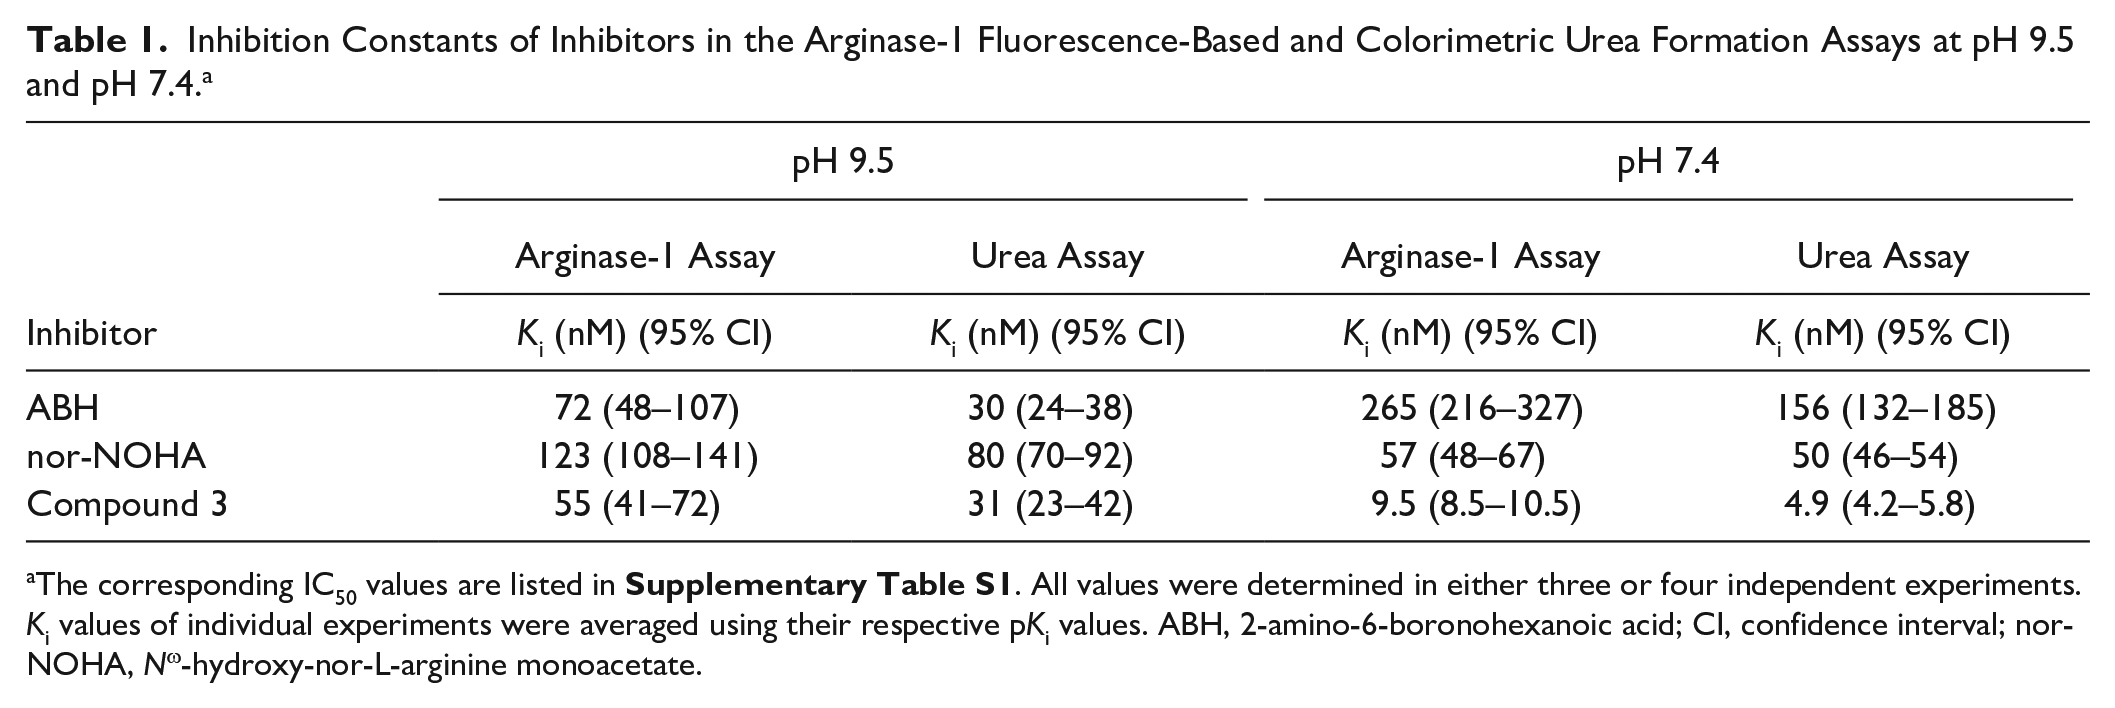
The corresponding IC50 values are listed in
To investigate the applicability of the assay in HTS, a 93,000-compound diversity library was screened for inhibitors of Arginase-1 on a fully automated robotic system at the Pivot Park Screening Centre. The compounds were screened in 384-well assay plates at a concentration of 2 µM with a final DMSO concentration of 0.1%. The average Z′-factor of the screen was 0.59 with an S/B of 1.64 (
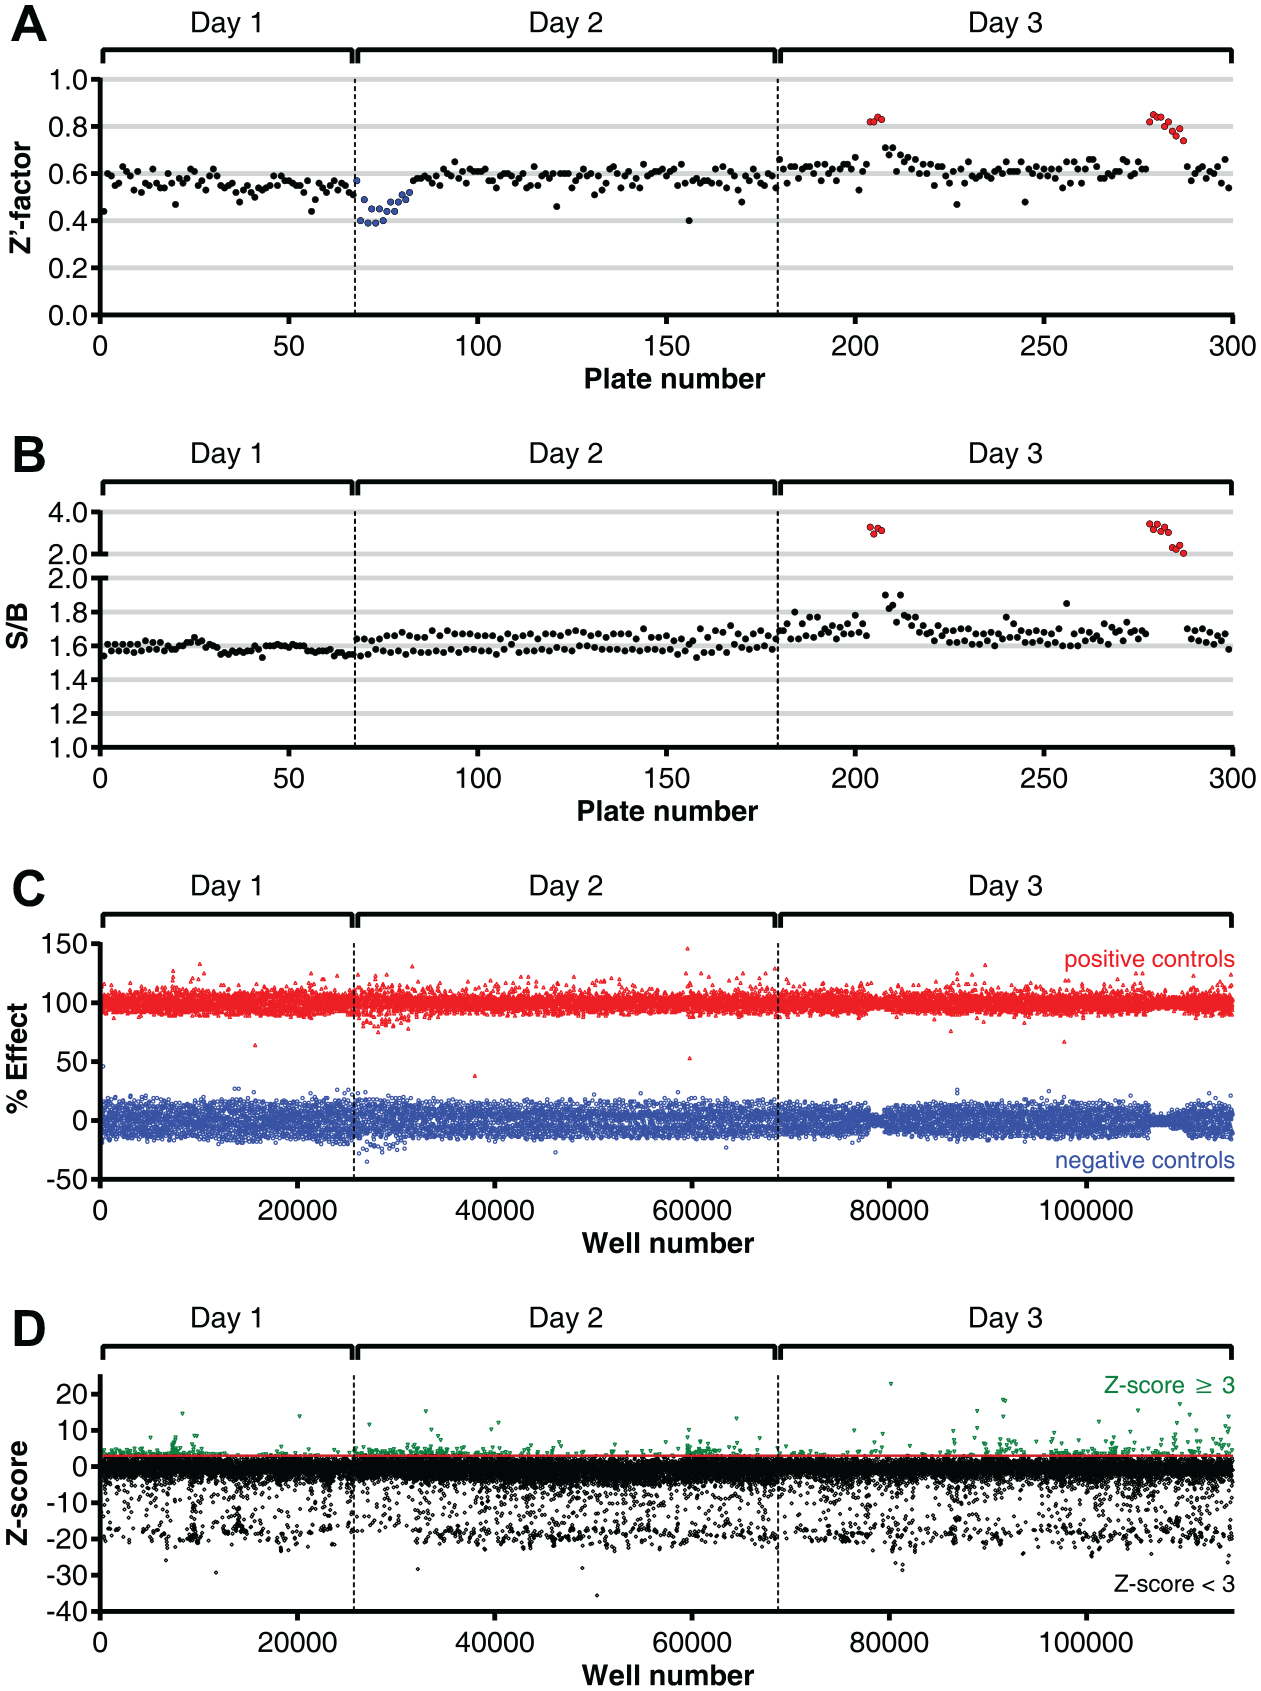
Performance of the fluorescence-based Arginase-1 activity assay in high-throughput screening. (
Real-Time Kinetics
The fluorescence-based assay format has no final step in which the signal needs to be developed. Instead, the fluorescent signal can be continuously monitored. However, in some cases, it might be desirable to stop the assay after a set amount of time. For this, we studied various reaction stop protocols, such as acidic pH and reducing conditions. It appeared that addition of tris(2-carboxyethyl)phosphine (TCEP) to a final concentration of 1 mM was suitable to stop all Arginase-1 activity without sacrificing the Z′-factor of the assay. The continuous readout also generates the possibility of following the reaction in real time, thereby allowing the kinetics of inhibitor binding to be studied. The assay was therefore also developed to allow monitoring of the reaction progress of L-arginine conversion by Arginase-1 in real time. To determine whether the reaction time in the presence of L-arginine has an effect on the measured Ki values, the inhibition of Arginase-1 was monitored as a function of the reaction time (
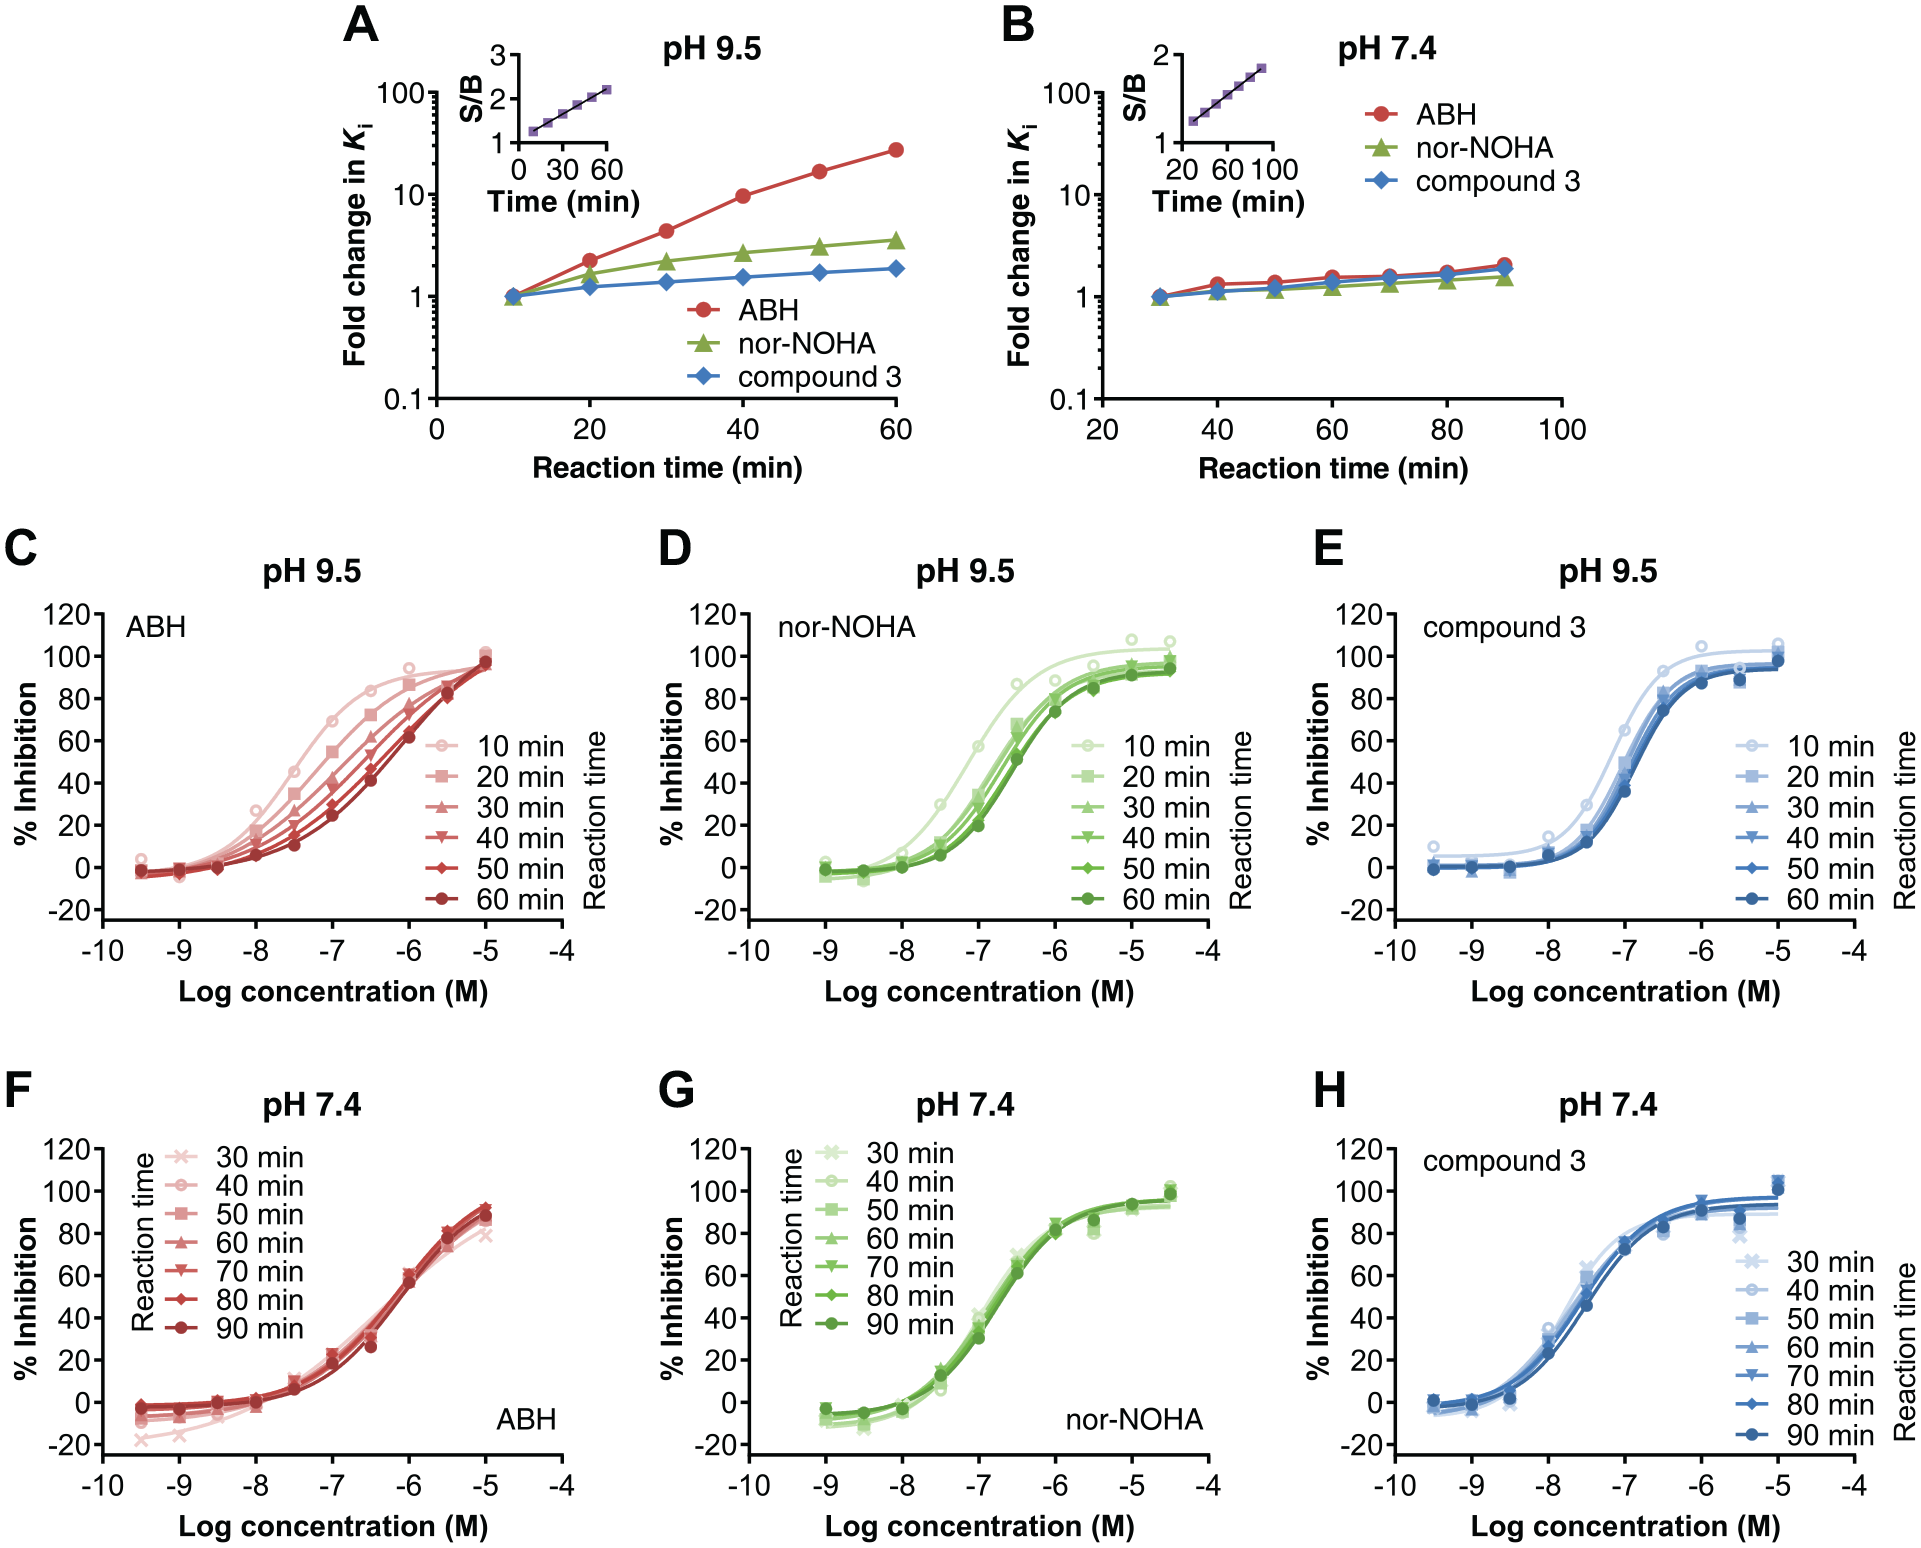
Inhibition constants and dose-response curves in the Arginase-1 fluorescence-based activity assay with increasing reaction times at pH 9.5 and 7.4. (
The potencies of nor-NOHA and compound 3 decreased only slightly over time at pH 9.5 and pH 7.4 (
Discussion
Despite the renewed interest in Arginase-1 as a therapeutic drug target, the number of different chemotypes described in scientific publications and patents remains rather low. Early inhibitors are analogues of the substrate L-arginine, such as the boronic acid derivative ABH. 6 Macromolecular co-crystal structures of Arginase-1 and inhibitors have enabled the development of more potent inhibitors, such as CB-1158, 3 which is currently investigated in phase I/II clinical trials. The primary focus on rational design and structure-based medicinal chemistry approaches may in part be related to the lack of suitable assays for HTS. Previously reported assays are generally poorly compatible with robotic screening because of the requirement of multiple reaction steps, 12 harsh assay conditions,4,5 the use of radioactive substrate, 13 or the use of low-turnover substrates other than L-arginine. 14
For Arginase-2, an automated mass spectrometry method has been described, referred to as RapidFire mass spectrometry (RapidFire-MS), which was used to screen a library of several thousands of small-molecule fragments. 15 Mass spectrometry is a label-free method, and therefore, technology interferences are rare. However, disadvantages of RapidFire-MS in comparison with probe-based screening methods include the requirement of specifically trained operators, the high price of equipment, and the cost of integration. Furthermore, the assay throughput is much lower. Cycle times reported for RapidFire-MS start at 5 to 10 s per sample, which equals about 1 h per 384-well plate, 16 whereas the RapidFire Arginase-2 screen was performed with a cycle time of >18 s per sample. 15 In contrast, the Envision multimode reader used in our studies measures 384 samples in one 384-well plate within 1 min.
The fluorescence-based activity assay for Arginase-1 is shown to be robust and suitable for HTS, as evidenced by the consistent Ki value of ABH measured throughout the screening campaign and the favorable Z′-factor. This assay will therefore be of value for the identification of novel Arginase-1 inhibitor scaffolds. Because enzyme inhibition results in a gain of fluorescence signal in the assay, the chance of false-positive signals by fluorescent dye interference is expected to be low. Furthermore, the assay allows deselection of autofluorescent compounds and compounds interacting with the fluorescent probe by performance of the assay in the absence of enzyme. Moreover, the availability of a stop solution (i.e., TCEP) provides additional flexibility when performing an assay on the bench or applying it for HTS. However, the effect of the stop solution on the interference of compounds with the assay readout still needs to be determined. Finally, an important aspect of our assay is that it can be used to monitor the binding kinetics of inhibitors in real time.
Supplemental Material
Supplementary_Table_S1 – Supplemental material for High-Throughput Fluorescence-Based Activity Assay for Arginase-1
Supplemental material, Supplementary_Table_S1 for High-Throughput Fluorescence-Based Activity Assay for Arginase-1 by Yvonne Grobben, Nicole Willemsen-Seegers, Joost C. M. Uitdehaag, Jos de Man, Jan van Groningen, Johan Friesen, Helma van den Hurk, Rogier C. Buijsman and Guido J. R. Zaman in SLAS Discovery
Footnotes
Supplemental material is available online with this article.
Declaration of Conflicting Interests
The authors declared no potential conflicts of interest with respect to the research, authorship, and/or publication of this article.
Funding
The authors received no financial support for the research, authorship, and/or publication of this article.
References
Supplementary Material
Please find the following supplemental material available below.
For Open Access articles published under a Creative Commons License, all supplemental material carries the same license as the article it is associated with.
For non-Open Access articles published, all supplemental material carries a non-exclusive license, and permission requests for re-use of supplemental material or any part of supplemental material shall be sent directly to the copyright owner as specified in the copyright notice associated with the article.