
Abstract
Hits from high-throughput screening (HTS) assays are typically evaluated using cheminformatics and/or empirical approaches before a decision for follow-up (activity confirmation and/or sample resynthesis) is made. However, the compound integrity (i.e., identity and purity) of these hits often remains largely unknown at this stage, since many compounds in the screening collection could undergo various changes such as degradation, polymerization, and precipitation during storage over time. When compound integrity is actually assessed for HTS hits postassay to address this issue, the process often increases the overall cycle time by weeks due to the reacquisition of the samples and the lengthy liquid chromatography–ultraviolet/mass spectrometric analysis time. Here we present a novel approach where compound integrity data are collected concurrently with the concentration–response curve (CRC) stage of HTS, with both assays occurring either in parallel on two distributions from the same liquid sample or serially using the original source liquid sample. The rapid generation of compound integrity data has been enabled by a high-speed ultra-high-pressure liquid chromatography–ultraviolet/mass spectrometric platform capable of analyzing ~2000 samples per instrument per week. From this parallel approach, both compound integrity and CRC potency results for screening hits become available to medicinal chemists at the same time, which has greatly enhanced the decision-making process for hit follow-up and progression. In addition, the compound integrity results from recent hits provide a real-time and representative “snapshot” of the sample integrity of the entire compound collection, and the data can be used for in-depth analyses of the screening collection.
Introduction
High-throughput screening (HTS) of up to several million compounds against a given disease target has been the primary method of generating small-molecule hits that can be progressed into leads in drug discovery.1,2 There are usually three steps in HTS: primary screening, retesting to confirm the initial hits, and the generation of concentration–response curves (CRCs) for the confirmed hits. CRC hits are often validated by some form of structure confirmation followed by retesting. However, depending on the particular high-throughput screen, there could be thousands of CRC hits from which to select for follow-up. Since it can be resource-prohibitive for chemists to follow up on all CRC hits, hit triaging is typically performed by medicinal chemists through the use of both computational approaches (filters, clustering analysis, etc.) and empirical knowledge of given chemotypes,3–6 in order to reduce the number of hits to a manageable list for follow-up.
The integrity of each of the hit compounds, commonly defined as the identity and purity of the compound, would be another valuable piece of information to have in the hit triaging decision tree. 6 This is because typical screening collections, by their nature of being DMSO solutions, have been known to contain compounds that are impure due to degradation and polymerization, have the wrong nominal concentrations due to precipitation, or are simply misidentified. 7 Although compound integrity could be deduced indirectly from assay results, 8 the “gold standard” method is liquid chromatography–ultraviolet/mass spectrometric (LC-UV/MS) detection. The main drawback of LC-UV/MS, unfortunately, is its long analysis time at typically >5 min per sample. Previously at Bristol-Myers Squibb Co. (BMS) when we attempted integrity assessment for HTS hits postassay, the process increased overall cycle time by weeks due to the time it took to reacquire the samples from the compound store and then perform the LC-UV/MS analyses. In addition, the retested samples often came from different source vessels, and therefore did not truly reflect the samples that had gone through the original HTS assays.
Here we present a novel approach where compound integrity data are collected concurrently with the CRC stage of HTS, with both assays using DMSO compound samples either from the same source vessel, or later on from the exact same DMSO sample. This new approach is enabled by making two changes to the previous workflow. First, the CRC and compound integrity plates are dispatched simultaneously so that both assays are performed in parallel from the same DMSO stock from the compound store. This is similar to the workflow previously reported by a group from the Scripps Research Institute. 9 Most recently, with a newly established “closed-loop” screening process at BMS, the same DMSO stock sample from HTS retesting is now split and dispatched to both the CRC and the compound integrity assays simultaneously, which eliminates the need for a new order from the compound store and further shortens turnaround time. Second, a high-throughput ultra-high-pressure liquid chromatography–ultraviolet/mass spectrometric (uHPLC-UV/MS) platform capable of analyzing ~2000 samples per instrument per week has been established to increase the speed of compound integrity determination. As a result, the biology results from CRC and compound integrity data are now available to chemists contemporaneously, enabling medicinal chemists to make more informed decisions in their hit triaging effort.
Materials and Methods
HPLC-grade methanol, acetonitrile, isopropanol, water, and formic acid were purchased from J.T. Baker (Phillipsburg, NJ). DMSO and ammonium acetate were from Sigma-Aldrich (St. Louis, MO). All test compounds in DMSO solutions in 96-well plates were provided by the Compound Management group at BMS (Princeton, NJ).
Compound Integrity Determination
The samples for the compound integrity assay were received either in 96-well plates as 10 µL of a 3 mM solution in 100% DMSO or in 384-well plates as 2 µL of a 1.5 mM DMSO solution. The stock solutions were diluted with a 1:1:1 (v/v/v) mixture of HPLC-grade acetonitrile, isopropanol, and water to result in a final compound concentration of 300 µM for analysis. The uHPLC-UV/MS system consisted of a Waters Acquity UPLC equipped with an Acquity binary solvent manager, an Acquity 2777 sample manager, an Acquity TUV detector operated at 220 nm, and a Waters SQD single quadrupole mass spectrometer operated under electrospray ionization (ESI) mode with polarity switching (Waters, Milford, MA). A 2 min ballistic linear gradient from 0% to 100% organic mobile phase was carried out on a Waters Acquity UPLC C18, 1.7 µm, 2.1 × 30 mm column with the corresponding Waters VanGuard 2.1 × 5 mm precolumn. The aqueous mobile phase consisted of 95% water with 10 mM ammonium acetate and 5% acetonitrile, whereas the organic mobile phase consisted of 95% acetonitrile and 5% water. The flow rate was 1 mL/min and the injection volume was 3 µL. Each sample batch analysis was bracketed by triplicate injections of a system suitability sample (a mixture of hippuric acid, metoprolol, 4-amino benzophenone, and pimozide in 50:50 acetonitrile/water, 0.5 mg/mL each) to ensure adequate uHPLC-UV/MS system performance.
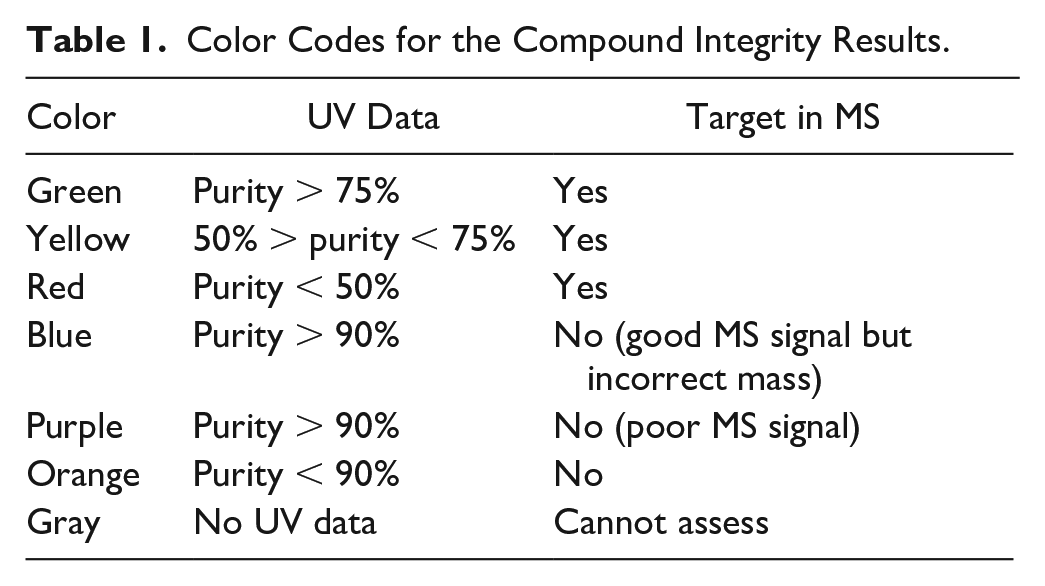
Data processing was performed using Analytical Data Reviewer (Virscidian, Cary, NC), which processed the raw instrument files, calculated the UV percent purity for the target chromatographic peak, and determined if the correct monoisotopic mass peaks were found in the mass spectra. 10 After automated processing by Analytical Data Reviewer, manual review was then performed for all samples with nongreen (<75% of confirmed purity) results. On average, about 40% of samples on each plate underwent manual review. After review, the color-coded results were published to the central data repository (CDR). The color-coded results are summarized in Table 1 , with green, yellow, and red indicating confirmed identities with different UV purity levels; blue and purple indicating a high UV purity without an MS-confirmed identity; and gray and orange denoting both a low UV purity level and lack of identification.
Color Codes for the Compound Integrity Results.
HTS Assays
Compound integrity results were determined for CRC samples from a total of 11 HTS assays. These HTS projects represented multiple therapeutic areas, and the details about the targets and assays could not be disclosed. In general, these screens were enzymatic or cell-based assays with fluorescence readout, similar to those described previously.11,12 A brief description of the HTS assays is shown in Table 2 .
Summary Information of the HTS Assays Evaluated.
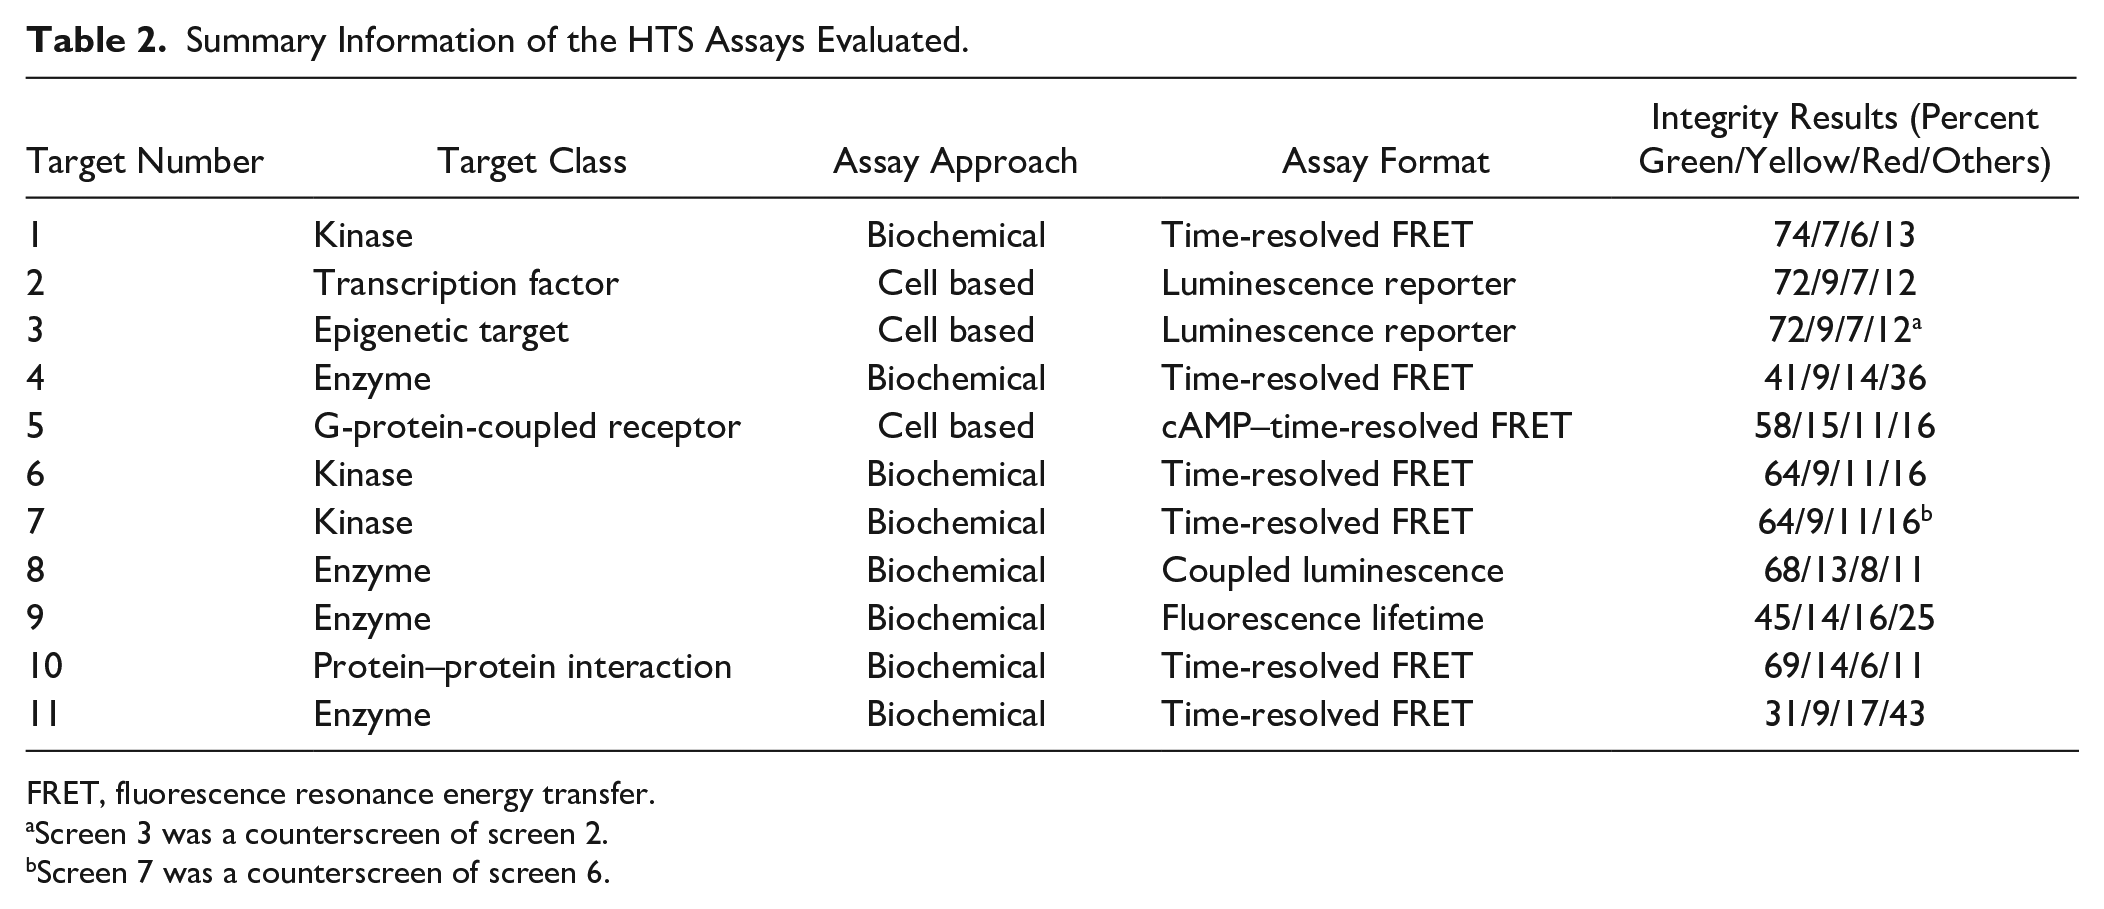
FRET, fluorescence resonance energy transfer.
Screen 3 was a counterscreen of screen 2.
Screen 7 was a counterscreen of screen 6.
Results and Discussions
Purity determination of newly synthesized compounds is usually conducted with a relatively long (>5 min) LC-UV/MS method. 13 To achieve the speed necessary for parallel HTS/CRC and integrity determination, we implemented a 2.5 min analysis method while maintaining the same column stationary phase and mobile phases used in our standard 6 min quality control (QC) method for synthetic compound characterization. Representative LC-UV/MS chromatograms from both the standard QC method and the faster integrity method are shown in Figure 1 . Despite the shortened run time, the purity values obtained using the shortened method agreed very well with those determined with the standard QC method. With the enhanced speed offered by the new method, it was possible to analyze 2000 samples (a typical CRC sample set from a single screen) on a single LC-MS instrument within a week, which matched the rate of data generation from CRC assays and achieved concurrent result delivery from both assays.
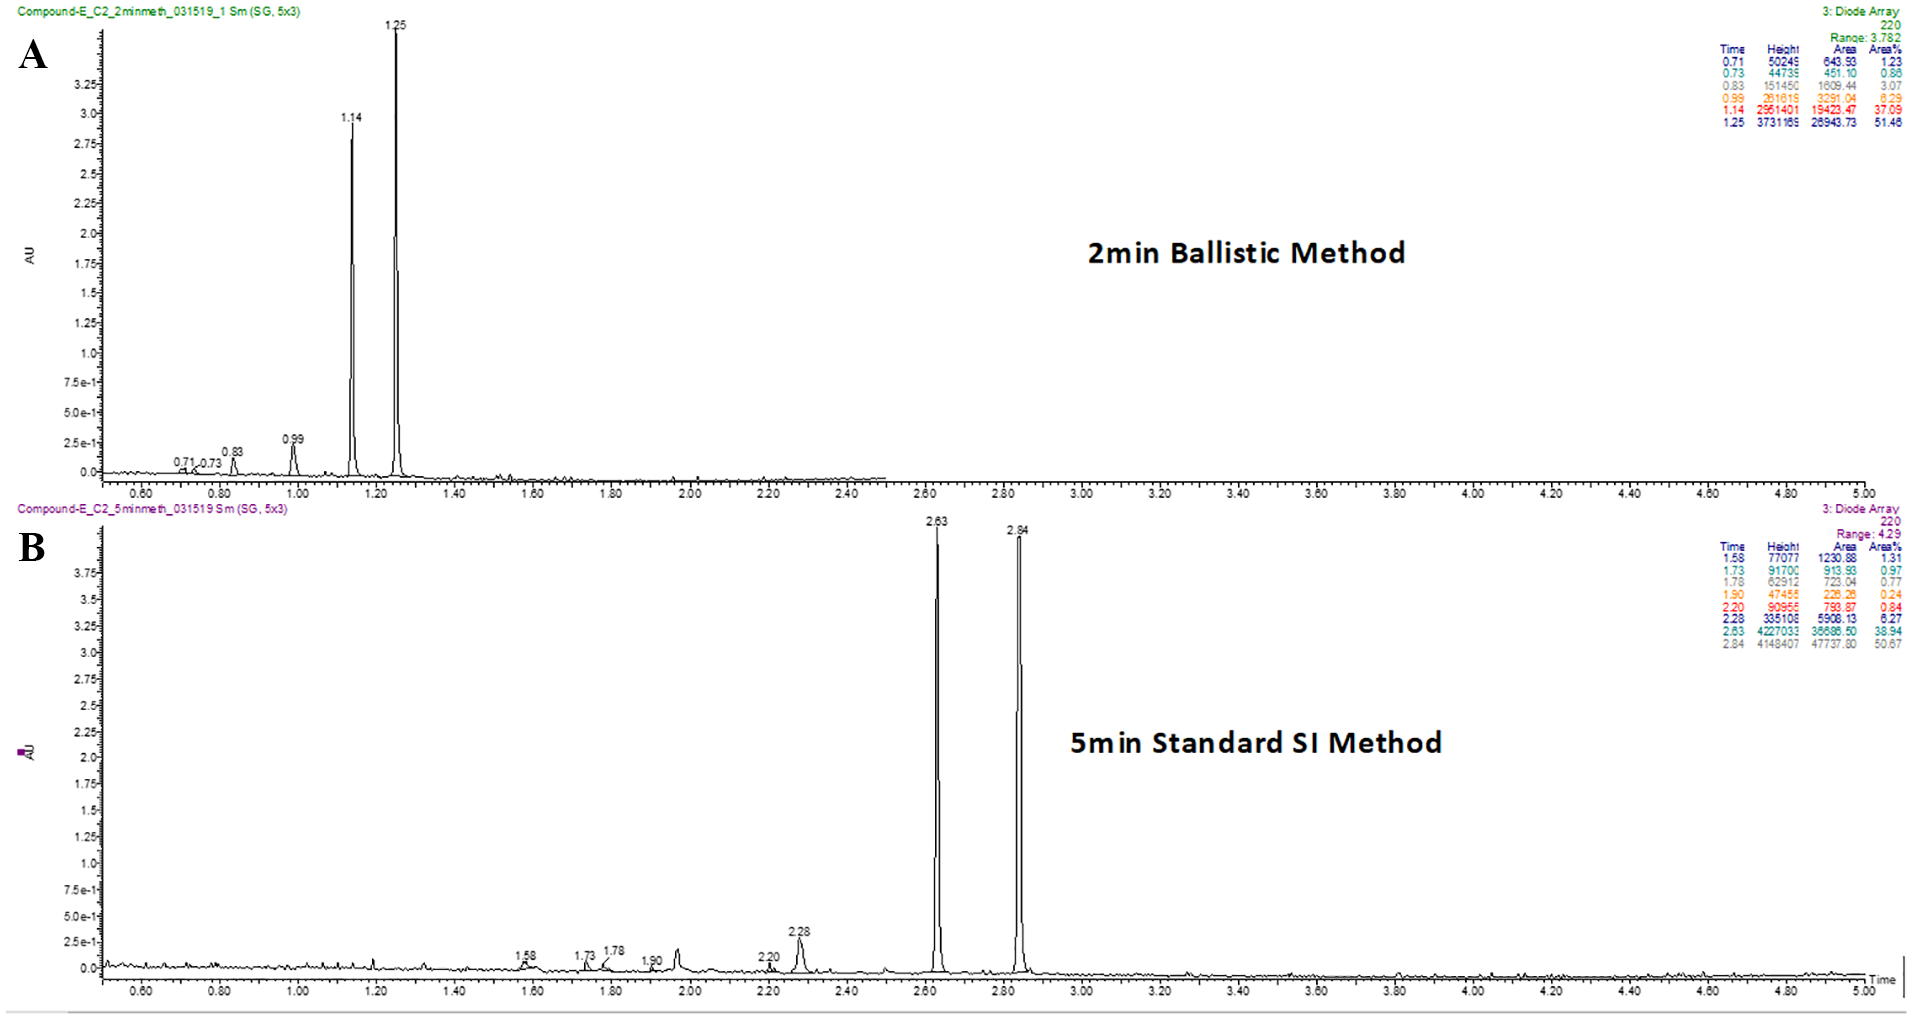
Representative LC-UV/MS chromatograms using (
The distribution of purity results of more than 25,000 CRC samples from multiple high-throughput screens is shown in Figure 2 . Approximately 74% of the hits were more than 50% pure, with their color flags being either green or yellow. The rest (~26%) of the samples had either purity values of <50% or poor mass spectra that precluded positive compound identification. This distribution is generally consistent with the reported results of compound collections from other pharmaceutical companies.14–16 The distributions of purity results from 2 of the 11 high-throughput screens are shown in Figure 3 . Most of the individual purity distributions (8 out of 11) mirrored the overall distribution; however, 3 of them (projects 4, 9, and 11) were significantly skewed toward more red, orange, purple, and gray compounds. In closely examining the assays, we found that these three assays tended to have a low overall hit rate, and as a result, more “actives” were pulled from the low/noisy activity range for CRC testing. Therefore, a significant deviation from the normal distribution of integrity results from CRC samples could serve as a flag about HTS assay performance and potentially trigger assay troubleshooting. In addition, the observation of a skewed purity distribution prompted the medicinal chemists to adopt a more conservative triage strategy that emphasized compound resynthesis and activity confirmation in orthogonal assays in order to address the anticipated higher-than-usual false-positive rate.
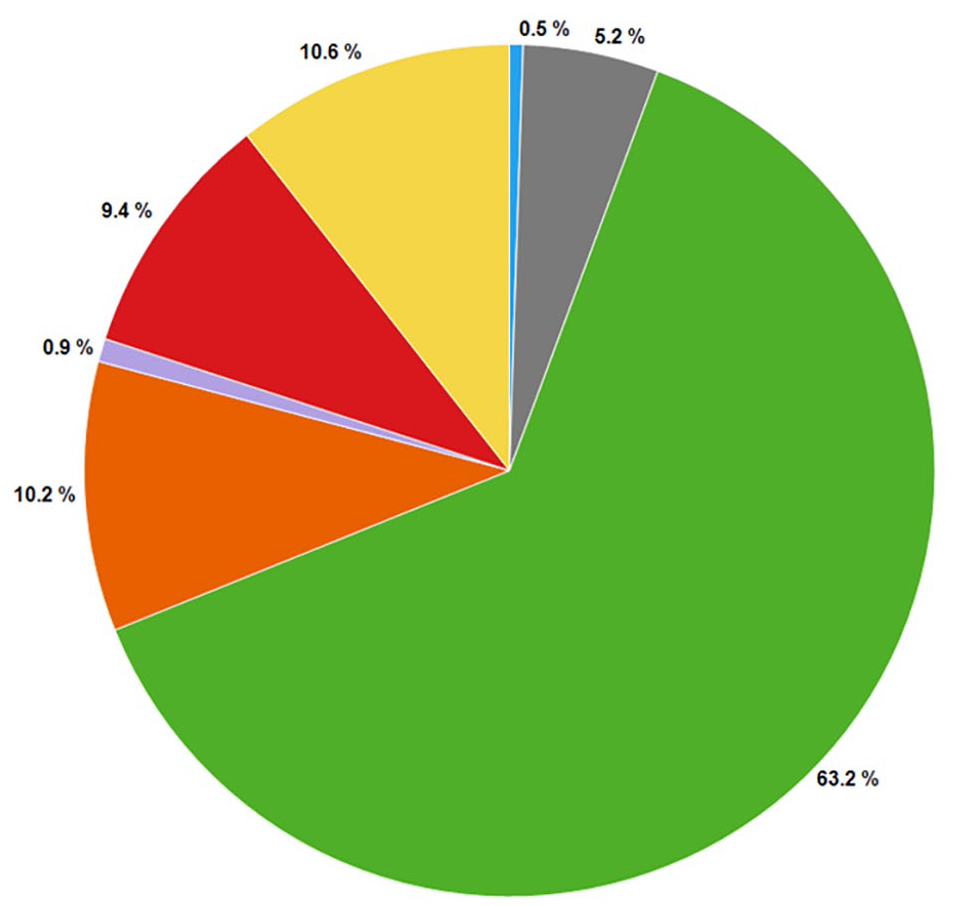
Distribution of color-coded compound integrity results from 25,181 HTS hits.
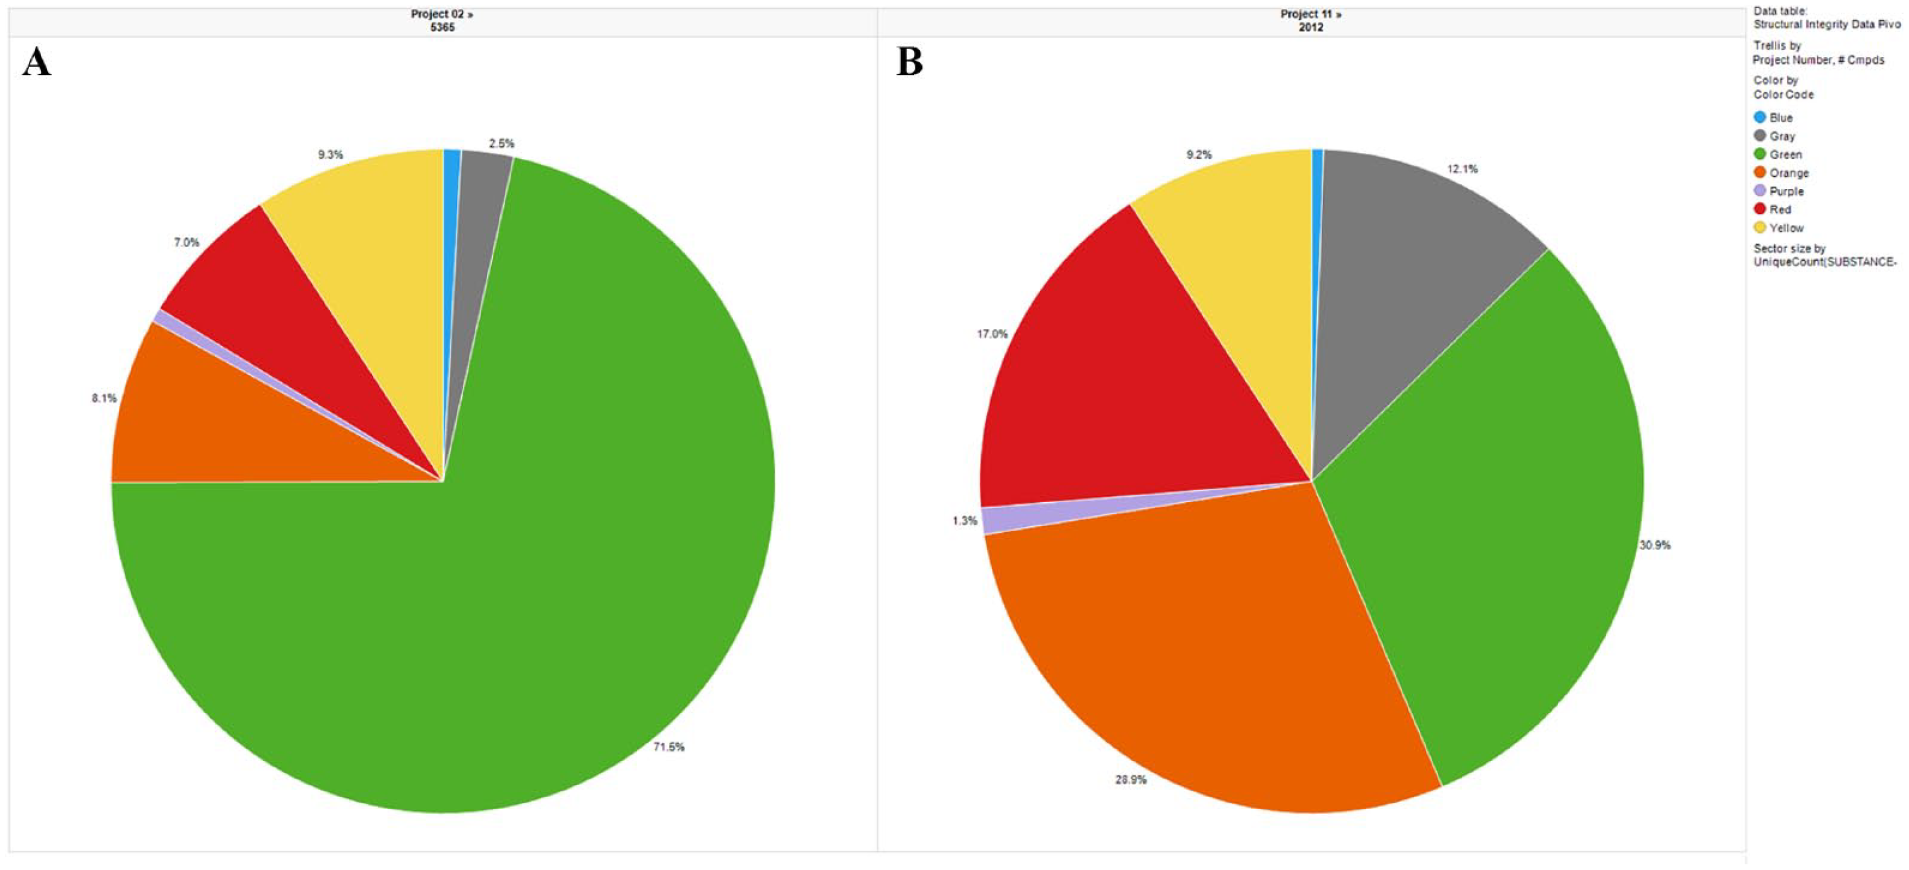
Distributions of color-coded compound integrity results from a normal (
The integrity data for the approximately 25,000 compounds within this set were all acquired within a period of 6 months. Looking at the data in aggregate, we soon realized that both the large sample size and the temporal proximity of the results have enabled a representative, real-time “snapshot” of the compound integrity in solution of the entire BMS screening collection. For example, Figure 4 shows a histogram of the normalized distribution of different result colors versus compound age in 5-year bins. The results clearly demonstrate the effect of compound age on integrity, with progressively worse results for the older compounds. Similarly, analyses of the relationships between integrity results and different parameters such as compound origin, storage condition, and therapeutic area/project, could be easily performed from these data. From these real-time compound integrity results, data-driven decisions could be made to curate the stock solutions used to prepare the screening collection. For example, a failed integrity result could trigger generation of a new liquid sample from the dry compound store, and a follow-up analysis of the new solution to confirm integrity. Based on the result of that analysis, the compound could remain in the screening collection using the new solution, or could be removed from both the screening collection and dry compound store. Lastly, with this workflow in place and its growing dataset of compound integrity results, additional insights into the company screening collection can be continuously acquired over time.
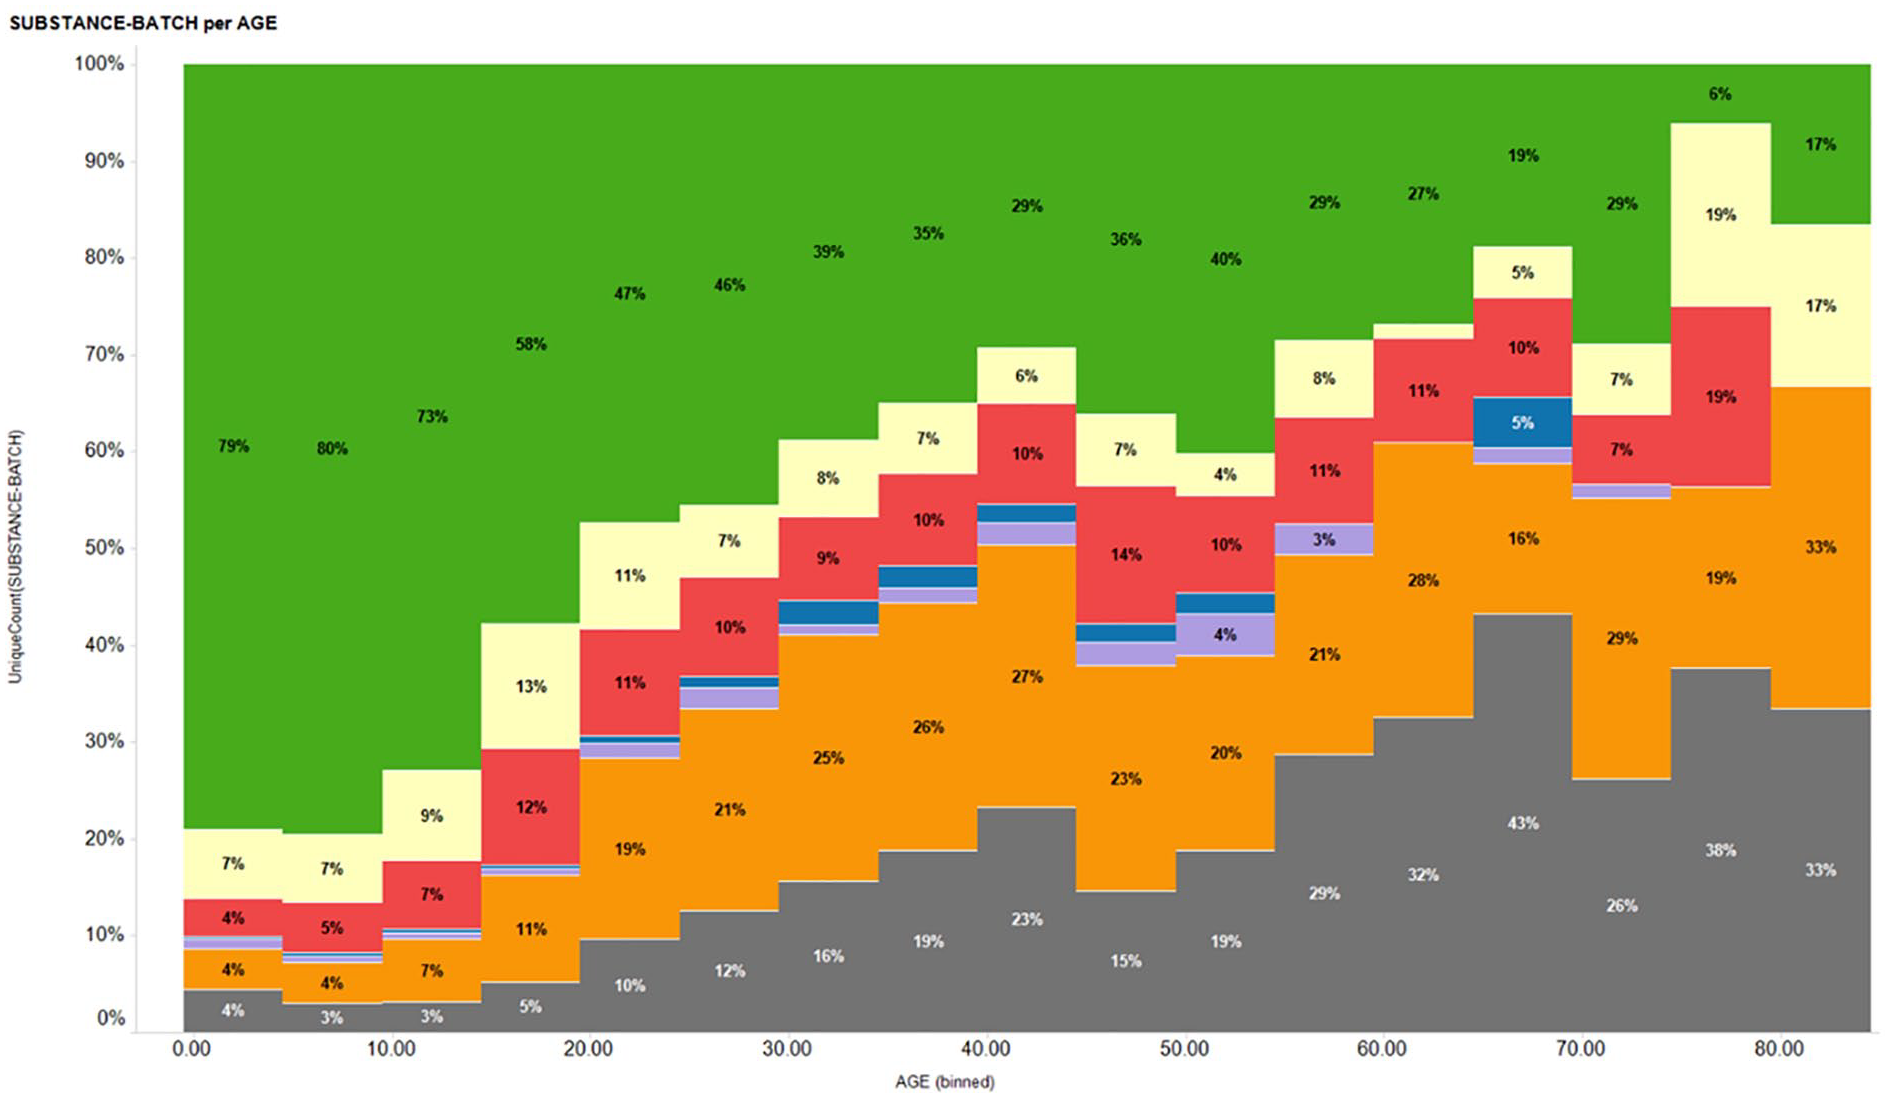
Histogram showing normalized distribution of different compound integrity result colors versus compound age in 5-year bins.
Based on the CRC potency and compound integrity results obtained for these screens, a new hit follow-up strategy has been formulated by medicinal chemists. For active hits from CRC, those with a UV purity of more than 50% (green or yellow) from the integrity assay are prioritized and sent directly to confirmation assays. Hits with a less than 50% purity are initially de-prioritized or are submitted to a bioactivity chromatogram (biogram) assay 17 to correlate activities from bioassays with chromatographic fractions. This strategy has been applied to the hit triaging efforts for multiple screening projects in drug discovery at BMS.
In summary, a new approach to incorporate “real-time” compound integrity data into hit triaging has been established, by conducting high-throughput uHPLC-UV/MS analysis in parallel with obtaining CRC results from the same DMSO samples. By building on the existing HTS cherry-picking process and existing uHPLC-UV/MS compound QC workflow, we have implemented this new approach with minimal incremental resources, but with positive impact across chemistry, HTS, and compound management. First, the simultaneous availability of integrity and screening data has enabled medicinal chemists to make more informed decisions in hit triaging and modify their triage strategies accordingly, by prioritizing and focusing follow-up resources on hits with confirmed integrity first. Second, the compound integrity results offered useful insights into the performance of the HTS assays, with a growing dataset of compound integrity versus enzyme class, hit rate, detection technique, and other assay parameters. Lastly, the compound integrity data have provided a real-time insight into the current state of the screening collection, as well as the quality of the screening collection over time, which should enable, in the future, the data-driven curation of the collection.
Footnotes
Acknowledgements
The authors would like to thank Dr. Nicholas Meanwell and Dr. Scott Priestley for helpful discussions, and for reviewing the manuscript.
Declaration of Conflicting Interests
The authors declared no potential conflicts of interest with respect to the research, authorship, and/or publication of this article.
Funding
The authors received no financial support for the research, authorship, and/or publication of this article.