
Abstract
High-performance liquid chromatography (HPLC) biogram methodology is a powerful pharmaceutical screening hit confirmation strategy that couples analytical HPLC data with functional bioassay data. It is used primarily for screening hit chemical validation and triaging in support of early phase discovery programs and enables further investigation of the source of bioactivity in screening hits. The process combines semi-preparative separation technologies, automated compound handling and distribution, high-throughput biological screening, and informatics tools. The final output is an HPLC retention time versus bioactivity graphical overlay report. In this manner, biograms allow the analyst to determine which component in the sample is responsible for the biological activity, enabling decision making toward chemotype selection and prioritization from a pool of potential candidates. Another powerful aspect of the biogram assay lies in its utility in investigating biological activity in atypical samples, such as degraded samples or mixtures, for detection of minor active impurities or in addressing lot-to-lot activity discrepancies for a given test compound. Biograms are employed to track, isolate, and identify the source of biological activity in such samples, often yielding important information for program decisions.
Keywords
Introduction
A key decision point at the inception of many pharmaceutical drug discovery programs is the identification of tractable chemical matter as a starting point on which to launch medicinal chemistry efforts. Typically, when a new drug target is screened against a large corporate compound collection, a significant number of active compounds or “hits” are identified. These hits are then prioritized using a range of criteria, including dose-response curves for target potency, counterscreen data for selectivity and cytotoxicity, potential chemotype liabilities, and intellectual property considerations.
A hit confirmation strategy we use to characterize the biological activity in a selected screening hit is referred to as “HPLC Biogram (i.e., Bio-Activity Chromatogram) analysis.” In a biogram analysis, high-performance liquid chromatography (HPLC) is used to effect the fractionation of any sample type or mixture of interest, with fractions collected in 96 deep-well plates for subsequent biological assessment. The process combines semi-preparative separation technologies, compound handling, high-throughput screening (HTS), and informatics, all with a high level of automation. The output is a HPLC retention time versus bioactivity chart, including unfractionated sample as a control. Biograms afford data-driven decision making toward chemotype selection by confirming the source of biological activity in screening hits. Thus, in an ideal scenario, the HPLC peak corresponding to test compound correlates with target bioactivity. In this manner, it serves primarily as a hit triaging tool, allowing teams to rapidly focus on validated hits, eliminating false hits from the critical path, and saving time and resources.
A second and perhaps more powerful aspect of the biogram assay lies in its utility in investigating unexpected or conflicting biological activity in samples. These scenarios often include activity discrepancies among varying lots of the same test compound, activity in samples that have degraded or contain multiple impurities, activity that correlates with minor or nonexistent UV peaks, or samples that contain no expected test compound. Biograms are employed to track and identify the source of biological activity in such samples. Subsequent HPLC fractionation is conducted for isolation and structural elucidation of the active component(s), yielding important information for program decisions.
Described herein is the biogram assay, key automation processes put into place to expand capacity, and examples highlighting the impact of HPLC biogram methodology on discovery programs, including one case study that ultimately led to an oral drug recently licensed for the treatment of chronic hepatitis C virus (HCV) infection.
Materials and Methods
Compounds (HTS hits) selected for further evaluation are typically supplied as dry solids in BD Falcon (Tewksbury, MA) 96 shallow custom plates, 0.5 µmol each, with an associated plate map for sample informatics tracking. The compounds in the sample plates are dissolved in 50 µL DMSO to make up 10-mM solutions, ready for HPLC fractionation. Each custom plate has a barcoded project identifier, which, upon entering into a proprietary internal network application, enables HPLC sample list creation based on the plate map and downstream data handling for the merging of chromatographic data and biological assay data.
Typically, for the HPLC-UV–mass spectrometry (MS) analysis, a 10-µL injection of the 10-mM DMSO solution is made by using a Waters SunFire C18 column (Waters Corporation, Milford, MA), 5 µm, 4.6 × 150 mm, or a Waters YMC Pro-C18 column, 5 µm, 4.6 × 150 mm. The mobile phase most commonly used is 10 mM ammonium acetate–acetonitrile 95:5 (A solvent)/10 mM ammonium acetate–acetonitrile 5:95 (B solvent) 85:15 (A:B) to 0:100 (A:B) over 25 min, held at 100% B solvent for 5 min, then returning to initial conditions over 2 min (32 min total) at a flow rate of 1.2 mL/min. Following the 32-min runtime, there is a 10-min reequilibration time, under initial conditions, prior to the next run.
The instrument used is a Thermo Fisher Scientific Inc. (San Jose, CA) Deca XP Plus LCQ LC-MS workstation, configured with a Finnigan Surveyor MS Pump Plus (version 2.4) and a Finnigan Surveyor photo diode array (PDA) plus detector (version 1.4) collecting data at a sampling rate of 5 Hz (UV detection typically at 254 nm, channel A). The autosampler is a Leap Technologies (Carrboro, NC) Model HTC, PAL1 software Cycle Composer version 1.5.2. The software used is Xcalibur (Thermo Fisher Scientific Inc.) Homepage version 1.4 SR1. The fraction collector, a Gilson 215 liquid handler (Gilson, Middleton, WI), runs independent of the Xcalibur software and uses contact closure activation following sample injection. The Gilson 215 fraction collection bed has capacity for up to 10 deep-well fraction blocks in a sample queue. Alternatively, a fully integrated liquid chromatography (LC)–MS system includes a Shimadzu Scientific Instruments (Columbia, MD) LC-MS workstation, configured with a Shimadzu LC-MS-2020 Detector (single quadrupole LC-MS with electrospray interface), Shimadzu LC-20AT dual-piston HPLC pumps (2), Shimadzu DGU-20A5R inline mobile phase degasser, and Shimadzu SPD-M20A photodiode array detector; CTC Analytics (Zwingen, Switzerland) IFC-PAL, analytical version; and dual-probe design (Autosampler and Fraction collector) PAL six-drawer, 12-microtiter plate stack. The fraction collection bed holds up to 20 blocks, with four horizontal rows of five blocks each. Software used is Shimadzu Lab Solutions version 5.53 SP3, with the Open Solution browser/walk up for the LC-MS-2020 and Instrument Control Solution 2.0.70.0 for the IFC-PAL injector/collector.
The LC-MS system is equipped with a passive stream splitter, such that the majority of eluent (~1.0 mL/min) is diverted to the fraction collector, and approximately 0.2 mL/min is diverted to the PDA and MS detectors. A total of 80 fractions are collected into Beckman Coulter (Brea, CA) polypropylene 96 deep-well plates (blocks) using a time-based protocol: 32-min run = 0.4 min/fraction. The elution order into each block is A1, B1, C1, . . . H1, then A2, B2, C2 . . . H2, and so on, continuing in this manner up to H10 (well 80). The control well 81 (A11) consists of a 10-µL aliquot of a 10-mM test compound in DMSO (unfractionated sample), topped off with 0.4 mL HPLC mobile phase (i.e., 85:15 [A:B], initial conditions). The solvent blank well 82 (B11) consists of 0.4 mL of the same HPLC mobile phase. Each compound run is thus associated with its own fraction block. Each fraction block is barcoded to facilitate downstream processing. Blocks are evaporated to dryness using Genevac (Ipswich, UK) HT-24 evaporators or under a nitrogen stream at room temperature. The dried deep-well blocks are then loaded onto an Agilent BioCel system (Agilent Technologies, Santa Clara, CA), where they are resolubilized with 40 µL DMSO using an Agilent Vprep. The sealed deep-well blocks are then placed on a VWR Vortex (VWR International, Radnor, PA) for 30 min at 1300 rpm to help wash compound from the sides of the wells of the deep-well blocks. The blocks are then placed in a centrifuge and spun down at 700 rpm for 1 min to recenter the aliquots for pipetting. The solubilized deep-well blocks are then placed back onto the Agilent BioCel for reformatting. The final plate format is specified per biological screening requirements. If a 1536-well plate is required, the deep-well block is transferred (via an Agilent Vprep) to an intermediate 96 shallow-well plate using Agilent 70-µL disposable tips. A separate protocol is then run using Agilent 30-µL disposable tips, and the shallow-well plates are then reformatted into 1536-well plates. If a 384-well plate is required, then the deep-well blocks are placed on the Agilent BioCel system and reformatted into a 384 shallow-well (Remp) plate. The plate maps are then uploaded using the log files generated on the BioCel. The reformatted plates are then distributed to the requestor. As a result of the sample well transfer and plate reformatting process, the test wells available for screening are at a maximum of 2.5 mM concentration in DMSO. Assays are generally run in triplicate, at a single test concentration, and the data are automatically uploaded into a proprietary internal screening database.
Results and Discussion
The HPLC biogram methodology has its origins in bioactive natural products discovery programs, such as in screening for antitumor agents and antibiotics in microbial fermentation broths. 1 Similar methodology has also been used for the analysis of combinatorial library mixtures. 2 In the present context, we further extend the use of biogram methodology to chemical validation of small-molecule screening hits and, in many cases, further investigation of bioactive components in key samples having unexplained or poorly reproducible biological activity. In a biogram analysis, C18 reverse-phase HPLC is generally used to effect the fractionation of any sample type or mixture of interest. While the mobile phase most often used in the initial biogram experiment is a 10-mM ammonium acetate-acetonitrile linear gradient (Materials and Methods), biogram experiments may employ alternate gradients and mobile phases as needed that optimize separation (i.e., 0.1% trifluoroacetic acid [TFA]–acetonitrile, methanol–10 mM ammonium acetate, etc.). The fraction collection uses a time-based protocol, resulting in a direct relationship between a well’s position in the plate and a corresponding area on the HPLC chromatogram. The final output is an HPLC-UV peak retention time versus bioactivity graphical overlay, including unfractionated starting sample as a control. In this manner, the functional bioassay serves as an additional detector. The biogram methodology can be applied to any sample of interest, including, but not limited to, synthetic HTS hits, advanced lead compounds, compounds that contain impurities of any type, crude active mixtures, profiling of active drug metabolites from in vivo biological matrices, 3 racemic mixtures on chiral HPLC, and so on. The principal theme is bioassay-guided isolation of active component(s) in a sample to determine the source of bioactivity in the sample. Requirements for success include sufficient compound availability and potency, as well as a robust bioassay to ensure a sufficient signal-to-noise ratio for interpretation of results. If possible, it is helpful to be aware of any false positives associated with a given assay (i.e., detergents, pigments, metal ions, etc.). It is also critical for each compound fraction block to contain control samples (unfractionated compound and HPLC solvent blank).
Primary Workflow—Biograms as an HTS Hit Confirmation Strategy
The overall process, depicted in Figure 1 , requires seamless coordination and collaboration across departments and disciplines. The process combines semi-preparative separation technologies, automated compound handling and distribution, high-throughput biological screening, and informatics support. The process starts with a list of compounds selected by early phase discovery program working groups for further evaluation by biogram analysis, following the usual hit triaging steps involving potency criteria, selectivity, and chemotype tractability. The compound list, typically ranging from 10 to 75+ compounds per program per experiment, is queried for inventory within the internal corporate compound repository. For best results, we have found that the ideal sample concentration for biogram analysis is 10 mM in DMSO. This ensures a robust biological signal for the sample under evaluation, particularly for hits of modest potency in the single- to double-digit micromolar IC50 range. Compounds provided dry in plate format are solubilized in DMSO and subjected to HPLC, and the resulting 80 fractions are dried, reformatted as described in Materials and Methods, and submitted for biological screening.
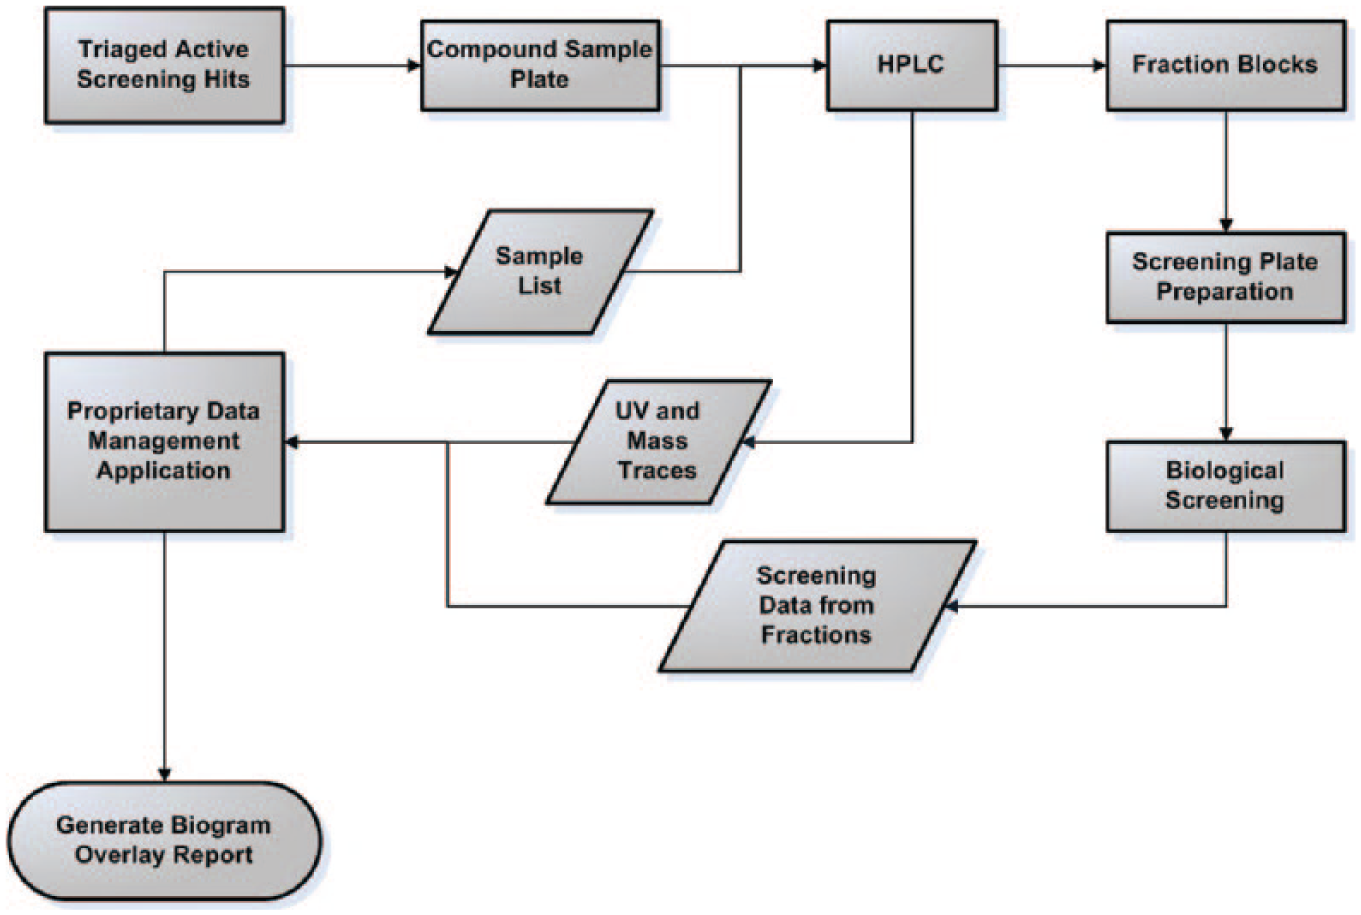
HPLC Biogram (Bio-Activity Chromatogram) process. Prioritized screening hits after initial triaging steps or lead compounds requiring further evaluation are subjected to high-performance liquid chromatography (HPLC) fractionation into 96 deep-well fraction blocks. All fractions are dried and resuspended in DMSO, and screening plates are prepared for biological assay (high-throughput screening). The data management application facilitates HPLC sample list creation and is a repository for HPLC-UV and bioactivity data. The latter two data sets are merged by the tool to create a biogram overlay report.
Data are visualized by overlay of the HPLC-UV chromatogram (time-response pairs) with the bioassay data (time-response pairs), which can be done by using Microsoft Excel (Microsoft Corp., Redmond, WA) or any similar tool. For higher throughput utility, a proprietary in-house data management tool consisting of a web application, web services, Windows services, and an Oracle database is used to create similar overlays. This tool manages collection and processing of the LC-MS data, from work list generation to raw data processing and analysis. The tool also imports the single-point biological assay data from the fraction plate and processes it for display as a graphical overlay on the chromatogram. In addition, the unfractionated control data point appears on the y-axis ( Fig. 2 ). This allows the user to rapidly analyze each sample and to determine which component(s) in the sample are responsible for the biological activity. The user then categorizes the results into one of three major categories: PASS, CAUTION, or FAIL. The final results, along with the raw data, are stored in the database, and a report is generated for the user.
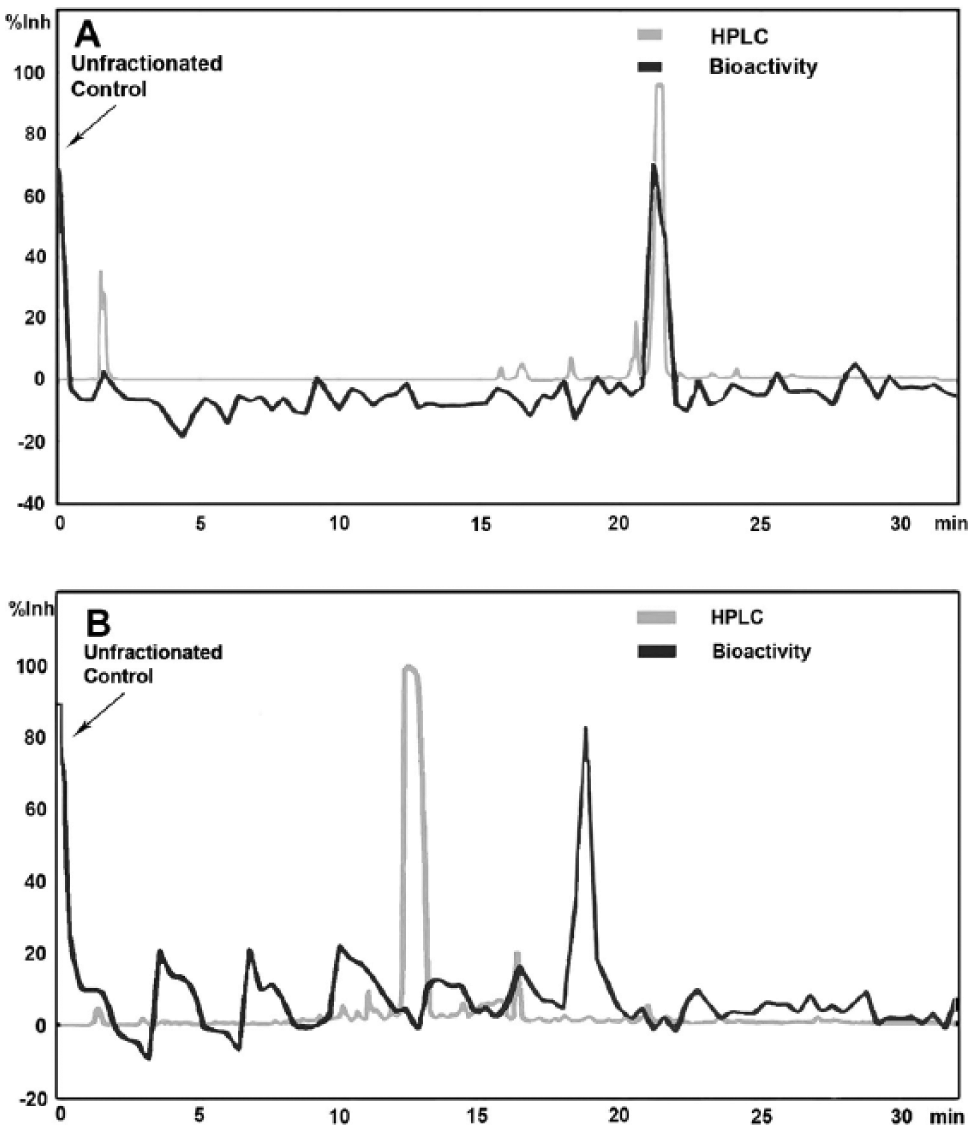
Examples of biogram overlays of high-performance liquid chromatography (HPLC)–UV and bioactivity data. Unfractionated compound (positive control) shown on y-axis. (
The primary use of the HPLC biogram assay in this context is to confirm that the target compound is responsible for the observed activity in the HTS assay. Biogram analyses are typically run on samples that have already passed initial criteria such as repeat measurement in the primary assay, satisfactory dose-response analyses, counterscreen data for selectivity, and structural integrity analyses. Researchers requesting biogram analyses after confirming activity in the above triaging steps do so to verify that the chemical structure associated with the active hit, rather than some unknown or artifactual impurity, is indeed the source of biological activity.
Shown in Figure 3 for illustration purposes is an average of results observed using HPLC biogram analysis for >50 screening targets over a 4-year period. A “PASS” sample is one where the HPLC-UV peak corresponding to the test compound strongly correlates with target bioactivity ( Fig. 2A ), representing approximately 40% of all HTS hits evaluated for multiple programs. Samples in the “CAUTION” category cover many scenarios and include samples where biological activity aligns with a minor (nontarget) peak or has multiple regions (peaks) of activity, activity aligns with HPLC solvent front, activity aligns with UV baseline (no peak detected), or activity is weak ( Fig. 2B ). As shown later, sometimes the “CAUTION” sample data provide the greatest opportunity, since they can lead a discovery program into new and unforeseeable directions. A “FAIL” sample is one where there is no distinct region of biological activity upon fractionation. The resulting bioactivity overlay most typically appears as a flat line (not shown). This may be due to irreversible binding of the active component to the HPLC column or, more commonly, to artifactual activity in the original assay, for example, activity due to lipophilic impurities such as plasticizers in the sample.4,5 In some instances, a “FAIL” is due to no target present in the sample (i.e., sample is badly degraded).
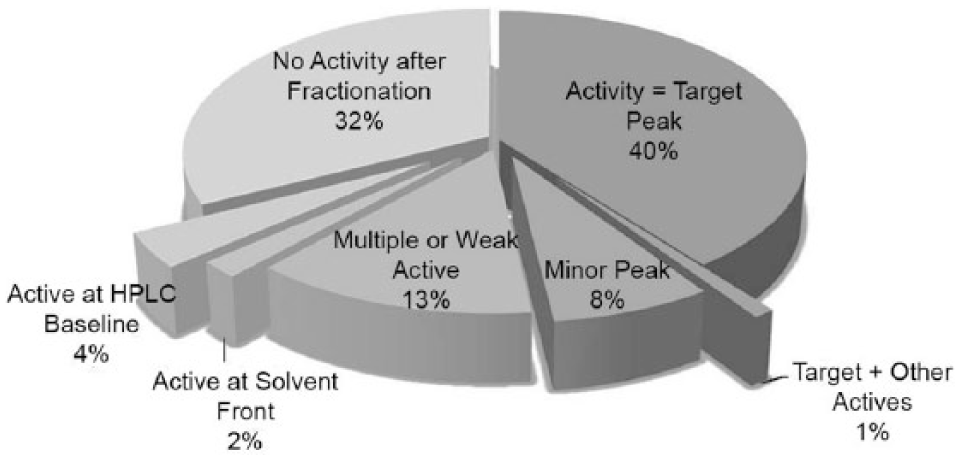
The pie chart reflects an average of results observed using the high-performance liquid chromatography (HPLC) biogram analysis for >50 screening targets over a 4-year period. PASS samples = activity aligns with target peak = chemically validated; CAUTION samples = distinct activity not aligned with target peak, or multiple regions of activity, or marginal activity; FAIL samples = no distinct area/peak of activity following HPLC fractionation.
In this overall approach, the HPLC biogram process serves as a further hit triaging tool. This provides discovery teams with important information for program decision making, allowing teams to rapidly focus on validated hits, with the incidental benefit of resource cost avoidance on the false hits. As a result, the importance of biogram data is often critical, especially in support of early phase discovery programs that have aggressive timelines.
Investigation of Unknown Biological Activities Using Biograms: Examples
As stated in the Introduction, the biogram assay is a very powerful tool used to investigate biological activity in atypical (i.e., “CAUTION”) samples. On numerous occasions, we have observed that the original or first synthesized lot of a new compound may exhibit the desired biological activity, whereas the later resynthesized lots are devoid of activity. Sometimes the biological activity will correlate with a minor impurity or degradant(s), the HPLC solvent front, or with no visible peak at all. Regarding the latter, the coupling of HPLC with a functional bioassay allows one to detect potent biologically active substances in crude matrices that are not readily detectable by physical methods, such as HPLC-UV or LC-MS. In several instances, the unknown active peak, having the desired profile of biological activity, is targeted for isolation, structural elucidation, and follow-up studies based on expressed level of interest by the discovery teams. The following examples illustrate how the biogram assay was employed to track and identify the source of biological activity in such samples and how this has affected their respective programs.
TFA trimer impurity in solvent front
Two test compounds from a compound library were shown to be active against an infectious virus enzyme target screen, yet the resynthesized compounds were inactive. The active lots were selected for biogram analysis to determine the source of bioactivity. The samples were subjected to the general 32-min biogram method using a 0.1% TFA-acetonitrile gradient. No activity was observed to correlate with the target UV peaks. However, in both cases, strong activity was shown to correlate with the HPLC solvent front, having no apparent UV peak. Samples of the active wells (solvent front peak at 1.6 min) in both samples were shown by LC-MSn analysis to consist of a TFA trimer species, m/z 395 by negative ion electrospray ionization (ESI)–MS. This ion was detected only in the active wells. The conclusion was that these hits were false positives in the enzyme screen, and they were removed from the pool of potential candidates.
Nicotinic acid impurity in solvent front
Five screening hits derived from a compound library were shown to be active in a proprietary G protein–coupled receptor (GPCR) screen. The compounds were selected for biogram analysis to confirm the source of bioactivity. The samples were subjected to the biogram method again using a 0.1% TFA-acetonitrile gradient. In four of five compounds evaluated, strong activity was observed in the HPLC solvent front and not the target UV peak, suggestive of a common weak/non-UV impurity peak. Follow-up LC-MS analysis of the active wells revealed trace amounts of nicotinic acid, having positive ESI-MS ion at m/z 123, a common impurity from the library synthesis procedures used. As nicotinic acid was a known active compound in the target screen of interest, subsequent hits were analyzed for the presence of nicotinic acid and positives removed from the pool of potential candidates.
Potent trace oxazinone impurities in HTS hits
HPLC biogram analysis was conducted on two urea derivatives that were active in an HTS directed against a CNS-expressed serine hydrolase. The samples were subjected to biogram analysis using 10 mM ammonium acetate–acetonitrile gradients. Both samples appeared to be highly pure by HPLC-UV (>95% target compound) but also contained trace impurities. Subsequent bioassay of the fractions from both compounds revealed activities associated with the later eluting, trace impurity peaks. The active impurity peaks in both compounds displayed identical UV spectra highly characteristic of the oxazinone ring system. This compound class is known to function as potent serine hydrolase inhibitors, and the conclusion was made that these oxazinone impurities (most probably generated during the course of the syntheses of the hit compounds) were principally responsible for the observed activities. This finding allowed the chemistry team to redirect efforts toward other, more tractable hit series.
Identification of a trace dimer impurity that ultimately led to the HCV clinical candidate daclatasvir
Details of the account in which the biogram assay enabled the discovery of a dimeric degradation product after incubation of a lead HCV NS5A inhibitor in assay medium, paving the way toward discovery of the HCV clinical candidate BMS-790052 (daclatasvir), were recently published.6,7 Briefly, it was observed that the lead compound BMS-824 6 degraded to several species upon incubation in cell culture media, yet the desired biological activity profile of BMS-824 in the cell-based replicon bioassay remained unchanged. 7 The main degradation products were identified, synthesized, tested, and shown to be inactive. This triggered an investigation to identify the biologically active species. HPLC biogram fractionation of a sample of BMS-824 incubated in media revealed that the most active fractions could readily be separated from the parent compound BMS-824 and yet retained the biological profile of unfractionated BMS-824. In the initial biogram result, HCV NS5A replicon activity correlated with UV baseline, reproducibly eluting after parent BMS-824 on the C18 HPLC column using a 0.1% TFA-acetonitrile gradient. Two essential sample enrichment steps from the cell culture media finally enabled the HPLC-UV detection and isolation of two very minor UV peaks that correlated with HCV NS5A replicon inhibitory activity. From mass spectral and nuclear magnetic resonance (NMR) data, the active species was determined to be a symmetrical dimer of BMS-824, derived from an intermolecular radical-mediated reaction of the parent compound. Based on an analysis of the structural elements of the dimer deemed necessary for anti-HCV activity, the stilbene derivative BMS-346 was synthesized ( Fig. 4 ). This provided the foundation for further optimization through medicinal chemistry efforts and design of more potent inhibitors with broad genotype inhibition, culminating in the identification of BMS-790052, the clinical drug candidate daclatasvir, indicated for the treatment of chronic HCV infection that was recently licensed in Japan.8,9
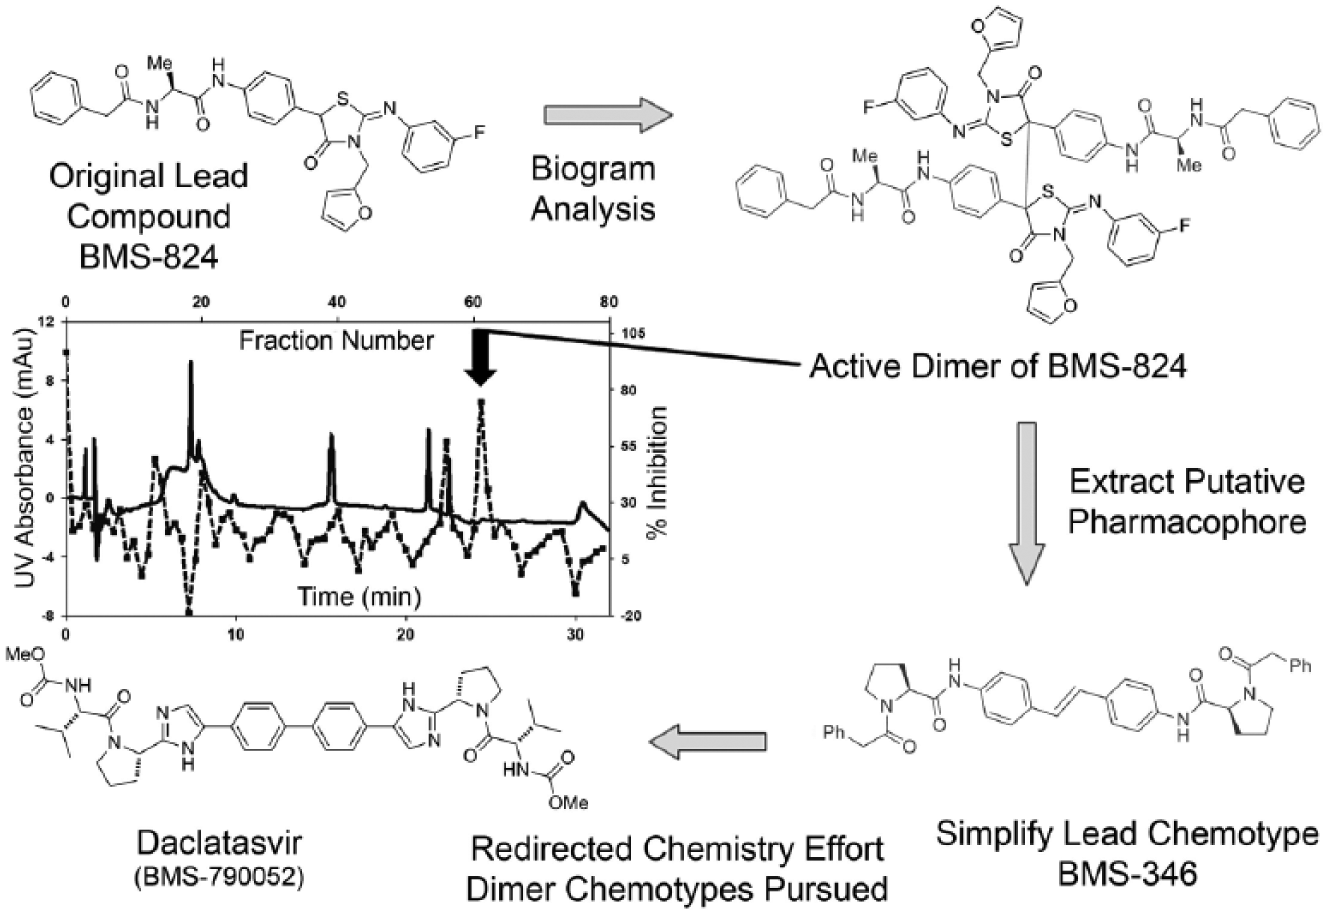
Biogram analysis of hepatitis C virus (HCV) NS5A lead → discovery of daclatasvir. Shown in a clockwise sequence of events, the biogram assay was instrumental in identifying a trace dimeric impurity in the lead HCV NS5A inhibitor BMS-824, which ultimately paved the way toward the HCV clinical candidate daclatasvir. Solid line, high-performance liquid chromatography (HPLC)–UV trace; hash line, bioactivity trace.
In conclusion, we have developed a very useful and powerful hit confirmation strategy that couples analytical HPLC data with functional bioassay data. It is used primarily for screening hit chemical validation and triaging in support of early phase discovery programs. Furthermore, we have expanded capacity by use of proprietary informatics tools for project creation, sample list generation, importation of HPLC data and retrieval of biological data to generate the graphical overlay report, robotics for running large queues of samples, and robotics for plate dispensing and reformatting to meet the requirements of HTS. In addition, we have demonstrated the impact of HPLC biogram methodology on drug discovery programs, most notably one that ultimately led to discovery of the oral anti-HCV drug daclatasvir.
A recent article by Davis and Erlanson 10 contains a highly relevant quote: “Although it may seem paranoid, it is probably safest to assume any hit is guilty of being an artifact until proven innocent.” The biogram approach described herein addresses the above concern in large part by confirming the source of biological activity in screening hits, thus affording discovery teams a greater degree of confidence that their chosen hit is real and chemically progressible. In addition, we are confident that biogram methodology can be used to quickly flag the nonhits, even those showing high purity by LC-MS–based structural integrity assays that also contain biologically active, UV transparent impurities that elute with HPLC solvent front, such as TFA trimer, nicotinic acid, or even inorganic metal ions such as tin or zinc. 11 We have also shown that biogram methodology can be used to track and identify the source of biological activity in atypical samples that may indeed provide opportunities for scientific breakthrough and ultimately success in drug discovery.
Footnotes
Acknowledgements
The authors gratefully acknowledge support from Robert Gentles, Michael Lawrence, Michael Poss, Jeffrey Romine, and Nicholas Meanwell of Discovery Chemistry; Kurt Edinger and Ying Li from the Synthesis and Analysis Technology Team; Dieter Drexler and Joseph Cantone of Discovery Analytical Sciences; Chris Baglieri, Steve Hoffman and Nelly Masias for informatics support; and the BMS Virology, Lead Discovery Screening, Lead Evaluation, and Compound Management teams.
Declaration of Conflicting Interests
The authors declared no potential conflicts of interest with respect to the research, authorship, and/or publication of this article.
Funding
The authors received no financial support for the research, authorship, and/or publication of this article.