
Abstract
DNA-encoded library (DEL) technology has become a prominent screening platform in drug discovery owing to the capacity to screen billions or trillions of compounds in a single experiment. Although numerous successes with DEL technology have been reported, we are unaware of a rigorous examination of the many different variables that can influence a screen’s success. Herein, we explore the impact of variable sample sequencing depth on the detection of tool compounds with known affinities toward a given target while simultaneously probing the effect of initial compound input. Our sequencing data confirm reports that high-affinity compounds can be discovered directly from a DEL screen, but we demonstrate that a mismatch between selection output and sequencing quantity can obscure useful ligands. Our results highlight the importance of selection coverage in grasping the entire picture of a DEL screen where the signal of a weak or underrepresented ligand may be suppressed by the inherent noise of a selection. These potential missed ligands may be critical to the success or failure of a drug discovery program.
Introduction
DNA-encoded library (DEL) technology has proven to be a robust screening platform in drug discovery, enabling the efficient interrogation of diverse chemical matter against a given target with the use of affinity selection and next-generation DNA sequencing. Since its introduction to the scientific community nearly three decades ago, 1 both industrial and academic organizations have been utilizing encoded library technology for drug discovery, with a significant increase in hit identification and lead development from DEL selections in recent years.2–8 The utility of the technology is demonstrated not only by the inception of clinical candidates derived from DEL screens9,10 but also by the added benefit of exploring target ligandability 11 or identifying tool compounds. 7
The majority of recent DEL-focused publications have concentrated on presenting library synthesis or disclosing new ligands. While these reports have a significant impact on the advancement of DEL technology, there has been little rigorous examination of the actual screening process. Screening of DNA-recorded synthesis libraries is an attrition process: incubation of libraries with an immobilized target of interest, followed by elimination of nonbinders and subsequent elution of binders.12,13 Within this process, there are many variable elements that can impact the results that are attained ( Fig. 1 ). For example, the target concentration within a selection can be varied and affect the enrichment values from sequencing analysis that guide follow-up chemistry decisions. Cuozzo et al. demonstrate the influence of target concentration on their results by performing parallel DEL selections that yield specific enriched molecules at high versus low target concentrations. 14 Not only do variable parameters exist within the affinity selection protocol itself, but also there are different methods for sample preparation and subsequent sequencing, such as the number of unique molecules sequenced from a selection, that can affect the results that are attained. We have chosen selection coverage as an essential variable for preliminary examination. By understanding the capability of selection coverage to influence results, we enable a rigorous examination of the entire process.
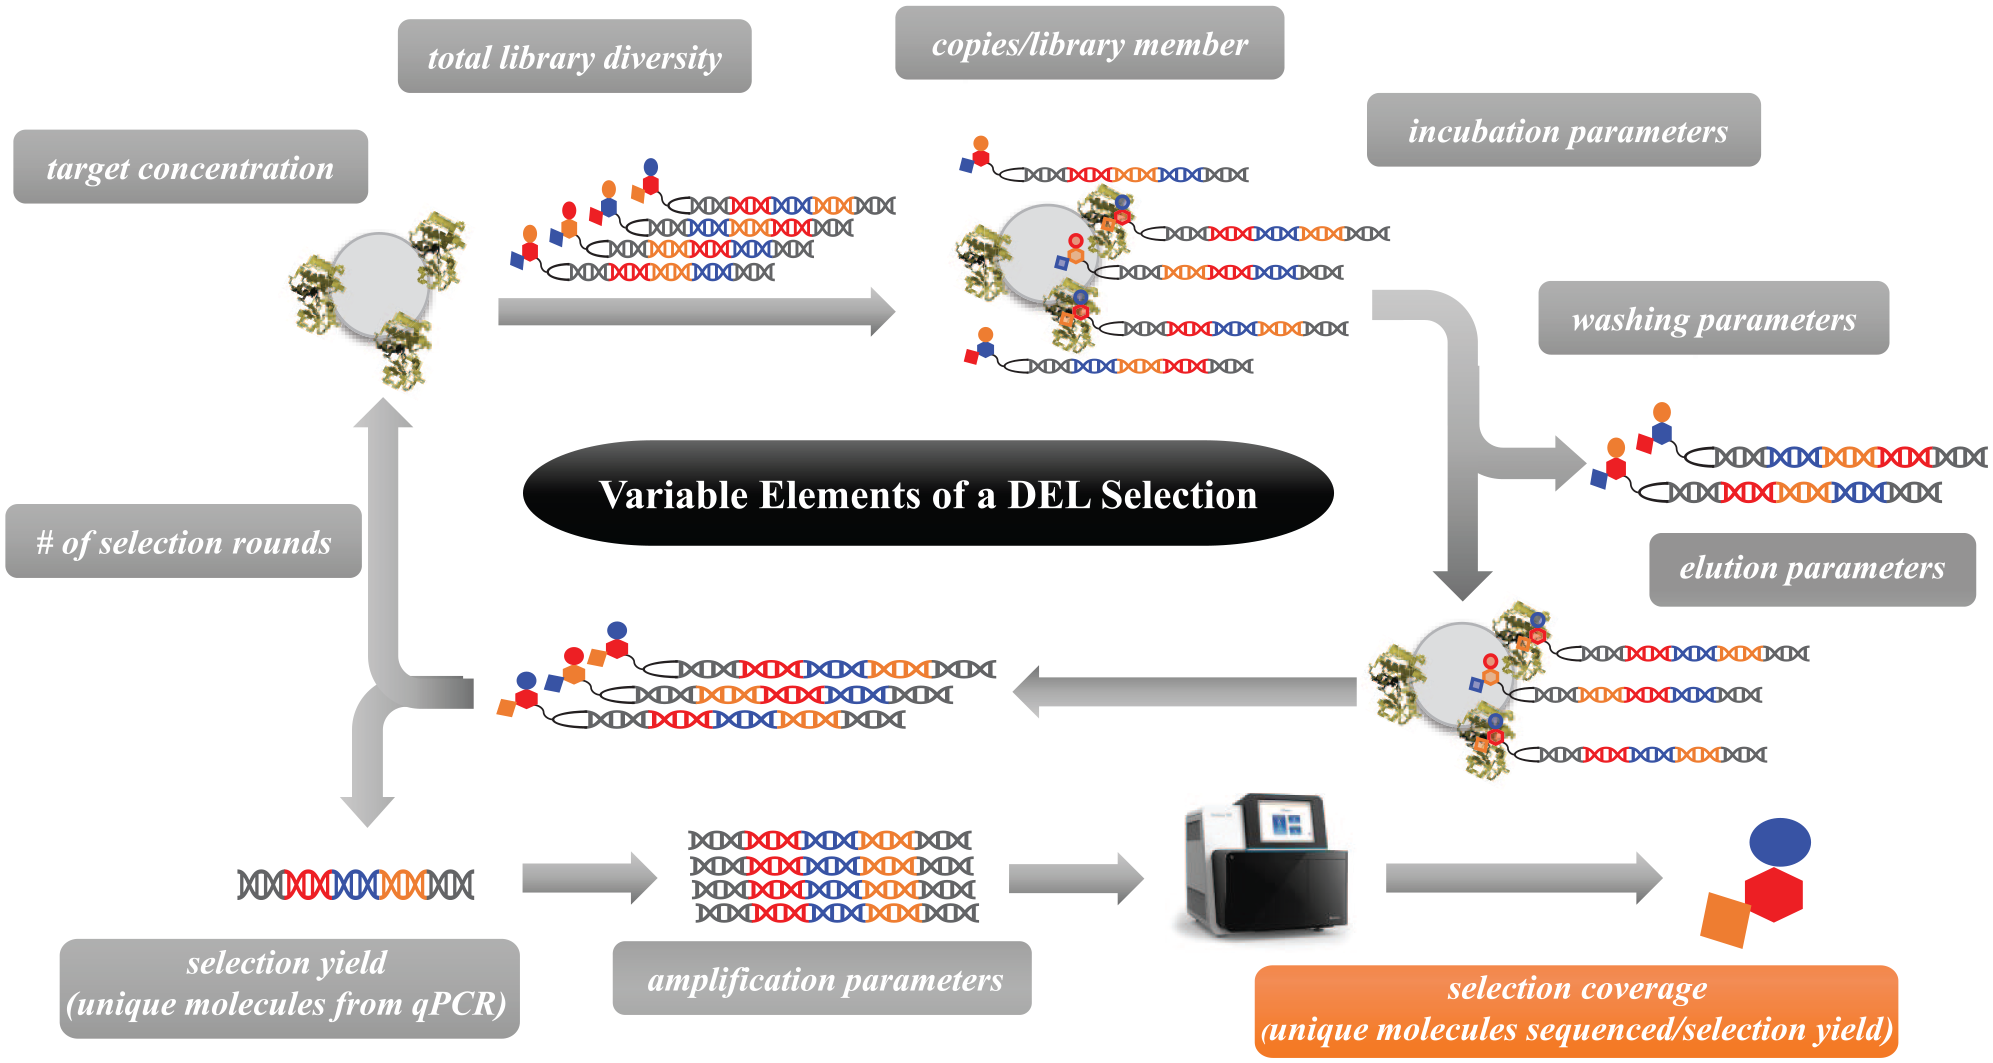
Illustration of the variable elements of a DEL selection. The results presented here demonstrate the impact of selection coverage (highlighted in orange) on sequencing results.
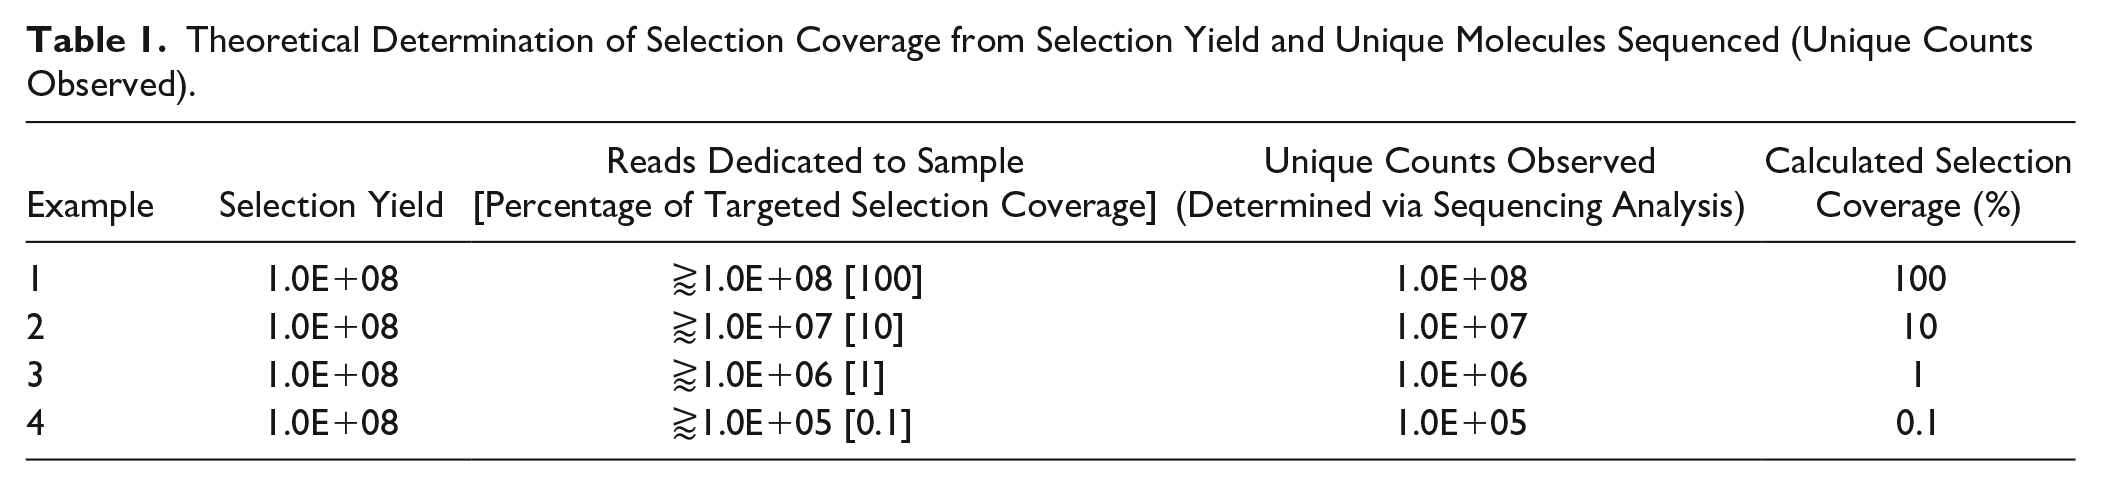
Although it is widely recognized that high-throughput sequencing allows for the identification and relative enrichment of binding molecules present in a selection, 15 the impact of sequencing depth on the ability to discover ligands has yet to be reported. In the literature, sequencing depth, or number of reads dedicated to a given sample in a sequencing run, is often very low in comparison with selection yield or simply not reported. We define this percentage of unique sequenced molecules in relation to molecules isolated directly from a selection as selection coverage. Selection coverage employs the unique DNA molecules that are sequenced to account for amplification artifacts and directly relates the sequencing results back to the selection results. For example, say the selection yield of a given sample is 1E+08 DNA-encoded molecules. To achieve 100% selection coverage, greater than 1E+08 reads on a given sequencing run must be dedicated to that specific sample to achieve 1E+08 unique sequences upon data analysis. If the analysis revealed that 1E+07 unique DNA molecules were sequenced from that sample, the sample received 10% selection coverage ( Table 1 ).
Theoretical Determination of Selection Coverage from Selection Yield and Unique Molecules Sequenced (Unique Counts Observed).
Herein, we explore the effect of selection coverage on the detection of tool compounds with varying known affinities toward bromodomain-containing protein 4 (BRD4), an internal drug discovery target. It has been previously reported that high-affinity ligands for a model protein can be detected via sequencing within the context of a small library (~3E+05 compounds) when sufficiently represented (>104 copies/library member) in the input. 16 Our sequencing data reported here confirm these findings within the context of a larger library (>1E+08 compounds) and additionally demonstrate how the amount of selection coverage for a given sample can determine whether or not lower-affinity ligands, such as those with micromolar affinity, can be detected. These lower-affinity ligands could in fact be an excellent medicinal chemistry starting point, particularly when probing a difficult target.
Furthermore, we show that ample selection coverage is important because although robust DNA-compatible chemistries exist, 17 the libraries exploited in DEL selections are inherently imperfect due to highly variable yields of both the small-molecule synthesis and DNA tag ligation. These variable yields, along with the formation of by-products, which often cannot be identified or removed, lead to an uneven representation of input molecules. 12 While experimental and computational methods have been reported to alleviate the influence of imperfect synthetic yield,18–20 these inconsistent reaction yields can lead to high false-negative rates and poor correlations of enrichment to target affinities. 21 Exploiting the intentional uneven representation of the BRD4 tool compounds in comparison with library molecules within a selection, we show how having ample selection coverage can expose information that would otherwise be lost. With the growing interest in DEL technology to accelerate drug discovery, it is imperative that the role of selection coverage in impartial hit identification via sequencing is fully investigated. Our results from internal drug discovery research highlight the importance of selection coverage in grasping the entire picture of a DEL screen where a weak or underrepresented ligand may be hiding in the noise.
Materials and Methods
Reagents and building blocks for tool compound synthesis were purchased from various commercial sources and used as supplied. Amicon Ultra centrifugal filters were purchased from Millipore Sigma (Burlington, MA). Oligonucleotide tags were designed and subsequently ordered from IDT (Coralville, IA). High-performance liquid chromatography (HPLC) separations were performed on a Thermo Scientific Vanquish UHPLC with LTQ XL Mass Spectrometer (Thermo Scientific, Waltham, MA), and a Waters Acquity Oligonucleotide BEH C18 2.1 (Milford, MA) × 50 mm, 1.7 µm column at 60 °C, with a gradient of 10%–40% B, over 5 min. The HPLC buffer system was (A) 8.6 mM triethylamine and 100 mM hexafluoroisopropanol (pH = 8.2) and (B) 50/50 mobile phase A/acetonitrile. AMPure XP beads for final ligation purification were purchased from Beckman Coulter (Indianapolis, IN). Quantification of tool compound DNA was performed on a Roche LightCycler 480 quantitative PCR (qPCR; Indianapolis, IN) instrument via standard curve generation. The BRD4 protein for affinity selections was purchased from Reaction Biology (Malvern, PA) at >95% purity with an N-terminal His-tag and immobilized on HisPur Ni-NTA magnetic beads purchased from Thermo Scientific. Components for selection buffer (50 mM HEPES, pH 7.5, 0.01% Triton X-100, 0.5 mM glutathione, 150 mM NaCl, 25 mM imidazole, and 0.1 mg/mL sheared salmon sperm DNA) were purchased from various vendors and used as supplied. The same buffer was used for biochemical activity assessment except with the addition of 0.01% bovine gamma globulin (BGG) and 0.005% bovine serum albumin (BSA) and removal of salt, imidazole, and salmon sperm DNA. Nuclease-free water was used in the DEL selection and purchased from Boston BioProducts (Ashland, MA). The BRD4 protein for activity assessment was purchased from BPS Bioscience (San Diego, CA) at >96% purity with an N-terminal GST tag. The probe and anti-GST antibody for IC50 determination were purchased from New England Peptide (Gardner, MA) and Cisbio (Bedford, MA), respectively. Assay reagents were dispensed via a Labcyte Echo 555 Liquid Handler (San Jose, CA) or Thermo Multidrop Combi Reagent Dispenser, and Corning 1536-well plates (Corning, NY) were read on a BMG Labtech PHERAstar FS microplate reader (Ortenberg, GER). DNA sequencing was accomplished on an Illumina NextSeq 500 system (San Diego, CA) with a NextSeq 500/550 High Output Kit v2.5 (150 cycles).
Synthesis of Tool Compounds
Three on-DNA compounds, CMPD1–CMPD3, were synthesized to assess as tool molecules within the context of an affinity selection. CMPD2 was originally selected from a three-cycle DEL that was screened against BRD4. CMPD1 and CMPD3 were designed by traditional hit-to-lead chemistry follow-up efforts after confirming off-DNA activity of CMPD2. For the generation of all three on-DNA tool compounds, we followed the exact stepwise chemistry conditions used in the library synthesis that yielded CMPD2. Cycle 1 was a tert-butyloxycarbonyl (Boc) and fluorenylmethoxycarbonyl (Fmoc) protected diamino acid that was acylated onto a primer-elongated AOP headpiece (1 mM in 250 mM sodium borate buffer, pH 9.5) using standard DMT-MM conditions. Upon ethanol precipitation, the DNA pellet was dried and suspended at 1 mM in water. Neat piperidine (10%) was added and the samples were incubated at 23 °C for 60 min to allow for Fmoc removal. Following Fmoc deprotection, the samples were subjected to ethanol precipitation. The DNA pellet was dried, suspended at 0.5 mM in water, and spin filtered with Amicon Ultra 3K filters with repeated water washing. The material was suspended at 1 mM in borate buffer (pH 9.5) and subjected to cycle 2 chemistry. Cycle 2 building blocks were acylated onto the resulting deprotected amine using standard DMT-MM chemistry. Upon ethanol precipitation, the DNA pellet was dried and suspended at 0.25 mM in borate buffer (pH 9.5) for Boc deprotection. The samples were heated at 90 °C for 12 h. Following Boc removal, the samples were subjected to ethanol precipitation. The DNA pellet was dried, suspended at 0.5 mM in water, and spin filtered with Amicon Ultra 3K filters with repeated water washing. The material was suspended at 1 mM in borate buffer (pH 9.5) and subjected to cycle 3 chemistry. Cycle 3 building blocks were acylated onto the resulting deprotected amine using standard DMT-MM chemistry. Ethanol precipitation gave the crude products, which were further purified by reverse-phase HPLC to give the desired products. Prior to selection, 100 nmol aliquots of the three tool compounds were ligated with DNA tags using T4 DNA ligase. Each tool compound received a unique DNA tag to identify the identity of the compound prior to closing primer ligation.
Eight unique oligonucleotide closing tags were ligated to the tool compounds in a concentration-dependent manner. Accordingly, a 1 mM stock of annealed tag 1 was generated in water along with a 10-fold serial dilution of the succeeding tags, resulting in tag 2 at a 10× dilution of tag 1 (100 µM) and tag 8 at a 1E+07 dilution of tag 1 (0.1 nM). Equal volumes of each diluted oligonucleotide tag were combined, resulting in a final concentration of 139 µM. Each ligation was performed with a 2:1 ratio of closing tag to tool compound using T4 DNA ligase. Ligated samples were subjected to AMPure XP bead purification (2:1 ratio), eluting with water, and each closed compound was subjected to quantification via qPCR.
Determination of IC50 Values
A homogeneous time-resolved fluorescence (HTRF) assay 22 was exploited to determine the IC50 values of compounds on and off DNA using FAM-labeled histone H4 peptide (1–21) K5/8/12/16Ac as the probe and anti-GST-Tb as the donor-labeled antibody. Compound (20 nL) was dispensed in triplicate by Echo into 1536-well plate in a dose-dependent manner with a top concentration of 33 µM for off-DNA molecules and 6.6 µM for on-DNA molecules. BRD4 was dispensed by Combi into wells to yield a final assay concentration of 2.5 nM. H4 peptide probe and anti-GST-Tb were dispensed simultaneously by Combi into wells to yield final assay concentrations of 50 and 0.5 nM, respectively. Plates were read on a BMG microplate reader in the time-resolved format by exciting the sample at 337 nm and reading emissions at 520 nm and 490 nm, using a 60 µs delay and a 400 µs read window. Data analysis was performed using the HTRF ratio (520 nm/490 nm emission) and plotted as percent inhibition versus concentration.
Affinity Selection against Protein Target
The selection against BRD4 was initiated with a pool of libraries containing a diversity of approximately 1E+09, each represented at 1 million copies in the initial input. Tool compound samples, existing as a concentration gradient, were spiked into the library pools, with the highest amount being 100× library member (1E+08 copies) down to 0.00001× library member (10 copies). The DELs (200 µL total volume) were incubated with the protein in solution for 45 min. A no-target control, lacking the protein in solution, was performed in parallel. The molecule-bound protein was captured instantaneously on NiNTA beads (50 µL of a 50% slurry, washed 1× with selection buffer) via brief vortexing and exposure to a magnetic separation rack. Unbound molecules were discarded via supernatant removal. Protein-bound beads were washed once for 30 s with 1 mL of buffer at room temperature. Bound molecules were eluted from the protein into solution via heating at 80 °C for 10 min. This selection process was repeated for a total of two rounds. The sample was subjected to 14 PCR amplification cycles, determined via an internally developed algorithm, to sufficiently add on necessary primer sites for Illumina sequencing, without overamplifying the sample. All parameters described above were chosen to achieve a sample that was optimal for the sequencing and evaluation of selection coverage.
Analysis of DEL Selection Data
Illumina sequencing data were processed using a custom data analysis pipeline that has been optimized for our DNA constructs and experimental design. Illumina BCL read files were demultiplexed and converted to FASTQ files using BCL2FASTQ V2.20. 23 The FASTQ sequences were processed and divided into the specific coding regions defined by the library encoding structure using fuzzy pattern matching that allowed for up to one insertion or deletion per code. The subdivided DNA sequences were decoded into the identifiers of the known inputs to the library, with error correcting enabling nonperfect matches within an edit distance of 1. Each sequence additionally contains a unique molecular identifier (UMI) that is used to determine whether the specific decoded sequence represents a copy of the input molecule or a duplicate generated during PCR amplification or sequencing. As we have previously disclosed, 20 aggregation and counting of the decoded sequences uses the UMIs and a graph-based counting method similar to that of Smith et al. 24 to minimize any potential overcounting arising from PCR or sequencing-based duplication and/or errors. This allows us to report unique counts observed, eliminating amplification artifacts from the data. All possible n-synthons are treated as distinct library members, and counts were aggregated appropriately. Additionally, noise calculations were performed with the assumption that the expected population of each library could be modeled using the binomial distribution and determining the critical binomial for p < 0.001 with Bonferroni correction. 25
Results
Tool Compound Generation and Biochemical Analysis
Three tool compounds, CMPD1–CMPD3, were synthesized on DNA incorporating proper primer sites for qPCR and Illumina sequencing in conjunction with a unique DNA tag to identify each compound. CMPD2 was discovered from screening a 200-million-member DEL library against BRD4 and exhibits a submicromolar IC50 on and off DNA in an HTRF-based biochemical assay. Traditional hit-to-lead modifications produced CMPD1 and CMPD3, low-nanomolar and micromolar inhibitors not present in the library, respectively ( Suppl. Fig. S1 ). Encoded compounds were ligated to a mixture of eight unique tags, each a 10× serial dilution of the prior tag, creating a concentration ladder to assess the effect of compound representation in the input on detection ( Fig. 2 ).
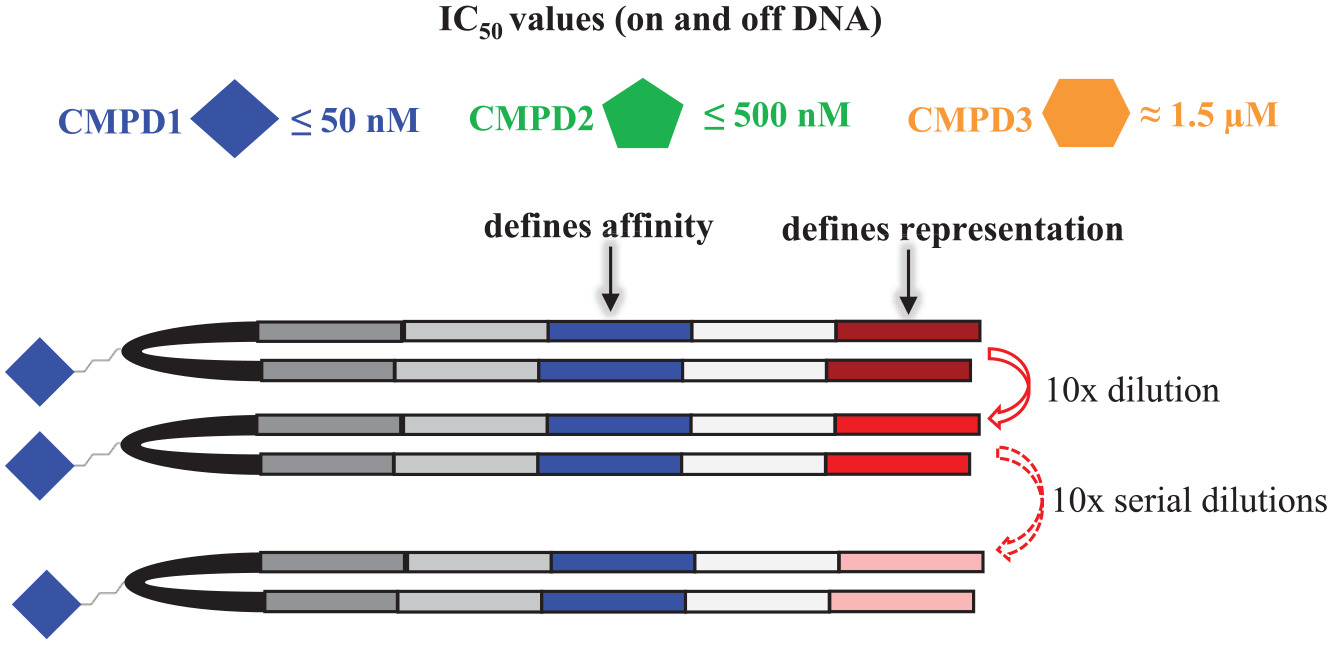
Depiction of tool compound tagging based on affinity and representation for detailed sequencing analysis.
Selection of Tool Compounds Spiked into a Pool of DELs
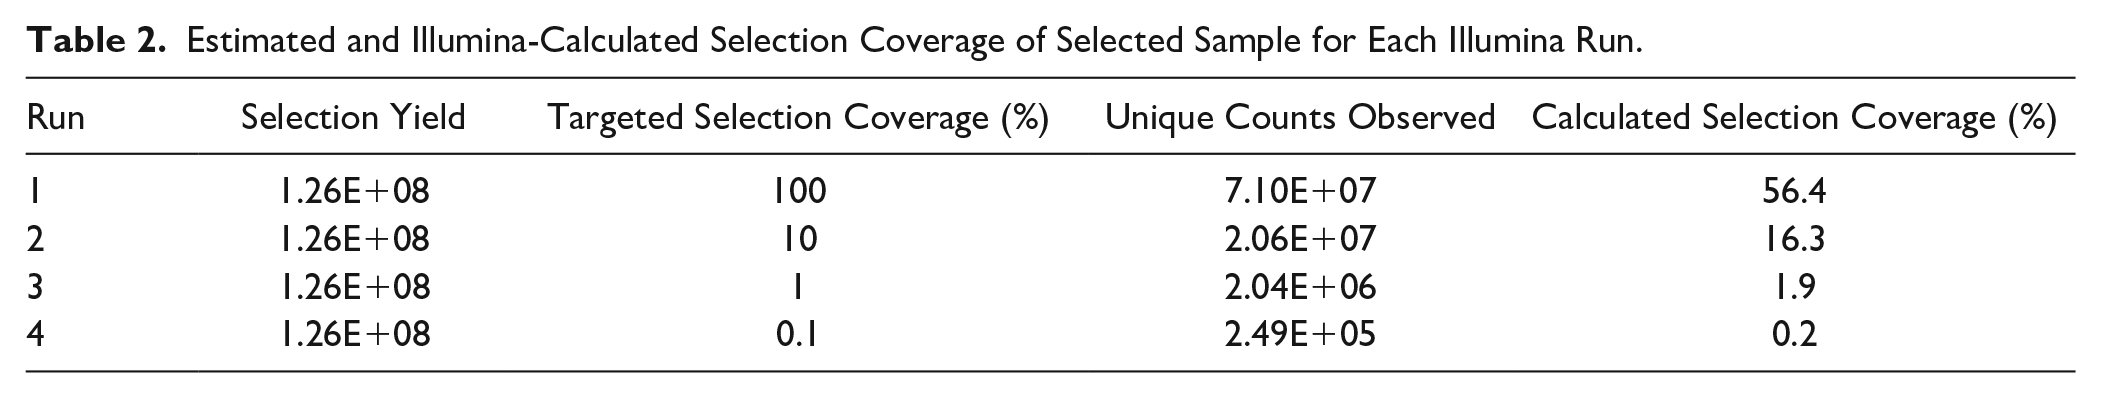
A screen was initiated against 1 µM of the known target, BRD4, with a pool of DELs consisting of approximately 1E+09 encoded compounds, each represented at 1 million copies, and the tool compounds spiked in. The target concentration was chosen due to the relative affinities of the tool compounds being explored. With the tool compounds representing a mixture of concentrations, each was present in the selection from up to 100× library member (1E+08 copies) down to 0.00001× library member (10 copies). After two rounds of affinity selection, the selection yield was determined via qPCR analysis. Molecule copies and selection rounds were chosen based on acquiring a selection yield of approximately 1E+08, which can be effectively sequenced by an Illumina NextSeq 500 system with a high-output flow cell configured for 400 million single reads. The postselection sample was subsequently subjected to PCR amplification to prepare for Illumina sequencing. The output was subjected to four separate Illumina sequencing runs, each devoting a certain number of clusters on the flow cell to achieve estimated selection coverages from 0.1% to 100%, based on the qPCR-determined selection yield ( Table 2 ). Upon sequencing, the actual selection coverage was calculated by dividing the total unique counts observed in the run by the qPCR-calculated yield of the sample. The discrepancy between the observed versus targeted selection coverage can be attributed to the statistical removal of amplification artifacts and the inherent variability of quantification methods.
Estimated and Illumina-Calculated Selection Coverage of Selected Sample for Each Illumina Run.
Exploiting the unique tag that defines each tool compound, we determined the total counts of the three tool compounds in each run based on statistical correction for unique molecules. The unique counts value accounts for PCR duplicates to ensure that amplification artifacts do not influence and falsify selected molecule counts. Taking advantage of the unique concentration tag, counts were determined for each unique concentration as well.
Influence of Compound Potency on Detection
First, the ability to detect compounds with varying affinities at the different selection coverages was evaluated. The counts of tool compounds that were introduced at 1 million copies (equivalent to library members) were plotted against the selection coverage of that run ( Fig. 3 ). As detailed in Faver et al., 20 we have chosen to represent the selection process as a binomial distribution. As such, the noise level of each run was determined based on the critical binomial at p < 0.001, with Bonferroni correction for the tool compounds, which allows us to set our probability well above the inherent noise of the selection with a multiple testing correction factor. The data empirically demonstrate that as the binding affinity of a molecule decreases, deeper sampling is needed to distinguish compound counts from noise counts. Data collected for a given compound that falls to the left of the intercept with the noise can be considered indiscernible from the noise of the selection. According to the trendlines generated, at approximately 4% selection coverage, the counts for CMPD3, a micromolar binder, are no longer distinguishable from the noise of the selection. Even when selection coverage is above this threshold, counts can be insignificant compared with noise. At 16% selection coverage, counts for CMPD3 are only 2-fold over the noise (8 vs 4 counts), compared with more than 100-fold for CMPD1 at this coverage.
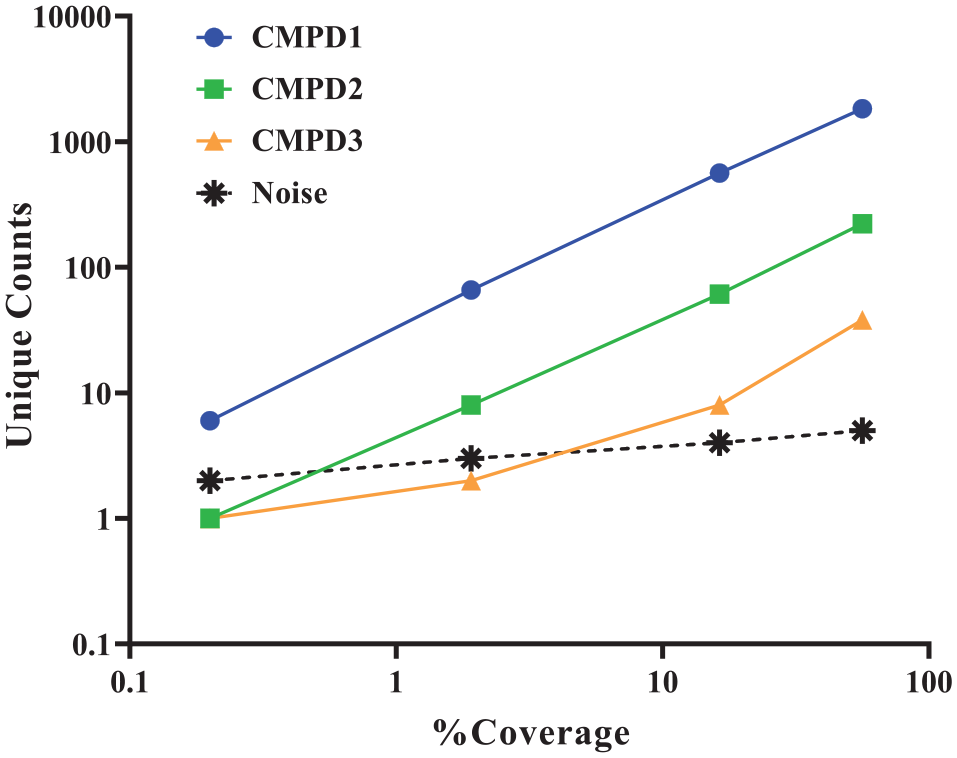
Effect of selection coverage on the detection of tool compounds of varying potencies spiked into a selection.
Influence of Initial Molecule Input on Detection
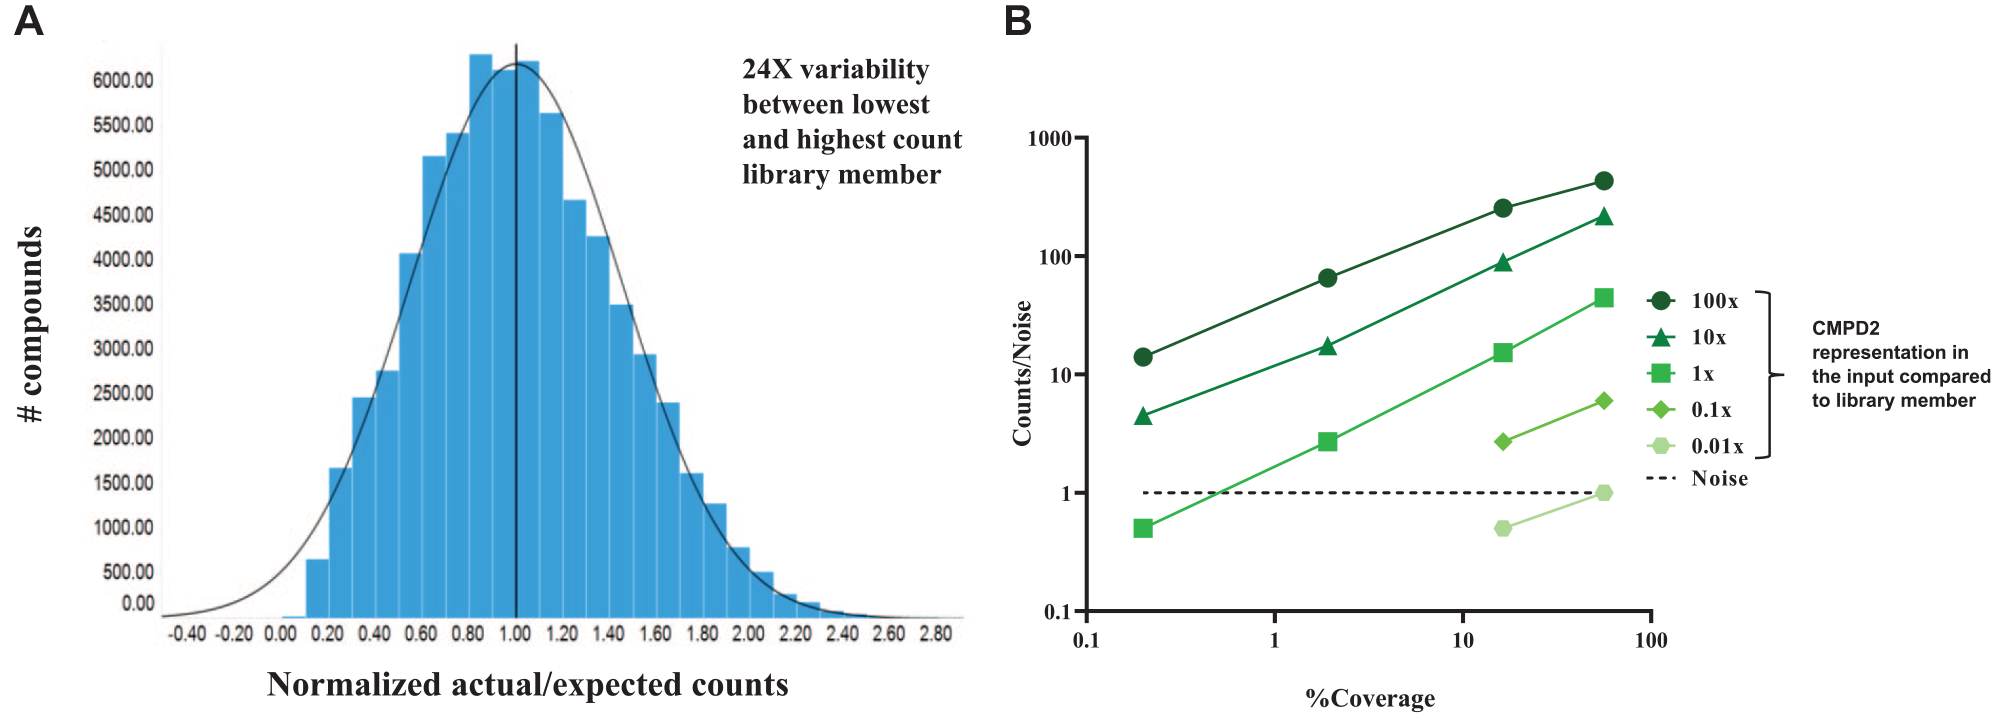
Assessing the effect of molecule input on detection is pertinent because although libraries can be normalized when combined to be represented at the same value, imperfect library synthesis, among other factors, leads to an uneven distribution of compound representation. In a controlled, small-scale (~1E+06 diversity), single-plate library synthesis, a 24× variability is observed between the lowest and highest count library member upon sequencing of the entire library ( Fig. 4A ). This 24× variability truly only reflects encoding variation and does not account for potential by-products or truncated compounds in the library, which are encoded with the same DNA tag as the desired compounds. It can be speculated that larger and less-controlled syntheses would reveal even more variability.
(
Choosing to present the tool compounds as a concentration ladder, with each concentration receiving a unique DNA tag, allowed for the assessment of compound representation in the input on detection. The normalized counts/noise ratio of CMPD2 for each detectable input value was plotted against the selection coverage of that run ( Fig. 4B ). These values were normalized since the noise is different for each input compound. As the initial input of tool compound decreases, the ability to detect this submicromolar binder becomes difficult to impossible. This trend continues as the depth of sample sequencing decreases until there is no detection at all. These plots were generated for the other two tool compounds, observing a very similar trend to that for CMPD2 ( Suppl. Fig. S2 ).
Discussion
The data depicted here demonstrate the value of understanding selection coverage when evaluating the robustness of a DEL selection and illustrate why DEL publications should report selection coverage information when presenting sequencing data. We show that a known micromolar binder, which could be an excellent starting point for medicinal chemistry, is difficult to detect over the noise as selection coverage decreases. This may not be problematic when probing distinguished targets with well-characterized chemical matter; however, when probing novel targets, a “weak” binder (micromolar activity) may be all that is present in the library and sufficient to initiate a hit-to-lead effort. We additionally show that the detection of tool compounds becomes even more difficult when the binder is underrepresented in the input of the selection. For example, a submicromolar binder becomes undetectable without the proper selection coverage. This phenomenon is quite common due to imperfect library synthesis that causes a distribution of representation of encoded compounds, which we illustrate with the library compound distribution of a small, controlled library synthesis.
Although various statistical measures and experimental procedures, such as replicate selections, have been proposed to normalize for the random noise of DEL data, the actual distribution of library members is unknown for any DEL library, complicating such normalization. 26 These statistical corrections are more robust when enough selection coverage is dedicated to the sample of interest. Acquiring the entire picture is particularly crucial when probing difficult targets, where a low-affinity molecule starting point would be highly valuable, in contrast to an easily drugged target that is able to isolate nanomolar binders directly from the selection. Based on our results, to effectively discover ligands with approximately 1 µM potency toward a given target from a DEL, at least 10% selection coverage should be assigned to the sample when using the described selection parameters. A simple criterion for assigning sequencing depth to a sample would be to allocate as much selection coverage as feasible to ensure the identification of all possible ligands. Further work is underway to understand the effects of other variables on the detection of compounds with varying affinities, such as library size and those presented in Figure 1 .
Supplemental Material
Supplemental_Material_McCarthy_et_al – Supplemental material for The Impact of Variable Selection Coverage on Detection of Ligands from a DNA-Encoded Library Screen
Supplemental material, Supplemental_Material_McCarthy_et_al for The Impact of Variable Selection Coverage on Detection of Ligands from a DNA-Encoded Library Screen by Kelly A. McCarthy, G. Joseph Franklin, David R. Lancia, Martin Olbrot, Eneida Pardo, Jonathan C. O’Connell and Christopher S. Kollmann in SLAS Discovery
Footnotes
Acknowledgements
We thank Chris Lombardi and Natalie Reinhardt for their assistance in the generation of tool compounds.
Supplemental material is available online with this article.
Declaration of Conflicting Interests
The authors declared the following potential conflicts of interest with respect to the research, authorship, and/or publication of this article: All authors are employed by FORMA Therapeutics, and their research and authorship of this article was completed within the scope of their employment with FORMA Therapeutics.
Funding
The authors received no financial support for the research, authorship, and/or publication of this article.
References
Supplementary Material
Please find the following supplemental material available below.
For Open Access articles published under a Creative Commons License, all supplemental material carries the same license as the article it is associated with.
For non-Open Access articles published, all supplemental material carries a non-exclusive license, and permission requests for re-use of supplemental material or any part of supplemental material shall be sent directly to the copyright owner as specified in the copyright notice associated with the article.