
Abstract
DNA Encoded Libraries (DELs) use unique DNA sequences to tag each chemical warhead within a library mixture to enable deconvolution following affinity selection against a target protein. With next-generation sequencing, millions to billions of sequences can be read and counted to report binding events. This unprecedented capability has enabled researchers to synthesize and analyze numerically large chemical libraries. Despite the common perception that each library member undergoes a miniaturized affinity assay, selections with higher complexity libraries often produce results that are difficult to rank order. In this study, we aimed to understand the robustness of DEL selection by examining the sequencing readouts of warheads and chemotype families among a large number of experimentally repeated selections. The results revealed that (1) the output of DEL selection is intrinsically noisy but can be reliably modeled by the Poisson distribution, and (2) Poisson noise is the dominating noise at low copy counts and can be estimated even from a single experiment. We also discuss the shortcomings of data analyses based on directly using copy counts and their linear transformations, and propose a framework that incorporates proper normalization and confidence interval calculation to help researchers better understand DEL data.
Introduction
Since the first conceptual experiment, 1 DNA Encoded Library (DEL) technology has become a widely accepted alternative to high-throughput screening (HTS), owing to its unique advantages including libraries of high numerical diversity, rapid operation, and low cost. Throughout the past years, we have observed a rapidly growing interest in the technology and successful cases in drug discovery from both academia and industry.2–5 Traditional amplification-enabled selection technologies, such as systematic evolution of ligands by exponential enrichment (SELEX) and phage display, allow selection experiments to reach convergence, in which, after multiple rounds of selection, the best binder becomes a significant and relatively stable fraction of the selection pool and thus can be detected at very shallow sequencing depths. 6 In contrast, with the exception of DNA-directed libraries,7–9 most of the implementations of DEL adopted a DNA-recorded strategy 2 based on the split-pool methodology, in which an encoding DNA is ligated along with the installment of the chemical building block during the “split” stage. 10 Such design does not require pre-installation of the encoding DNA to the building block (BB), but it also does not allow resynthesis between rounds of selection. 2 Consequentially, most of the DELs can undergo only a few rounds of selection before the output becomes too low in copy number. With the emergence of next-generation sequencing (NGS),11,12 however, millions to billions of DNA sequences can be read simultaneously, allowing high-affinity species to be quantified with a few rounds of selection without reaching convergence. This gave researchers an opportunity to focus on incorporating DNA-compatible chemical reactions and BBs into DEL technology. As a result, the reported library size dramatically increased from a few hundred13,14 to hundreds of billions 15 and even trillions 16 over the past decade.
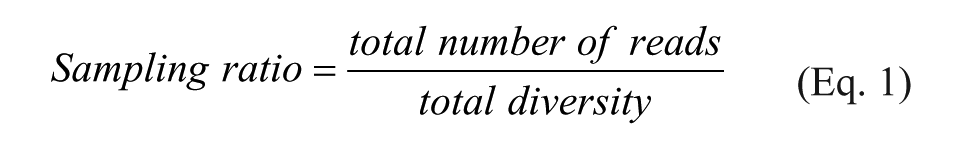
Sequencing at 1 billion reads per sample by NGS remains prohibitively costly for most, however. In practice, libraries and selection samples are often multiplexed to reduce sequencing time and cost.17,18 Although it has been recommended that a DEL library should be oversampled by at least 10 times its diversity, 18 the growing number of libraries and library diversities have become extremely difficult to cover. In many cases, ten thousand to a million reads are assigned to an individual library, which is only a small fraction of the library diversity. As a result, a vast majority of the library members see zero-copy readouts, thus rendering DEL selection a sampling survey rather than a truly multiplexed miniature assay for each member. 2 Although still successful in identifying individual hits, the low sampling ratio (Eq. 1) introduces uncertainty to the readout or may even effectively obviate any enrichment. It was reported that the growth in library size can lead to high false-negative rates, 19 which in turn reduce the value of structure–activity relationship (SAR) interpretation and comparative evaluation among different selection conditions.
As researchers became increasingly aware of complications produced by low sampling ratios, attempts were made to address the apparent randomness of the data. For example, Satz et al. incorporated randomly generated copy numbers in their mathematical modeling of the DEL selection process. 20 MacConnell and Paegel demonstrated that the false discovery rate arising from bead-displayed DELs in a microfluidic screening format is associated with the number of beads observed together in a droplet, a situation that is mathematically analogous to the copy counts in other DEL observations. 21 There is currently no consensus on how to handle low copy counts. Many choose to either directly compare copy numbers or linearly transform copy numbers before applying cutoffs, which can often be arbitrary and inconsistent. For example, Clark et al. chose 2 and 10 copies, respectively, as cutoffs in two projects. 10 Although successful discoveries were made in both, the cutoffs remain largely arbitrary. As the use of DEL technology rapidly expands, it becomes imperative to establish data analysis methods that produce consistent and comparable results as well as appropriate false-positive and false-negative rates.
In this study, we aim to understand the randomness and reproducibility of count-based selection readouts—an exercise that necessitates a high number of replicates. In addition, we set out to model the selection outcomes of DEL at various sampling ratios. To this end, we created a set of 24 replicated observations using a library superpool consisting of ~100 libraries. 17 The pool was aliquoted and barcoded by eight index tags (A–H), then repooled at equimolar ratios. The new pool was then subjected to three rounds of robotic DEL selection in triplicate (tubes 1–3). Therefore, there are 24 observations, referred to as cases, which are distinguishable by tube number and index tag (e.g., T1-A and T3-H) ( Suppl. Fig. 1 ). The observations within tubes were expected to be more similar than among tubes because they share identical fluidic manipulation. By comparing the behavior of libraries within and among tubes, we could probe for the sources of noise. In addition, there are eight diluted-library cases (DL-A through DL-H) as reference; these were created by sequencing the diluted naïve pool at a concentration that was similar to that of the average selection outputs.
The selection was carried out against a protein target (the target identity is irrelevant to this study) following a typical procedure. After selection and sequencing, the superpool yielded an average of about 30,000 reads per library, whereas the diluted reference library yielded about 35,000 reads per library. For data analysis, we selected one representative library, DEL46, whose read numbers approximated the superpool average. The number of reads for DEL46 among all observations are listed in Supplementary Table 1 . DEL46 is a three-cycle library. The first, second, and third cycles consist of 96, 398, and 1802 BBs, respectively, yielding a total diversity of 68,860,816. The physical library members can also be binned according to the shared BBs at either one or two cycles of synthesis, yielding six virtual sublibraries with lower diversities. The libraries are referred to as monosynthon (BB1, BB2, and BB3), disynthon (BB1BB2, BB1BB3, and BB2BB3), and trisynthon (BB1BB2BB3) libraries, respectively (see Suppl. Fig. 2 for DEL46 schemes). The library members are also collectively referred to as Nsynthons. The virtual libraries provide opportunities to model the effect of various library sizes under the same sequencing depth. The different cases can also be combined to model various sequencing depths.
Methods
Encoded Library Preparation for Selection
DEL libraries were combined into a pooled library for screening purposes. For each screening effort, the then-available libraries were ligated to contain a unique library identifier and then combined into an equimolar mixture. The total mixture was then split into eight aliquots to which specific DNA superpool identifiers were ligated. 20 µL aliquots (each containing 5 nmoles, 0.5 mM) were made for all the superpools. For the purposes of this experiment, eight aliquots from each of the superpools A–H were combined to a volume of 160 µL, from which 20 µL was used per selection condition. An additional DNA tag as sample identifier was incorporated by PCR amplification with specific index primer as part of the process for Illumina sequencing. In this manner, we can observe and distinguish eight identical selections within each of three replicates, providing a dataset with a total of 24 replicates for purposes of analyzing DEL selection output robustness.
PhyNexus Tip Preparation and Automated Selections
Automated selection was carried out using a Beckman Coulter BioMek FX robot. Three 200 µL PhyNexus tips packed with 5 µL beds of streptavidin resin were used per target and equilibrated before selections using encoded library technology (ELT) selection buffer (50 mM HEPES, pH 7.5, 50 mM NaCl, 1 mM CHAPS, 0.1 mg mL−1 sheared salmon sperm DNA, 10 mM MgCl2, 10 mM CaCl2, and 1 mM DTT). Tips were used within 4 h of equilibration. Ten nmoles of pooled library were suspended in 100 µL of selection buffer and used as input for each selection. Ninety-six-well plates were prepared containing 7.4 µg of target protein suspended in 110 µL of selection buffer per well in row A for each of three rounds of selection. A measure of 110 µL selection buffer was pipetted per row into rows B–G to serve as washes. Biotin (1 mM) was included in the post–target capture wash buffer in row B to reduce enrichment of streptavidin binders. In addition, 125 µL of selection buffer in row H was used for heat elution. A BioMek FX protocol was developed in which purified protein from row A was captured for 15 min on PhyNexus tips, washed once with selection buffer from row B, exposed to a library pool for 30 min, washed five times with selection buffer (rows C–G), and had heat eluted in by transferring 100 µL of selection buffer from row H to a 90 °C elution plate to recover binders from the PhyNexus tips. Three rounds of selection were performed in this manner, with the output of each round carried forward as the input to the successive round with fresh protein and new tips.
Selection Output Processing
Outputs of each selection condition were purified using a Qiagen Qiacube running a PCR cleanup purification protocol, using Qiagen PCR cleanup kit reagents as recommended by the manufacturer, and then they were quantified by quantitative PCR (qPCR) on a Roche Lightcycler 480 using previously quantified DEL standards. Total DNA output ranged from 0.5 × 10⁷ to 2 × 10⁸ copies, and it was PCR amplified with primer adaptors to add sequences compatible with Illumina sequencing flowcells. PCR output was purified using Agencourt AMPure XP SPRI beads according to the manufacturer’s instructions and then quantitated on an Agilent BioAnalyzer using a high-sensitivity DNA kit. Final concentration of amplicon for each sample was between 2 and 40 nM. Portions of products were loaded to generate ∼20 million clusters per selection condition on an Illumina GAII or HiSeq platform.
Sequencing and Data Analysis
Outputs from DEL selections were amplified and quantified such that identifying DNA tags were incorporated that enabled sequence deconvolution. Warheads were specifically tagged with DNA tag combinations 10 and also included a degenerate region to account for sequencing and/or amplification artifacts. Multiple identical sequence reads with identical degenerate regions could be accounted for and were handled as a single occurrence.
For every library and for each target, the total number of unique warhead sequences was counted. Compounds were then grouped by the different possible combinations of building blocks (e.g., single-cycle “mono” synthons, two-cycle “di” synthons, etc.).
Data Processing and Visualization
The raw copy counts for each Nsynthon were imported into TIBCO Spotfire. Most of the data transformations were performed using an embedded math function in the software. For statistics functions that are not directly embedded, corresponding R functions were introduced via TIBCO Enterprise Runtime for R (e.g., qchisq (); see Supplementary Information ). The plots were directly generated by Spotfire and exported as PNG files.
Results
We first characterized the Nsynthon copy numbers among pairs of experimental replicates. All the pairs in our comparison displayed very similar patterns (data not shown), and we chose to demonstrate the most divergent pair in terms of total number of reads, T2-E versus T3-B ( Suppl. Table 1 ), and their respective diluted libraries, DL-E versus DL-B. Overall, both pairs show dense and near-symmetrical scattering along the diagonal line ( Fig. 1A and 1B and Suppl. Fig. 3 ), suggesting that the copy numbers from two replicated observations are similar. The scatterplots for DL-E versus DL-B appeared to form a circular or quarter-circular shape, depending on the sampling ratios of the libraries. We reason that this pattern represents significant random noise such that the initial library unevenness cannot be reliably measured. In contrast to the diluted pair, the copy numbers between the postselection T2-E and T3-B replicates are distributed throughout a much wider range along the diagonal line, as expected from affinity-based selection. There are clearly Nsynthons that are overrepresented beyond the scope of both initial library unevenness and the random noise at the current sampling ratio. Notably, the scattering in both pairs is more pronounced around the lower copy numbers, suggesting increased random noise as the copy number decreases. The single-digit copy count range has a huge discrepancy between replicated experiments, such that the copy counts appear to be random between two experiments ( Fig. 1 ). As the copy number decreases, the data points eventually fall on the x-axis or the y-axis, because the library members are observed in only one of the replicates. Intriguingly, this inconsistency in detectability very rarely occurs for members that are detected at more than 10 copies in one replicate, regardless of the sampling ratio. Such a phenomenon not only was observed in this study but also existed within our experience with other replicated selections.
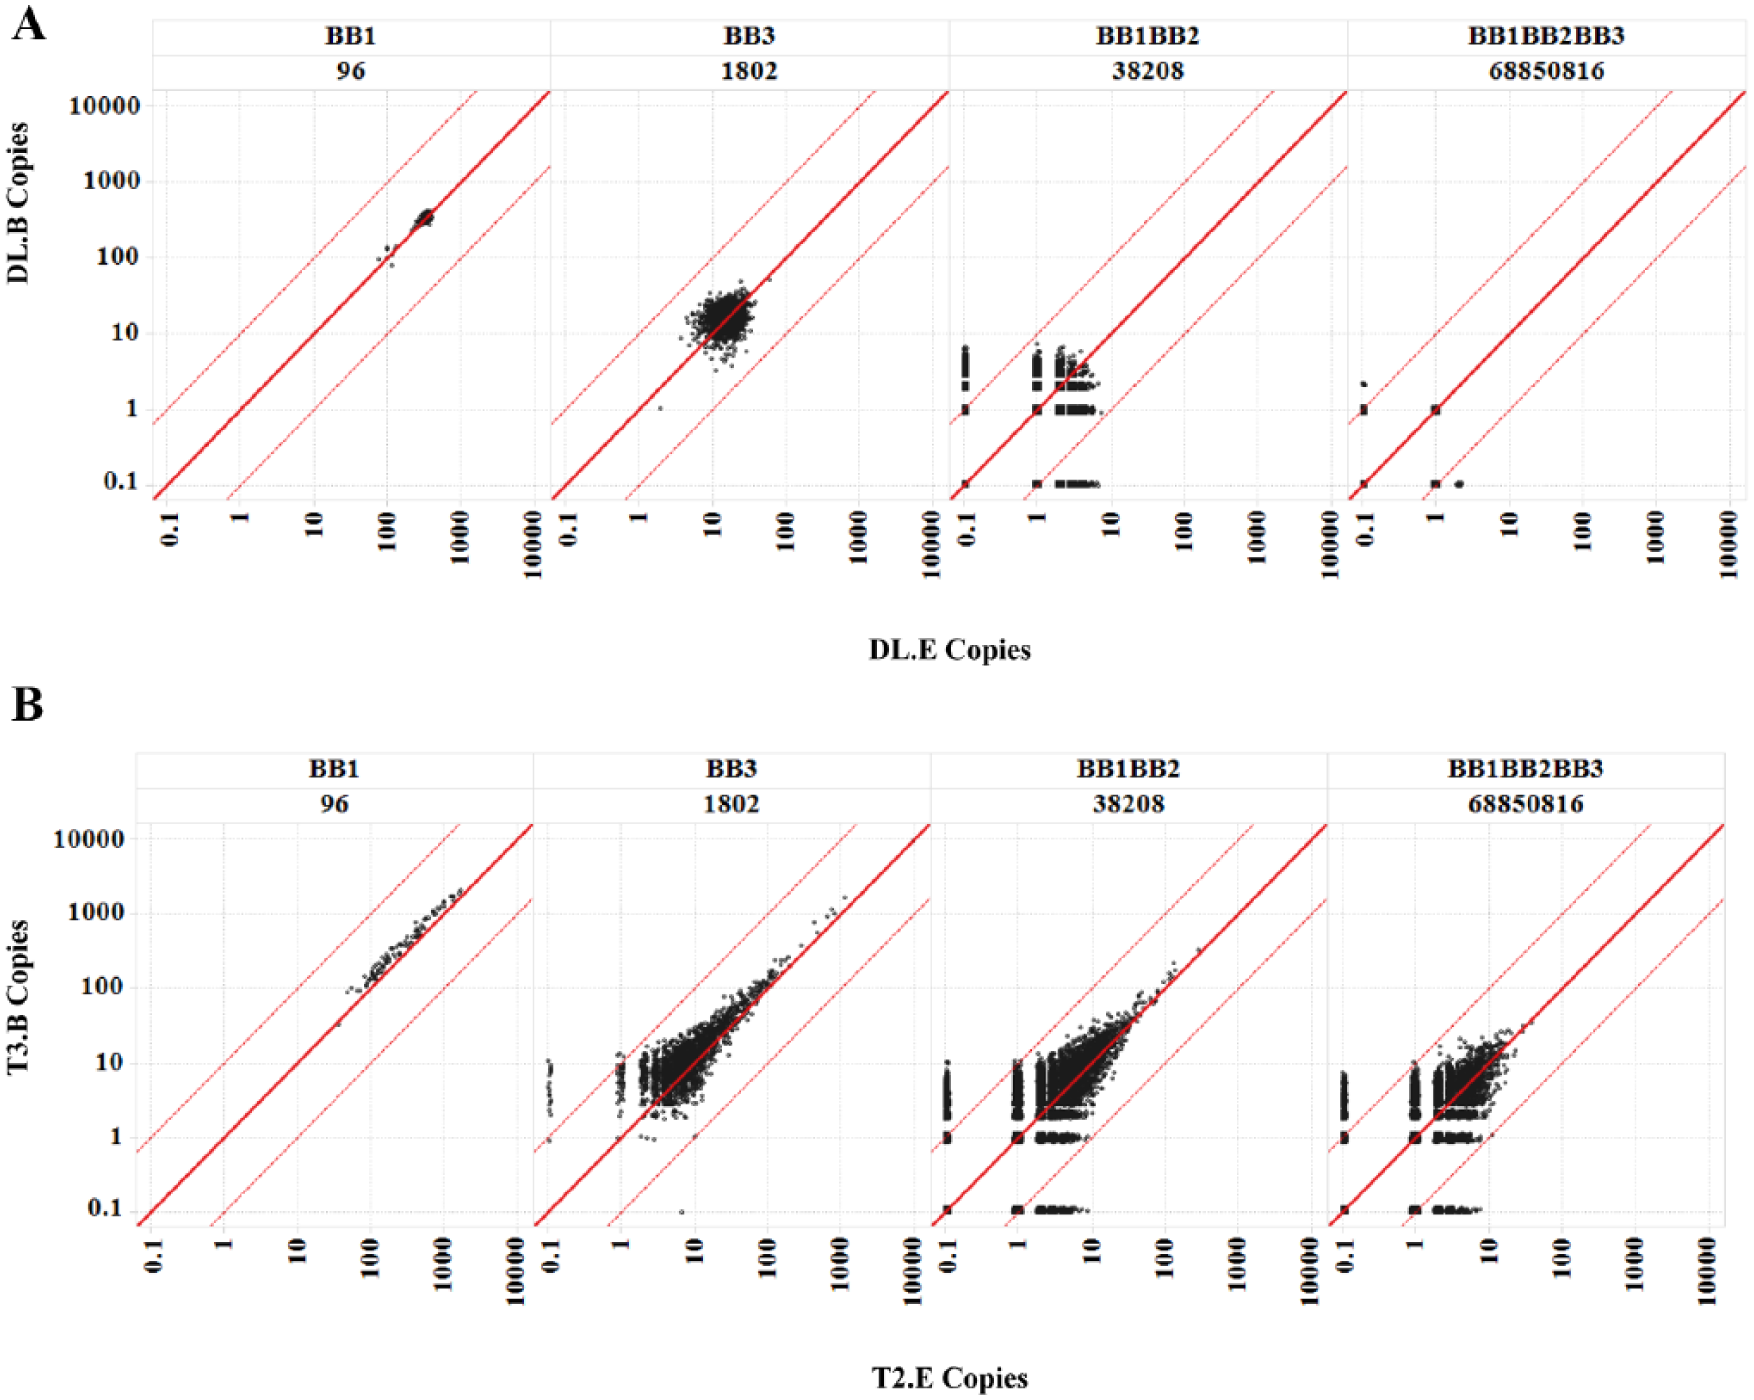
Consistency of Nsynthon copy counts between two samples. For a copy numbers distribution comparison, two representative cases that yielded the lowest (T2-E) and highest (T3-B) total reads and their unselected library (E and B, respectively) were compared: (A) DL-B versus DL-E; and (B) T3-B versus T2-E. Reference lines y = x, y = 10x, and y = x/10 are shown in red. Zero copies are represented as 0.1 to display on the log scale. Trellis by Nsynthon type and expected diversity [e.g., building block-1 (BB1) monosynthon; 96]. Only BB1, BB3, BB1BB2, and BB1BB2BB3 libraries are shown; for a comprehensive view, see Supplementary Figure 3 .
To further understand the missing values, or information loss, in DEL practice, we then examined the consistency among the different virtual Nsynthon libraries. Specifically, we compared the presence and absence of species between replicated cases, regardless of copy numbers. For demonstration, we show two randomly picked case pairs, DL-A versus DL-B and T1-A versus T1-B ( Table 1 ). The trisynthon library had a very low sampling ratio of ~5E-4 (a total sequencing read of 35,000 to a total diversity of 68 million) and also showed the lowest reproducibility in terms of presence. For example, only 12 (0.02%) of all members were observed in both DL-A and DL-B. This outcome is consistent among all pairs of diluted cases and approximates a mathematical prediction: assuming that the diluted library is evenly distributed and the sequencing process is a Bernoulli trial, ~16 library members would be expected in theory to appear in both DL-A and DL-B (see Supporting Information 1 ). For the postselection library T1-A and T1-B, the expected proportion of consistently observed members cannot be calculated, because the probability of each library member being selected is affinity-based and unknown. In our experiment, 5255 of the BB1BB2BB3 trisynthon members are consistently observed between T1-A and T1-B, which significantly exceeded that of the diluted library, but still comprised only 10% of all observed species (56,189) in T1-A and T1-B combined. Furthermore, 456,930 species were absent in both T1-A and T1-B, but were observed at least once in the remaining 22 cases for selected libraries (see Suppl. Fig. 4 for comprehensive comparisons). In the other six virtual Nsynthon libraries, we observed greater consistency in presence as virtual library diversity decreased and the sampling ratio increased ( Table 1 ). At a diversity of 38,208 (a BB1BB2 disynthon, sampling ratio ~1), 60% of all observed members were present in both; and at a diversity of 1802 (a BB3 monosynthon), when the library is “fully sampled” (i.e., sampling ratio >1) by sequencing, we observed a 100% consistency between DL-A and DL-B, as well as between T1-A and T1-B. Comparisons among other case pairs yielded very similar results (data not shown). This result quantitatively and robustly demonstrates that DEL selection performs poorly in terms of presence/absence reproducibility when total read numbers are low or library diversity is high, but it is improved by increasing the sampling ratio.
Occurrences between two replicates.
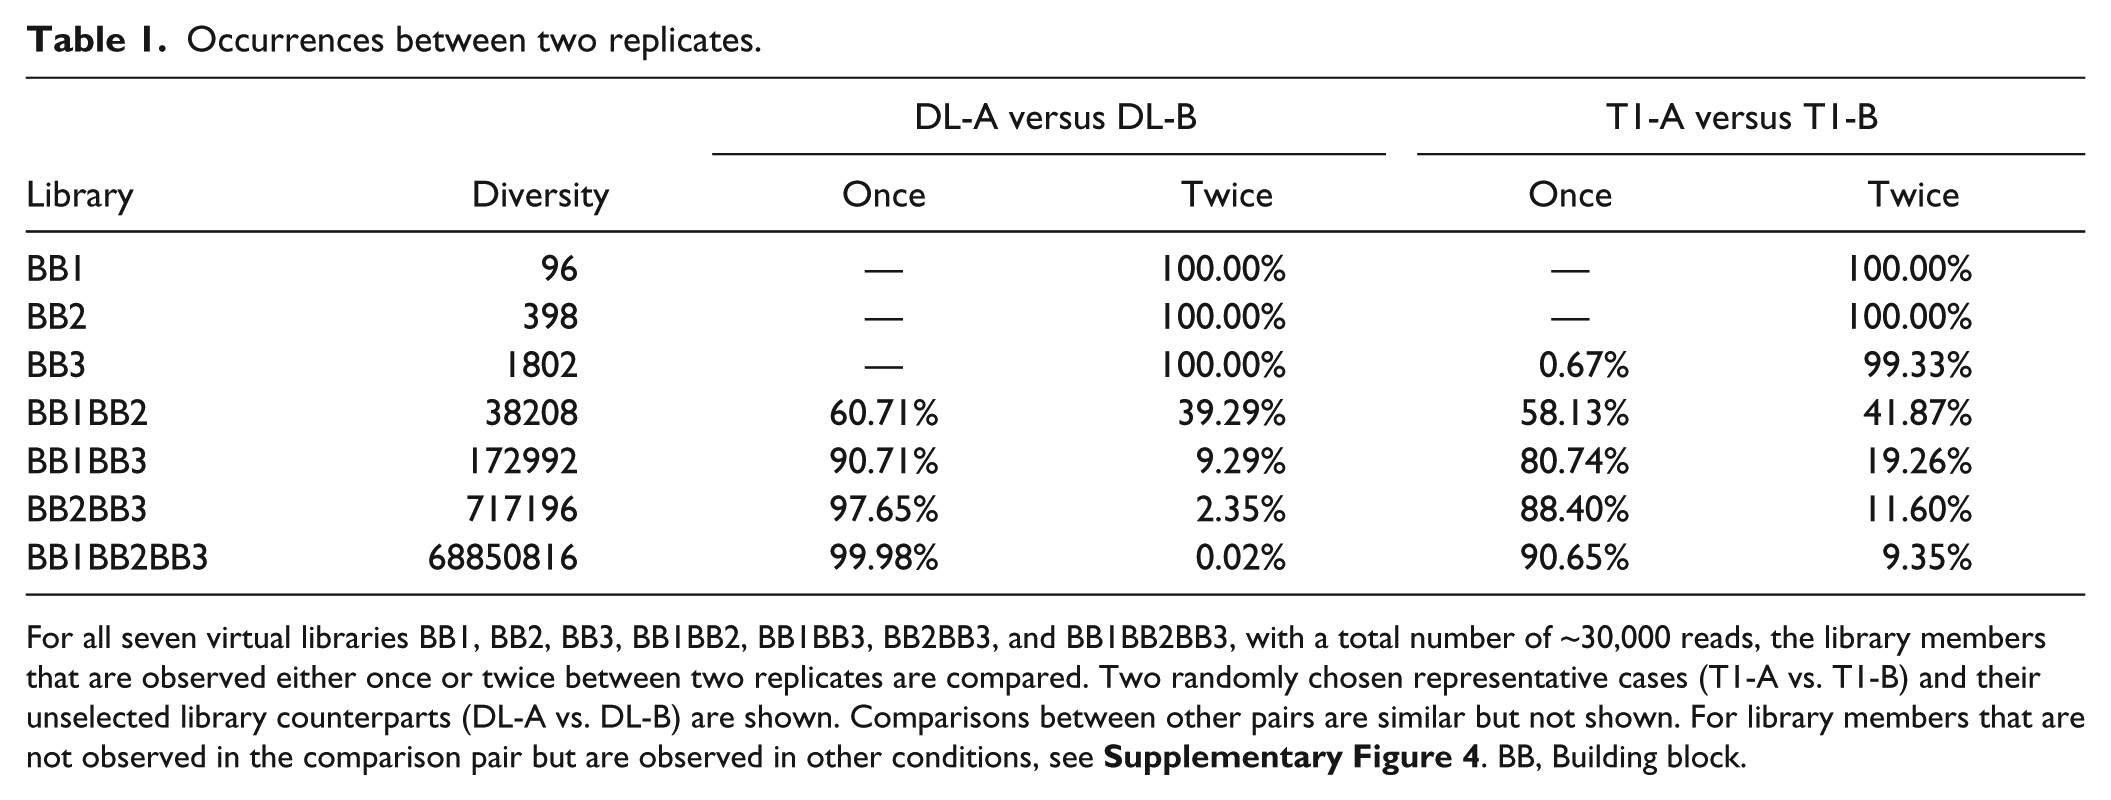
For all seven virtual libraries BB1, BB2, BB3, BB1BB2, BB1BB3, BB2BB3, and BB1BB2BB3, with a total number of ~30,000 reads, the library members that are observed either once or twice between two replicates are compared. Two randomly chosen representative cases (T1-A vs. T1-B) and their unselected library counterparts (DL-A vs. DL-B) are shown. Comparisons between other pairs are similar but not shown. For library members that are not observed in the comparison pair but are observed in other conditions, see Supplementary Figure 4 . BB, Building block.
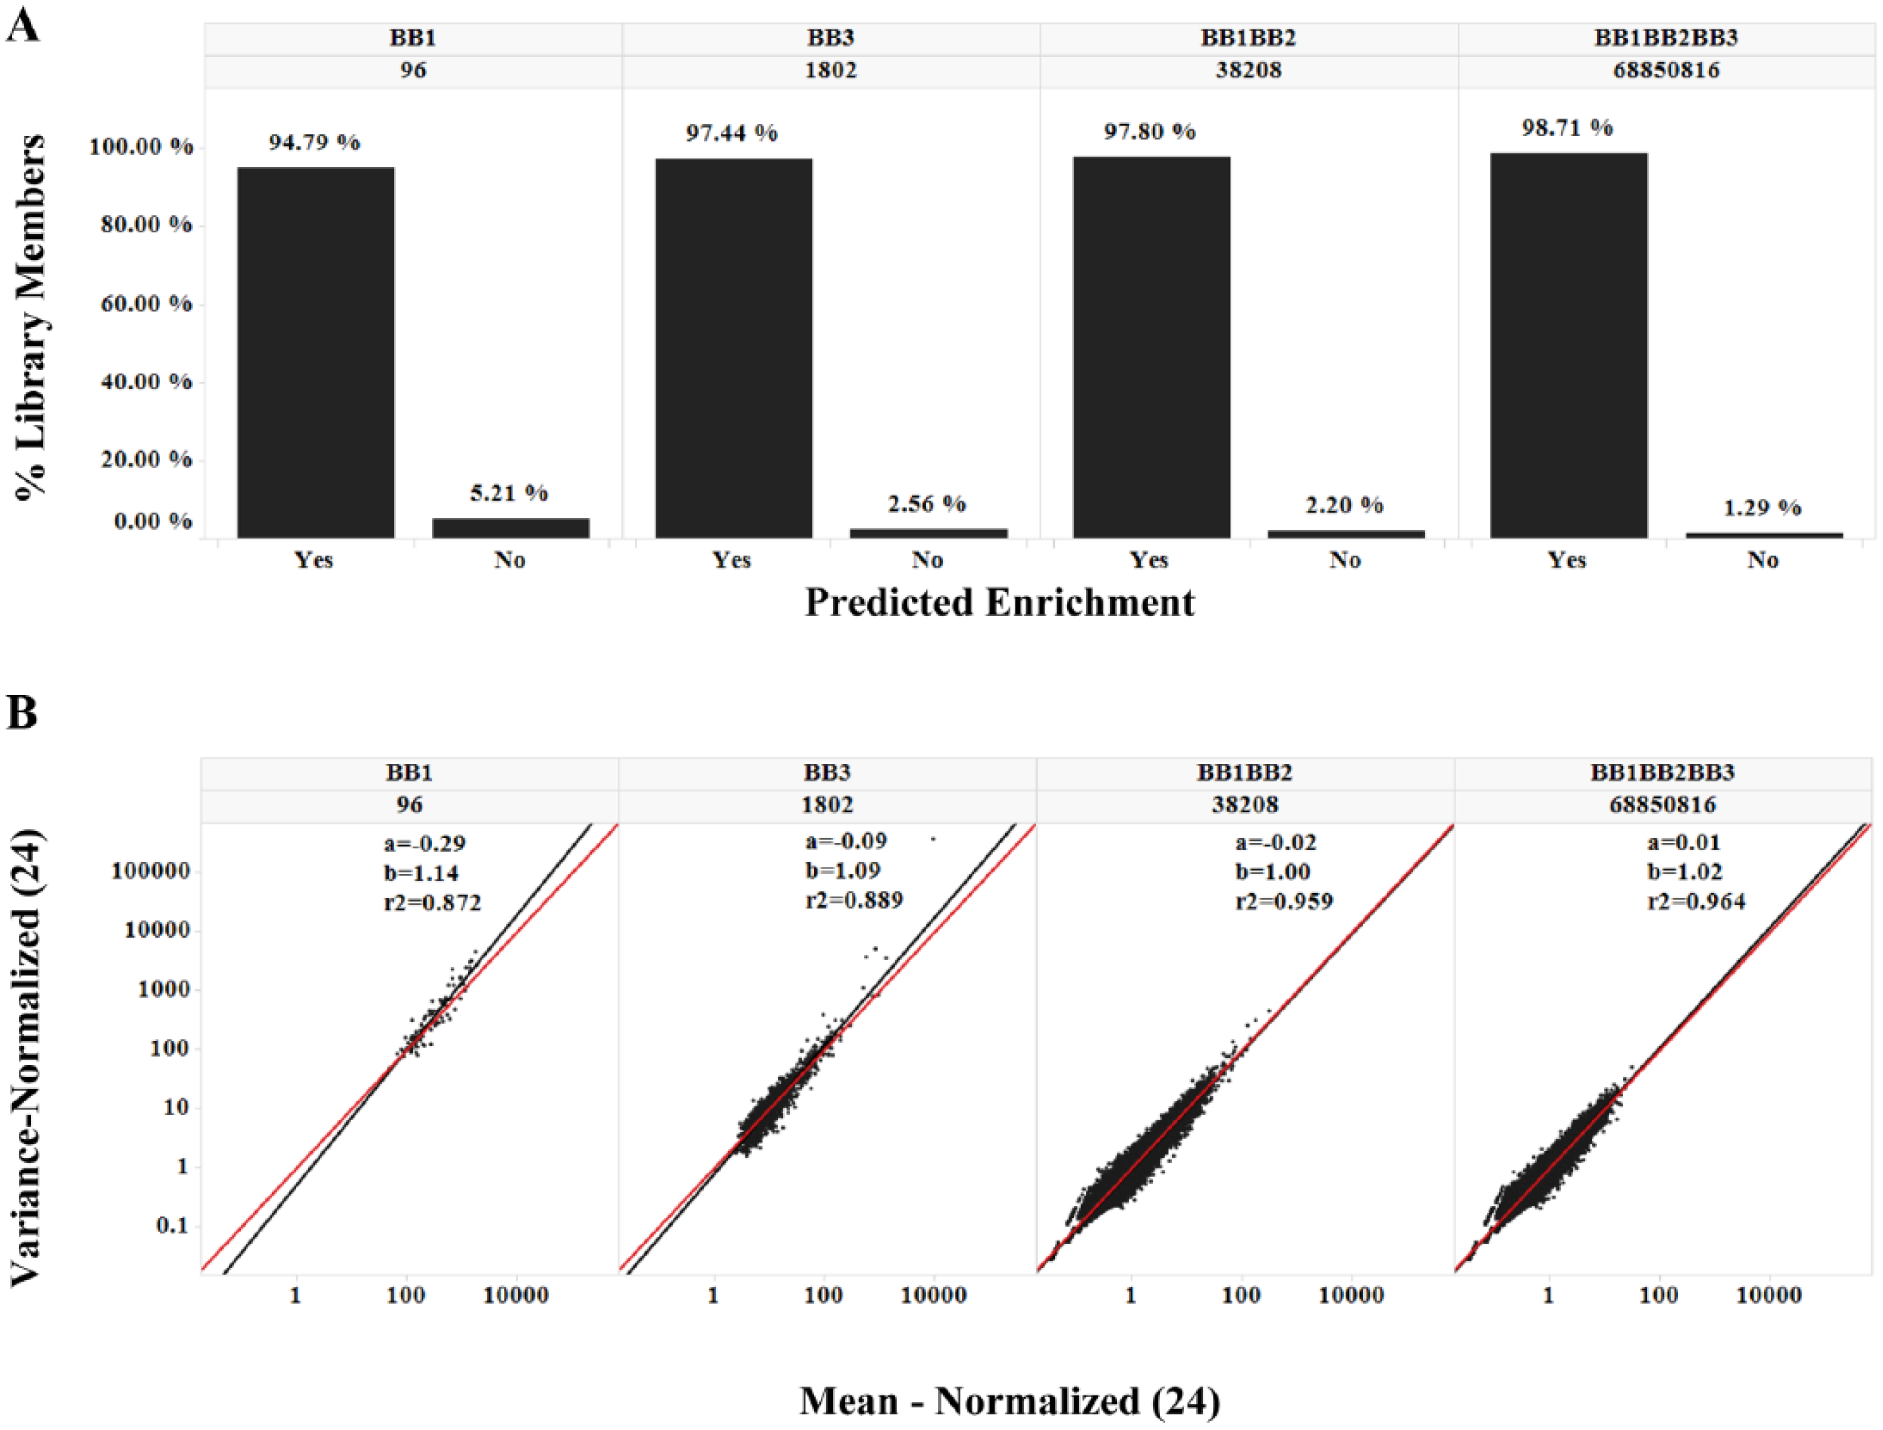
To characterize the random noise in DEL selection data, we calculated the means and variances ( Supporting Information 2 ) of the observed copy numbers for each library member in all 24 postselection cases (including 0 if unobserved). In the higher diversity disynthon and trisynthon libraries, the variances strongly correlated with the mean because they scatter densely and symmetrically along the diagonal y = x reference line ( Fig. 2A )—a defining characteristic of the Poisson distribution. The higher the diversity of the library, the better the variance could be described by the mean ( Fig. 2B ). There was a notable upward deviation from the diagonal in the lower diversity monosynthon libraries ( Fig. 2A and 2B and Suppl. Fig. 5 ). By viewing the aggregated samples among all seven libraries, we observed this deviation was actually more related to the average copy itself rather than to library classification ( Suppl. Fig. 7A ). This phenomenon can be best explained by a similar effect in RNA sequencing (RNAseq) data, described by Anders and Huber. 22 Briefly, three types of noise are involved in sequence count data: (1) shot noise, a Poisson-based noise that is persistent even in perfect replicates; (2) technical noise; and (3) biological noise. Shot noise negatively correlates with the mean. When the copy number is low, shot noise dominates, and technical and biological noise are unimportant. When the copy number is high, shot noise decreases, and technical and biological noise become significant and contribute to elevated variance. For a detailed explanation, see Supporting Information 3 and Supplementary Figures 6–8 . To test this theory, we compared two groups of eight samples from among the 24 replicates. The first group (within-tube) included eight samples from tube 1 only (T1-A through T1-H) and thus should exhibit less technical variation. The second group (cross-tube) consisted of samples from T1-A, T1-B, T1-C, T2-A, T2-B, T2-C, T3-A, and T3-B, which came from different selection tubes and therefore contained tube variations. As expected, the upward deviation of variance in the monosynthon libraries was significantly reduced in the within-tube group ( Fig. 2C ) compared to the cross-tube group ( Fig. 2D ). The latter appeared to be very similar to the 24-sample case ( Fig. 2A ), suggesting that the cross-tube variation is indeed the source of the upward deviation of variance observed in the 24-sample case. The disynthon and trisynthon libraries did not differentiate significantly between the within-tube and cross-tube samples because most of the members have low copy counts, in which the shot noise dominates. Therefore, our observations are in accordance with Anders’ analysis 22 that the dominant noise in the lower copy numbers is the shot noise, which deserves further attention in typical DEL data analyses.
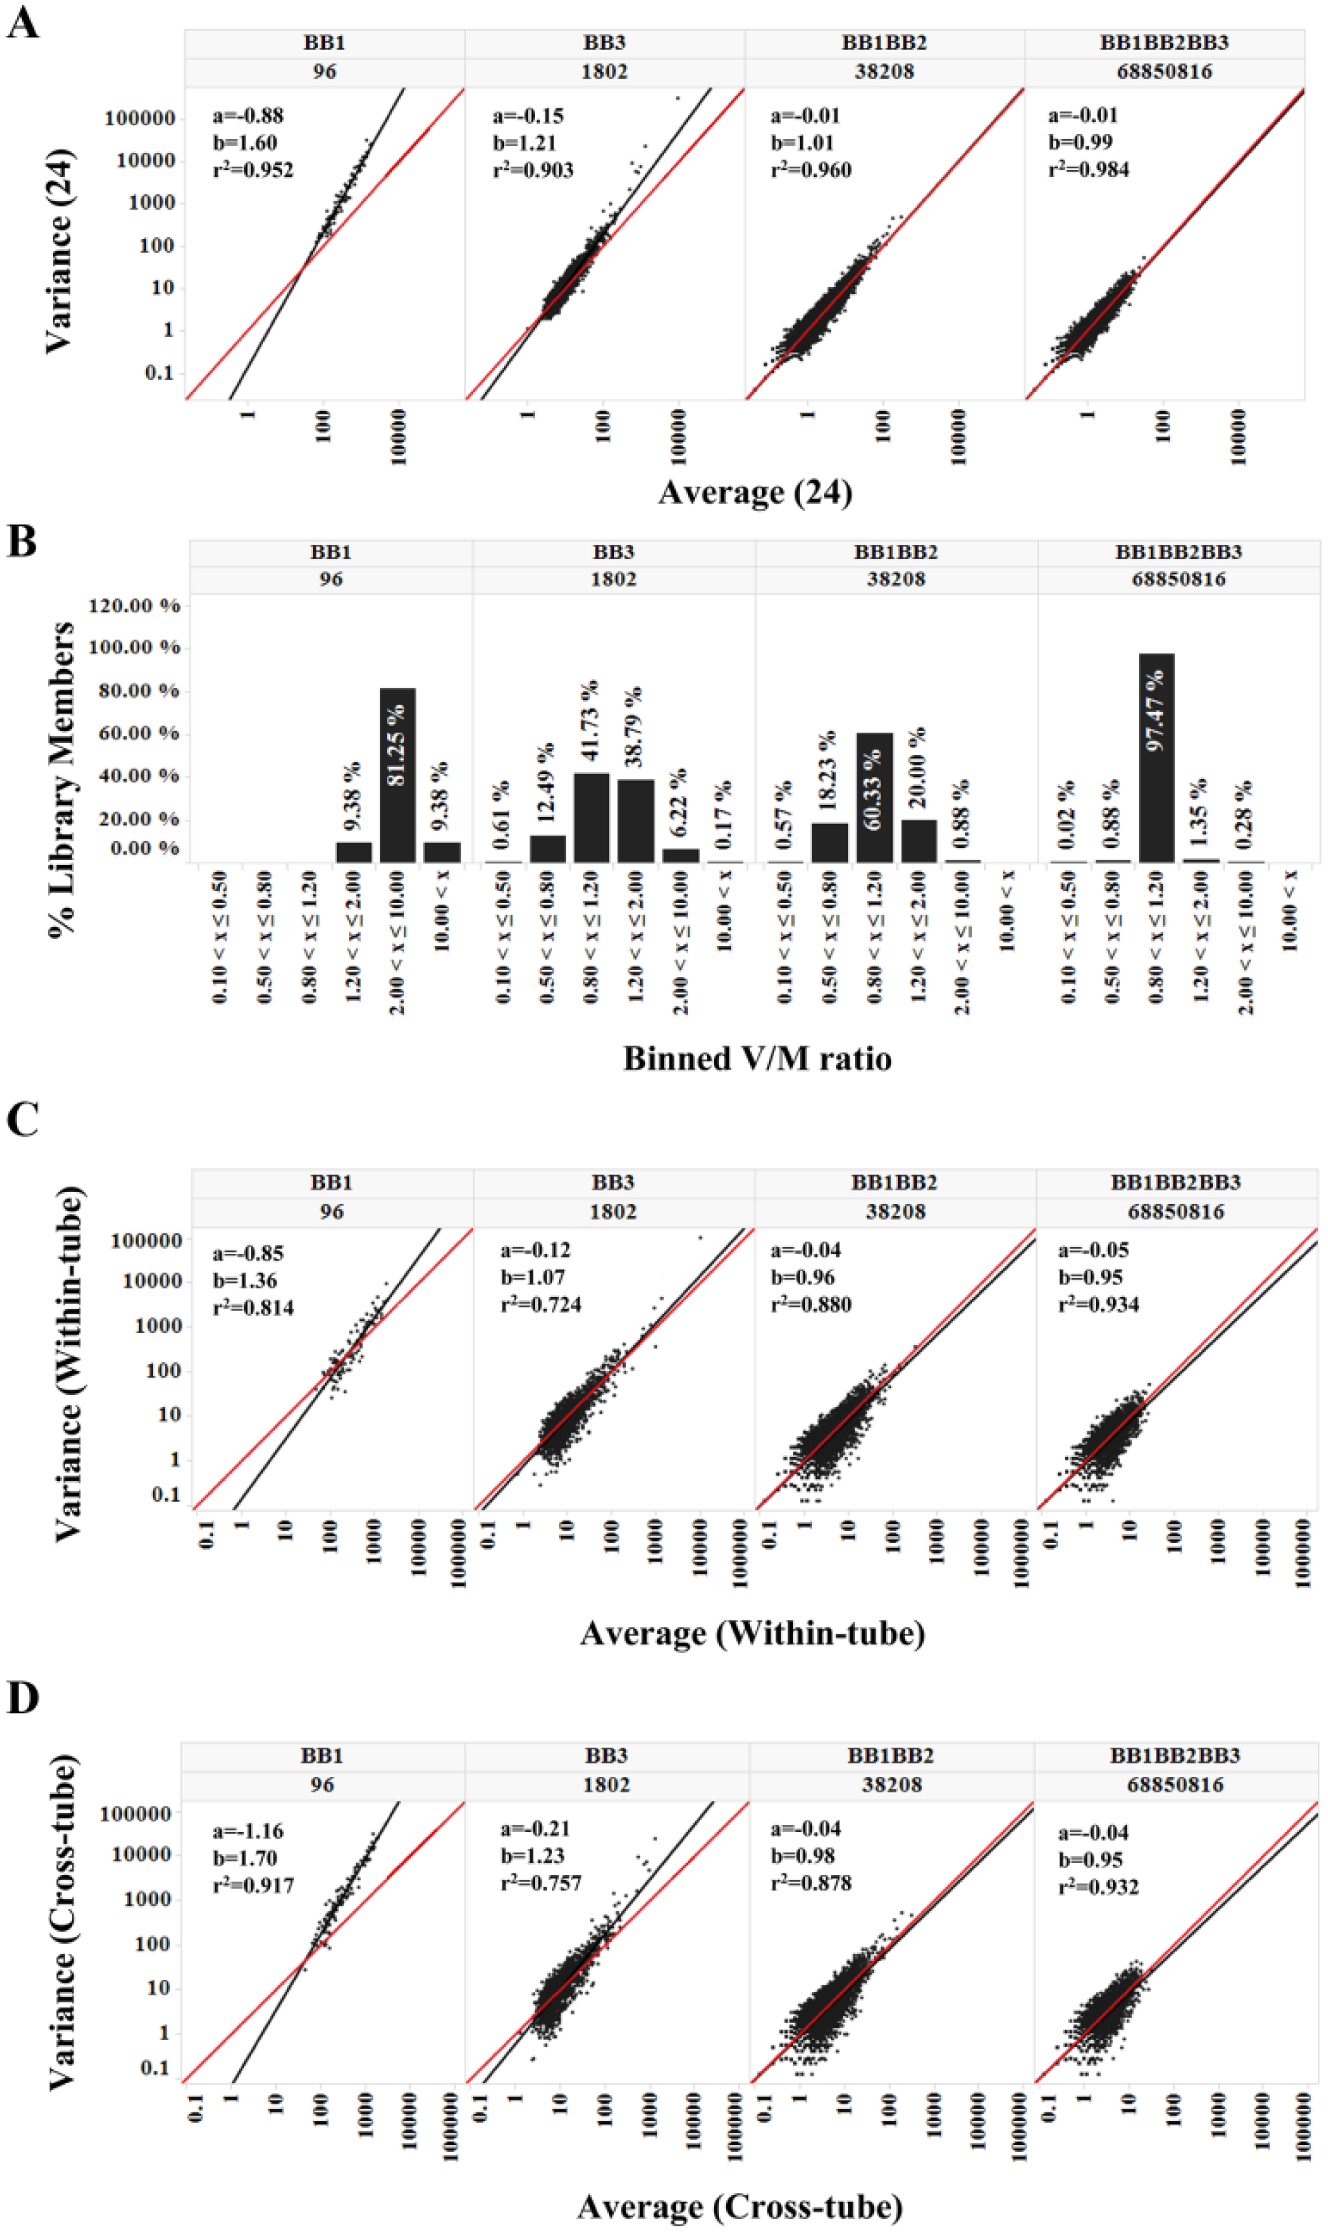
Variance versus mean. For each observed library member, the copy number variance and mean were calculated from different data groups. Trellis by Nsynthon type and expected diversity [e.g., a building block-1 (BB1) monosynthon; 96]. (A) Variance versus mean among 24 cases (trellis by Nsynthon type and expected library size); (B) distribution of variance/mean ratio (V/M). The V/M values from 24 cases were binned into [0.1,0.5,0.8,1.2,2.0,10.0]. The percentages of library members that fall in each bin were compared for each Nsynthon library. (C) Within-tube trellis view of variance versus mean among eight samples from tube 1 (T1-A~T1-H); (D) cross-tube trellis view of variance versus mean among eight samples arbitrarily picked from three tubes (T1-A, T1-B, and T1-C; T2-A, T2-B, and T2- C; and T3-A and T3-B). Reference lines y = x are shown in red. Linear fitting lines are shown in black. Fitting parameters [(a) y-intercept; (b) slope; and R2] are as indicated. Other groupings per the within-tube or cross-tube criteria have very similar patterns (data not shown). Only the BB1, BB3, BB1BB2, and BB1BB2BB3 libraries are shown; for a comprehensive view, see Supplementary Figure 5 .
It is worth noting that many DEL selections in practice have a sampling ratio of less than 1, as modeled by the di- and trisynthon libraries in this study. The vast majority of the observed copy counts are single digits and therefore carry very high shot noise. In most experiments, in which selection is also carried out only once without replication, each observed copy number is merely an estimate of the true copy number (the number on which the estimates converge if the experiment were to be repeated an infinite number of times). The conventional practice in the DEL community to directly compare copy numbers or linearly transformed copy numbers is therefore problematic. The results above suggest that ignoring the random noise that inevitably exists around the observed copy number can lead to false interpretations, especially in the lower copy count range. Fortunately, because of the observation that random noise follows the Poisson distribution, in which variance is known and equal to the mean, it is feasible to estimate the true mean within a certain confidence interval (CI). In other words, we can estimate the range of the true copy number to provide a confidence measure for an observed copy number, even from a single observation. 23
To directly demonstrate the predictability of the true copy number from a single experiment, we used the observed copy count (k) from a single observation (T1-A) to calculate the lower (λ1) and upper limit (λ2) of the 95% CI for each library member using Eqs. (2) and (3), respectively. For a detailed explanation of the equation, see Supporting Information 4 and Supplementary Figure 9 .


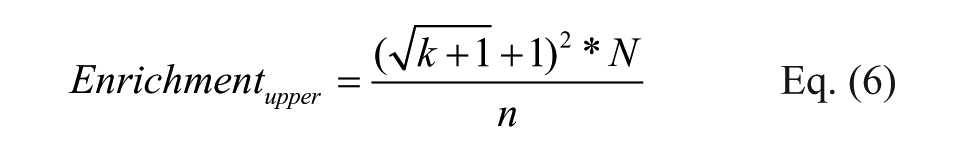
The range of copy numbers observed in the 24 replicates should accordingly fall within this interval. In fact, for all the Nsynthons except the BB1 monosynthon, more than 95% of the copy counts fell within the calculated 95% CI ( Fig. 3 ), suggesting that it is indeed feasible to use a Poisson distribution to predict the range of the true copy number. The decreased prediction performance in the libraries with very high sampling ratios (e.g., 448 for the BB1 monosynthon library) is anticipated because the experimental variance exceeds the Poisson-estimated variance for higher copy number Nsynthons, as discussed above. Similar results were obtained with other libraries in the pool (data not shown). With the Poisson CI, we can also explain why the “non-reproducible” species (those that reside on the x- or y-axis that are unobserved in only one experiment) are almost always lower than 10 copies ( Fig. 1B ), regardless of sampling ratio. If a library member was observed as 10 copies, its “true” copy number is between 4 and 18, and would be observed as at least one copy in each replicate (for a true copy number of 4 at CI = 95%).
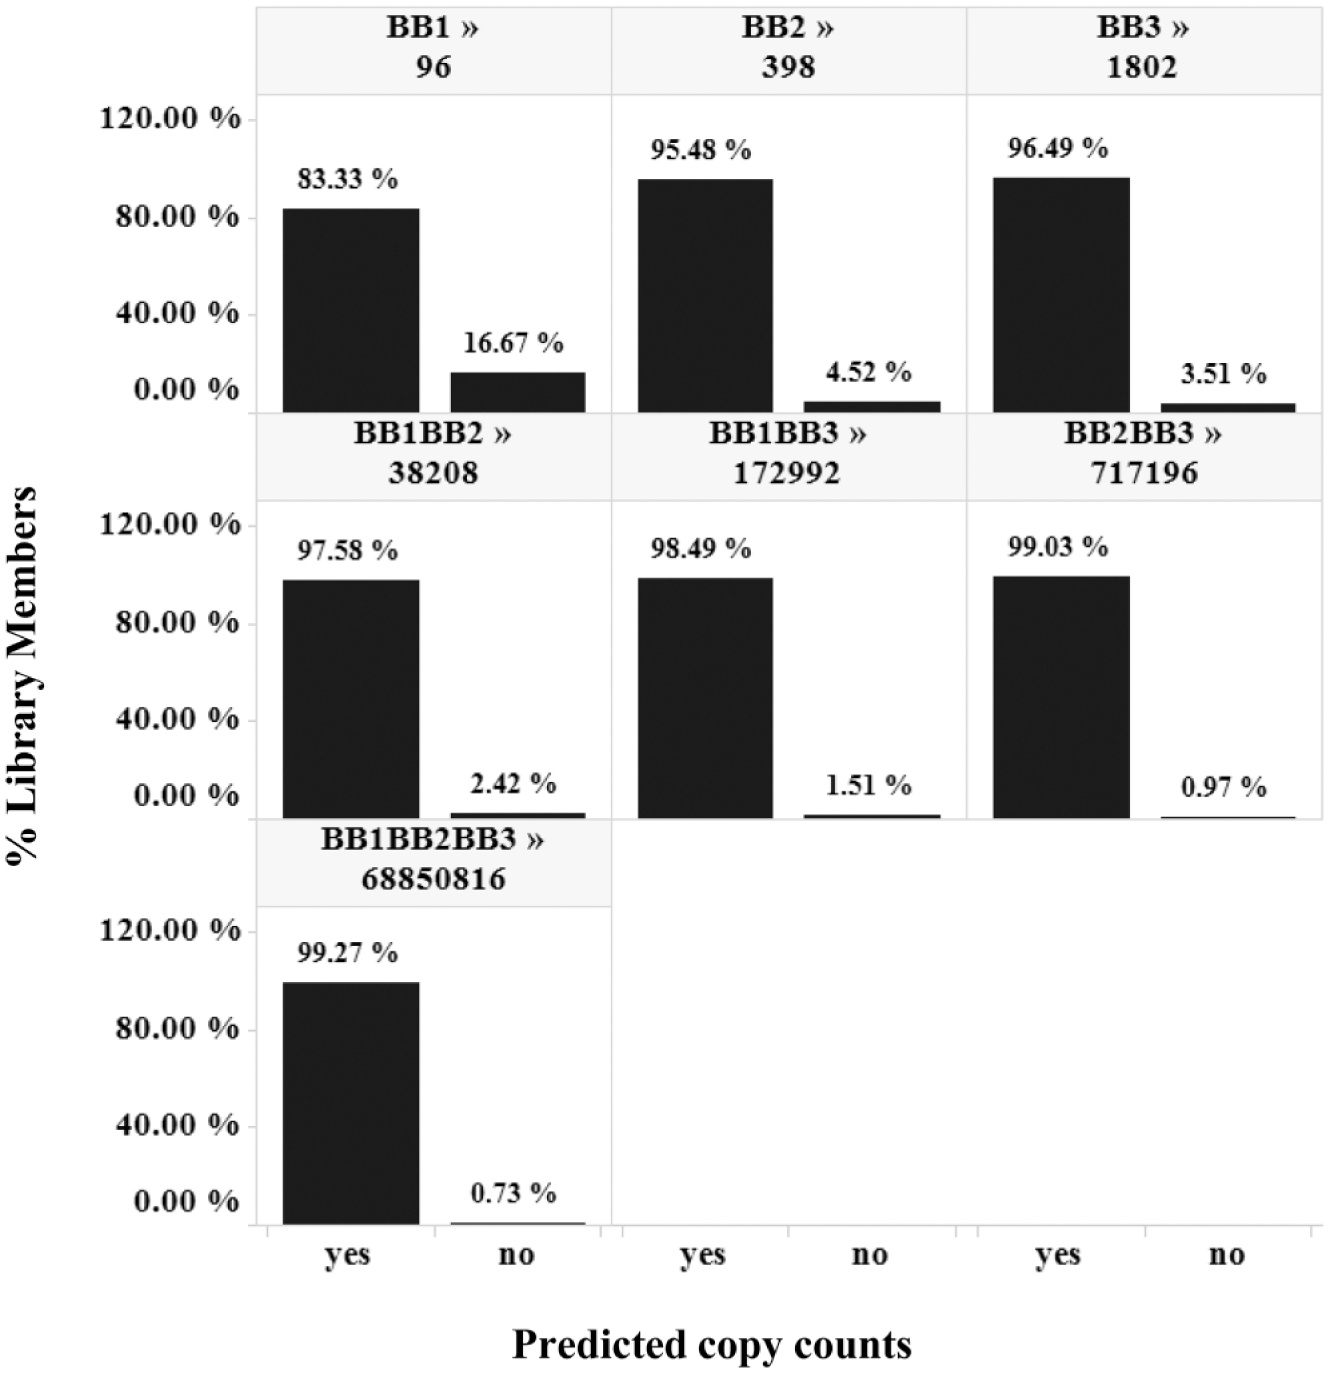
The accuracy of prediction. Upper and lower boundaries of a copy count with a 95% confidence interval were calculated for each observed library member in T1-A and tested against the average copy count from all 24 observations. Species falling within the boundary are called Yes, and species falling outside the boundary are called No. Trellis by Nsynthon type and expected diversity [e.g., building block-1 (BB1) monosynthon; 96].
It needs to be emphasized that the copy count analysis above pertains only to perfect experimental replications. DEL selection is often used to compare the binding behavior of a given chemical matter under different conditions, for example target versus no target control, 24 target plus competitors, 10 target titrations, mutants, 25 and homologues. 26 A more complicated challenge arises when multiple libraries are screened simultaneously, 17 or Nsynthon fragments are analyzed together with fully elaborated warheads. 27 In these scenarios, different chemical species from different experimental conditions and libraries (and therefore different sampling ratios) are assessed to prioritize postselection chemistry or to gain insight into SARs. This requires some form of normalization of copy counts to generate enrichment values to make quantitative comparisons. To date, there is no consensus on how to normalize copy counts, and very little discussion on the optimal enrichment algorithm. Two published methods, Method A 19 and Method B, 28 were compared to illustrate varying degrees of robustness in terms of eliminating such sampling ratio effects. To this end, we recombined the 24 replicates, by summing all the observed copy counts for each library member, to construct a virtual condition (SUM24) that is 24 times the scale of each single replicate (e.g., T1-A) ( Fig. 4 and Suppl. Fig. 11 ). The copy count comparison between SUM24 and T1-A is shown in Figure 4A . Ideally, a successful normalization should return the same enrichment value for a given library member regardless of the scale or sampling ratio of the experiment. Therefore, the SUM24 versus T1-A enrichment plot should scatter around the y = x line, allowing for a certain level of randomness. As shown in Figure 4B , Method A yielded enrichment values that continuously shift away from the diagonal with increasing library diversity, favoring SUM24. In the trisynthon library (with a sampling ratio of 1.5E-2 and 5E-4 for SUM24 and T1-A, respectively), the enrichments in SUM24 were systematically more than 10-fold higher than in T1-A for the same chemical matter, thus exhibiting a clear bias against smaller scaled experiments. This bias also lends insight to the troubling observations that higher diversity libraries yield lower enrichments than lower diversity libraries do. 19 In our study, we are able to objectively demonstrate that such observations are artifacts of data processing, because the virtual libraries are built by binning the trisynthons. For instance, the enrichment of a disynthon is expected to be about the average of all the trisynthons that comprise it, and certainly it should not exceed the maximum trisynthon enrichment. The enrichments returned by Method A showed higher maximum enrichment in the disynthon libraries than the trisynthon library ( Fig. 4B ) and did not obey this relationship. Therefore, we conclude that Method A is inadequate for proper data normalization when comparing chemical matter from different selection conditions and different libraries.
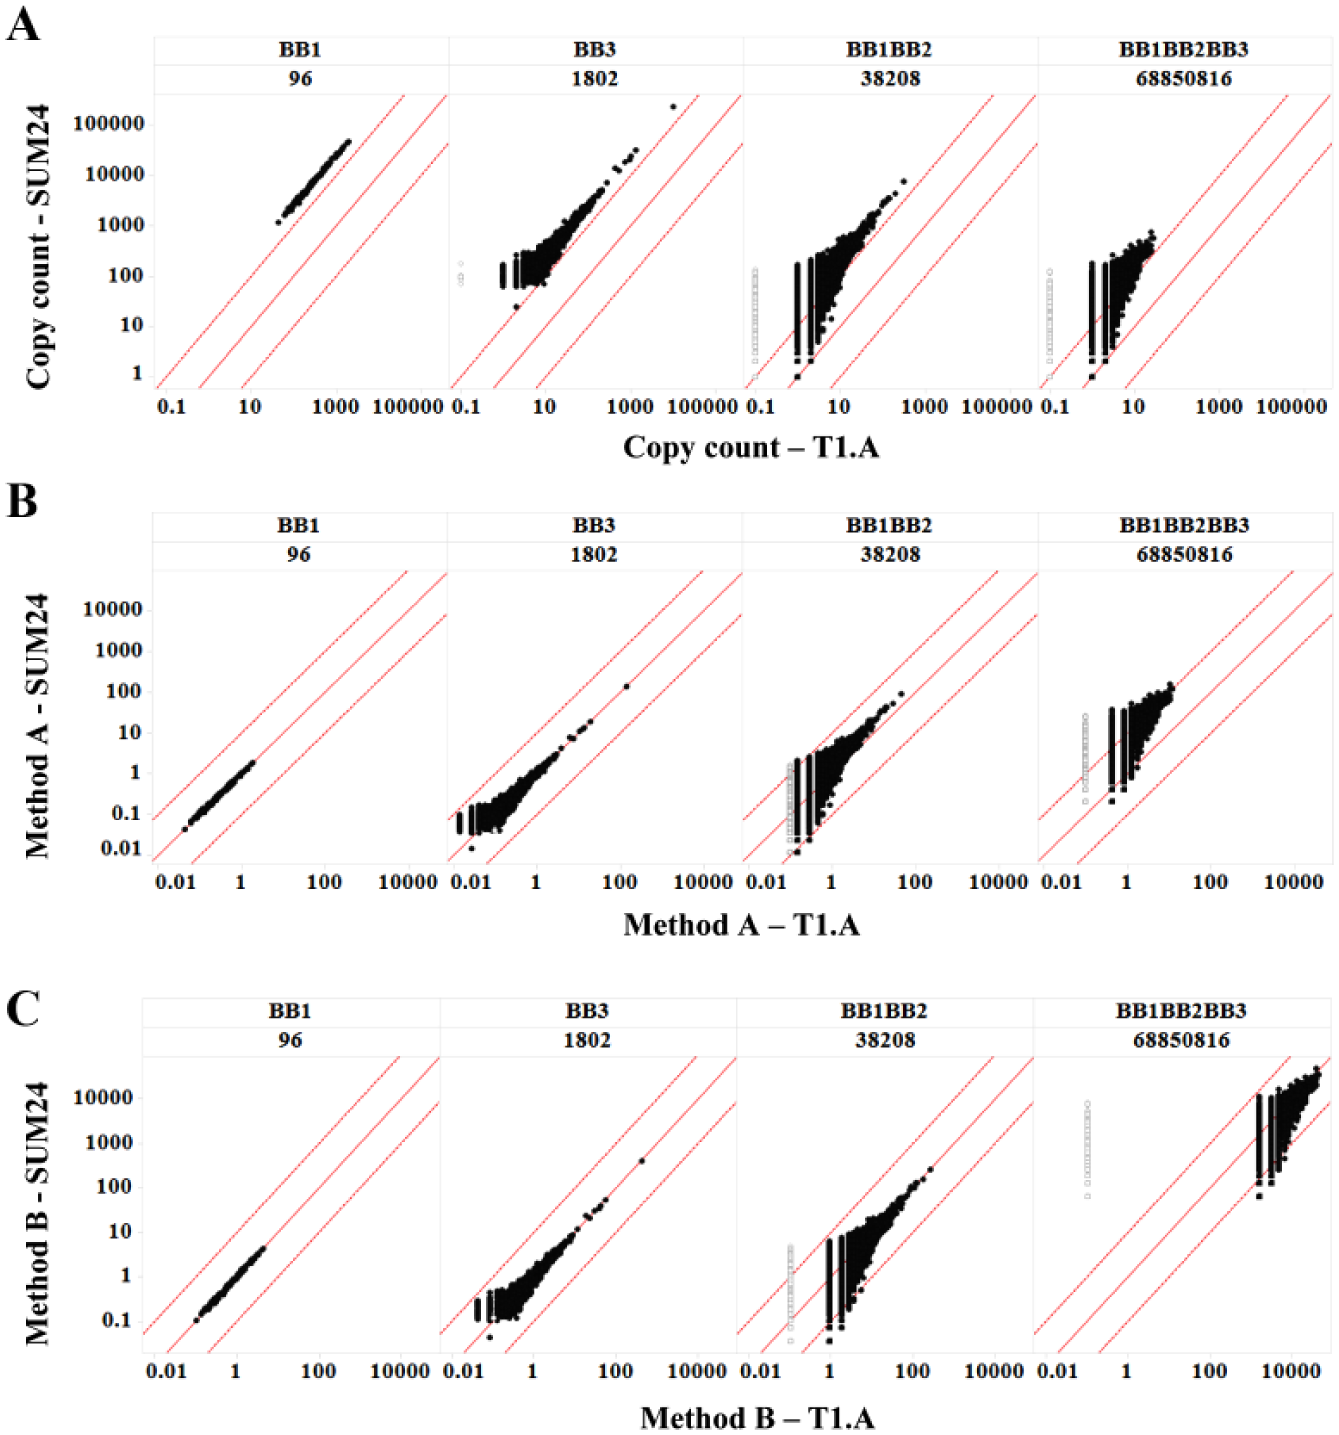
Robustness of enrichment calculations. A virtual selection (SUM24) was created by summing all the copy counts observed in 24 experiments for all the library members, and it was compared to T1-A. (A) Copy number comparison. (B) Enrichment calculated with Method A (see text). (C) Enrichment calculated with Method B (see text). Black dots: Species that are observed in T1-A. Gray dots: Species that are not observed in T1-A but are present in SUM24. Note: There are 849,137 gray dots and only 85,048 black dots. Solid line: Reference line y = x. Dashed lines: Reference lines y = 10x and y = x/10, respectively. Trellis by Nsynthon type and expected diversity [e.g., building block-1 (BB1) monosynthon; 96]. Only the BB1, BB3, BB1BB2, and BB1BB2BB3 libraries are shown; for a comprehensive view, see Supplementary Figure 11 .
In contrast, Method B was able to return much more consistent enrichment values between SUM24 and T1-A regardless of library diversity, such that all the enrichments scatter around the diagonal lines ( Fig. 4C ). Method B is a rather simple expression. It compares observed copy count to an expected value that an average member would yield, assuming that all library members are equal and most of them do not bind the target.
We propose using this formula in combination with the previously shown CI calculation to estimate the boundaries of the true enrichment by replacing copy count with the upper and lower boundaries of the true copy number, shown in Eqs. (5) and (6), where k is the observed copy number, N is the library diversity, and n is the total number of reads.
Because the upper and lower boundaries for copy numbers from T1-A at CI 95% are sufficient to predict the average copy number among 24 observations, the upper and lower boundaries for enrichment in T1-A should also serve as the 95% CI boundaries for SUM24 enrichments. This is indeed the case that in all the libraries, the T1-A enrichment boundaries predicted SUM24 enrichments ( Fig. 5A ), including the low-diversity monosynthon library that did not perform well with copy number prediction ( Fig. 3 ). The additional correction in the monosynthon libraries appears to suggest that the non-Poisson noise can be globally normalized by factoring in the total number of reads. To verify this phenomenon, we recalculated the variances and means for the 24 cases after normalization against T1-A ( Fig. 5B and Suppl. Fig. 12 ) by total number of reads. This manipulation indeed eliminated most of the upward deviation observed in Figure 2 . Based on this observation, we conclude that most of the high copy counts (>100) maintain their proportions to the total reads, and that the overdispersion at this range can be effectively normalized by multiple repeats. The Poisson randomness still exists but is low at this range. For experiments that are carried out as singletons, the copy fraction (copy count/total number of reads), instead of copy count, is less sensitive to total reads under different experimental conditions, and it should be considered as a metric for comparison. In this study, however, we used a homogeneous purified protein and a simple selection protocol. There was likely minimal biological variation, and therefore measured copy numbers were proportional to total reads among repeats. In a more complicated DEL selection scheme, such as selection on live cells, 29 the biological noise could become a significant noise element that needs to be properly treated. Nevertheless, multiple reads per tube in different tubes could still serve as a useful tactic to dissect various sources of noise in DEL selections.
Performance of normalization. (A) The upper and lower boundaries of enrichment were calculated based on T1-A observed copy counts with a 95% confidence interval and tested against the enrichment directly calculated for SUM24. Species falling within the boundaries are called Yes; species falling outside the boundaries are called No. (B) The copy numbers in all 24 cases were normalized against T1-A by the total number of reads, and the variances and means recalculated using the same method as in Figure 2 . Reference lines y = x are shown in red. Linear fitting lines are shown in black. Fitting parameters [(a) y intercept; (b) slope; and R2) are as indicated. Trellis by Nsynthon type and expected diversity [e.g., building block-1 (BB1) monosynthon; 96]. Only the BB1, BB3, BB1BB2, and BB1BB2BB3 libraries are shown; for a comprehensive view, see Supplementary Figure 12 .
Discussion
In this study, we experimentally generated a set of DEL data from 24 replicates to probe for the robustness of DEL selections and analyses. The 24 selections that included both in-tube and cross-tube replicates can be grouped in various ways to help dissect different sources of noise and model selections performed at different sampling ratios. It is worth noting that DEL selection is prone to information loss, which can originate from sampling effect in both affinity selection steps and the sequencing steps that follow. The information loss is best described by the overall sampling ratio, illustrated in Eq. (1), rather than the ratio between total number of reads and postselection output, which is often used to describe sequencing coverage but does not take the information loss in the selection steps into account. As demonstrated above, DEL experiments with low sampling ratios are extremely underpowered with respect to providing robust negative selection data; and the high false-negative rate could greatly mislead data interpretation. In support of this view, T1-A only observed 85,048 but missed 849,137 Nsynthons that were observed in SUM24. The maximum enrichment in the missing Nsynthons is well beyond the lowest enrichment that was observed ( Fig. 4C ). In other words, there are huge numbers of apparent nulls that are indeed better enriched than the ones that do have a copy number in a single observation, when the libraries are undersampled. They would have been revealed if multiple selections or larger scales of selections were performed. It is therefore a false assumption that these species are not enriched just because they are not observed, especially under selection conditions that serve as negative comparators or when a negative SAR needs to be defined. In this regard, arbitrary cutoffs could potentially exacerbate the problem by eliminating additional species that have low copies. The low-count species were historically confusing because it was difficult to dissect signal from noise at this range. They did not appear to be reproducible and yet sometimes produced high-affinity hits (Clark et al. 10 and unpublished results). In practice, these species are often deprioritized simply due to lack of confidence. Our analysis suggests that the low copy numbers from DEL selections still follow a predictable pattern and are interpretable to a certain extent through the calculation of Poisson CI. For example, within a 95% CI, an observed copy number of 5 can be safely assumed to have a “true” value greater than 1 and less than 10. Similarly, even an observation of 0 or 1 copy could at least provide a useful upper boundary prediction of a “true” copy number of 5. These derived properties based on Poisson distribution can serve as a rule of thumb in comparing different species. Most importantly, these interpretations can be used independent of an actual sampling ratio as long as the copy number is low, where Poisson noise dominates ( Suppl. Fig. 10 ). A recent report regarding bead-displayed DELs in a microfluidic screening format reported a similar assessment, in which four beads observed together in a droplet set a baseline for a satisfactory false-discovery rate. 21
By comparing multiple replicated DEL selections, we confirmed that the random noise of DEL data universally and consistently follows the Poisson distribution. The only ways to reduce the Poisson noise are to conduct a large number of repeated selections or to increase the sampling ratio. Both methods are not currently practical due to the growing number and size of DEL libraries. Statistical measures are therefore critical to maximize the information gain in DEL practice. In this study, we showed that the randomness of copy counts can be modeled and reliably interpreted regardless of library size and sampling ratio. Based on these observations, we propose a framework for data normalization and enrichment calculation based on the estimation of Poisson CIs from finite observations and sampling ratios, enabling cross-condition or cross-Nsynthon comparisons. There are potential caveats to this normalization process, because the currently proposed method operates on the assumption that all the library members were equally distributed prior to selection. The actual distribution of library members is unknown for any DEL library. It would be extremely valuable if the initial abundance for each library member could be determined. In fact, this approach has been described by Kleiner et al., 30 who calculated enrichment by dividing the postselection abundance fraction by the preselection abundance fraction. It has also been reported that the initial library abundance can be modeled by negative binomial distribution.31,32 Although the sampling ratios in these reports were far beyond what modern DELs can achieve due to their low library diversity, the advantage of differential analysis is obvious. By computing the fold changes relative to a comparison selection or unselected library in parallel rather than an assumed mean (e.g., 1/total diversity, as in Method B), the initial library unevenness can be normalized. Much has been established in the genomics and transcriptomics fields, in which count-based sequencing data were compared among conditions to estimate effect size and confidence. 33 Beyond the scope of this report, we speculate that methods from these fields could provide useful guidance in modeling DEL data and designing new data analysis tools.
Footnotes
Acknowledgements
We thank Dr. Jason Deng, Dr. David Israel, Dr. Chris Phelps, Dr. Xiaorong Liu, Dr. Hongfeng Deng, Dr. Gang Yao, and Dr. Jeremy Yap for careful review of the manuscript and useful discussions.
Supplementary material is available online with this article.
Declaration of Conflicting Interests
The authors declared no potential conflicts of interest with respect to the research, authorship, and/or publication of this article.
Funding
The authors received no financial support for the research, authorship, and/or publication of this article.
References
Supplementary Material
Please find the following supplemental material available below.
For Open Access articles published under a Creative Commons License, all supplemental material carries the same license as the article it is associated with.
For non-Open Access articles published, all supplemental material carries a non-exclusive license, and permission requests for re-use of supplemental material or any part of supplemental material shall be sent directly to the copyright owner as specified in the copyright notice associated with the article.