
Abstract
Systematic unbiased high-throughput screening (HTS) of drug combinations (DCs) in well-characterized tumor cell lines is a data-driven strategy to identify novel DCs with potential to be developed into effective therapies. Four DCs from a DC HTS campaign were selected for confirmation; only one appears in clinicaltrials.gov and limited preclinical in vitro data indicates that the drug pairs interact synergistically. Nineteen DC-tumor cell line sets were confirmed to interact synergistically in three pharmacological interaction models. We developed an imaging assay to quantify accumulation of the ABCG2 efflux transporter substrate Hoechst. Gefitinib and raloxifene enhanced Hoechst accumulation in ABCG2 (BCRP)-expressing cells, consistent with inhibition of ABCG2 efflux. Both drugs also inhibit ABCB1 efflux. Mitoxantrone, daunorubicin, and vinorelbine are substrates of one or more of the ABCG2, ABCB1, or ABCC1 efflux transporters expressed to varying extents in the selected cell lines. Interactions between ABC drug efflux transporter inhibitors and substrates may have contributed to the observed synergy; however, other mechanisms may be involved. Novel synergistic DCs identified by HTS were confirmed in vitro, and plausible mechanisms of action studied. Similar approaches may justify the testing of novel HTS-derived DCs in mouse xenograft human cancer models and support the clinical evaluation of effective in vivo DCs in patients.
Keywords
Introduction
Although small-molecule anticancer agents often elicit promising therapeutic responses at the onset of treatment, the percentage of patients that respond positively and the duration of those benefits are all too frequently limited by drug resistance.1–4 Drug resistance may preexist and be inherent to clonal subpopulations within a tumor and/or may emerge through adaptive responses to the selection pressures experienced during therapy. Tumor cells can respond to therapy by altering drug target expression levels, accumulating secondary mutations, or activating feedback loops and compensatory signaling pathways to become resistant. 4 Other drug resistance mechanisms include but are not limited to decreased drug activation, downregulation of pro-apoptotic pathways, upregulation of DNA damage repair machinery, or increased drug efflux by transporters, all of which can decrease the effectiveness of small-molecule anticancer agents.4–6 Cancer heterogeneity, interpatient, intratumoral, intermetastatic, and/or intrametastatic, and the adaptive responses of tumors to monotherapies make the selection of effective cancer agents challenging.4,7,8 However, data from animal models and clinical studies have demonstrated that drug combinations (DCs) can improve patient response rates and prolong survival.4,9–14 DC studies have delineated some of the underpinning characteristics of effective anticancer DCs: (1) the individual drugs should interact with distinct biological targets and have different mechanisms of action (MOAs); (2) the individual drugs should have little or no overlapping toxicities; (3) DCs should achieve additive or greater than additive (synergistic) effects on tumor growth with fewer adverse events; and (4) targeting multiple signaling pathways simultaneously should impact multiple clonal subpopulations in tumors, thereby decreasing the likelihood or delaying the emergence of drug resistance.9,10,12,15 However, the ability to predict which DCs will interact to provide better and/or more sustained patient tumor responses with longer survival benefits remains elusive.
Historically, effective DCs have been selected and/or discovered empirically, often in studies lacking a biological rationale.10,12,16 More recently, data-driven approaches have been used to formulate hypotheses and select DCs that exploit genetic mutations, signaling pathway alterations, oncogene addiction, and drug resistance mechanisms.9,10,12,15 Although omics approaches (genomics, proteomics, transcriptomics, and metabolomics) can provide data to help select effective DCs, tumors invariably harbor multiple genetic and signaling pathway alterations, approved cancer drugs are not yet available for every target identified by these methods, and our understanding of drug resistance mechanisms is all too often rudimentary.4,9–13 The complexities of cancer heterogeneity and adaptive responses to therapy also represent major hurdles to the rational selection of effective DCs. Systematic unbiased high-throughput screening (HTS) of DCs in panels of well-characterized tumor cell lines provides a complementary data-driven strategy to identify DCs with potential to be developed into effective therapies.9,10,12,14–23 We recently described a DC HTS campaign of 2260 cancer DCs in the NCI-60 human tumor cell line panel to generate >3 million data points that were used by researchers at the National Cancer Institute (NCI) to populate A Large Matrix of Anti-Neoplastic Agent Combinations (ALMANAC) Database.16,19 Selected synergistic DCs identified in the HTS campaign were subsequently confirmed by NCI investigators in vitro, potential MOAs of synergism were explored, and several DCs were shown to have greater than single-agent efficacy in mouse xenograft human cancer models. 19 Based on these studies, enrollment for phase I clinical trials has been opened for the DC of bortezomib plus clofarabine in patients with advanced refractory myelodysplastic syndromes and lymphomas (NCT02211755), and for the DC of nilotinib plus paclitaxel in adults with refractory solid tumors (NCT02379416). 19 Since 75% of the DCs examined in the DC HTS campaign are not listed in the Clinical Trials database, the ALMANAC database represents a rich resource for selecting promising DCs that might be suitable starting points for studies where they can be confirmed, mechanistically investigated, and clinically translated into effective therapeutic regimens.16,19
In the pilot phase of the NCI-60 DC HTS campaign that we performed, 190 individual 4 × 4 drug combination matrices (DCMs) of all possible pairwise combinations of 20 cancer drugs were screened against the 60 tumor cell lines. 16 Although there was no obvious tissue type or cell line bias in the distribution of synergistic drug interaction (DI) scores (DI scores > 3) from the pilot HTS, 11 (5.8%) DCMs formed between six drugs accounted for 54% of DI scores > 3, with each of the individual drugs participating in 3–4 DCMs: megestrol acetate, mitoxantrone, vinorelbine tartrate, raloxifene, gefitinib, and daunorubicin. 16 It is standard practice in any screening campaign to confirm primary HTS actives as qualified hits before they progress into follow-up assays and MOA studies. We previously reported the confirmation in vitro of the synergistic drug interaction between the vinca-alkaloid microtubule assembly inhibitor vinorelbine (Navelbine) tartrate and epidermal growth factor-receptor (EGF-R) tyrosine kinase inhibitor (TKI) gefitinib (Iressa) in the SK-MEL-5 melanoma cell line. 16 In the studies presented herein, we applied the following criteria to select additional DCs flagged in the pilot DC HTS with DI scores > 3 for confirmation of synergy in vitro: (1) DCs that exhibited DI scores > 3 against multiple tumor cell lines; (2) DCs where more than one well in the DCM produced DI scores > 3; (3) DCs that were cytotoxic rather than growth inhibitory or cytostatic; and (4) DCs where the individual drugs in the DC exhibited concentration-dependent growth inhibition in the selected tumor cell lines. Four DCs from the pilot DC HTS met these criteria ( Table 1 ), and this paper describes the process used to confirm that the DCs interacted synergistically to inhibit selected tumor cell line growth in vitro, and our exploration of drug interactions with ATP binding cassette (ABC) transporters as a plausible MOA for the observed synergies.
Selected Drug Combinations, NCI-60 Cell Lines, Tumor Histologies, Individual Drug GI50 Values, and Drug Interaction Analysis Summary.
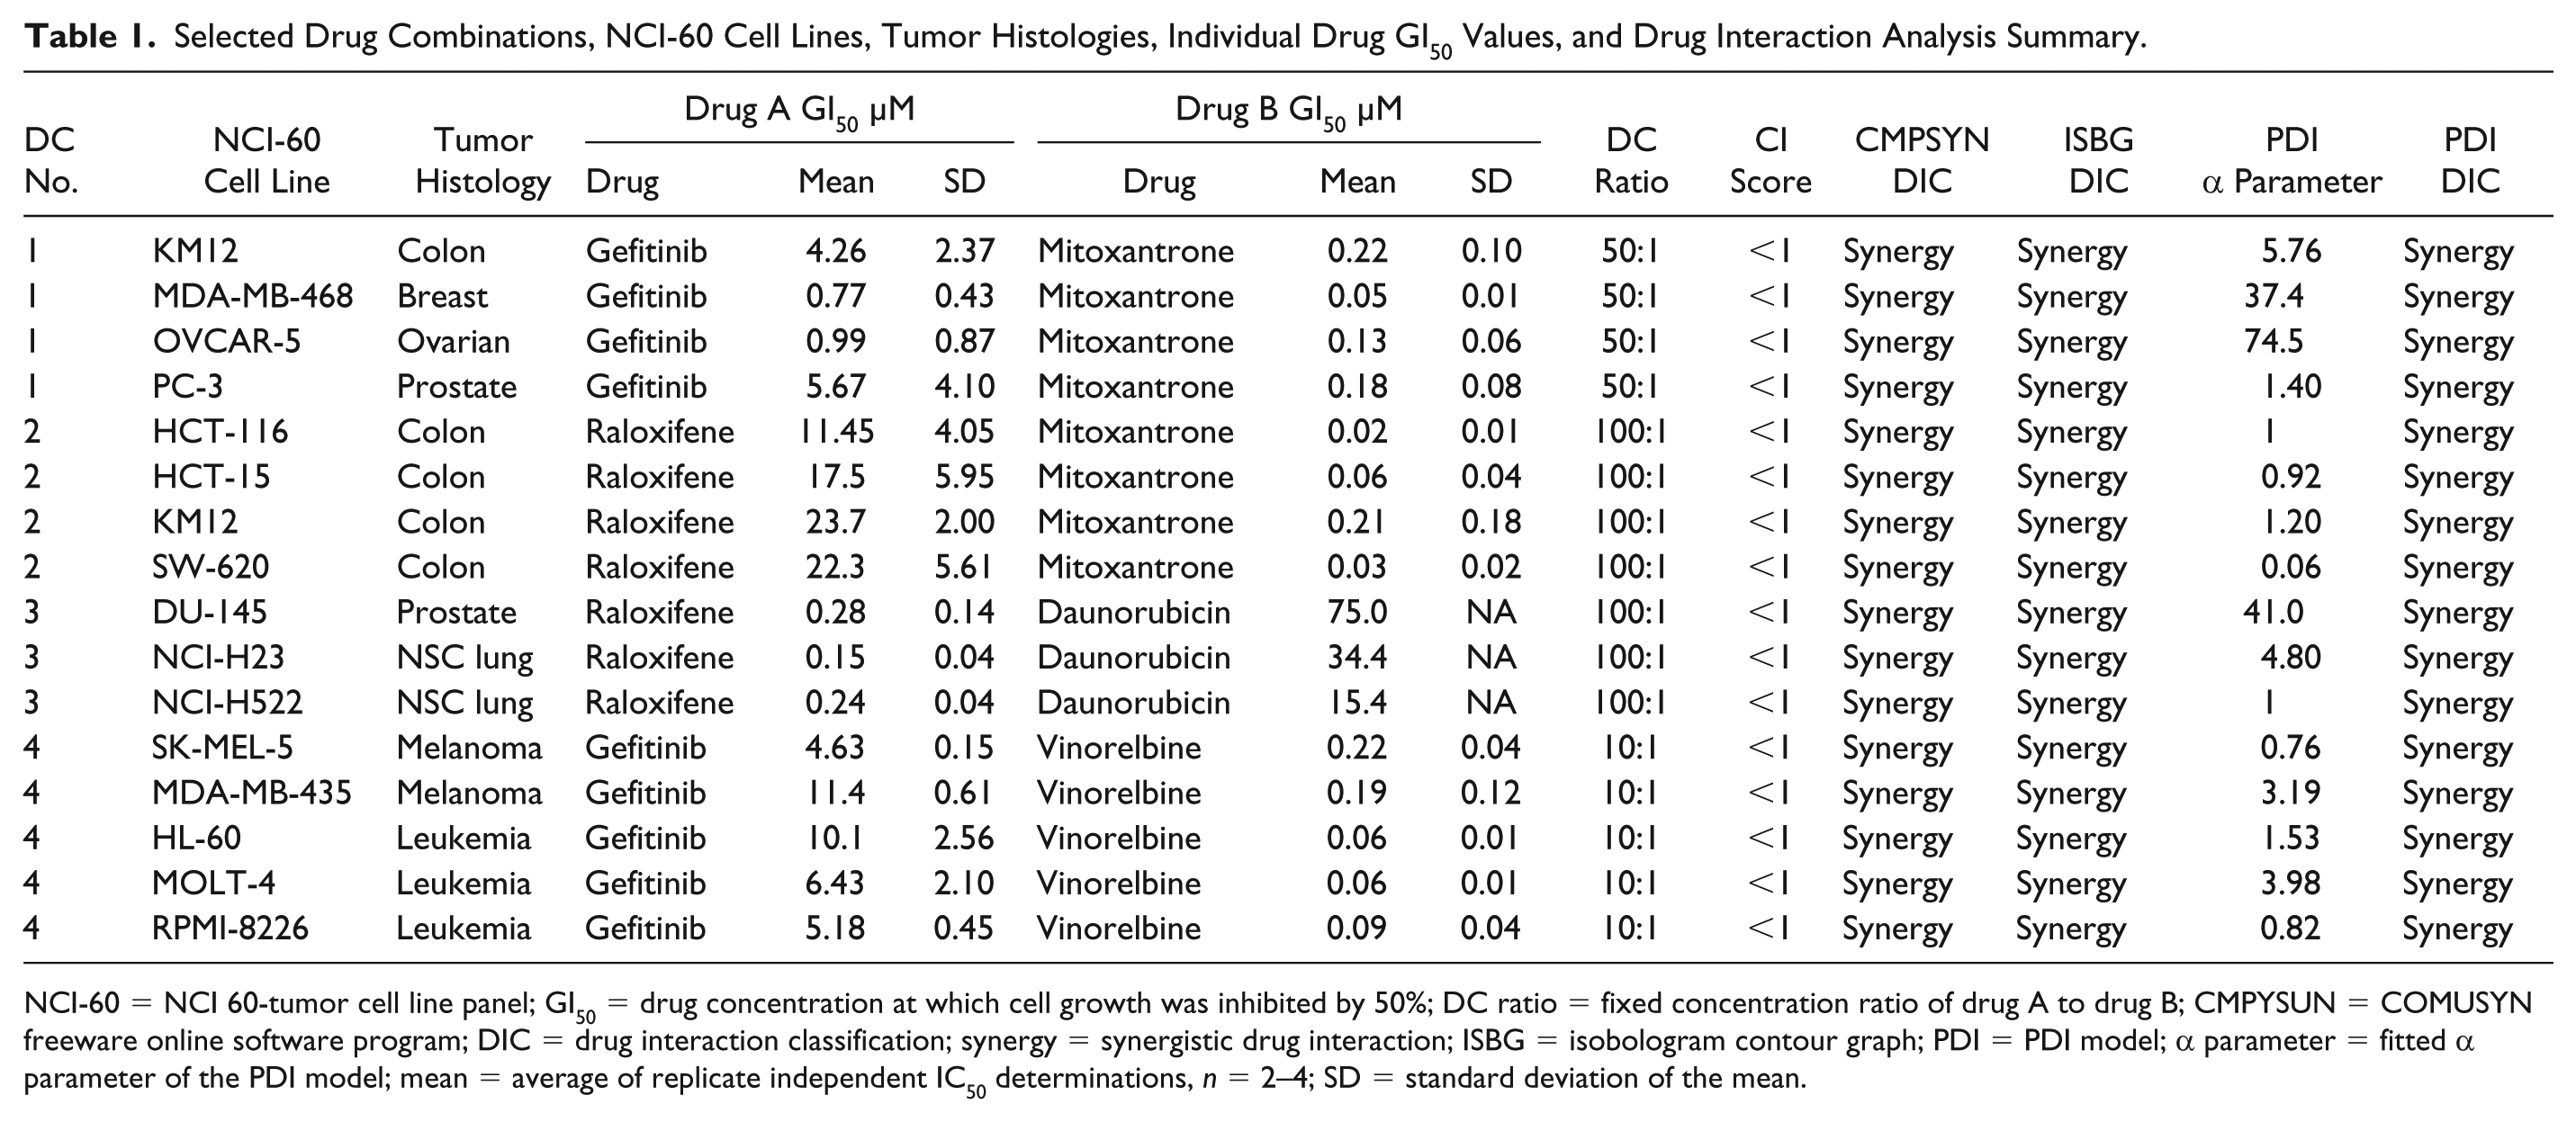
NCI-60 = NCI 60-tumor cell line panel; GI50 = drug concentration at which cell growth was inhibited by 50%; DC ratio = fixed concentration ratio of drug A to drug B; CMPYSUN = COMUSYN freeware online software program; DIC = drug interaction classification; synergy = synergistic drug interaction; ISBG = isobologram contour graph; PDI = PDI model; α parameter = fitted α parameter of the PDI model; mean = average of replicate independent IC50 determinations, n = 2–4; SD = standard deviation of the mean.
Materials and Methods
Reagents
Formaldehyde 37% was purchased from Sigma-Aldrich (St. Louis, MO). Hoechst 33342 was purchased from Life Technologies (Thermo Fisher Scientific, Waltham, MA). DMSO 99.9% high-performance liquid chromatography grade was obtained from Alfa Aesar (Ward Hill, MA). Dulbecco’s Mg2+- and Ca2+-free phosphate-buffered saline (PBS), minimum essential medium (MEM) supplemented with both GlutaMax and Earle’s salts, and geneticin were purchased from Gibco (Grand Island, NY). Dulbecco’s modified Eagle’s medium (DMEM) and Roswell Park Memorial Institute Medium (RPMI-1640) were purchased from Corning (Manassas, VA). Fetal bovine serum (FBS),
Cells and Cell Culture Methods
The NCI-60 cell lines were obtained from the NCI DTP Tumor Repository, which performed Applied Biosystems AmpFLSTR Identifiler testing with PCR amplification to confirm consistency with the published Identifiler STR profile for each of the NCI-60 cell lines and tested them for mycoplasma contamination. NCI-60 cell lines were maintained as previously described and cultured at 37 °C in 5% CO2 and 95% humidity in either RPMI-1640 or DMEM supplemented with 10% FBS, 1% 2 mM
NCI-60 Cell Line Growth Inhibition Assays
The 384-well NCI-60 cell line growth inhibition assays using the Cell Titer Glo (CTG) (Promega Corporation, Madison, WI) homogeneous cellular ATP detection reagent have been described previously. 16 Briefly, NCI-60 cell lines were harvested by trypsinization, centrifugation, and viable trypan blue excluding cells were counted using a hemocytometer. Forty-five microliters of cells at the appropriate cell density was seeded into the wells of white opaque clear-bottomed, 384-well, barcoded assay plates (Greiner BioOne, cat. 781098) using a Matrix multichannel pipettor (Thermo Fisher, Waltham, MA) or a Microflo (BioTek, Winooski, VT) bulk reagent dispenser. Assay plates were then incubated at 37 °C in 5% CO2 and 95% humidity for 24 h. After 24 h, 5 μL of test drugs was transferred into the test wells of the assay plate (0.2% DMSO final) using the 384-well transfer head on a Janus MDT Mini (Perkin Elmer, Waltham, MA) robotic liquid handling platform; plates were centrifuged at 100 x g for 1 min and returned to an incubator at 37 °C in 5% CO2 and 95% humidity for 72 h. After 72 h, assay plates were removed from the incubator, 25 μL of CTG was added to the wells using a Microflo bulk reagent dispenser, and after 15 min the relative light units (RLUs) were read on the SpectraMax M5e (Molecular Devices, Sunnyvale, CA). To analyze the growth inhibition data, we normalized the growth of compound-treated wells relative to the corresponding mean growth of our DMSO (0.2%) assay plate control wells (n = 64) and used GraphPad Prism 5 software to plot and fit data to curves using the sigmoidal dose–response variable slope equation Y = Bottom + [Top – Bottom]/[1 + 10^(LogGI50 – X)*HillSlope], where bottom is the Y value at the bottom plateau, top is the Y value at the top plateau, LogGI50 is the X value when the response is halfway between the bottom and top, and HillSlope describes the steepness of the curve. The growth inhibition 50 (GI50) value represents the concentration at which cell growth was inhibited by 50%.
Confirmation of Drug Combinations Scored Synergistic in the Pilot DC HTS
We arrayed 10 × 10 DCMs onto 384-well master plates ( Suppl. Fig. S1 ). Each DCM included 9 × 9 DC wells (81 total) together with 9 wells (18 total) containing each of the corresponding individual drug concentrations, and 1 DMSO control well. Two 10 × 10 DCMs were matrices arrayed in columns 3–22 of the 384-well plates, together with DMSO (0.2%) controls in columns 1, 2, 23, and 24 (n = 64). We used three distinct methods to analyze the interactions between the two drugs in the DCMs as described previously. 16 The Chou–Talalay median-effect model was used to calculate a combination index (CI) score.26,27 CI = (D1/DX1) + (D2/DX2), where D1 and D2 denote the doses of compound 1 and compound 2 required to reach an effect of X% as individual drug treatments, while DX1 and DX2 are the doses needed in combination to inhibit X%, respectively. DCs with CI > 1 exhibit antagonistic interactions, DCs with CI = 1 exhibit additivity, and DCs with CI < 1 exhibit synergistic interactions. The COMPUSYN freeware program was utilized to calculate CI values and evaluate DC synergy as described previously.16,28 Isobologram plots are used to evaluate drug interactions and in a plot of equally effective dose pairs termed isoboles, if a combination of drugs is additive, then the dose pairs that produce a selected effect level (e.g., 50%) form a straight line connecting A to B. 29 If the isoboles for effect levels significantly diverge from a straight line between A and B, then the DC is not additive. Isobologram plots were constructed in MATLAB. 16 The pharmacodynamic drug interaction (PDI) model describes the relation between drug effects such as percent growth inhibition (%GI) or cell loss fraction (CLF). 30 The drug interaction effect F = Fmax × (CA/IC50A + CB/IC50B + α × CA/IC50A × CB/IC50B)n/(CA/IC50A + CB/IC50B + α × CA/IC50A × CB/IC50B)n + 1, where Fmax is the maximal effect of drug A and drug B, CA and CB are the concentrations of drug A and drug B, IC50A and IC50B are the individual drug concentrations that induce 50% of the max growth inhibition or cell loss, n is the slope of the response surface, and α is a parameter that characterizes the synergistic status of drug interaction. When α = 0 the drug interaction is additive, for α >0 the drug interaction is synergistic, and for α < 0 the drug interaction is antagonistic. The PDI analysis and plots were produced in MATLAB. 16
High-Content Imaging Hoechst Accumulation Assays
MDCKII-ABCG2 and MDCKII-EV cells were harvested, counted, and seeded at 20,000 cells per well in 384-well, black-walled, clear-bottom microtiter plates (Greiner BioOne, cat. 781091) and cultured at 37 °C in 5% CO2 and 95% humidity overnight to allow cells to adhere and form monolayers. After 8–12 h in culture, adherent monolayers were exposed to the ABCG2 substrate Hoechst 33342 at 8 µg/mL for 60 min at 37 °C in 5% CO2 and 95% humidity before being fixed with 3.7% formaldehyde for 30 min and washed 3 times with 80 µL of PBS, and then two fluorescent images were acquired per well in the DAPI channel using a 10× Plan Fluor 0.3 NA objective and the ImageXpress Micro (IXM) (Molecular Devices) imaging platform. The IXM is an automated, wide-field, high-content imaging platform integrated with the MetaXpress Imaging and Analysis software. The optical drive includes a 300 W Xenon lamp broad-spectrum white light source and a 1.4-megapixel 2/3-inch chip Cooled CCD Camera and optical train for fluorescence and transmitted light imaging. The IXM has Zero Pixel Shift filters for the DAPI, FITC/ALEXA 488, CY3/TRITC, CY5, and Texas Red channels. To acquire images of nuclei, we used an automated image-based focus algorithm in the first well to acquire both coarse (large micrometer steps) and fine (small micrometer steps) sets of images of Hoechst-stained objects in the DAPI channel to select the best focus image. In all subsequent wells, only the fine focus set of images was acquired to select the best focus Z plane.
We used the multiwavelength cell scoring (MWCS) image analysis module of the MetaXpress software to quantify the integrated fluorescent intensities of the Hoechst-stained nuclei in digital images acquired on the IXM. The MWCS image segmentation identified and classified Hoechst 33342-stained fluorescent objects in the DAPI channel that exhibited appropriate fluorescent intensities above background and morphology (size, width, length, and area) characteristics of MDCKII nuclei and used these objects to create nuclear masks for each cell. For MDCKII-ABCG2 and MDCKII-EV cells, we defined the approximate minimum width of Hoechst-stained nuclei to be 8 µm and the approximate maximum width to be 15 µm, and the threshold intensity above local background to be >50. The nuclear mask was then used to quantify the mean integrated fluorescence intensity (MIFI) of Hoechst within the nuclear regions of cells and to count the number of cells per image. We utilized the well-averaged MIFI data from replicate wells to quantify and compare Hoechst accumulation in MDCKII-ABCG2 and MDCKII-EV cells. We exported the MIFI data on a per cell basis and analyzed the frequency distributions of the MDCKII-ABCG2 and MDCKII-EV populations using the Spotfire analytics software (TIBECO, Somerville, MA). We used the SciStatCalc online calculator (http://scistatcalc.blogspot.com/2013/11/kolmogorov-smirnov-test-calculator.html) to perform a two-sample Kolmogorov-Smirnov (KS) nonparametric test and compare the cumulative distributions of the MDCKII-ABCG2 and/or MDCKII-EV population data sets in presence or absence of compounds.
To investigate the effects of known and presumed ABCG2 drug efflux inhibitors on Hoechst accumulation in MDCKII-ABCG2 and MDCKII-EV monolayers, compounds were added simultaneously with Hoechst and incubated for 60 min at 37 °C in 5% CO2 and 95% humidity. Test compounds included the ABCG2 inhibitor Ko143 in the 0.02–10 µM range, and either gefitinib or raloxifene at 10 µM.
Imaging Data Visualizations
Pseudocolor fluorescence pixel intensity data visualizations were used to illustrate Hoechst 33342 uptake and accumulation in MDCKII-EV and MDCKII-ABCG2 cultures. Pseudocolor visualizations present the relative fluorescent pixel intensities in the image indicated as distinct colors, with the hotter and brighter colors (low to high, yellow, red, white) representing higher-intensity signals and cooler colors (low to high, purple, cyan, green) representing lower-intensity signals. 31
Results
Confirmation of Selected Synergistic Drug Combinations Flagged in the Pilot Phase of the NCI-60 DC-HTS Campaign
Table 1 lists four DCs identified in the pilot DC HTS campaign that were chosen for follow-up confirmation of synergistic growth inhibition interactions in selected tumor cell lines. DC-1 between the EGF-R TKI gefitinib and the topoisomerase inhibitor mitoxantrone met our selection criteria in four cell lines representing different tumor histologies: colon, breast, ovarian, and prostate. In contrast, DC-2 between the SERM raloxifene in combination with mitoxantrone met the criteria in four colon cancer cell lines. DC-3 between raloxifene and the topoisomerase inhibitor daunorubicin satisfied the criteria in one prostate cancer cell line and two non-small-cell lung cancer cell lines. Finally, DC-4 between gefitinib and the microtubule assembly inhibitor vinorelbine fulfilled the criteria in two melanoma and three leukemia cell lines.
To determine whether the pharmacological interactions between two drugs are antagonistic, additive, or synergistic involves testing a matrix of both drugs over a broad range of concentrations and fixed DC ratios to provide a pairwise interaction surface that is compared with the individual agent responses.26,29,32–34 To confirm the synergistic interactions among DCs 1–4 (
Table 1
), we prepared 10 × 10 DCMs (
Suppl. Fig. S1
) and analyzed the fraction of cells affected by fixed DC ratios to calculate CI values, plotted the data in isobologram contour graphs, and applied the PDI model to create three-dimensional (3D) graphs and calculate the fitted α parameter (
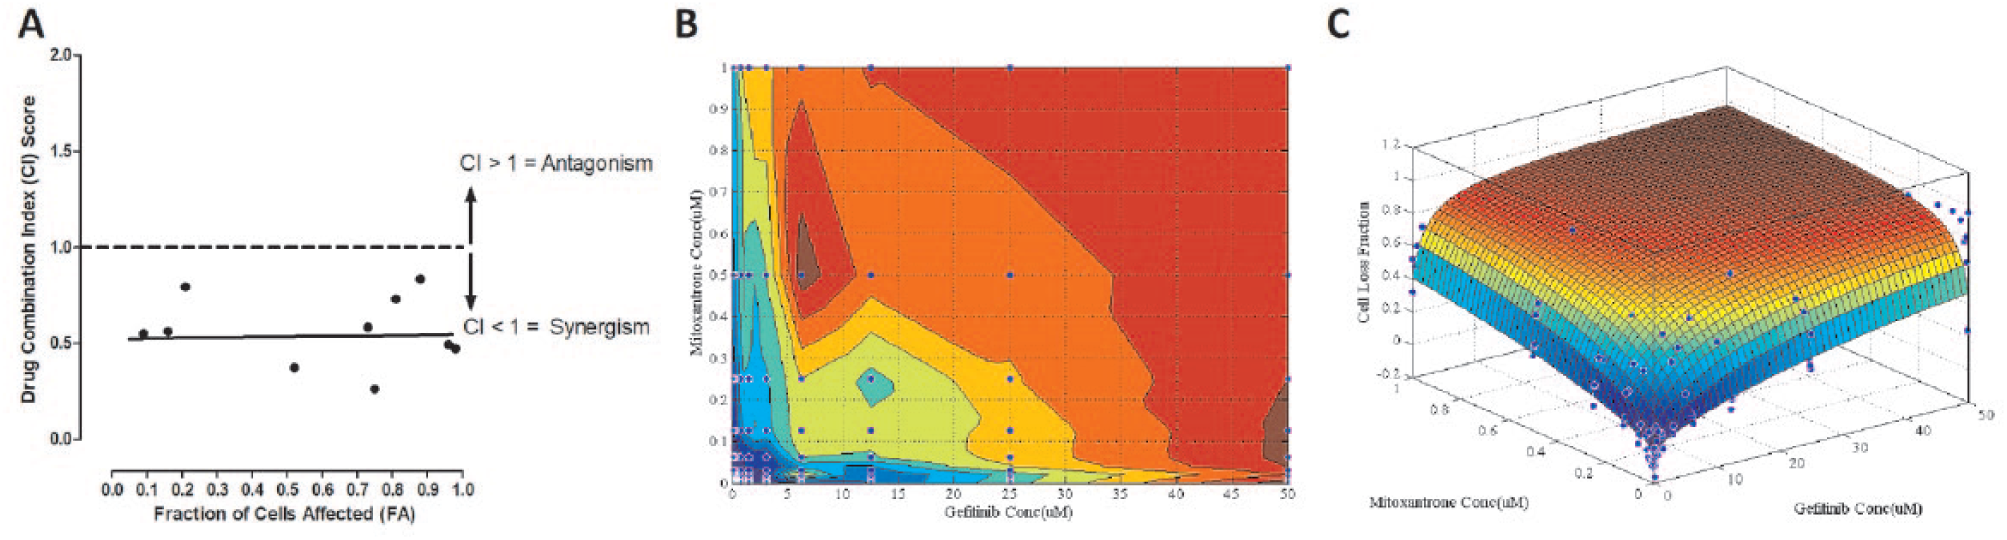
Confirmation of DC 1 between gefitinib and mitoxantrone in OVCAR-5 ovarian cancer cell line. (
Development and Validation of the High-Content-Imaging ABCG2 Drug Efflux Transporter Hoechst Accumulation Assay
Various assay formats have been developed to measure and compare ABC transporter drug efflux activity in control and ABC transporter expressing cell lines. Flow cytometry is used to measure and compare the accumulation of fluorescent ABC transporter substrates in cells, or Transwell assays can measure the permeability and bidirectional, apical to basolateral and vice versa, passage of substrates through monolayer cultures separating substrate donor and acceptor chambers.24,25,35,36 We developed an imaging assay to measure the accumulation of the ABCG2 substrate Hoechst 33342 in MDCKII-EV and MDCKII-ABCG2 cell lines that have previously been used in both Transwell and flow cytometry assay formats.24,25 Assay development experiments established the following optimal 384-well assay conditions for the imaging-based Hoechst accumulation assay: a cell seeding density of 20,000 MDCKII-EV or MDCKII-ABCG2 cells per well; a Hoechst 33342 concentration of 8 µg/mL; a dye accumulation period of 60 min at 37 °C in 5% CO2 and 95% humidity; acquisition of two fluorescent images per well in the DAPI channel using a 10× Plan Fluor 0.3 NA objective on the IXM; and image analysis using the MWCS module. Figure 2A shows representative grayscale 10× images of the Hoechst-stained nuclei and the corresponding pseudocolor fluorescent pixel intensity visualizations of MDCKII-EV and MDCKII-ABCG2 cells exposed to Hoechst using these assay conditions. Images of the Hoechst-stained nuclei of MDCKII-EV cells were brighter and more intense than those of MDCKII-ABCG2 cells, which was corroborated by the hotter/brighter colors (yellow, red, white) representing higher-intensity signals in the pseudocolor pixel intensity visualizations of MDCKII-EV cells compared with the cooler colors (purple, cyan, green) of the lower-intensity signals observed in MDCKII-ABCG2 cells. We used the MIFI data output of the MWCS image analysis module to quantify and compare Hoechst accumulation in MDCKII-ABCG2 and MDCKII-EV cell populations ( Fig. 2B ), and on a well-averaged basis ( Fig. 2C ). The results frequency distribution of the binned cellular MIFI data for the MDCKII-ABCG2 and MDCKII-EV populations exhibited different profiles that were substantially shifted in MIFI values relative to each other ( Fig. 2B ). The MDCKII-ABCG2 population MIFI values were distributed in a single nonsymmetrical peak around a median of ~100,000 that exhibited an extended tail toward higher MIFI values. The MDCKII-EV population MIFI values were distributed between two conjoined peaks with medians of ~200,000 and ~400,000, which would be consistent with 1n (Go/G1) and 2n (G2/M) DNA peaks characteristic of the normal cell cycle. Although there was some overlap between the MIFI values in the MDCKII-ABCG2 and MDCKII-EV populations, the MDCKII-ABCG2 population was substantially shifted to lower MIFI values relative to the majority of the MDCKII-EV population. A comparison of the MDCKII-ABCG2 and MDCKII-EV population MIFI data sets using the nonparametric two-sample KS test produced a maximum deviation D of 0.66, a ks statistic of 41.5, and a p value < 0.05, and cumulative distribution frequency curves that were widely separated (data not shown). The KS analysis violated the null hypothesis and supports that the two populations had different distributions. At the well-averaged level, the Hoechst MIFI values observed in MDCKII-ABCG2 wells were significantly (Student t test, p < 0.05) lower than those detected in MDCKII-EV wells ( Fig. 2C ). Collectively, these data indicated that the expression of the ABCG2 drug efflux transporter in MDCKII cells significantly reduced Hoechst accumulation levels compared with control cells ( Fig. 2 ).

High-content imaging assay to measure the accumulation of the ABCG2 substrate Hoechst 33342 in MDCKII-EV and MDCKII-ABCG2 cell lines. () and MDCKII-EV ( ) cell populations. The Y axis represents the number of cells detected in each MIFI bin plotted on the X axis. A two-sample KS test of the two data sets produced a maximum deviation D of 0.66, a ks statistic of 41.5, and a p value < 0.05, which violated the null hypothesis that the two populations have identical distributions. (
Ko143 is a potent and less toxic analog of the fungal toxin fumitremorgin C, which is a selective inhibitor of the ABCG2 efflux transporter.37,38 Figure 3 shows the effects of co-administration of 10 µM Ko143 on the accumulation of Hoechst 33342 in MDCKII-EV and MDCKII-ABCG2 cells. Relative to DMSO controls, exposure of MDCKII-EV cells to 10 µM Ko143 had no discernable effect on the brightness and intensity of the Hoechst-stained nuclei apparent in the grayscale images and pseudocolor pixel intensity visualizations ( Fig. 3A ). In marked contrast, 10 µM Ko143 increased the brightness and intensity of the Hoechst-stained nuclei in the images and pseudocolor pixel intensity visualizations of MDCKII-ABCG2 cells relative to DMSO control cells. The images and pseudocolor pixel intensity visualizations of MDCKII-ABCG2 cells treated with Ko143 were very similar to those of MDCKII-EV cells ± Ko143. The results frequency distribution of the binned cellular MIFI data for MDCKII-EV cell populations ± Ko143 exposure exhibited overlapping profiles with two conjoined peaks with median MIFI values ~160,000 and ~340,000 ( Fig. 3B ). A two-sample KS test of the MDCKII-EV population MIFI data sets ± Ko143 produced a maximum deviation D of 0.06, a ks statistic of 4.4, and a p value < 0.05, and the cumulative distribution frequency curves of the two populations overlapped very closely (data not shown). The KS analysis indicates that while the two populations had different distributions the separation was small. In MDCKII-ABCG2 cells treated with DMSO, the binned cellular MIFI data were distributed in a single nonsymmetrical peak around a median MIFI value ~80,000 with an extended tail toward higher MIFI values ( Fig. 3C ). However, exposure of MDCKII-ABCG2 cells to Ko143 altered the MIFI distribution profile and shifted the MIFI values higher ( Fig. 3C ). In MDCKII-ABCG2 cells exposed to Ko143, the binned cellular MIFI data were distributed between two conjoined peaks with median MIFI values ~180,000 and ~360,000 ( Fig. 3C ), very similar to the profiles of MDCKII-EV cells ± Ko143 ( Fig. 3B ). A two-sample KS test of the MDCKII-ABCG2 population MIFI data sets ± Ko143 produced a maximum deviation D of 0.67, a ks statistic of 42.1, and a p value < 0.05, and the cumulative distribution frequency curves of the two populations were widely separated (data not shown), indicating that the two populations had different and widely separated distributions. Figure 3D shows the time-dependent change in well-averaged Hoechst accumulation MIFI values in MDCKII-EV or MDCKII-ABCG2 cells ± exposure to 10 µM Ko143. In MDCKII-EV and MDCKII-ABCG2 cells treated with DMSO there was a gradual linear increase in Hoechst accumulation in both populations over time, with MDCKII-ABCG2 cells consistently exhibiting >2-fold lower Hoechst accumulation MIFI values than MDCKII-EV cells. In MDCKII-EV cells co-administered Ko143, the linear rate of accumulation of Hoechst appeared to be marginally higher than in DMSO control wells. In MDCKII-ABCG2 cells, however, exposure to Ko143 dramatically increased the linear rate of accumulation of Hoechst such that after 60 min, Hoechst accumulation MIFI values approached those observed in MDCKII-EV cells ± Ko143 ( Fig. 3D ). In MDCKII-EV cells, Hoechst accumulation increased in a roughly linear fashion as Ko143 concentrations were increased ( Fig. 3E ). In MDCKII-ABCG2 cells, however, the concentration-dependent increase in Hoechst accumulation produced by Ko143 exposure could be fit to a sigmoidal curve (r2 = 0.9) and exhibited an IC50 of 0.54 µM for inhibition of ABCG2-mediated Hoechst efflux ( Fig. 3E ). Collectively, these data demonstrated that exposure to Ko143 inhibited ABCG2-mediated Hoechst efflux in a concentration- and time-dependent manner in MDCKII-ABCG2 cells but not MDCKII-EV cells ( Fig. 3 ), thereby validating the ABCG2 efflux transporter high-content screening assay.

Effects of exposure to the ABCG2 inhibitor Ko143 on Hoechst 33342 accumulation in MDCKII-EV and MDCKII-ABCG2 cell lines. () or absence ( ) of 10 µM Ko143 for 60 min at 37 °C in 5% CO2 and 95% humidity. The Y axis represents the number of cells detected in each MIFI bin plotted on the X axis. A two-sample KS test of the MDCKII-EV population MIFI data sets ± Ko143 produced a maximum deviation D of 0.05, a ks statistic of 4.4, and a p value < 0.05, and the cumulative distribution frequency curves of the two populations overlapped closely (data not shown). () or absence () of 10 µM Ko143 for 60 min at 37 °C in 5% CO2 and 95% humidity. The Y axis represents the number of cells detected in each MIFI bin plotted on the X axis. A two-sample KS test of the MDCKII-ABCG2 population MIFI data sets ± Ko143 produced a maximum deviation D of 0.67, a ks statistic of 42.1, and a p value < 0.05, and the cumulative distribution frequency curves of the two populations were widely separated (data not shown) indicating that the two populations had different distributions. () or absence (
 ) of 10 µM Ko143, and MDCKII-ABCG2 cells in the presence (•) or absence (
 ) of 10 µM Ko143. Representative data from one of three independent experiments each performed in triplicate wells are shown. () versus MDCKII-ABCG2 cells (•). The data represent one of three independent experiments each performed in triplicate wells.
Do Gefitinib and Raloxifene Inhibit ABCG2 Transporter Substrate Efflux?
Figure 4
shows the effects of co-administration of 10 µM of either Ko143, gefitinib, or raloxifene on the accumulation of Hoechst 33342 in MDCKII-EV and MDCKII-ABCG2 cells. Relative to DMSO controls, exposure of MDCKII-EV cells to 10 µM Ko143, gefitinib, or raloxifene had no discernable effect on the brightness and intensity of the Hoechst-stained nuclei apparent in the grayscale images and pseudocolor pixel intensity visualizations (
Fig. 4A
). In MDCKII-ABCG2 cells, however, treatment with 10 µM Ko143, gefitinib, or raloxifene all enhanced the brightness and intensity of the Hoechst-stained nuclei in the images and pseudocolor pixel intensity visualizations relative to cells exposed to DMSO (
Fig. 4B
). Exposure of MDCKII-EV cells to 10 µM gefitinib or raloxifene produced no discernable effects on the results frequency distribution profiles of the binned cellular MIFI population data that exhibited two conjoined peaks with median MIFI values ~200,000 and ~400,000 (
Effects of Exposure to Ko143, gefitinib, or raloxifene on Hoechst 33342 accumulation in MDCKII-EV and MDCKII-ABCG2 cell lines. () of 10 µM gefitinib for 60 min at 37 °C in 5% CO2 and 95% humidity. The Y axis represents the number of cells detected in each MIFI bin plotted on the X axis. A two-sample KS test of the MDCKII-EV population MIFI data sets ± gefitinib produced a maximum deviation D of 0.05, a ks statistic of 3.5, and a p value < 0.05, and the cumulative distribution frequency curves of the two populations overlapped closely (data not shown). () or absence () of 10 µM gefitinib for 60 min at 37 °C in 5% CO2 and 95% humidity. The Y axis represents the number of cells detected in each MIFI bin plotted on the X axis. A two-sample KS test of the MDCKII-ABCG2 population MIFI data sets ± gefitinib produced a maximum deviation D of 0.47, a ks statistic of 29.7, and a p value < 0.05, and the cumulative distribution frequency curves of the two populations widely separated (data not shown). (
Discussion
The NCI-60 tumor cell lines encompass nine cancer lineages that for >30 years have been used to screen small-molecule and natural product extract libraries for compounds that inhibit tumor cell line growth and might then be optimized and developed into cancer drugs.19,39–42 Growth inhibition patterns across the 60 cell lines are similar for drugs with closely related MOAs, and the COMPARE algorithm can be used to predict the MOAs of novel molecules that exhibit similar sensitivity and resistance profiles to known anticancer agents.40,41 The NCI-60 cell lines have been extensively characterized: exome sequencing, DNA methylation, mRNA expression, microRNA expression, protein levels and modifications, ABC drug efflux transporter mRNA expression levels, enzyme activities, and metabolomics profiling.39,40,43,44 Recently, the NCI established the ALMANAC database, which contains data from a DC HTS campaign of 100 FDA-approved cancer drugs that we screened in pairwise DCs across the 60 cell lines.16,19 Since 75% of the DCs are not listed in the Clinical Trials database, the ALMANAC database can be mined to identify novel DCs that might be suitable starting points for future clinical development.16,19 Using criteria described above, we selected four DCs that were flagged as synergistic in the DC HTS campaign for confirmation of synergy in vitro (
Table 1
).
16
We tested 10 × 10 DCMs and calculated CI values, plotted the data in isobologram contour graphs, and applied the PDI model to create 3D graphs and calculate the fitted α parameter (
Queries of the ClinicalTrials.Gov database for DC-1 retrieved two clinical trials open for enrollment. Gefitinib and mitoxantrone are 2 of 75 FDA-approved drugs in a genomics-based assignment of therapy clinical trial in patients with advanced urothelial carcinoma (NCT02788201). The Co-eXpression ExtrapolatioN (COXEN) model algorithm will be used to determine the best therapy from among the 75 agents (single agent or combination) for patients with urothelial carcinoma that have progressed on at least one chemotherapy regimen. Gefitinib and mitoxantrone are also among the agents in a high-throughput drug sensitivity assay and genomics-guided treatment clinical trial in patients with relapsed or refractory acute leukemia (NCT02551718). Treatment options will be selected based on high-throughput ex vivo drug sensitivity assays in combination with mutation analysis of patients with acute leukemia that has returned after a period of improvement or does not respond to treatment. There are also preclinical in vitro data that corroborate that the gefitinib and mitoxantrone combination might be more effective against tumor cell lines than single-agent treatments. Gefitinib increased the growth inhibitory effect of mitoxantrone in the MCF-7 estrogen receptor alpha-positive human breast cancer cell line, and also in a fulvestrant-resistant cell line (MCF-7/F) derived from MCF-7 cells. 45 The combination of mitoxantrone with gefitinib and cyclopamine produced supra-additive antiproliferative effects in androgen-sensitive and androgen-independent prostate cancer cell lines. 46 In contrast, however, gefitinib did not enhance the cytotoxicity of mitoxantrone, or several other antitumor agents, in a panel of five oral squamous cell carcinoma cell lines. 47
Queries of the ClinicalTrials.Gov database failed to return any clinical trials for DCs 2–4. In preclinical in vitro studies with DC-2, a raloxifene analog partially reversed drug resistance to mitoxantrone in an estrogen receptor beta-positive A2780 ovarian cancer cell line stably transfected with splicing factor SPF45. 48 In preclinical in vitro studies of DC-3, exposure to raloxifene for 48 h partially restored the sensitivity of K562/A02 cells to daunorubicin. 49 The K562/A02 cell line is a multi-drug-resistant variant of the K562 chronic myelogenous leukemia (CML) cell line, which is ~100-fold resistant to daunorubicin. 49 In preclinical in vitro studies of DC-4, gefitinib and vinorelbine DCs have been investigated in head and neck squamous cell carcinoma (HNSCC), NSCLC, and melanoma tumor cell line models.16,50,51 In HNSCC tumor cell lines, DC-4 had a supra-additive cytotoxic effect in 4/6 cell lines and an additive cytotoxic effects in the others. 50 It was suggested that since gefitinib and vinorelbine are both metabolized by CYP3A4 P450 isoenzymes, drug–drug interactions may alter their respective exposure levels in vivo. 50 In 17 NSCLC cell lines that included 4 that overexpressed the ABC drug efflux transporter ABCB1 (Pgp/MDR1) and 3 with sensitizing EGF-R mutations, DC-4 exhibited synergism in cell lines lacking EGF-R mutations. 51 Although the synergy between gefitinib and vinorelbine was more robust in ABCB1 overexpressing NSCLC cell lines, it was also apparent in cell lines with efflux transporter expression levels below detection limits. 51 Since gefitinib is an ABCB1 inhibitor and vinorelbine is an ABCB1 substrate, it was considered probable that blocking the efflux transporter active resistance mechanism contributed to the synergy between the two drugs in ABCB1 overexpressing NSCLC cell lines, but that other MOAs of resistance were likely affected in cell lines with no detectable efflux transporter expression. 51 The gefitinib and vinorelbine combination was also confirmed to be synergistic in vitro in the SK-MEL-5 melanoma cell line. 16
Several factors prompted us to investigate drug efflux transporter interactions as a potential MOA for the synergistic inhibition of tumor cell line growth by DCs 1–4 (
Selected Drug Combinations, NCI-60 Cell Lines, Drug Efflux Transporter mRNA Expression Levels, and Compound Functional Activities.
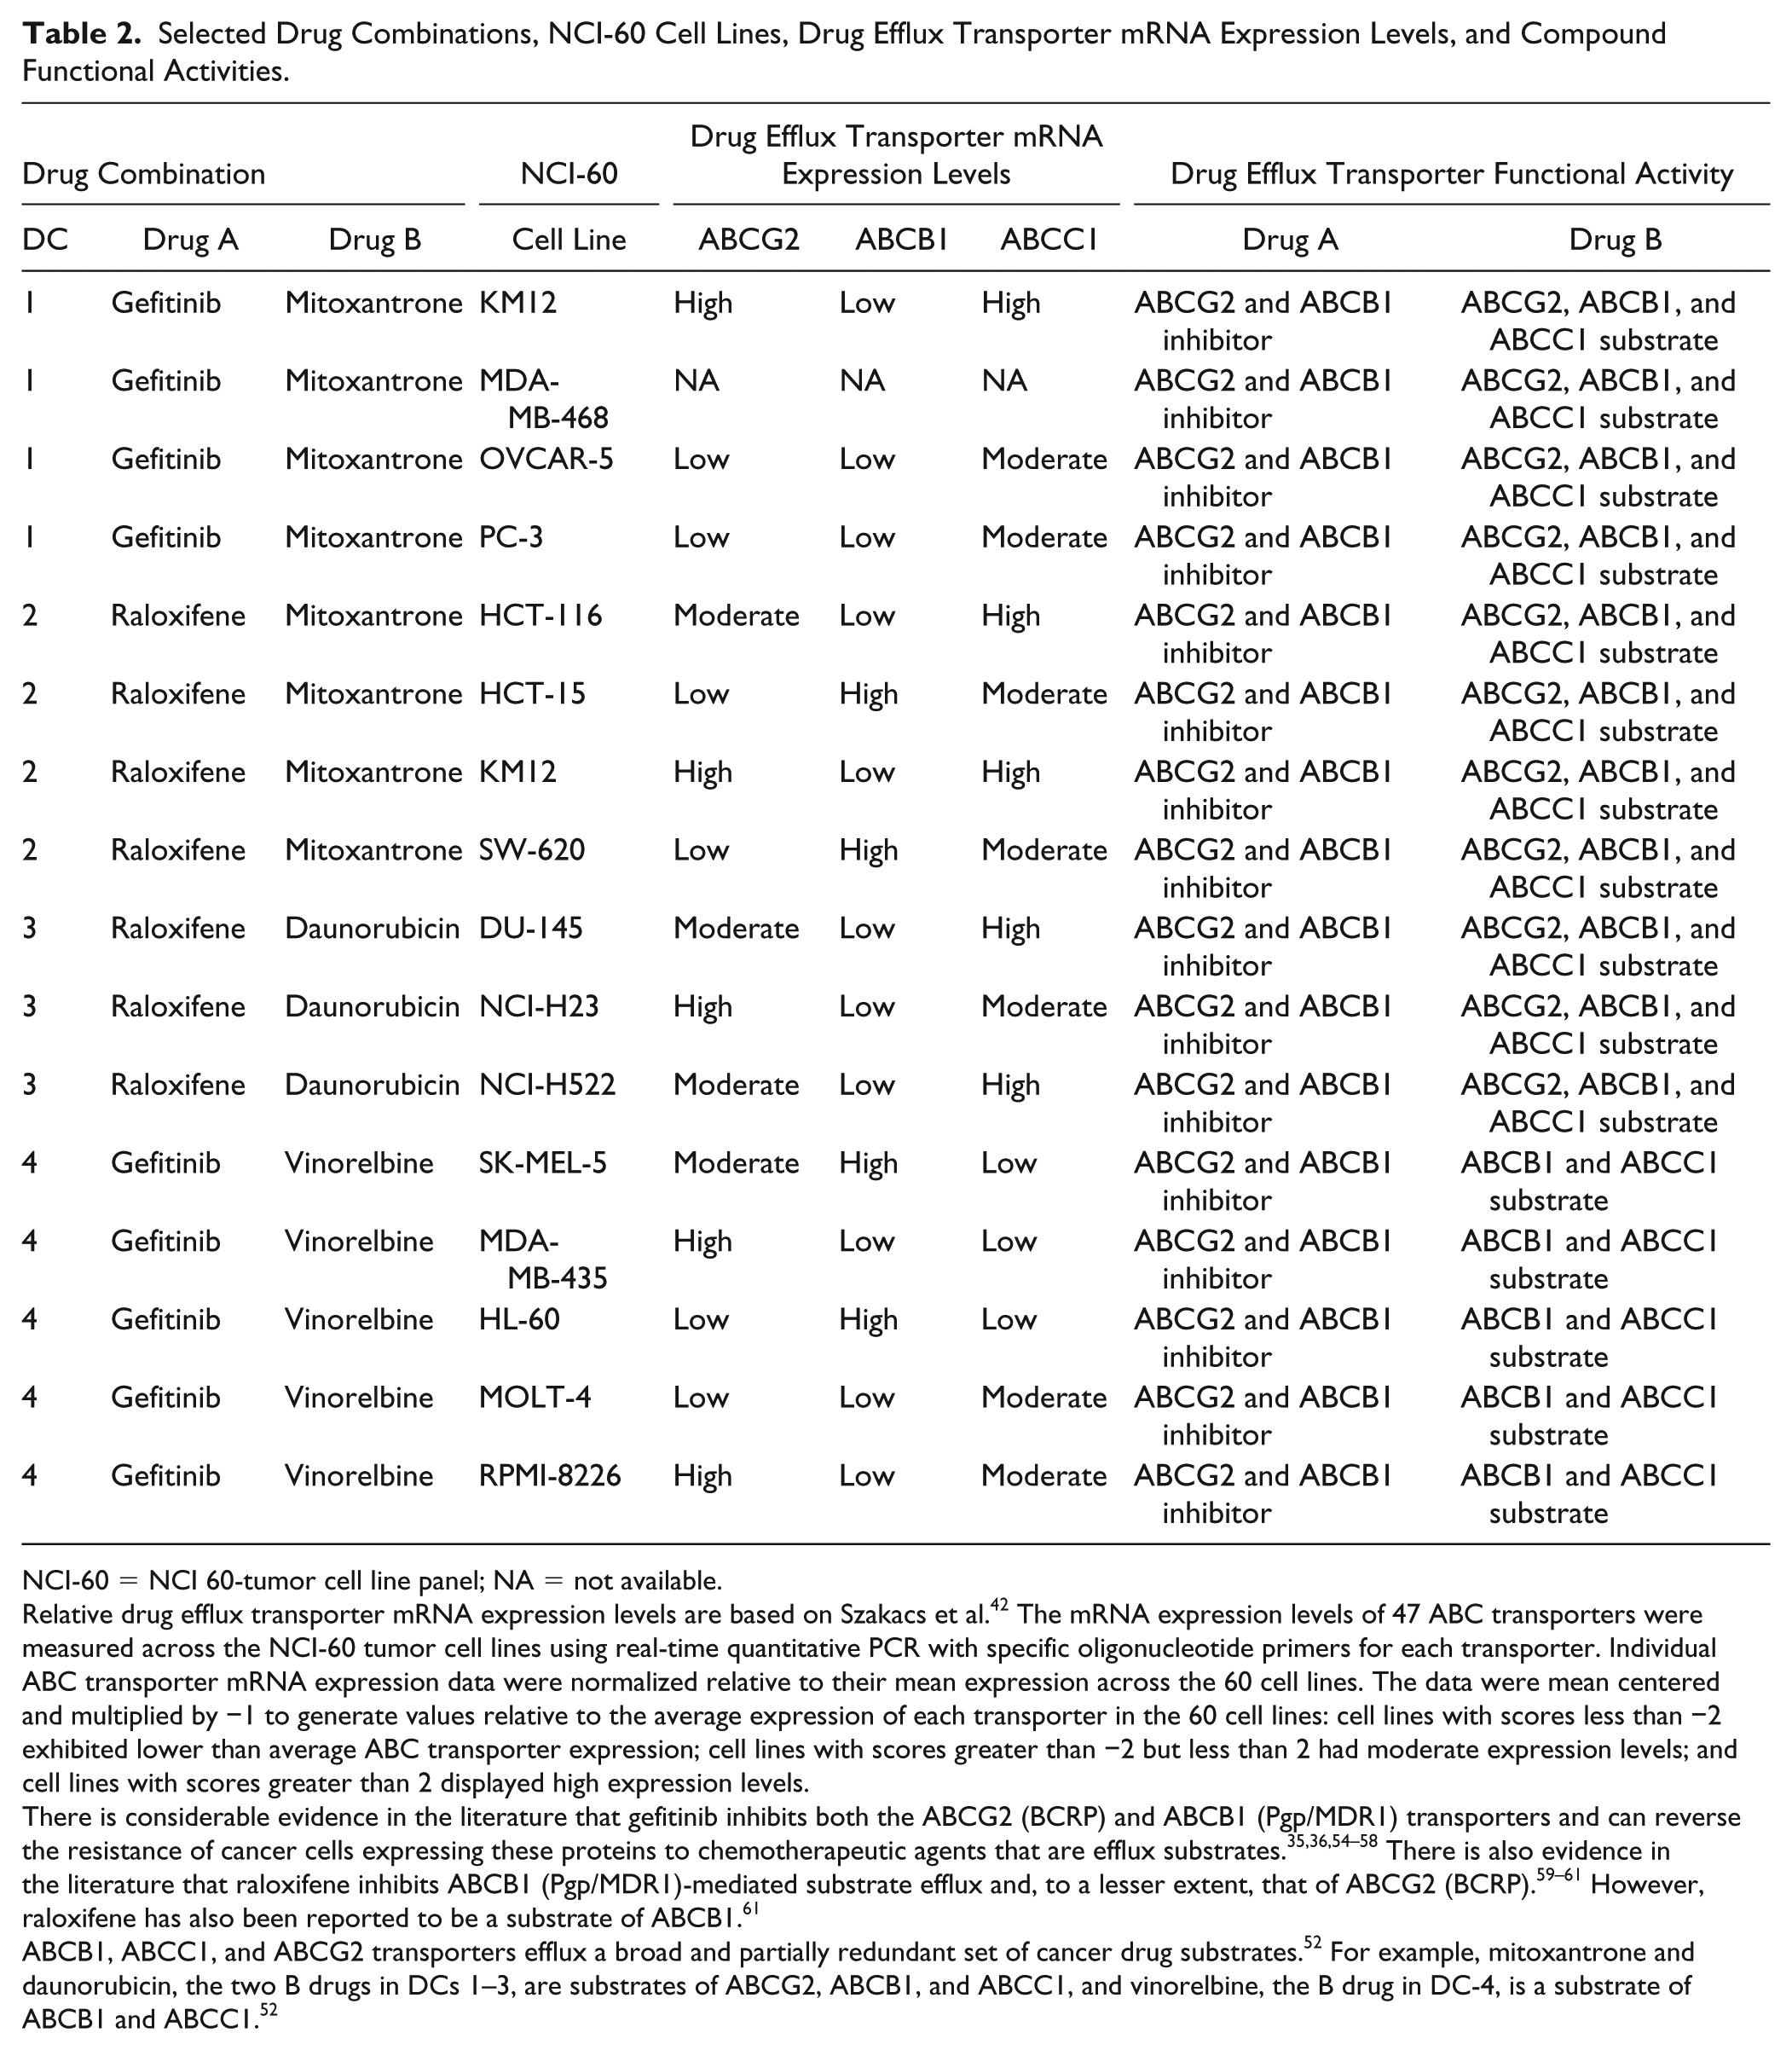
NCI-60 = NCI 60-tumor cell line panel; NA = not available.
Relative drug efflux transporter mRNA expression levels are based on Szakacs et al. 42 The mRNA expression levels of 47 ABC transporters were measured across the NCI-60 tumor cell lines using real-time quantitative PCR with specific oligonucleotide primers for each transporter. Individual ABC transporter mRNA expression data were normalized relative to their mean expression across the 60 cell lines. The data were mean centered and multiplied by −1 to generate values relative to the average expression of each transporter in the 60 cell lines: cell lines with scores less than −2 exhibited lower than average ABC transporter expression; cell lines with scores greater than −2 but less than 2 had moderate expression levels; and cell lines with scores greater than 2 displayed high expression levels.
There is considerable evidence in the literature that gefitinib inhibits both the ABCG2 (BCRP) and ABCB1 (Pgp/MDR1) transporters and can reverse the resistance of cancer cells expressing these proteins to chemotherapeutic agents that are efflux substrates.35,36,54–58 There is also evidence in the literature that raloxifene inhibits ABCB1 (Pgp/MDR1)-mediated substrate efflux and, to a lesser extent, that of ABCG2 (BCRP).59–61 However, raloxifene has also been reported to be a substrate of ABCB1. 61
Pharmacological inhibition of ABC drug efflux transporters has been actively pursued as a strategy to reverse cancer drug resistance and enhance clinical efficacy. 52 However, clinical trials where ABC transporter inhibitors were used to enhance cancer drug efficacy have largely been disappointing, in part because the inhibitors altered the pharmacokinetics of the anticancer agents, decreasing their systemic clearance and increasing the severity and/or incidence of adverse events. 52 In addition to exogenous xenobiotics, ABC transporters also mediate the efflux of endogenous molecules and metabolites from cells, and inhibition of these processes may be detrimental to normal cells. 52 Systematic unbiased HTS of DCs in well-characterized tumor cell lines provides a way to identify DCs that exhibit greater than additive activity against selected cell lines. The studies presented herein demonstrate that novel synergistic DCs identified in a DC HTS campaign can be confirmed in vitro, and plausible MOAs can be explored. If the drugs in the DC HTS were FDA approved anticancer agents, effective DCs that are confirmed in vitro have the potential to be advanced rapidly into clinical translation. DC confirmation and MOA data would be used to prioritize specific DCs for testing in mouse xenograft human cancer models, and for DCs that exhibited superior efficacy in vivo, the cumulative data would support their clinical evaluation in patients.
Supplemental Material
DS_DISC844566 – Supplemental material for Confirmation of Selected Synergistic Cancer Drug Combinations Identified in an HTS Campaign and Exploration of Drug Efflux Transporter Contributions to the Mode of Synergy
Supplemental material, DS_DISC844566 for Confirmation of Selected Synergistic Cancer Drug Combinations Identified in an HTS Campaign and Exploration of Drug Efflux Transporter Contributions to the Mode of Synergy by Stanton J. Kochanek, David A. Close, Allen Xinwei Wang, Tongying Shun, Philip E. Empey, Julie L. Eiseman and Paul A. Johnston in SLAS Discovery
Footnotes
Supplemental material is available online with this article.
Declaration of Conflicting Interests
The authors declared no potential conflicts of interest with respect to the research, authorship, and/or publication of this article.
Funding
The authors disclosed receipt of the following financial support for the research, authorship, and/or publication of this article: This project was funded in part with federal funds from the National Cancer Institute, National Institutes of Health, under contract no. HHSN2612005522002C, NCI-N01-CM-52202, ARRA-funded project Work Assignment 14, “In Vitro Screening of Combinations of Chemotherapy Drugs.” The content of this publication does not necessarily reflect the views or policies of the Department of Health and Human Services, nor does mention of trade names, commercial products, or organizations imply endorsement by the U.S. government.
References
Supplementary Material
Please find the following supplemental material available below.
For Open Access articles published under a Creative Commons License, all supplemental material carries the same license as the article it is associated with.
For non-Open Access articles published, all supplemental material carries a non-exclusive license, and permission requests for re-use of supplemental material or any part of supplemental material shall be sent directly to the copyright owner as specified in the copyright notice associated with the article.