
Abstract
Cellular senescence is a state of stable cell growth arrest. Activation of oncogenes such as RAS in mammalian cells typically triggers cellular senescence. Oncogene-induced senescence (OIS) is an important tumor suppression mechanism, and suppression of OIS contributes to cell transformation. Oncogenes trigger senescence through a multitude of incompletely understood downstream signaling events that frequently involve protein kinases. To identify target proteins required for RAS-induced senescence, we developed a small-molecule screen in primary human fibroblasts undergoing senescence induced by oncogenic RAS (H-RasG12V). Using a high-content imaging system to monitor two hallmarks of senescence, senescence-associated β-galactosidase activity expression and inhibition of proliferation, we screened a library of known small-molecule kinase inhibitors for those that suppressed OIS. Identified compounds were subsequently validated and confirmed using a third marker of senescence, senescence-associated heterochromatin foci. In summary, we have established a novel high-content screening platform that may be useful for elucidating signaling pathways mediating OIS by targeting critical pathway components.
Introduction
Aberrant oncogene activation is an important driver of cellular transformation; however, initial atypical oncogene activation that occurs in primary cells typically triggers cellular senescence, a state of stable cell growth arrest.1–3 Oncogene-induced senescence (OIS) is an important tumor suppressive pathway, and suppression of OIS promotes tumorigenesis. 4 For example, oncogenic RAS or BRAF triggers senescence of melanocytes, which results in formation of benign nevi and thus suppresses melanoma development.5–7 The RAS oncogene is mutated in a number of cancer types (reviewed in Schubbert et al. 8 ). Oncogenic RAS has been extensively studied in the context of OIS, where it triggers senescence by a cascade of kinases. 3
Senescent cells exhibit several distinctive morphological characteristics and molecular markers, including a large, flat morphology; decrease in cell proliferation; and expression of senescence-associated β-galactosidase activity (SA-β-gal) 9 (reviewed in Itahana et al. 10 ). Expression of SA-β-gal activity is considered a universal marker of senescent cells. 11 In addition, senescence induced by oncogenic RAS is also characterized by domains of transcriptionally silenced heterochromatin, known as senescence-associated heterochromatin foci (SAHF). 12 SAHF contribute to senescence by silencing proliferation-promoting genes such as E2F target genes. 13
Inactivation of tumor suppressors such as p53 and p16 inhibits OIS. 3 Due to the importance of OIS in tumor suppression, compounds that regulate OIS not only serve as useful tools in studying OIS but may also lead to the identification of new tumor suppressors. As a result, we have developed a high-content screening assay to aid in the identification of novel OIS regulators. We used a kinase inhibitor library to determine compounds that inhibited OIS in the context of oncogenic RAS overexpression. In addition, the identified compounds could be studied further to help elucidate proteins involved in mediating OIS, which may lead to identification of novel tumor suppressors.
Previously, a screen for modulators of stress-induced senescence in prostate cancer has been described. 14 In this study, the authors used percentage of SA-β-gal–positive cells as a senescence output, but the screen is limited due to the necessity of having to manually quantify SA-β-gal–positive cells. In contrast, we report the development of a high-content imaging-based screen assay. In addition, using a library of 160 well-characterized kinase inhibitors, we performed a proof-of-principle screen for inhibitors of senescence induced by oncogenic RAS.
SA-β-gal activity was used in a high-content screening assay in a 96-well platform as the primary measure of senescence. To eliminate artifactual hits due to decreased cell number in the absence of OIS inhibition, we quantified cell numbers using nuclear staining. Using this newly developed platform, we identified 17 kinase inhibitors as suppressors of oncogenic RAS-induced senescence. We further confirmed our findings by using SAHF staining as an additional marker of senescence. All 17 inhibitors were individually validated, and 15 of 17 these were confirmed. This study introduces a novel assay for screening of modulators of OIS, and we report the identification of several compounds as bona fide suppressors of OIS.
Materials and Methods
Tissue Culture
Primary diploid fibroblasts (IMR90) were cultured according to the American Type Culture Collection (ATCC, Manassas, VA). Experiments were performed with IMR90 that were between 25 and 36 population doublings (PD).
Plasmids and Retrovirus
pBABE-H-RasG12V was obtained from Addgene (Cambridge, MA). Retrovirus production and transduction previously have been described. 15 Phoenix cells were used to facilitate retroviral packaging (Dr. Gary Nolan, Stanford University, Stanford, CA).
Screen Setup
Double infections of IMR90 cells in 100-mm dishes were performed using a retrovirus encoding for pBABE-H-RasG12V (days −1 and 0, respectively). Cells were selected with puromycin (1 µg/mL) for an additional 2 days and then plated into a 96-well plate (1000 cells/well) . The initial number of cells per well (1000) was optimized to avoid confluence-induced growth inhibition. At the end of day 2, cells were treated with kinase inhibitors (KIs) by pin transfer at ~250 nM. On day 9, cells were subjected to a quantitative SA-β-gal assay (described below) and stained with DAPI to visualize nuclei, which allowed for quantification of cell number.
Senescence Assay
The SA-β-gal assay previously has been described. 9 Briefly, cells were fixed in 2% formaldehyde and 0.2% glutaraldehyde and washed with phosphate-buffered saline. Staining solution (40 mM Na2HPO4, 150 mM NaCl, 2 mM MgCl2, 5 mM K3Fe(CN)6, 5 mM K4Fe(CN)6, and 1 mg/mL X-gal) was added with a multichannel pipette, and cells were incubated for 24 h. Cells were stained with DAPI (0.15 µg/mL) to visualize nuclei.
For the screen, four fluorescence and four phase-contrast images (individual image size = 2.9 megabytes) were acquired from each well of the 96-well plates with an ImageXpress Micro high-content imaging system (Molecular Devices, Sunnyvale, CA). Using a 10× Pan-Fluor objective with a working distance of 15.2 mm, phase-contrast images were captured (exposure time = 5 µs) to record SA-β-gal staining. Fluorescence images were captured using a 10× Pan-Fluor objective with a Semrock filter (300-W xenon lamp; excitation = 377/50 nm, emission = 447/60 nm, and exposure time = 55 µs) to record DAPI staining of cell nuclei. Note that at 10× magnification, SAHF are indistinguishable. In addition, objective and filter cube change together with image-based autofocus, allowing for simultaneous imaging of both channels. Images were analyzed using the MultiWavelength Scoring module in MetaXpress image analysis software (Molecular Devices). Briefly, based on preliminary experiments with control and RAS-expressing cells, a threshold was determined at which to define positive β-gal pixels. This threshold was applied to all of the phase-contrast images ( Fig. 1 , orange pixels), and the masked area for each image was systematically quantified. DAPI-positive nuclei were counted with MetaXpress image analysis software (version 3.1) by restricting counts to circular objects with a diameter greater than 1 micron. AcuityXpress software (version 2.02, Molecular Devices) was used for informatics processing and data visualization. The four images were quantified and the values for each SA-β-gal area and nuclei number were averaged. Compared with counting the percentage of SA-β-gal–positive cells manually, the current approach allows for a high-content screening assay to be developed. Overall, automatic image acquisition to quantification averaged 2 h per 96-well plate.
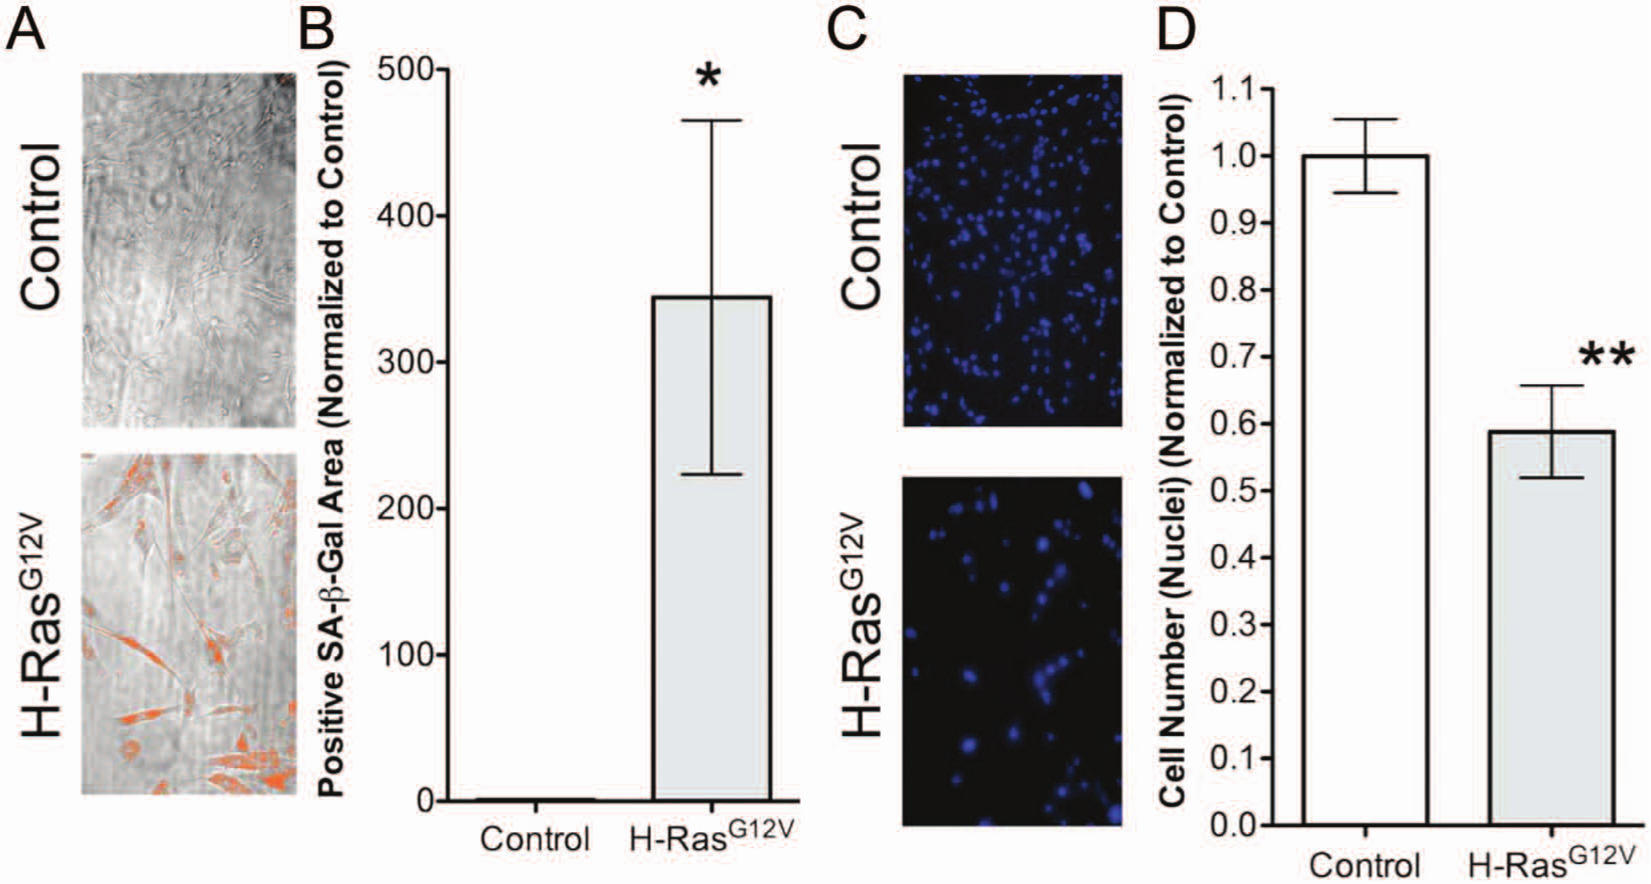
Screen output development. Using the ImageXpress Micro high-content imaging system, each well was systematically imaged eight times: four bright-field images and four fluorescence images. (
We determined the average number of cells (Nctrl) and SA-β-gal area (BGPPctrl) for IMR90s transduced with pBABE-H-RasG12V treated with DMSO vehicle control, which served as a positive base value for comparison. The average number of nuclei and SA-β-gal area from each of the 160 kinase inhibitors was normalized to DMSO. These normalized values were averaged between replicates. KIs that inhibited senescence were identified by the following equation: KIs prevented senescence if NKIx > [Nctrl + standard deviation of Nctrl] and at the same time BGPPKIx < [BGPPctrl – standard deviation of BGPPctrl].
All 17 active compounds identified as hits in the screen, along with an inactive control compound (CAS 648449-76-7; PI3Kγ inhibitor II), were individually examined for SA-β-gal activity and SAHF formation. Three hundred cells from each group were examined for β-galactosidase (blue) positivity within the cytosol. Using total cell number and β-galactosidase–positive cells, the positive percentage was calculated. Cells were stained with DAPI to visualize nuclei and SAHF. Three hundred cells from each group were examined for punctate DAPI-stained dense spots, where >10 spots within the nuclear compartment were considered SAHF positive. Using total cell number and SAHF-positive cells, the positive percentage was calculated. Cells were imaged using a Nikon Eclipse Ni fluorescence microscope (Nikon, Tokyo, Japan) as previously described. 16 These experiments were performed in triplicate. Data from validation experiments are shown as a percentage of SA-β-gal– or SAHF-positive cells.
Statistical Analysis
Statistical significance was determined by t test using GraphPad statistical software, version 5.0b (GraphPad Software, La Jolla, CA). Values were considered significant if p < .05. Z′ score was calculated using Microsoft Excel (Microsoft Corp., Redmond, WA).
Kinase Inhibitor Library
The kinase inhibitor library, which contained 160 well-characterized kinase inhibitors, was purchased from EMD Millipore (InhibitorSelect; Millipore, Billerica, MA). Compounds were maintained in 100% DMSO. Inhibitors were added to the growth medium of cells growing in 96-well microplates by pin transfer (Final DMSO % = 0.375%). Eight wells of cells in each plate treated with DMSO (vehicle control) were included as vehicle controls. To avoid plate location-specific effects, these DMSO wells were spread across the plate.
Results
Development of a High-Content Screening Assay for Identifying Small-Molecule Suppressors of Senescence Induced by Oncogenic RAS
Ectopic expression of activated oncogenes such as RAS is a standard approach to induce cellular senescence in a synchronized manner in primary mammalian cells. 3 Thus, we ectopically expressed oncogenic H-RASG12V by retroviral transduction in primary human fibroblasts (IMR90 cells) to induce senescence. Senescence phenotypes such as SA-β-gal activity typically take several days to develop. 15 SA-β-gal activity in the cytoplasm is considered a universal marker of cellular senescence 9 and can be visualized by phase-contrast microscopy. In addition, a definitive marker of senescence is a decreased cell proliferation (reviewed in Hayflick 17 ). We sought to develop a high-content assay for screening small-molecule modulators of senescence.
In an initial pilot experiment, using MetaXpress image analysis, a threshold of SA-β-gal intensity was established to define a SA-β-gal–positive pixel. This threshold was subsequently used in the large-scale screen to apply a “mask” to the four phase-contrast images, and the positive pixel area per image was determined ( Fig. 1A , orange area). Importantly, we observed a significant and robust increase in SA-β-gal area in RAS-infected cells compared with controls ( Fig. 1B ). We also observed a significant reduction in the number of nuclei in RAS-expressing cells compared with control cells ( Fig. 1C , D ). The average SA-β-gal area and number of nuclei for the positive control (DMSO vehicle treated RAS-expressing cells) from the same screening plate were used as a baseline to compare with the KI-treated cells.
It is well established that a cascade of kinases plays a role in regulating oncogenic RAS-induced senescence. 18 We therefore applied our screening assay using a library of 160 well-characterized kinase inhibitors in a 96-well plate format. 19 The screen was performed by treating RAS-transduced cells with 250 nM of each of the 160 kinase inhibitors or vehicle control (DMSO) ( Fig. 2A ). This concentration was chosen based on typical concentrations at which these compounds are used in cell-based assays. 19 Furthermore, it is known that cell density affects SA-β-gal activity. To limit the potential nonspecific effects of cell density on SA-β-gal expression, a range of cell concentrations were tested during assay development to avoid cell confluence over the course of the assay. Typically, 1000 RAS-overexpressing cells were inoculated per well. We used a time point of 9 days following RAS transduction to assess OIS based on our previous work. 15 Eight wells of vehicle control were included in each plate as positive controls for comparison. In addition, control virus–infected cells were included as negative controls for comparison. Cells in the 96-well plates were fixed, and markers of senescence were examined at day 9 after RAS infection. Specifically, we stained the fixed cells for SA-β-gal activity and with a fluorescent DNA dye (DAPI) to visualize nuclei, which was used as a surrogate for cell number. Four phase-contrast and fluorescence images were taken of each well and systematically quantified and averaged. This assay allows us to measure the expression of a senescence marker simultaneously with cell number to reflect changes in cell proliferation in the same population of cells. To ensure that the decrease in expression of SA-β-gal activity was not due to a decrease in cell proliferation, we focused on kinase inhibitors that significantly suppressed SA-β-gal activity but did not decrease cell proliferation.
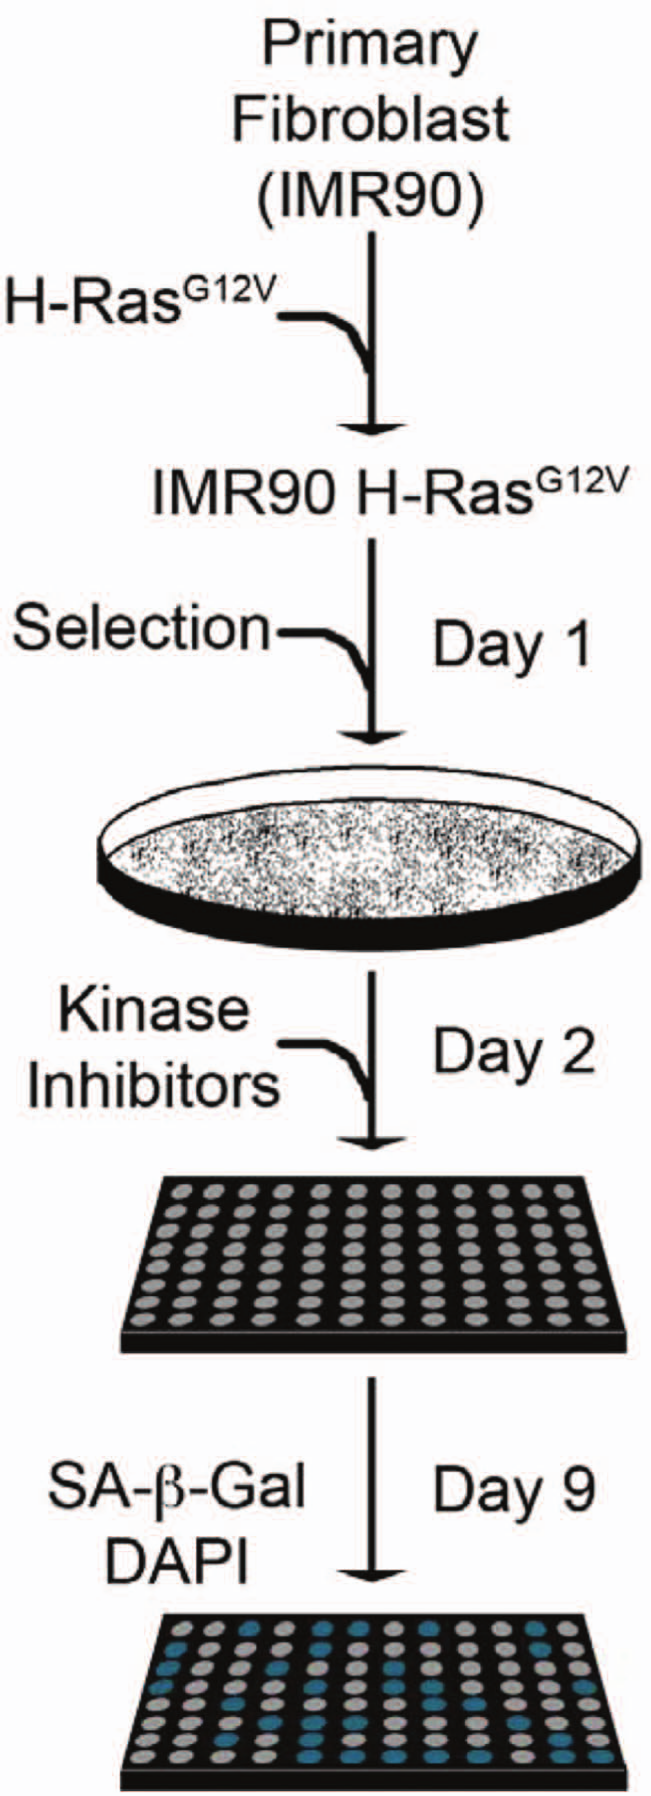
Senescence screen setup and analysis. Primary fibroblasts (IMR90s) were transduced with an H-RasG12V encoding retrovirus over 2 days (days −1 and 0). Cells were then selected with puromycin (1 µg/mL) for 2 days, plated into 96-well plates (1000 cells/well), and, at the end of the second day, treated with the kinase inhibitor library at a uniform concentration (250 nM). Cells were incubated for 7 additional days to allow for senescence and then fixed in a formaldehyde/glutaraldehyde solution. To visualize the senescence-associated β-galactosidase activity (SA-β-gal) activity and determine cell number, fixed cells were incubated with X-gal and labeled with DAPI.
Averages of SA-β-gal area and nuclei number from biological replicate experiments were compiled and normalized to the mean of vehicle (DMSO) control wells. These data were graphed on a scatter plot (
Fig. 3
). Hits were identified as compounds that reduced SA-β-gal area by at least one standard deviation below the mean of DMSO control and conversely increased cell number (nuclei) above one standard deviation of the DMSO control mean (
Fig. 3
, bottom right quadrant, blue dots). According to these criteria, 17 of the 160 compounds tested significantly suppressed SA-β-gal area while maintaining nuclei number in RAS-expressing cells (compounds are listed in
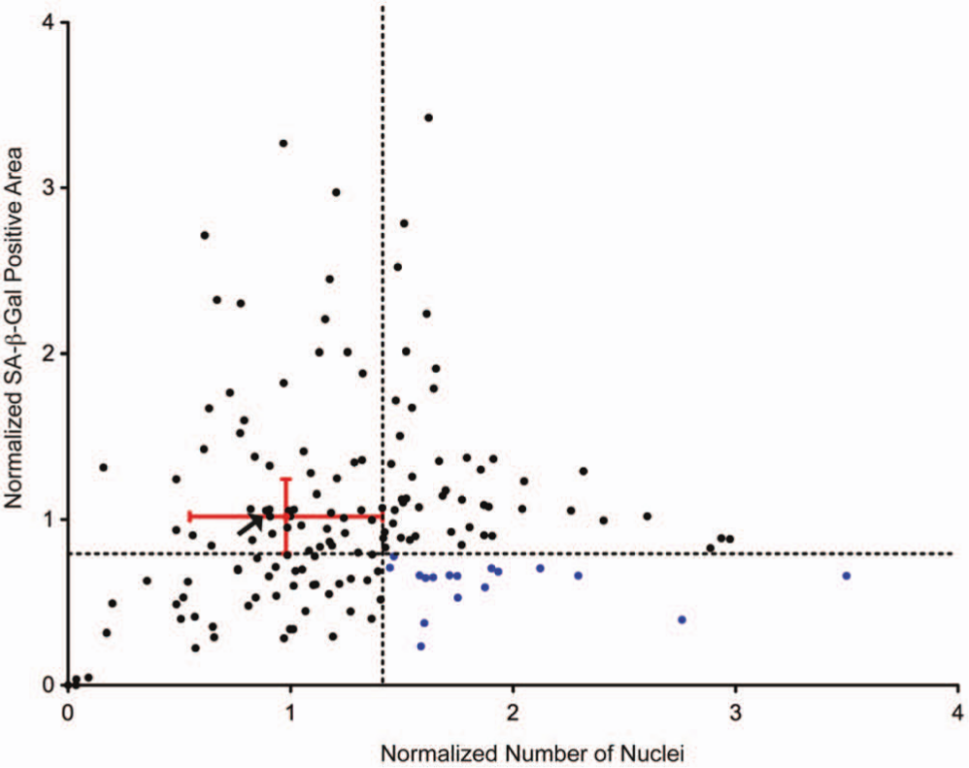
Identification of senescence-suppressing kinase inhibitors. Both the nuclei number and senescence-associated β-galactosidase activity (SA-β-gal) area were normalized to DMSO-treated control wells (red dot). The normalized numbers of nuclei (a surrogate of cell number) and SA-β-gal area were graphed. The delineation (dotted lines) separates the graph into quadrants, and placement of the lines was determined from the standard deviation of DMSO control wells (red error bars). The lower right quadrant indicates kinase inhibitors that have significantly more nuclei and less SA-β-gal area (blue dots). Arrow indicates inhibitor used as negative control in subsequent validation experiments.
Validation of Identified Compounds as Suppressors of Oncogene-Induced Senescence
Recapitulating the experimental design of the screen, we individually treated RAS-expressing cells with DMSO vehicle control or with 250 nM of the 17 identified inhibitors. As an additional control, RAS-expressing cells were also treated with a kinase inhibitor (CAS 648449-76-7; PI3Kγ inhibitor II) that had no effect on SA-β-gal area or cell number based on initial screening (
Fig. 3
, arrow). These cells were then used in the SA-β-gal assay to examine changes in expression of SA-β-gal activity. Upon manual quantification of SA-β-gal–positive cells, we discovered that 16 of 17 inhibitors significantly reduced the expression of SA-β-gal activity in our validation experiments (
Fig. 4A
,
B
and
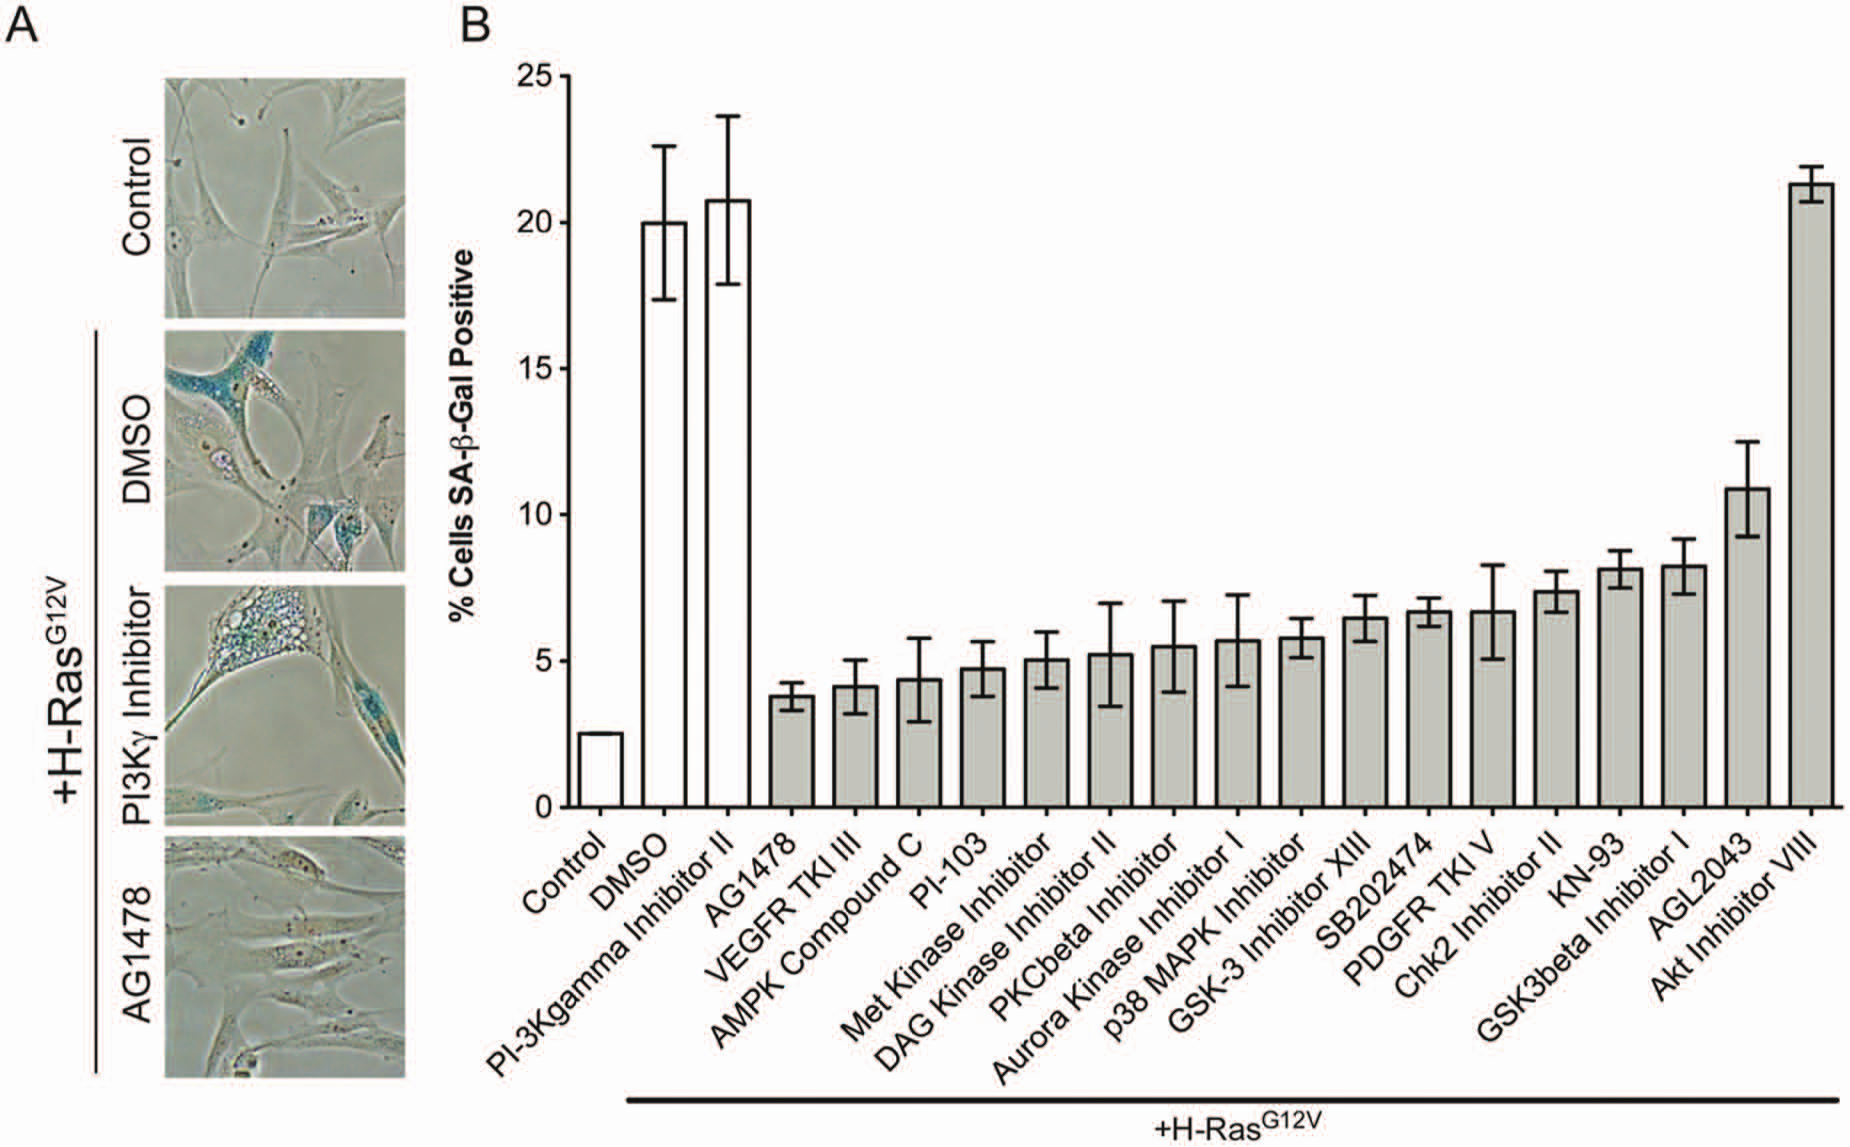
Validation of kinase inhibitors that significantly inhibit senescence-associated β-galactosidase activity (SA-β-gal) activity. (
To further confirm senescence suppression by these compounds, we next assayed their effect using an independent marker of senescence, SAHF, which are domains of punctate DAPI stain in the nuclei of senescent cells (
Fig. 5A
, white arrowheads).
12
Toward this goal, RAS-expressing cells were treated with the 17 kinase inhibitors identified in the initial screen, a negative control inhibitor (CAS 648449-76-7; PI3Kγ inhibitor II), or DMSO. After 9 days of culture, we stained the cells with DAPI to visualize the formation of SAHF. In this independent validation, we discovered that 16 of 17 inhibitors significantly inhibited oncogenic RAS-induced SAHF formation. Interestingly, the inhibitor that failed to prevent SAHF formation (CAS 371935-74-9; PI-103) was not the same as the inhibitor that failed to reduce SA-β-gal activity (CAS 612847-09-3; Akt inhibitor VIII) (
Fig. 5A
,
B
and
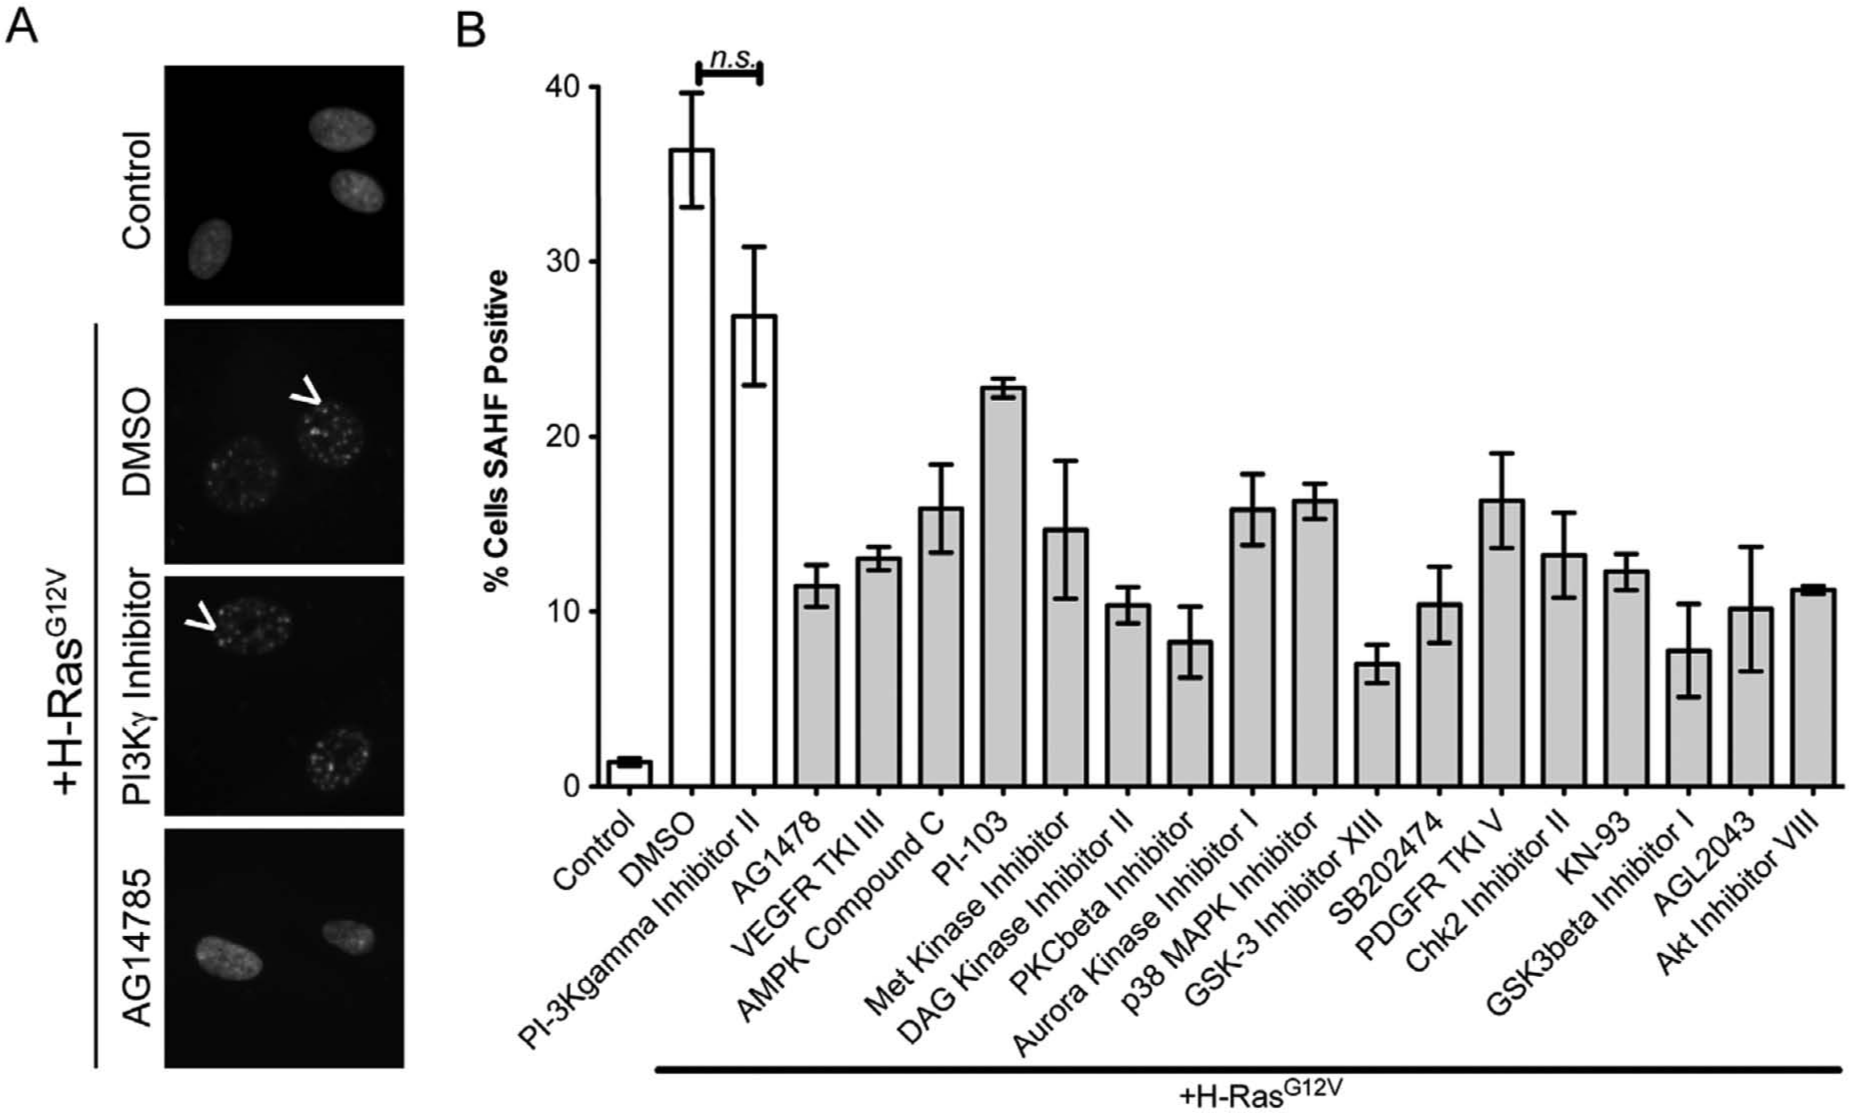
Senescence-suppressing compounds also inhibit senescence-associated heterochromatin foci (SAHF), an additional marker of senescence. (
Discussion
In the current study, we describe the assay development, identification, and validation of a high-content screening assay for small-molecule modulators of OIS. Using a kinase inhibitor library, we have identified a list of small-molecule compounds that suppress oncogenic RAS-induced senescence. We have previously demonstrated that most of these compounds target multiple kinases. 19 Thus, understanding the mechanism of suppression of OIS by these compounds will require further identification of the relevant kinase targets. Here our identification of 15 kinase inhibitors that suppress oncogenic RAS-induced senescence validates this assay for identifying such compounds. Significantly, we confirmed the activity of the identified inhibitors using the original screening assay (SA-β-gal activity) and further validated the compounds using an independent senescence marker, SAHF. One of the inhibitors identified (AMPK Compound C, CAS 855405-64-3) has been reported to prevent senescence, further demonstrating the accuracy of this newly developed assay. 22 Notably, none of the other identified compounds has specifically been reported to alter senescence. Follow-up studies with these compounds will investigate the relationship between inhibition of a specific kinase and the OIS pathways, which will elucidate molecular mechanisms underlying RAS-induced OIS. In addition, dose-dependent effects of these compounds also will be examined. Taken together, these data establish high-content screening assays for suppressors of senescence and identify several compounds as suppressors of oncogene-induced senescence.
The high-content screening assay reported here is unique because of the simultaneous utilization of multiple criteria to identify potential hits. Conventional single-parameter screens often use two to three standard deviations to identify positive hits. Notably, only two compounds (CAS 866405-64-3; AMPK Compound C and CAS 120166-69-0; diacyglycerol kinase inhibitor I) were scored as hits if two standard deviations was used as the cutoff criterion for both SA-β-gal and cell number screening parameters (2 of 160 compounds; hit rate = 1.25%). Both compounds were among the list of compounds confirmed in the follow-up validation assays. In addition, the identification of AMPK Compound C using two standard deviations again demonstrates the accuracy of the screen. Importantly, we confirmed 15 of the 17 compounds identified using one standard deviation for both SA-β-gal and cell number screening parameters as the cutoff. These findings support the use of the criteria described in the current assay. For single-parameter–based screening, Z′ score is typically used to reflect the robustness of assay. Using SA-β-gal as a single parameter, we explored Z′ score (Z′ score = 0.89) for our newly developed assay by comparing an example of compounds that do not suppress SA-β-gal (i.e., CAS 212779-48-1; Cdc28p kinase inhibitor) with an example of compounds that efficiently suppress SA-β-gal (i.e., CAS 3895-92-9; PKC inhibitor). 23 This further supports the robustness of this newly developed high-content screening assay.
Compared with genetic manipulation for loss-of-function studies, small-molecule inhibitors offer certain advantages in studying kinase function. For example, many kinases are known scaffold proteins that mediate formation of multiple protein large complexes. Genetic knockdown will lead to collapse of these protein complexes and consequently result in unintended nonspecific effects. In contrast, small-molecule inhibitors of these kinases offer a unique opportunity to study kinase activity without affecting the interacting proteins. The inhibitors identified here will be invaluable tools in elucidating the role of these kinases in regulating OIS; however, a caveat to the use of small-molecule inhibitors is the potential for off-target effects. Therefore, future studies knocking down target kinases with short hairpin RNAs will be critical to confirm the kinases role in OIS.
The proof-of-principle kinase inhibitor screen described in this report identified compounds that suppressed senescence, which was determined by a decrease in SA-β-gal activity. In validation studies, we observed a discrepancy between kinase inhibitors that prevented SA-β-gal versus those that inhibited SAHF. Therefore, future versions of the screen will include measuring the percentage of SAHF following treatment, which, in conjunction with other markers, should increase reliability to identify senescent cells. In addition, the high-content screening approach used in this assay will also allow for future studies to examine enhancers of OIS. Taking advantage of the platform developed herein and using compounds beyond kinase inhibitors may yield a more comprehensive understanding of OIS.
Although senescence is known to be an important tumor suppression mechanism during tumor initiation and progression, it may also be an important mechanism for developing cancer therapeutics. For example, reactivation of the tumor suppressor p53 in murine liver and sarcoma models triggers cellular senescence and the associated tumor regression due to activation of the innate immune response. 24 Likewise, we have also demonstrated that restoration of noncanonical Wnt signaling in ovarian cancer cells suppresses tumorigenesis by inducing cellular senescence. 25 Thus, small-molecule inhibitors that promote senescence of cancer cells could be developed as potential cancer therapeutics. Future studies will employ the high-content screening platform established in the current study to identify small molecules that promote senescence of human cancer cells such as melanoma cells, which can arise by overcoming the senescence tumor suppression mechanism.26,27 These small molecular activators of senescence would, by definition, possess antiproliferative activity and may have value as potential anticancer agents.
In conclusion, we established a high-content screening platform for identifying small-molecule regulators of cellular senescence and identified a list of small-molecule compounds that are suppressors of senescence induced by oncogenic RAS.
Footnotes
Acknowledgements
We thank Dr. Katherine Aird for critical reading of this manuscript, as well as Dr. Margret Einarson and Ms. Anna Pecherskaya at Fox Chase Cancer Center Translational Research Facility for technical assistance.
Declaration of Conflicting Interests
The authors declared no potential conflicts of interest with respect to the research, authorship, and/or publication of this article.
Funding
The authors received no financial support for the research, authorship, and/or publication of this article: This work was supported by a National Institutes of Health (NIH)/National Cancer Institute grant (R01CA160331 to R.Z.), a Department of Defense award (OC093420 to R.Z.), and an NIH/National Institute of General Medicine grant (R01GM083025 to J.R.P.). B.G.B. is an American Cancer Society Postdoctoral Fellow (PF-13-058-01-TBE). Support of core facilities used in this study was provided by a Cancer Center Support Grant (CA010815) to The Wistar Institute, and CA006927 to Fox Chase Cancer Center.
References
Supplementary Material
Please find the following supplemental material available below.
For Open Access articles published under a Creative Commons License, all supplemental material carries the same license as the article it is associated with.
For non-Open Access articles published, all supplemental material carries a non-exclusive license, and permission requests for re-use of supplemental material or any part of supplemental material shall be sent directly to the copyright owner as specified in the copyright notice associated with the article.