
Abstract
Intramolecular CFP-YFP fluorescence resonance energy transfer (FRET) sensors expressed in cells are powerful research tools but have seen relatively little use in screening. We exploited the discovery that the expression of a CFP-YFP FRET diacylglycerol sensor (DAGR) increases over time when cells are incubated at room temperature to assess requirements for robust measurements using a Molecular Devices Spectramax i3x fluorescence plate reader. Expression levels resulting in YFP fluorescence >10-fold higher than untransfected cells and phorbol ester-stimulated FRET ratio changes of 60% or more were required to consistently give robust Z′ > 0.5. As a means of confirming that these conditions are suitable for screening, we developed a novel multiple-read protocol to assay the NCI’s Mechanistic Set III for agonists and antagonists of C1 domain activation. Sixteen compounds prevented C1 domain translocation. However, none blocked phorbol ester-stimulated protein kinase C (PKC) activity assessed using a phospho-specific antibody—six actually stimulated PKC activity. Cytometry, which produces higher Z′ for a given FRET ratio change, might have been a better approach for discovering antagonists, as it would have allowed lower phorbol ester concentrations to be used. We conclude that CFP-YFP FRET measured in a Spectramax i3x plate reader can be used for screening under the conditions we defined. Our strategy of varying expression level and FRET ratio could be useful to others for determining conditions needed for robust cell-based intramolecular CFP-YFP FRET measurements on their instrumentation.
Introduction
We previously developed a multiplexed flow cytometry assay that used sensors for diacylglycerol (DAG), protein kinase C (PKC) activity, and extracellular signal-regulated kinase (ERK) activity, showing that the assay could identify compounds known to activate PKC. 1 There are a number of reasons why assays focused on this pathway are needed. Because they play important roles in the pathogenesis of Parkinson’s disease, Alzheimer’s disease, diabetes, cancer, and other important human diseases,2–6 PKCs have long been targets of interest for drug development. 7 Most efforts have focused on developing inhibitors of PKC catalytic activity, but these compounds have often proven to be promiscuous, acting upon other kinases. The activation of PKC involves C1 domains, zinc-finger motifs that mediate binding to DAG, a lipid second messenger produced as a result of phospholipase C activation. 8 Originally described as critical for the activation of conventional and novel PKC enzymes, C1 domains have since been found in other proteins, including protein kinase D (PKD), RasGRPs, chimaerins, MUNC13 proteins, and DAG kinases.9,10 It has been suggested that developing C1 domain antagonists instead might be a way around the problem of kinase inhibitor promiscuity, as the number of proteins that have C1 domains is relatively small, and as described above, some of the C1 domain-containing proteins like PKD and RasGRP participate downstream in PKC-dependent processes. 11 In addition, there is a potential therapeutic interest in identifying nontumorigenic PKC activators to serve as the basis of therapies for Alzheimer’s disease, since activation of PKC may promote memory formation and decrease development of amyloid fibrils and phosophorylation of tau; bryostatin, a natural product, is currently the only candidate. 12
After our work with the multiplexed flow cytometry assay, we found that we could use a Molecular Devices Spectramax i3x fluorescence plate reader to measure fluorescence resonance energy transfer (FRET) signals from cell lines expressing CFP-YFP FRET sensors for glucose and ATP, as these sensors give large changes in FRET ratio in response to appropriate conditions, and are expressed in cells at high levels. 13 There are a fairly limited number of publications that report using intramolecular CFP-YFP FRET in conventional fluorescent plate readers for cell-based screening. Allen et al. screened for agonists and antagonists of protein kinase A (PKA), using a PKA reporter and a cAMP reporter. 14 Mazina et al. also used a conventional plate reader to measure intracellular cAMP using a different reporter than Allen et al. as a means of assessing melanocortin receptor activation, although their implementation was intended for functional studies, not screening. 15 Jones et al. screened for caspase inhibitors. 16 Several other efforts have relied on more sophisticated plate-reading instruments to acquire intramolecular CFP-YFP FRET signals from cells. Schaaf et al. used a highly sophisticated spectral unmixing plate reader to measure intramolecular CFP-YFP FRET from an ER-targeted calcium sensor as a follow-up 17 to a screen involving FRET between green fluorescent protein (GFP) and red fluorescent protein (RFP) that measured activity-associated conformational changes in SERCA ATPases. 18 Honarnejad et al. used a confocal imaging plate reader to measure intracellular calcium using a CFP-YFP FRET reporter construct as part of a screen for compounds that can inhibit amyloid fibril formation. 19
As conventional fluorescent plate readers are commonly available, and intramolecular FRET between CFP and YFP serves as the basis of a multitude of different reporter constructs, 20 we thought that it might be useful to define the expression level and FRET ratio change needed to measure FRET reliably in a fluorescent plate reader, as this might encourage more widespread adoption of intramolecular CFP-YFP FRET sensors for screening. Here, we took advantage of a serendipitous discovery that expression of the DAGR can be increased by incubating cells at room temperature to define the expression level and signal amplitude needed to produce data robust enough for screening using a Spectramax i3x fluorescence plate reader, a strategy that could be applied by others to other instruments. We then developed a multiple-read assay for compounds that affect C1 domains and screened the National Cancer Institute’s (NCI) Mechanistic Set III for potential C1 domain agonists and antagonists as proof of principle. Our results define some of the limitations of the method and point to both advantages and disadvantages to trying to measure FRET using a fluorescence plate reader compared with using flow cytometry.
Materials and Methods
Cell Lines and Reagents
The generation of the DAGR cells, which are long-term transfectants of K562 cells that stably express the construct but were not cloned, was described previously, and both they and untransfected K562 cells were cultured as described. 1 We chose K562 cells because they are easily transfected to high levels of expression and grow quickly, facilitating the creation of long-term expressing lines. TALL-104 cells, which we used to analyze effects of putative C1 domain antagonists because we have experience analyzing PKC signaling in them, were obtained from the American Type Culture Collection (ATCC) and cultured as described previously. 21 Experiments were performed in Normal Ringer’s solution as described previously, 1 except antibody staining (see below), which was conducted in fluorescence-activated cell sorting (FACS) buffer (phosphate-buffered saline containing 0.01% sodium azide and 5% heat-inactivated fetal calf serum). Phorbol 12-myristate 13-acetate (PMA) was from Alexis Biochemicals (San Diego, CA). Phorbol 12,13-dibutyrate (PDBU) was from Tocris Bioscience (Bristol, UK). DMSO was obtained from Sigma-Aldrich (St. Louis, MO). Anti-phospho-PKC substrate antibody #2261 (lot #22) was obtained from Cell Signaling Technologies (Danvers, MA). Mouse monoclonal anti-GFP antibody clone 3E6 was obtained from Thermo Fisher. Alexa Fluor donkey anti-rabbit IgG antibody was obtained from Jackson Immunoresearch (West Grove, PA). The Mechanistic Set III compound library and resupply of selected compounds was from the NCI.
Flow Cytometry
All flow cytometry experiments were performed on a BD LSR Fortessa X-20 cell analyzer at the University of Connecticut’s Flow Cytometry Facility as described previously. 1 The signals collected to characterize FRET signals were CFP (405 nm excitation, 450/50 nm emission, no dichroic mirror, 405 nm laser trigon), FRET (405 nm excitation, 525/50 nm emission, 505 LP dichroic mirror, 405 nm laser trigon), and YFP (488 nm excitation, 530/30 nm emission, 505 LP dichroic mirror, 488 nm laser octagon). Data were analyzed offline using FlowJo software (Tree Star, Inc., Ashland, OR). Analysis was performed as previously described. 1 Reading a 96-well plate on the flow cytometer required ~40 min. No correction was made for bleed-through of CFP signals into the FRET channel in either the flow cytometry or plate reader measurements described below since in an intramolecular FRET sensor the two fluorescent proteins are expressed stoichiometrically and any bleed-through will be corrected when changes in FRET ratio are assessed.
Plate Reader Measurements and Screening
Assessment of signals in a plate reader and primary screening were performed in Greiner black polystyrene half-area 96-well plates (Greiner, Monroe, NC; manufacturer’s reference no. 675076) using a SpectraMax i3x plate reader (Molecular Devices, San Jose, CA) using 1 × 10⁵ cells per well in a volume of 100 µL. We previously identified this cell number as the minimum needed to reliably create a monolayer on the bottom of the plate wells. All manipulations (additions, dispensing, and mixing) associated with plate measurements using either flow cytometry or the Spectramax i3x were performed with Eppendorf Explorer multichannel pipetters. For experiments that assessed signal robustness via estimation of Z′, cells that were incubated at room temperature for various lengths of time were added in sextuplicate repeats to wells containing DMSO or serial twofold dilutions of PDBU starting at a high concentration of 125 nM. For screening, cells were added to wells containing DMSO, 100 nM PMA, or test compounds at a final concentration of 10 µM. Total DMSO concentration in all conditions was 1%. After incubation for 30 min at 37 °C, a time intended to allow compounds to enter cells and for the DAGR to translocate, the following excitation–emission pairings were read: 450/485, 450/535, and 485/535 nm. The FRET ratio was calculated from these measurements as described previously. 13 Six readings were acquired per well. Following the initial read, PDBU was added to DMSO and compound-containing wells at a final concentration of 100 nM, and plates were incubated for a further 30 min at 37 °C and then read again. The incubation period was intended to allow PDBU to enter cells and trigger DAGR translocation. Data were analyzed using Excel. Wells in which fluorescence of either 450/485 or 450/535 nm signals was more than 50% higher than control wells were excluded as likely representing fluorescence artifacts. Reading a plate required ~5 min.
Measurement of PKC Activity by Immunocytochemistry
K562 or TALL-104 cells (2.5 × 10⁵) were resuspended in 100 µL of Ringer’s solution in Eppendorf tubes containing test compounds, DMSO, or PDBU and incubated for 30 min at 37 °C. After incubation, cells were fixed by adding 300 µL of 2% paraformaldehyde and then permeabilized by the addition of 1 mL of chilled methanol. Cells were washed with FACS buffer, incubated in primary antibody diluted 1:100, and then washed in FACS buffer again before incubation with an Alexa Fluor 488-labeled secondary antibody. The geometric mean value of Alexa Fluor 488 fluorescence was determined for each sample using flow cytometry. Data were analyzed using repeated-measures ANOVA conducted on nonnormalized data. Prism 7 (GraphPad, San Diego, CA) was used for statistical testing.
Fluorescence Microscopy
Imaging of DAGR fluorescence in stably transfected K562 cells was done in one experiment using a Nikon A1R confocal microscope housed in the University of Connecticut’s COR2E Light Microscopy Facility. In a second experiment, a Nikon Diaphot epifluorescence microscope that has been described previously was used. 22
Equations
During plate screening, the percent activation and inhibition were calculated relative to controls using eqs 1 and 2:

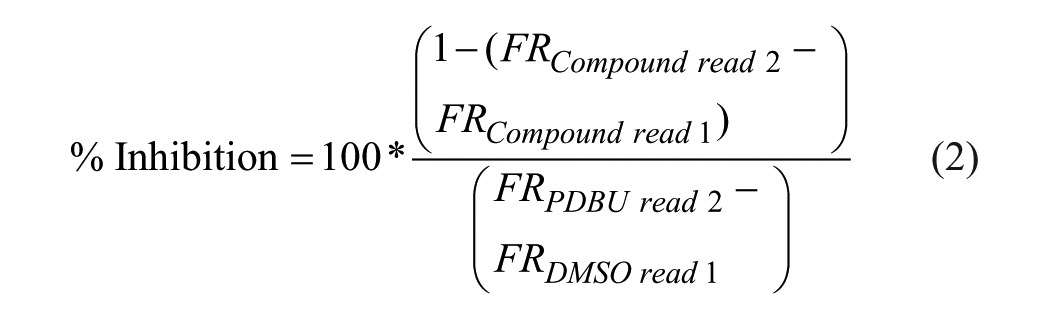
where FR is the FRET ratio. The robust Z score was calculated using eq 3:

where FRhigh and FRlow are the FRET ratio of samples expected to be more active because they were treated with more PDBU (high), or less active because they were treated with lower PDBU or DMSO, respectively (low). MAD is the median absolute deviation, which is multiplied by 3 as in the usual calculation of Z′ and also by 1.4826 to correct for the underlying assumption of normally distributed data.
Results
Incubating DAGR-Expressing K562 Cells at Room Temperature Enhances Sensor Expression
We serendipitously discovered that expression of the DAGR in long-term transfectant K562 cells can be increased if cells are kept in cell culture medium at room temperature overnight. Exposing DAGR-expressing cells to different combinations of temperature and CO2% over 24 h showed that DAGR expression increased in response to lower temperature but was insensitive to CO2% ( Fig. 1A ). The increase in expression was not observed for other FRET sensors expressed the long term in K562 cell lines (data not shown). Incubating DAGR cells at room temperature for 0–24 h revealed a saturable relation between treatment time and reporter expression ( Fig. 1B ). Cells maintained at 37 °C exhibit a fluorescence only three- to fivefold higher than untransfected K562 controls at the population average level. Incubating cells at room temperature led to increased expression levels that reached a maximum of as much as 45-fold higher than untransfected K562 controls after 24 h.
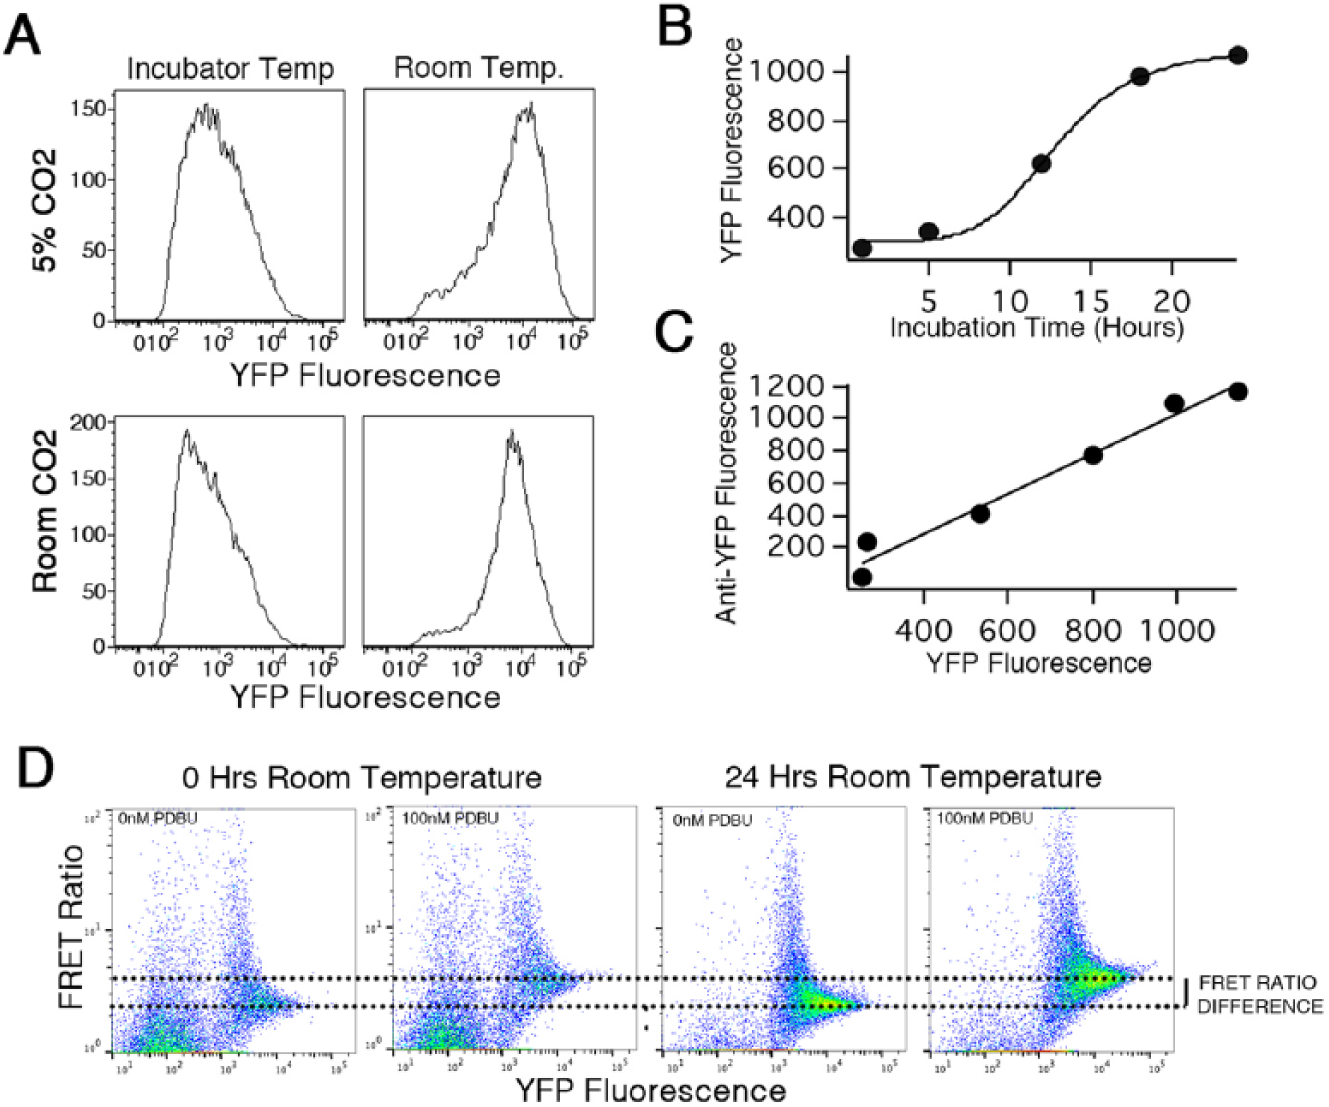
Room temperature incubation increases DAGR expression. (
To the best of our knowledge, the fluorescence of CFP and YFP or variants of these proteins has never been found to be temperature dependent, and consistent with this, as described above, no other CFP-YFP FRET sensors expressed in the long term in K562 cells displayed this behavior. We envisioned two general mechanisms by which incubating cells at room temperature could increase DAGR expression. First, already-translated but misfolded and thus nonfluorescent DAGR could fold productively at room temperature. Second, sensor concentration could increase due to enhanced transcription and/or translation, or to decreased degradation. As a means of resolving between these possibilities, we stained DAGR-expressing cells with an anti-GFP antibody that has been used in Western blotting, 23 and thus would be expected to recognize misfolded CFP and/or YFP. Our expectation was that if already translated but misfolded DAGR protein was folding during the room temperature incubation, we would see no change in antibody staining while YFP fluorescence increased. Instead, there was a strong correlation between DAGR reporter levels measured by antibody staining and YFP fluorescence intensity ( Fig. 1C ). This is consistent with the idea that increased expression is due to a temperature-dependent increase in reporter expression levels and not an effect on folding. We did not investigate whether Western blotting, an alternate means of quantifying DAGR protein levels, would have given different results.
We explored the effects of room temperature incubation and enhancement of DAGR expression on FRET ratio and FRET ratio changes upon stimulation with phorbol esters ( Fig. 1D ). As we noted previously, scatterplots of FRET ratio versus YFP expression level as measured in flow cytometry indicate that cells with low expression levels exhibit highly variable FRET ratios. As expression levels increase, the FRET ratio of individual cells appears to converge to a consistent value. 1 The highest-expressing cells in both control ( Fig. 1D , left panels) and room temperature-incubated ( Fig. 1D , right panels) samples show similar resting FRET ratios and increases in FRET ratio upon stimulation with PDBU. Cells that are highly expressing (higher YFP fluorescence) exhibit the same FRET ratio in the DMSO condition in both the control and room temperature-incubated samples. These results are consistent with the idea that room temperature incubation enhances sensor expression but does not affect resting FRET ratio or sensor responsiveness.
Comparing FRET Responses Measured Using Flow Cytometry or a Molecular Devices Spectramax i3x Fluorescent Plate Reader
We examined FRET ratio changes in response to different concentrations of PDBU in control cells and cells incubated at room temperature for different lengths of time using both flow cytometry and a Molecular Devices Spectramax i3x fluorescent plate reader ( Fig. 2 ). For these experiments, plates contained six replicates for each time and PDBU (or DMSO) treatment condition to allow estimation of the central tendency (mean and median) and scatter (standard deviation and median absolute deviation [MAD]) of responses. We measured signals on the plate reader first, as this took only a few minutes and did not disturb samples, and then acquired flow cytometry data, which took considerably longer and consumed the samples. In this experiment, YFP fluorescence increased from ~5-fold higher than untransfected cells for cells that were not incubated at room temperature to >40-fold brighter than untransfected cells after incubation at room temperature for 24 h. A 12 h time was also acquired, but data are not shown in Figure 2A–D to enhance clarity. They are, however, included in Figure 2E .
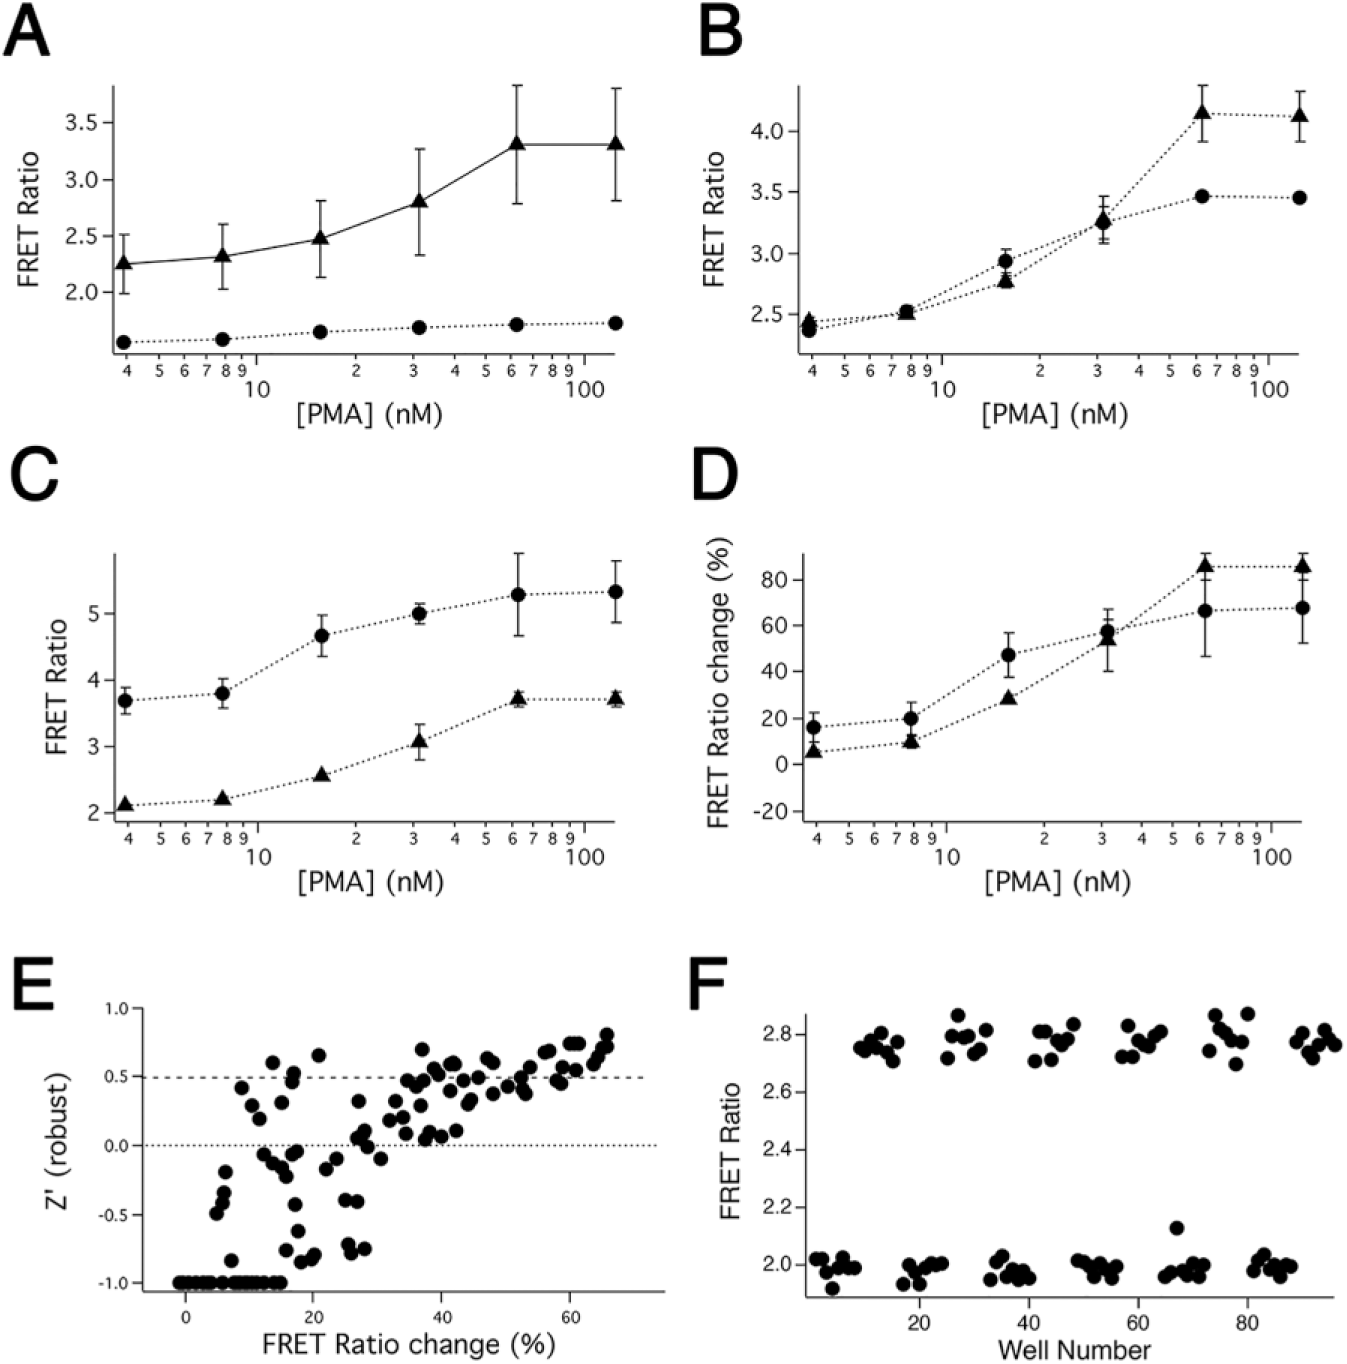
Assessing performance of the DAGR with flow cytometry and a Spectramax i3x fluorescence plate reader. (
If we simply computed the FRET ratio for all cells in the samples measured using flow cytometry ( Fig. 2A , circles), there was essentially no response to PDBU in cells that were not previously incubated at room temperature to enhance expression. Cells incubated at room temperature for 24 h showed progressively higher changes in FRET ratio ( Fig. 2A , triangles). In contrast, if we gated samples on YFP fluorescence to select only the highest-expressing cells in the population, we observed very similar changes in the FRET ratio in the different samples ( Fig. 2B ). This suggests that the FRET ratio of the highest-expressing cells provides a reasonable measure of the responsiveness of the sensor that is independent of the overall expression level of the sensor in the population. We used this in our analysis below.
When we measured the FRET ratio using the Spectramax i3x plate reader, we found that FRET ratios were higher in DMSO-treated cells that had not been incubated at room temperature to enhance fluorescence than in room temperature-incubated cells ( Fig. 2C ). This is not due to a temperature-dependent alteration in cellular autofluorescence, as flow cytometry profiles reveal no shift in the fluorescence of the population of cells in each sample that does not express the sensor, and there was also no difference measured in the Spectramax i3x between the autofluorescence of untransfected K562 cells that were incubated at room temperature or kept in the incubator (data not shown). At present we are unable to account for the effect. Data in Figure 2C,D are estimates of the median and MAD from the six internal replicates, shown because we used them to estimate robust Z′ below. Similar trends were observed if we plotted the mean and SD instead (data not shown). Stimulation with PDBU enhanced the FRET ratio in samples with both enhanced and unenhanced sensor expression levels. To compare the magnitude of signals in samples with low or high levels of expression, we normalized responses to the resting FRET ratio observed in DMSO-treated controls. Examining these data indicates that the FRET ratio changes are slightly smaller in the low-expressing samples, a trend that was observed in other similar independent experiments. A smaller FRET ratio change would of course tend to decrease Z′. Importantly, however, MAD tended to be considerably higher in the lower-expressing samples. Higher MAD (or standard deviation) would also be expected to increase Z′. Examining individual signals, we found that CFP signals are likely the critical limitation when using a plate reader to measure the FRET ratio (data not shown). The fluorescence of CFP was only ~3-fold higher than background in DMSO-treated cells that had not been incubated at room temperature, and this decreased to only ~2-fold higher than background fluorescence when cells were treated with PDBU. CFP fluorescence in DMSO-treated cells increased to ~10-fold higher than background after 24 h at room temperature.
We used data from the experiment shown in Figure 2A–D and from two other independent similar experiments to estimate the level of sensor expression and magnitude of FRET change required to obtain signals in the Spectramax i3x of sufficient robustness to be useful for screening. For each level of sensor expression produced by incubating cells at room temperature for different lengths of time, we computed from the plate reader measurements of the six repeats the median FRET ratio and the associated MAD produced by treating cells with different PDBU concentrations. We then calculated robust Z′ between all pairs of data obtained at different PDBU concentrations at a given sensor expression level. Doing so meant that a six-concentration PDBU dose–response curve with a DMSO control generated 21 possible robust Z′ estimations. We used the FRET ratio measured by gating on high expressing cells in flow cytometry to estimate the underlying FRET ratio that each PDBU concentration produced, in turn allowing a percent change in FRET ratio to be computed for each comparison pair. Because Z′ has a maximum value of 1 but can attain arbitrarily large negative values, we assigned a value of −1 to all Z′ values that were ≤ –1. We also assessed expression level using flow cytometry by measuring fluorescence in the YFP channel (excitation 485/emission 525), which we compared with the fluorescence of untransfected controls.
When we examined the results of this analysis, it became clear that, as expected, robust Z′ values were highly dependent on both expression level and FRET ratio change. To further assess this, we divided the data into two pools based on sensor expression level. One group had expression levels less than 10-fold higher than untransfected control K562 cells, and the second had expression levels greater than 10-fold higher. Applying this threshold split the data set exactly in half (105 FRET ratio change comparisons in each group). We found that when expression levels were such that YFP fluorescence levels were <10-fold brighter than untransfected cells, it was not possible to consistently obtain robust Z′ values >0 no matter how large the FRET ratio change ( Suppl. Fig. S1 ). In contrast, for the cells in which YFP fluorescence levels were >10-fold higher than untransfected cells, it was possible to consistently obtain robust Z′ > 0 with FRET ratio changes of 35% or more, and robust Z′ > 0.5 when FRET ratio changes were larger than 60% ( Fig. 2E ). As a means of confirming this, we measured responses to the phorbol ester PMA in 96-well plates laid out with equal numbers of DMSO-treated and PMA-treated controls ( Fig. 2F ). The plate shown had a FRET ratio increase of ~40% in response to PMA and demonstrated a Z′ = 0.7.
We examined whether the requirements we defined are unique to the DAGR or are a more general property of FRET bioreporters by performing similar experiments with five other K562 long-term transfectant lines expressing FRET bioreporters that gave responses ranging from 5% to 35%. The sensors we used, their expression level as assessed by YFP fluorescence, the stimulus we applied to them, and the FRET ratio change they gave are detailed in Table 1 . All sensors had expression levels that were considerably more than 10-fold higher than untransfected control K562 cells. Consistent with our expectations, two of the sensors that gave FRET ratio changes of ~30% gave robust Z′ > 0.5, while three that gave smaller FRET ratio changes did not.
FRET Ratio Changes and Robust Z′ for Five Sensors.
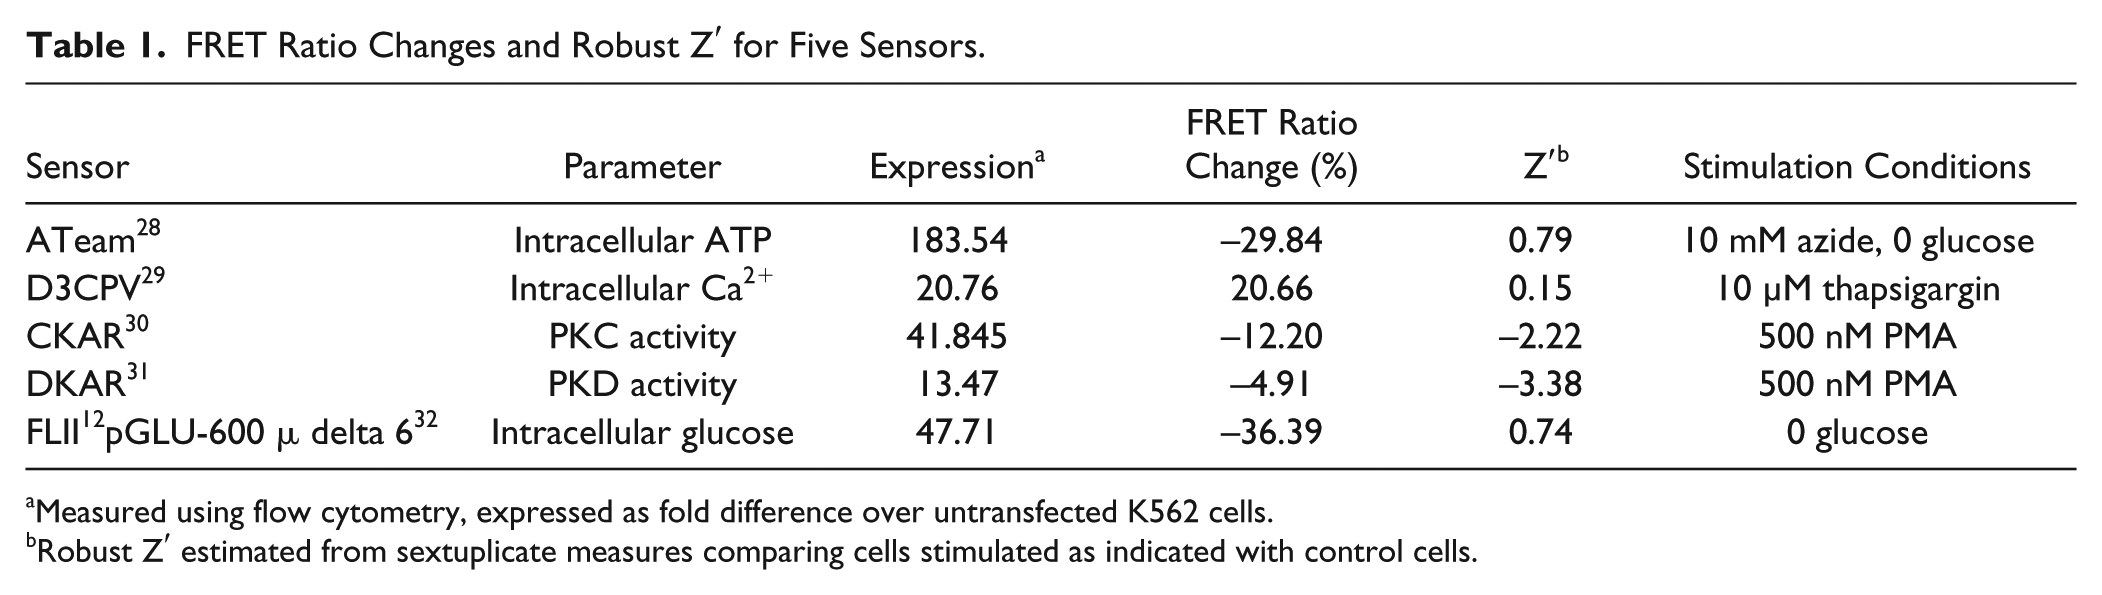
Measured using flow cytometry, expressed as fold difference over untransfected K562 cells.
Robust Z′ estimated from sextuplicate measures comparing cells stimulated as indicated with control cells.
Screening NCI’s Mechanistic Set III with a Multiple-Read Assay
Having defined the conditions needed to use DAGR-expressing K562 cells in our Spectramax i3x fluorescence plate reader, we next developed a two-read protocol that we thought should be capable of identifying compounds that act as either agonists or antagonists of C1 domains ( Fig. 3 ). We incubated cells with test compounds for 30 min, then measured the FRET ratio, which took ~5 min. Compounds acting as C1 domain agonists are expected to generate an elevated FRET ratio at this point in the assay. We then added PDBU and after an additional 30 min measured the FRET ratio again. Compounds that act as antagonists of PDBU binding to C1 domains are expected to prevent PDBU-stimulated FRET ratio increases. We used this protocol to screen the NCI Mechanistic Set III library of ~800 compounds. In the screening, 10 out of 11 plates had robust Z′ calculated between DMSO-stimulated and PMA-stimulated controls >0, and 7/11 had robust Z′ > 0.5.
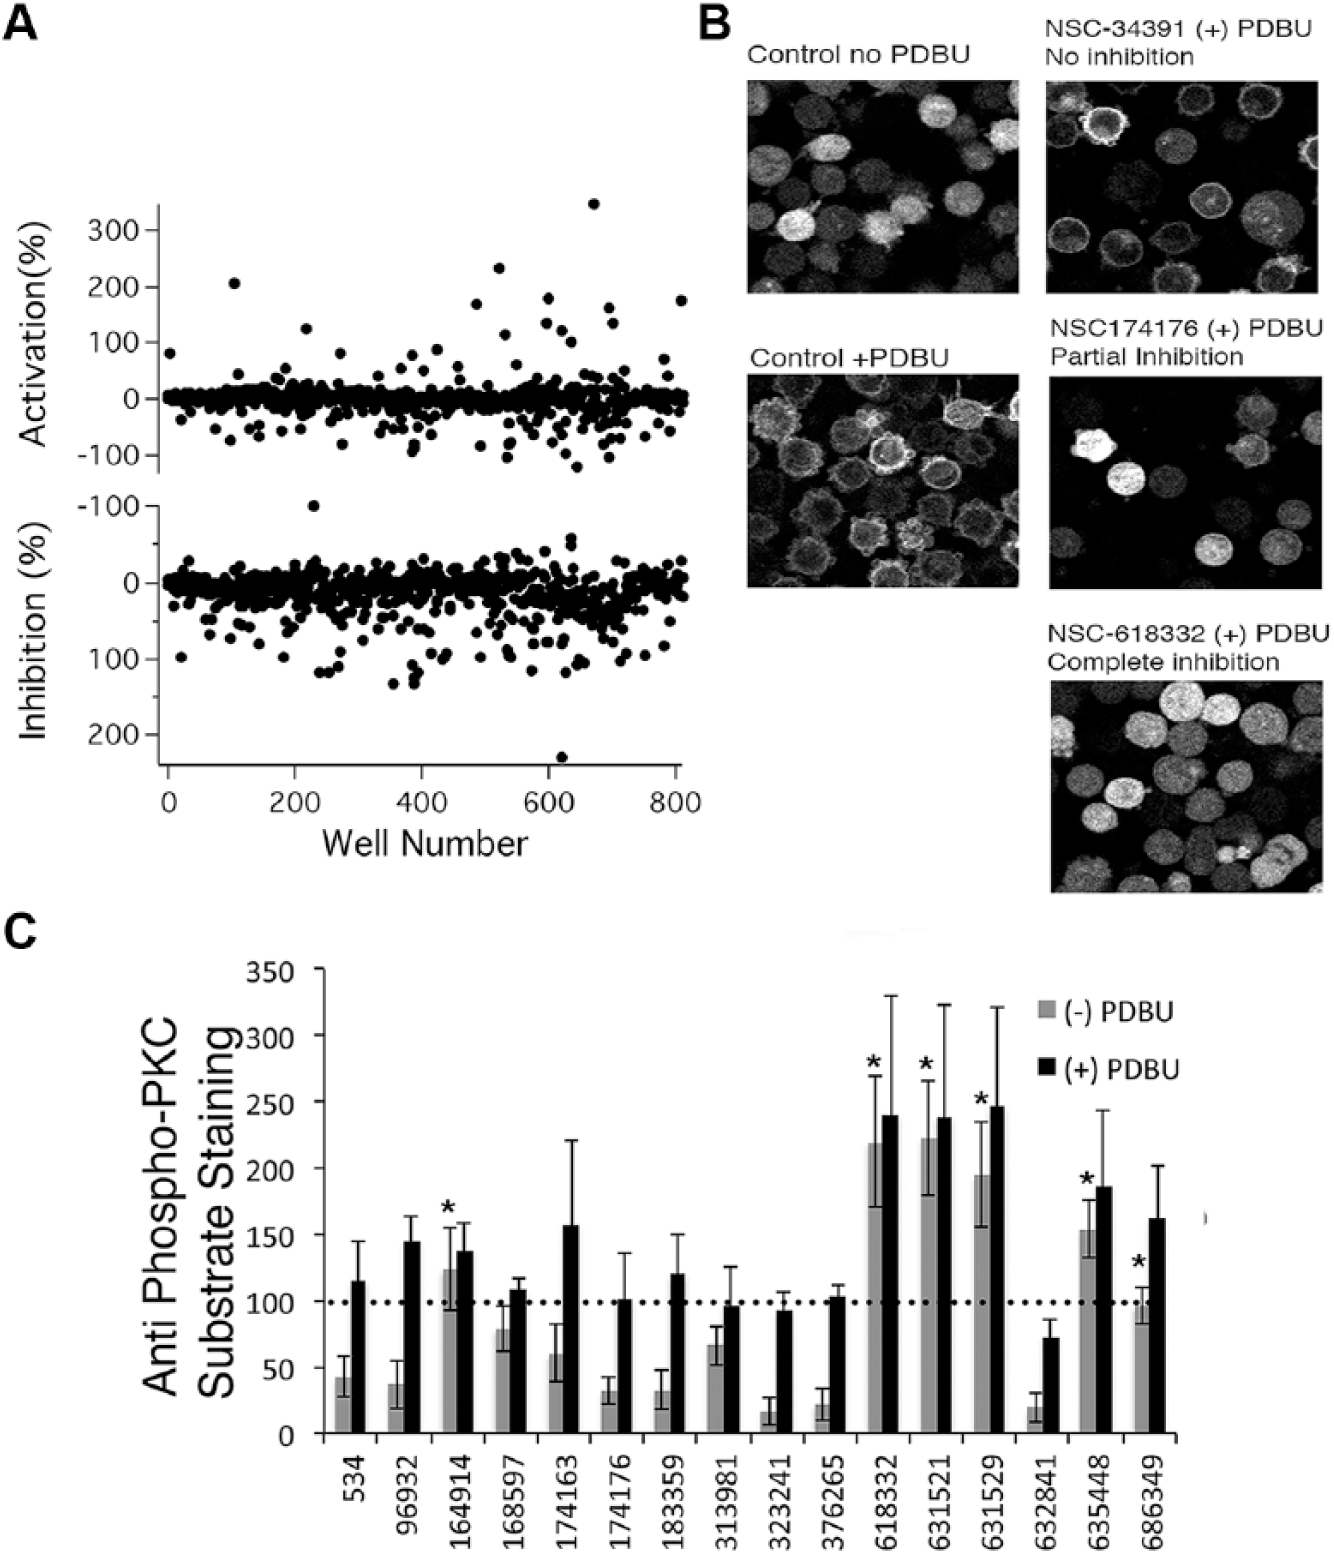
Screening the NCI’s Mechanistic Set III with a novel multiple-read assay. (
Screening identified 21 compounds that increased the FRET ratio in the absence of PDBU stimulation by 50% as much as PDBU controls, and 24 compounds that inhibited PDBU-stimulated FRET ratio increases by 75% or more ( Fig. 3A ). Ninety-four compounds were flagged as likely being fluorescent in one or more wavelengths and were not investigated further. After retesting original samples and powder resupply with the original assay, we confirmed, using FRET measurements, the activity of 10 apparent agonist compounds that increased FRET ratio by 50% as much as PDBU did in read 1, and 19 that reduced PDBU-induced FRET ratio increases by 75% or more in read 2.
The DAGR FRET ratio changes because the sensor increases in concentration upon translocation from the three-dimensional environment of the cytosol to two-dimensional membranes. This can be assessed using fluorescence microscopy, providing an alternate method to verify the activity of potential activators and inhibitors ( Fig. 3B ). As expected, control DAGR-expressing cells exhibit diffuse cytosolic YFP fluorescence throughout the cell ( Fig. 3B , left, no PDBU), and PDBU treatment triggered a change in localization that was consistent with the DAGR having bound to the plasma membrane ( Fig. 3B , right, + PDBU). Our expectation was that putative C1 domain agonists should, like PDBU, cause translocation of the DAGR to the plasma membrane, while antagonists should abrogate PDBU-stimulated DAGR translocation. However, none of the putative agonist compounds we identified in the FRET-based assay elicited DAGR localization to the membrane (data not shown). Of the antagonists, as judged by eye, three compounds failed to prevent PDBU-induced translocation (example shown in Fig. 3B , right, failed inhibition). Two compounds partially prevented PDBU-induced translocation (example shown in Fig. 3B , right, partial inhibition), and 14 compounds appeared to exhibit complete inhibition, preventing PDBU-stimulated DAGR localization (example shown in Fig. 3B , right, complete inhibition). We also noted prominent blebbing stimulated by PDBU (data not shown), a phenomenon that has been noted before and suggested as a possible basis for phenotypic screening. 24 Compounds that inhibited DAGR translocation also prevented blebbing (data not shown). Similar results were obtained in a second independent experiment conducted using a standard epifluorescence microscope rather than a confocal microscope (data not shown). The structures and NSC numbers (NCI compound identifiers) of the 16 compounds are shown in Supplemental Figure S2 .
As a further means of probing activity of the 16 compounds that partially or completely inhibited DAGR translocation, we used immunocytochemistry with an antibody raised against the phosphorylated consensus substrate PKC phosphorylation site to assess PKC activation (data for K562 cells not shown, but see data for TALL-104 cells in Fig. 3C ). Our expectation was that compounds would inhibit PDBU-stimulated increases in antibody staining intensity, reflecting inhibition of PKC activation. Surprisingly, however, none of the compounds did so. In fact, some appeared to increase staining compared with controls, raising the possibility that they were enhancing PKC activation. We tested effects of compounds on anti-phospho-PKC substrate antibody staining in cells that were not treated with PDBU, and found that several compounds apparently stimulated PKC activity. Because we were not able to find much information about PKC signaling and its regulation in K562 cells, we repeated these experiments in TALL-104 human leukemic cytotoxic lymphocytes, a cell line with which we have experience analyzing PKC signaling. TALL-104 cells were treated with compounds followed by either DMSO or PDBU before antibody staining ( Fig. 3C ). As was observed in the preliminary experiments on K562 cells described above, none of the potential inhibitory compounds prevented PDBU-stimulated PKC-dependent phosphorylation ( Fig. 3C , black bars). However, six of the compounds did increase anti-phospho-PKC substrate antibody staining when added in the absence of PDBU, suggesting that they do stimulate PKC activity ( Fig. 3C , gray bars).
Discussion
There has been relatively little use of intramolecular CFP-YFP FRET for the purposes of screening, and there has been no systematic exploration of the requirements needed to obtain signals of sufficient robustness to serve as the basis of screens. We exploited the chance observation that DAGR expression level increased following room temperature incubation to analyze the dependence of the robustness of FRET signals on sensor expression level and FRET ratio change in a Spectramax i3x fluorescent plate reader. Our results indicate that on this instrument, the DAGR needs to be expressed at levels producing YFP fluorescence >10-fold over untransfected cells and stimuli need to cause FRET ratio changes of ~35% or more to generate signals that can give Z′ > 0, which can be used for yes/no assays, 25 while FRET ratio changes in excess of 60% were needed to ensure Z′ > 0.5. Within the range of sensor expression that gave sufficient signals, our data did not support a strong further dependence of Z′ on sensor expression level, although we do not have enough data to rule out the possibility that very high expression could enhance performance at lower FRET ratio changes. This performance in a fluorescence plate reader is inferior in two ways to what we obtained using flow cytometry: 1 we were able to obtain Z′ > 0.5 in cytometry with sensors that gave maximal FRET ratio changes of only 10%–15%, and were able to select high expressing cells from populations that, like the DAGR in the absence of room temperature incubation, had overall population YFP expression levels <7-fold higher than untransfected cells.
We were unable to test performance using other plate readers, but our results seem essentially consistent with the few other studies we were able to find that used conventional fluorescent plate readers to screen using CFP-YFP FRET constructs expressed in cells, and so we believe they are likely to be generalizable. Jones et al. 16 used a Cytofluor 4000 plate reader to screen using a CFP-YFP caspase sensor. Expression levels were not quantified, but FR changes were very large (>300%), since cleavage by caspases eliminates FRET entirely. Allen et al. used a BMG Fluostar Optima plate reader to measure signals from two FRET sensors—ICUE3, a sensor for cAMP, and AKAR3, a targeted sensor for PKA activity—and were able to obtain Z′ values of >0.5. 14 Although expression levels were not characterized, HEK293 cells were used, and they typically yield high levels of expression. Measured using microscopy, AKAR3 demonstrated FR changes >30% in response to isoproterenol, used as a positive control, while ICUE3 gave FRET ratio changes of ~100%. Mazina et al. also measured signals from a CFP-YFP cAMP FRET sensor, epac2-cAMPs, and report being able to consistently obtain Z′ values >0.6 for replicates of 12 with FRET ratio changes of ~20% using a BMG PHERAStar plate reader. 15 Our results suggest that the ability to detect signals from CFP is likely to be a limiting factor in using a plate reader, because in low-expressing samples, the fluorescence of CFP after maximal PDBU treatment was only approximately twice that of buffer-containing wells. A higher-power excitation source might circumvent the problem of low CFP expression, but it also might simply increase background fluorescence. We believe that the strategy we report here—employing a sensor whose expression level and FRET ratio change can both be altered (by room temperature incubation and phorbol ester concentration, respectively, in the case of the DAGR)—could be used by others to determine the conditions needed for robust measurements on other instruments.
Screening the NCI’s Mechanistic Set III revealed a number of compounds that were antagonist hits in the primary screen as well as in an orthogonal microscopic assay of DAGR translocation. However, these compounds failed to block PKC activation—in fact, several activated PKC on their own. There are a number of potential explanations for these results. For example, we did not assess compound effects on the translocation of PKC, so compounds that blocked the translocation of the DAGR but inhibited PKC activation may not affect C1 domains when they are present in the context of the full-length protein. Compounds that activated PKC may do so via direct actions on C1 domains, or via a number of potential indirect effects on calcium, caspases, or reactive oxygen species. While there are ways to investigate these issues, the compounds we identified are not very appealing—8 of the 16 contain mercury, lead, gold, tin, or copper; 1 contains selenium; and the others have obvious chemical liabilities—which diminishes the impetus for doing so. We note that when tested for effects on binding of radiolabeled PDBU to purified PKC-α, four compounds that all contain either mercury or tin (NSC numbers 534, 174163, 174176, and 183359) did in fact demonstrate inhibitory effects. However, the dose dependence of inhibition was quite steep, suggesting that the mechanism was not simple competitive inhibition (Xiaoling Zhao and Peter M. Blumberg, personal communication). We also encountered problems with fluorescent compounds, which is not unexpected using a method that measures two wavelengths. Ninety-four compounds (>10% of those we screened) failed our criteria and were identified as generating fluorescent artifacts. More sophisticated detection technology, such as spectral unmixing, 18 could have circumvented this, but plate readers utilizing the technology are not common.
As we have experience measuring intramolecular FRET from sensors based on CFP-YFP using both flow cytometry and a fluorescence plate reader, we have developed an appreciation for the strengths and weaknesses of these two platforms. The main advantages we see to using a conventional fluorescent plate reader rather than cytometry for screening based on CFP-YFP FRET sensors are the greater availability of plate readers compared with plate-sampling flow cytometers, increased throughput in a plate reader due to the significantly slower read rate on a cytometer, and the ability to conduct multiple-read assays, since reading the plate does not disturb the sample. The major advantages of using flow cytometry are the ability to achieve robust signals with smaller underlying FRET ratio changes and lower expression level, and the option of multiplexing sensors. In a previous effort in which we screened for inhibitors of cellular ATP production, 13 it appears that using a plate reader was a good choice, as we were able to identify compounds that affected multiple cellular metabolic processes in a single multiple-read screen. However, in the case of screening for compounds that affect C1 domains, separate assays for activators and inhibitors conducted via cytometry might have been a better strategy. First, we could have included an assessment of effects on PKC activation in the primary screen via multiplexing with a reporter for PKC activity, which would have indicated in the initial screening step that hits did not have anticipated effects. Second, and perhaps more important, we had to conduct our screen using a high concentration (100 nM) of PDBU as a control in both reads to obtain favorable assay performance. However, the underlying affinity of C1 domains for PDBU may be much lower than 100 nM8,26—the exact values depend on whether calcium is present, what lipids are used, and the method of analysis employed. This may have caused us to miss inhibitors, since applying a substrate like PDBU in excess is expected to render competitive inhibitors less effective. Had we used cytometry with room temperature-enhanced DAGR cells, we likely could have used a lower PDBU concentration. We estimate based on our previous results 1 that 10 nM PDBU would produce a 10%–15% FRET change in both the DAGR and C kinase activity reporter (CKAR, a PKC activity sensor) in cytometry, which would likely be sufficient to produce a useful Z′. Using a lower PDBU concentration might have increased the chances of finding inhibitors with a desirable mechanism of action.
We expect that the plate reader-based assay would be easy to adapt to a higher-throughput format utilizing 384-well or higher formats suitable for screening large compound libraries. The number of cells required per well would need to be scaled down proportionally with well surface area, but this should be trivial to optimize. We were able to read a 96-well plate in under 5 min, so on the Spectramax i3x, a 384-well plate would take <20 min to read. We did not investigate whether speed could be enhanced by reducing the number of measurements per well (we used six, which is the default), or if this would degrade signal quality, but the YFP reading could be eliminated, which should reduce the time needed to read a plate by a third. There are some plate readers, like BMG Labtech’s Pherastar, that can read the two wavelengths required for CFP-YFP FRET simultaneously, which would result in even faster data acquisition. It should also be possible to adapt a cytometry-based assay to a higher-density format, although reading plates in a flow cytometer is considerably slower than in a plate reader. Our BD Fortessa with plate sampler attachment, which is not particularly fast, required ~40 min to acquire a 96-well plate. Dedicated plate-sampling cytometers that can read a 384-well plate in ~20–40 min are commercially available, but this is still considerably slower than the throughput possible with a plate reader. However, faster sampling utilizing clusters of cytometers ganged together to read a plate has been explored, making it possible to read a 1536-well plate in as little as 15 min. 27 Note that in cytometry, acquisition of channels is simultaneous, so reading three fluorescent parameters requires the same amount of time as reading one. Of course, it is possible that using automated cell dispensers and liquid handlers might degrade assay performance compared with what we were able to attain with multichannel pipetters. However, as presently conducted, stimuli are added in excess, so some imprecision in liquid handling should not have a major effect.
In summary, the results presented here, together with our previous work 13 and the work of others,14,15,17 confirm that if expression levels are high enough and signals are large enough, intramolecular FRET sensors based on CFP and YFP can be used in a conventional fluorescence plate reader. Because these sensors allow the function of important biological activities to be monitored in living cells, and because more sensors are becoming available all the time, we believe that the drug discovery community could benefit from exploring their use in screening.
Supplemental Material
DS_DISC830086 – Supplemental material for Temperature-Dependent Expression of a CFP-YFP FRET Diacylglycerol Sensor Enables Multiple-Read Screening for Compounds That Affect C1 Domains
Supplemental material, DS_DISC830086 for Temperature-Dependent Expression of a CFP-YFP FRET Diacylglycerol Sensor Enables Multiple-Read Screening for Compounds That Affect C1 Domains by Xiuyi Alexander Yang and Adam Zweifach in SLAS Discovery
Footnotes
Acknowledgements
We would like to thank Drs. Wu He and Christopher O’Connell of the University of Connecticut’s COR2E Flow Cytometry and Advanced Light Microscopy Facilities for assistance. We will provide the DAGR cell line upon request, provided shipping is paid by the requestor.
Supplemental material is available online with this article.
Declaration of Conflicting Interests
The authors declared no potential conflicts of interest with respect to the research, authorship, and/or publication of this article.
Funding
The authors disclosed receipt of the following financial support for the research, authorship, and/or publication of this article: Supported by NIH Grant R01 AI121069 to A.Z.
References
Supplementary Material
Please find the following supplemental material available below.
For Open Access articles published under a Creative Commons License, all supplemental material carries the same license as the article it is associated with.
For non-Open Access articles published, all supplemental material carries a non-exclusive license, and permission requests for re-use of supplemental material or any part of supplemental material shall be sent directly to the copyright owner as specified in the copyright notice associated with the article.