
Abstract
Animal and clinical studies demonstrate that cancer drug combinations (DCs) are more effective than single agents. However, it is difficult to predict which DCs will be more efficacious than individual drugs. Systematic DC high-throughput screening (HTS) of 100 approved drugs in the National Cancer Institute’s panel of 60 cancer cell lines (NCI-60) produced data to help select DCs for further consideration. We miniaturized growth inhibition assays into 384-well format, increased the fetal bovine serum amount to 10%, lengthened compound exposure to 72 h, and used a homogeneous detection reagent. We determined the growth inhibition 50% values of individual drugs across 60 cell lines, selected drug concentrations for 4 × 4 DC matrices (DCMs), created DCM master and replica daughter plate sets, implemented the HTS, quality control reviewed the data, and analyzed the results. A total of 2620 DCMs were screened in 60 cancer cell lines to generate 3.04 million data points for the NCI ALMANAC (A Large Matrix of Anti-Neoplastic Agent Combinations) database. We confirmed in vitro a synergistic drug interaction flagged in the DC HTS between the vinca-alkaloid microtubule assembly inhibitor vinorelbine (Navelbine) tartrate and the epidermal growth factor-receptor tyrosine kinase inhibitor gefitinib (Iressa) in the SK-MEL-5 melanoma cell line. Seventy-five percent of the DCs examined in the screen are not currently in the clinical trials database. Selected synergistic drug interactions flagged in the DC HTS described herein were subsequently confirmed by the NCI in vitro, evaluated mechanistically, and were shown to have greater than single-agent efficacy in mouse xenograft human cancer models. Enrollment is open for two clinical trials for DCs that were identified in the DC HTS. The NCI ALMANAC database therefore constitutes a valuable resource for selecting promising DCs for confirmation, mechanistic studies, and clinical translation.
Introduction
Numerous omics studies (genomics, proteomics, transcriptomics, and metabolomics) have unveiled the complexity of mutations, gene copy number alterations, tumor suppressor inactivation, gene expression subtypes, signaling pathway modifications, and altered metabolic pathways that contribute to the development and maintenance of the malignant phenotype.1–10 Solid tumors comprise genetically diverse and heterogeneous clonal cell populations with distinct genetic profiles and/or differentiation states.1,2,6,7 Not only do intrinsic resistance factors preexist in subpopulations of tumor cells to confer drug resistance, but also tumor cells respond adaptively to therapy by altering drug target expression, accumulating secondary mutations, or activating feedback loops and compensatory signaling pathways to develop drug resistance. 11 Given the inherent genetic heterogeneity and complexity of cancers and their propensity for drug resistance, it is perhaps not surprising that most single-agent cancer treatments fail to provide prolonged patient benefits.1–4,6,7,11 Cumulative evidence from both animal and clinical studies indicates that drug combinations (DCs) are more effective than single-agent therapies.1–4,6,7,11 The most effective combinations of cytotoxic chemotherapies increase tumor cell killing, in either an additive or synergistic fashion, by combining agents with different molecular mechanisms and nonoverlapping toxicities to reduce the probability of resistance.1–4,6,7,11 However, it is difficult to select and/or predict which DCs will effectively provide long-term benefits to patients beyond those afforded by the individual agents.
Traditionally, DCs have been selected empirically and evaluated in clinical trials that often lacked a biological rationale.1–4,6,7 However, even if we were only to consider 100 Food and Drug Administration (FDA)-approved cancer drugs, there are 4950 possible pairwise DCs, which would be prohibitively expensive and time-consuming to evaluate in animal models let alone in clinical trials. Presumably not every possible DC could be justified mechanistically, thereby reducing the number of DCs under active consideration. Specific DCs might be selected by rational, hypothesis-driven approaches based on the altered oncogenic tumor targets and signaling pathways identified by omics and gene expression studies.1–4,6,7 Unfortunately, approved cancer drugs have not yet been discovered for every mutated target or altered signaling pathway identified by these approaches. Knowledge of the intrinsic and adaptive drug resistance mechanisms of tumors might also provide a rational basis for the selection of specific DCs. 11 However, tumors invariably harbor multiple genetic and signaling pathway alterations, and our understanding of drug resistance and how anticancer agents work remains woefully incomplete.1–4,6,11 While hypothesis-driven and empiric approaches will continue to be utilized, the systematic high-throughput screening (HTS) of DCs against panels of well-characterized tumor cell lines provides a complementary data-driven strategy to select DCs with the potential to become effective therapies.1–4,6 Moreover, an unbiased HTS strategy might identify novel unanticipated effective cancer DCs through serendipity.
However, there are also some significant challenges to implementing DC HTS campaigns.3,7,12–16 The assays must be appropriate for the tumor type of interest and should address the genetic diversity and heterogeneity inherent in those cancers.1,6,17 This likely requires the development of growth inhibition assays in multiple tumor cell lines that meet the requirements for HTS assays: scalability with a robust and reproducible signal window and acceptable performance statistics.18–21 Additionally, there are complex data analysis and compound handling issues associated with defining the nature of the pharmacological interactions between two drugs.15,22–26 Analyses of DC interactions are more complex than the typical HTS data processing methods, such as percent activation, percent inhibition, or z scores. Several models have been developed to analyze and classify whether two drugs interact in an antagonistic, additive, or synergistic manner: Lowe additivity, Bliss independence, and Chou–Talalay median effect models.15,22–26 Such analyses require testing a matrix of the two drugs over a broad range of concentrations and ratios to provide a pairwise interaction surface that is compared with the individual agent responses.15,22–26 Additionally, the generation of pairwise DC matrices (DCMs) presents logistical challenges with respect to compound handling and tracking. 13 There is also the issue of scale, as the number of DCs under consideration increases the unbiased screening of all possible pairwise DCs against multiple tumor cell lines, which has some significant consequences for both the tissue culture burden and amount of data that will be generated.
Since its introduction in the early 1990s, the National Cancer Institute’s panel of 60 cancer cell lines (NCI-60) has been used to screen >100,000 compounds and >50,000 natural product extracts for inhibition of tumor cell line growth and to profile the activity of FDA-approved cancer drugs.27,28 The NCI-60 cell lines have been molecularly characterized extensively: exome sequence, DNA methylation, mRNA expression, microRNA expression, protein levels and modifications, drug transporter expression, enzyme activity, and metabolomic profiling.27–30 Compound profiling data and the molecular characterization of the cell lines are publicly available for download from the Developmental Therapeutics Program (DTP) website (https://dtp.cancer.gov/databases_tools/bulk_data.htm).28,31,32 Patterns of growth inhibition across the NCI-60 cell lines are similar for drugs with closely related mechanisms of action (MOAs), and using the COMPARE algorithm, the drug profiles of known anticancer agents can be used to predict the MOAs of unknown drugs with similar sensitivity and resistance activity profiles, and to provide information on drug resistance mechanisms.27,28 For example, the ABC transporter family includes several of the best characterized drug efflux pumps that mediate drug resistance, and correlations between the mRNA expression profiles of 48 members of the ABC transporter family in the NCI-60 panel and the growth inhibitory profiles of 1429 drugs were used to identify which transporters likely conferred resistance to selected agents. 33 Whole-exome sequencing of the NCI-60 cell lines showed that the mutation pattern between cell lines was divergent and that specific variants of well-established cancer genes had profound effects on the responses to clinically relevant targeted agents, revealing pharmacogenomic correlations between specific gene variants and drug responses. 29 To add further value to the NCI-60 drug screen, the NCI wished to conduct an unbiased DC HTS campaign of 100 FDA-approved anticancer drugs to generate data that would be entered into the ALMANAC (A Large Matrix of Anti-Neoplastic Agent Combinations) database (https://dtp.cancer.gov/ncialmanac), which could be used for hypothesis-generating evaluations of oncology DCs. 30 Historically, the NCI-60 anticancer drug screen has been performed in a 96-well format where cells are exposed to compounds for 48 h in media containing 5% fetal bovine serum (FBS) and then fixed and stained with sulforhodamine B.27,28 To provide the throughput and capacity required for a DC HTS campaign of 2620 DCMs in all 60 cell lines, we needed to miniaturize and automate the growth inhibition assays into 384-well plate format, and to incorporate a homogeneous viability detection reagent to measure growth inhibition. The NCI also stipulated that the compound exposure be lengthened to 72 h and the amount of FBS in the assay be increased to 10%. The current paper describes the reformatting of the NCI-60 cancer drug screen into 384-well plates using the homogeneous CellTiter-Glo (CTG; Promega Corporation, Madison, WI) cellular ATP detection reagent, and how a DC HTS campaign of 2620 DCMs was implemented to generate 3.04 million data points for the NCI ALMANAC database. 30 For the first time, we provide detailed descriptions and data for the development and optimization of the growth inhibition assays for the 60 tumor cell lines, how the individual drug concentrations were selected for the DCMs, how the DCM master and replica daughter plates were constructed and utilized in the screen, the HTS assay performance quality control (QC) data for the campaign, and how the drug interaction data were analyzed and scored. We describe a process and present data to confirm a synergistic drug interaction that was flagged in the DC HTS between the vinca-alkaloid microtubule assembly inhibitor vinorelbine (Navelbine) tartrate and the epidermal growth factor-receptor (EGF-R) tyrosine kinase inhibitor gefitinib (Iressa) in the SK-MEL-5 melanoma cell line. Seventy-five percent of the DCs examined in the screen are not currently in the clinical trials database. Selected synergistic drug interactions that were flagged in the DC HTS described herein have subsequently been confirmed by the NCI in vitro and evaluated mechanistically, and were shown to have greater than single-agent efficacy in mouse xenograft human cancer models. 30 Enrollment has been opened for two clinical trials for DCs that were identified in the DC HTS. 30 The NCI ALMANAC database therefore constitutes a valuable resource for selecting promising DCs for confirmation, mechanistic studies, and clinical translation.
Materials and Methods
Reagents
DMSO (99.9% high-performance liquid chromatography grade, under argon) was from Alfa Aesar (Ward Hill, MA). Dulbecco’s Mg2+ and Ca2+ free phosphate-buffered saline (PBS) was purchased from Corning (Tewksbury, MA).
FDA-Approved Cancer Drugs
The 100 FDA-approved cancer drugs were obtained through commercial sources and shipped to the University of Pittsburgh by the NCI DTP. The MOAs of the 100 drugs include 61 traditional cytotoxic chemotherapeutics, including DNA-damaging agents (nucleoside analog inhibitors, topoisomerase inhibitors) and microtubule-destabilizing or -stabilizing agents, as well as 37 molecularly targeted agents, inhibitors of angiogenesis, receptor tyrosine kinases, tyrosine kinases, serine/threonine kinases, nuclear receptors, histone deacetylases (HDACs), aromatases, and the proteasome. Ninety-six of the compounds were soluble in 100% DMSO, which was used to prepare stock solutions that were used to generate master and replica daughter plate sets for the individual GI50 (growth inhibition by 50%) determinations and DCMs. Two stock compound solutions were prepared in sterile deionized water and two more were prepared in 0.1 N NaOH. The final concentration of DMSO or other solvents in the NCI-60 growth inhibition assays was ⩽0.2%.
Preparation of Individual Drug GI50 Master and Replica Daughter Plates
Individual drug GI50 values were determined in 5-point 10-fold (log) serial dilution series conducted in single wells per concentration. The maximum starting concentration selected for each drug was approximately 2 logs (100-fold) above the average GI50 of the drugs across all 60 cell lines downloaded from the NCI DTP website. We used liquid handling protocols developed on our Evolution-P3 (EP3; PerkinElmer, Waltham, MA) or Bravo (Agilent Technologies, Santa Clara, CA) automated liquid handing platforms outfitted with 384-well dispensing heads to generate 5-point 10-fold serial dilution master plates in 100% DMSO. Two microliters from each well of the master plates was transferred into barcoded replica daughter plates using the EP3 or Bravo liquid handling robots outfitted with 384-well dispensing heads, and the compound plates were then sealed with aluminum foil and stored at −20 °C until use. In the pilot-phase DC HTS, we screened 20 individual drugs arrayed on one GI50 master and replica daughter plate sets. The 72 drugs added in the first production phase of the DC HTS were arrayed on 2× GI50 master and replica daughter plate sets, and the seven compounds added in the second production phase were arrayed on one GI50 master and replica daughter plate set.
Preparation of DCM Master and Replica Daughter Plates
In the pilot phase, we screened 20 drugs in all possible pairwise DCs for a total of 190 DCMs arrayed on 9.5 DC master plates. We used the Janus MDT Multiprobe (PerkinElmer) automated liquid handling platform to array 20 individual 4 × 4 DCMs onto 384-well master plates. We generated the 10× master plates using DC work lists to direct the Multiprobe to transfer and reformat 20 μL of 1000× drug concentrations from the wells of manually prepared source plates placed on the deck into the wells of the 384-well destination master plates, also on the deck, to make DC wells with 40 µL. Twenty microliters of DMSO was added to single drug wells, and 40 µL to DMSO control wells. The 384-well transfer head of the Bravo was used to transfer 2 μL from the DC master plates into barcoded replica daughter plates, which were then centrifuged at 50× g for 5 min, sealed with aluminum foil, and stored at −20 °C until use.
In the first production phase, we screened the 20 pilot-phase drugs in combination with 72 new drugs, which involved 1440 individual 4 × 4 DCMs arrayed on 72× 384-well DC master plates. To generate DC master plates, we prepared drug A master plates that contained three 1000× drug screening concentrations for each of the 20 pilot phase A drugs by adding 220 µL of each of the three drug concentrations to the appropriate wells in eight deep-well plates. We then used the 384-well transfer head of the Bravo to stamp out 80× drug A 384-well master plates (20 µL) from the deep-well plates. DMSO and doxorubicin (Dox) controls (40 µL) were then added to these drug A master plates, and they were centrifuged (50× g), sealed with foil, and frozen at −20 °C. To generate the drug B master plates, we prepared three 1000× screening concentrations for one of the 72 B drugs and thawed one of the drug A master plates. Using a Matrix multichannel pipettor (Thermo Fisher, Waltham, MA), we transferred 20 µL of drug B to the appropriate wells on the drug A master plate to create a DC master plate. We then used the 384-well transfer head of the Bravo to stamp out 15× 2 µL replica daughter plates from the DC master plate, which were then centrifuged, sealed, and frozen at −20 °C. This process was repeated for each of the 72 B drugs.
In the second production phase, 10 new B drugs were screened in combination with 99 A drugs, which required 990 individual 4 × 4 DCMs arrayed on 49.5× 384-well DC master plates. To generate these DC master plates, we prepared 5× 384-well A drug master plates that contained a matrix of 20 different A drugs at 1000× the screening concentrations by adding 220 µL of each concentration to the appropriate wells in five deep-well plates. We then used the 384-well transfer head of the Bravo to stamp out 10× drug A master plates (20 µL) from the 5 deep-well plates and then centrifuged the plates, sealed them with foil, and froze them at −20 °C. To generate the drug B master plates, we prepared three 1000× screening concentrations for one of the 10 B drugs and transferred 120 µL of each concentration to the appropriate wells of a deep-well plate. We thawed one set of the drug A master plates (five per set) and used a Matrix multichannel pipettor to transfer 20 µL of drug B to the appropriate wells on each of the drug A master plates, thereby creating the DC master plates. The DMSO and Dox controls (40 µL) were then added to the master plates. We then used the 384-well transfer head of the Bravo to stamp out 15× 2 µL replica daughter plates from the DC master plates, which were then centrifuged, sealed with foil, and frozen at −20 °C. This process was repeated for each of the 10 B drugs.
NCI-60 Cell Lines
The NCI-60 cell lines were obtained from the NCI DTP Tumor Repository in 2010. The NCI DTP Tumor Repository performed Applied Biosystems AmpFLSTR Identifiler testing with PCR amplification to confirm consistency with the published Identifiler STR profile for each of the NCI-60 cell lines and tested them for mycoplasma contamination. After receipt of frozen cell pellets from the NCI DTP repository, the 60 cell lines were thawed and placed into tissue culture at 37 °C, 5% CO2, and 95% humidity and expanded through several passages before centrifugation and resuspension in 10% FBS plus 10% DMSO and freezing in liquid nitrogen. The NCI-60 cell lines were maintained in RPMI 1640 medium with 2 mM
Determination of Individual Drug GI50 Values in the NCI-60 Panel
The 384-well NCI-60 cell line growth inhibition assays using the CTG homogeneous cellular ATP detection reagent were adapted from similarly formatted assays we had previously developed in melanoma, prostate cancer, and head and neck cell lines.19,20,34–36 On day 1 of the assay, the NCI-60 cell lines were harvested by trypsinization, centrifugation, and viable trypan blue excluding cells that were counted using a hemocytometer. Forty-five microliters of cells at the appropriate cell density were seeded into the wells of white, opaque, clear-bottomed, 384-well barcoded time 0 (T0) and time 72 h (T72) assay plates (Greiner BioOne, Monroe, NC, cat. 781098) using a Matrix multichannel pipettor or a Microflo (BioTek, Winooski, VT) bulk reagent dispenser. Assay plates were then incubated at 37 °C in 5% CO2 and 95% humidity for 24 h. On day 2 (T0), GI50 replica daughter plates containing 2 μL of each compound concentration in 100% DMSO were thawed at 37 °C and the compounds were diluted in 98 μL of serum-free RPMI 1640 media to an intermediate drug concentration (2% DMSO), and then 5 μL was transferred into the test wells of the assay plate using the 384-well transfer head on a Bravo robotic liquid handling platform; plates were centrifuged at 100× g for 1 min and returned to an incubator at 37°C in 5% CO2 and 95% humidity for 72 h. Also, on day 2, the T0 control cell seeding plates were removed from the incubator and 25 μL of the CTG detection reagent was added to the wells using a Matrix multichannel pipettor, and after a 15 min incubation at room temperature, the relative luminescence units (RLUs) of the T0 control plates was captured on the EnVision (PerkinElmer) microtiter plate reader. On day 5, the compound-treated T72 assay plates were removed from the incubator, 25 μL of CTG was added to the wells using a Microflo bulk reagent dispenser, and after 15 min the RLUs were read on the EnVision plate reader. To analyze the growth inhibition data, we used an ActivityBase (IDBS, Guildford, UK) concentration–response template to process the raw RLU data to percent growth (PG); to generate HTS assay performance statistics, signal-to-background (S/B) ratios, and Z-factor coefficients; and to fit the data to curves and derive the GI50 values. The PG was calculated using the standard NCI-60 protocol, and as described previously.27,28,35
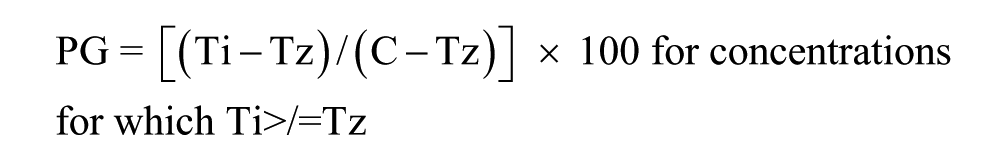
where Ti is the compound well test value at 72 h, Tz is the average of the test values from the T0 control plate at time zero (n = 384), and C is the average of the test values (n = 64) in the T72 DMSO (0.2%) control wells. GraphPad Prism 5 software (GraphPad Software, La Jolla, CA) was used to plot and fit data to curves using the sigmoidal dose–response variable slope equation:

where Bottom is the Y value at the bottom plateau, Top is the Y value at the top plateau, LogEC50 is the X value when the response is halfway between the bottom and top, and HillSlope describes the steepness of the curve. The GI50 value represents the concentration at which cell growth was inhibited by 50%, the total growth inhibition (TGI) value represents the concentration at which cell growth was fully inhibited, and the LC50 value represents the concentration at which 50% of the cells were killed.
DCM Screening in the NCI-60 Panel
The 384-well NCI-60 cell line DC growth inhibition assays using the CTG detection reagent were adapted from assays we had previously developed in melanoma cell lines. 35 On day 1 of the assay, the NCI-60 cell lines were harvested, counted, and seeded at the appropriate cell density into T0 and T72 384-well assay plates using either a Map-C2 (Titertek, Huntsville, AL) or a Multidrop (Thermo Fisher, Waltham, MA) bulk dispenser. On day 2, the T0 control cell seeding plates were removed from the incubator, 25 μL of the CTG was added to the wells, and the RLU signals were acquired as described above. Also on day 2, DC replica daughter plates prepared as described above were thawed at 37 °C and diluted in 98 μL of serum-free RPMI 1640 media using a MAP-C2 dispenser to an intermediate drug concentration (2% DMSO), and then 5 μL was transferred into the test wells of the T72 assay plates using the 384-well transfer head on a Bravo robotic liquid handling platform, and the plates were then returned to an incubator at 37 °C in 5% CO2 and 95% humidity for 72 h. On day 5, the compound-treated T72 assay plates were removed from the incubator, 25 μL of CTG was added to the wells using a Microflo bulk reagent dispenser, the RLU signals were captured on the EnVision, and the PG was calculated using the standard NCI-60 protocol27,28 as described above.
Confirmation of DCs Scored Synergistically via HTS
We arrayed two 10 × 10 DCMs onto 384-well master plates. Each DCM included 9 × 9 DC wells (81 total) together with 9 wells (18 total) containing each of the corresponding individual drug concentrations, and one DMSO control well. Two 10 × 10 DCMs were arrayed in columns 3–22 of the 384-well plates, together with DMSO (0.2%) controls in columns 1, 2, 23, and 24, and a 5-point Dox GI50 curve arrayed in columns 23 and 24 as described above. The NCI-60 cell line growth inhibition assays were conducted as described above and previously. 35
Drug Interaction Score to Analyze HTS Drug Interactions
The Bliss independence and Loewe additive models for analyzing combinations of two drugs are described by eq 1, which represents a Bliss additive effect on cell growth.22–25

where the fraction of cells affected (FA) is the cell loss fraction (CLF) or percent growth inhibition (%GI) at X concentration of drug A alone, FB is the CLF at Y concentration of drug B alone, and FAB is the expected CLF of an independent (assumes no interaction between the drugs) theoretical combination of X concentration of drug A with Y concentration of drug B. FAB′ is the experimentally observed CLF for each DC. When FAB′ > FAB, more growth inhibition/cell death was observed than if the drugs were acting independently, and synergism is indicated. If FAB′ < FAB, less growth inhibition/cell death was observed than if the drugs were acting independently, and antagonism is indicated. In cases where FAB′ = FAB, the conclusion is that the two drugs are additive. However due to the inherent variability in experiments, exact FAB, FA, and FB can never be measured.
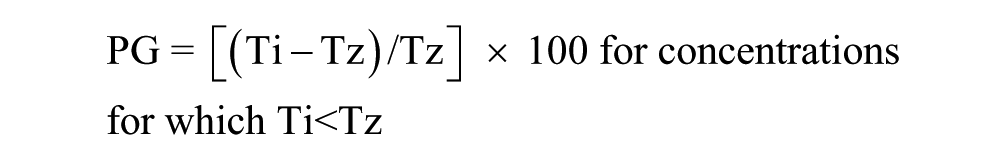
To take advantage of our HTS strategy where individual drugs are tested in multiple replicates as well as in combination, we developed a drug interaction (DI) score to classify the interaction status of two drugs:
where F′AB is the experimentally observed %GI for each DC, µA and µB are the sample means of measured replicates of %GI or CLF at X and Y concentrations of drug A or drug B alone, δA and δB are the sample standard deviations of measured replicates of drug A or drug B alone, and N1 and N2 are the number of sample replicates of drug A or drug B alone. The DI score analysis was implemented in MATLAB (MathWorks, Natick, MA). The DI score calculation (eq 2) is a modification of the Bliss independence model (eq 1).22–25 The numerator represents the experimentally observed %GI for each DC in the DCM minus the %GI for a Bliss additive effect calculated from the sample means of all measured replicates of the individual concentrations of drug A and drug B alone. It is the difference between the experimentally observed %GI of a DC and the calculated Bliss additive effect of replicate means of the two drugs individually. The denominator of eq 2 takes advantage of the individual drug concentration replicates and uses the sample standard deviations of measured replicates of drug A and drug B alone to calculate a value for the variability associated with the individual drug measurements, which when divided into the difference between the DC %GI and the calculated Bliss independence additivity for the individual drugs can be used to classify the interactions between the two drugs. A DI >3 indicates synergy, a DI < –3 indicates antagonism, and for −3 < DI < 3 the interaction is additive.
Chou–Talalay Median Effect Model to Analyze Drug Interactions
The Chou–Talalay median effect model accounts for the dose responses of the two interacting drugs to determine the combination effect.23,24 Equation 3 describes the derivation of the combination index (CI) score:

where D1 and D2 denote the doses of compounds 1 and 2 required to reach an effect of X% as individual drug treatments, while DX1 and DX2 are the doses needed in combination to inhibit X%, respectively. DCs with CI > 1 exhibit antagonistic interactions, DCs with CI = 1 exhibit additivity, and DCs with CI < 1 exhibit synergistic interactions. The COMPUSYN freeware program was utilized to calculate CI values and evaluate DC synergy as described previously. 35
Isobologram Plots of Drug Interactions
Isobologram plots are simple graphic approaches to determine whether drug interactions are additive. 37 In a plot of equally effective dose pairs termed isoboles for a single effect, when a specific effect level such as 50% of maximum is selected, the doses of drug A and drug B alone that produce this effect are plotted as axial points in a Cartesian plot. When a combination of drugs is simply additive, then the locus of points (dose pairs) that produce this effect form a straight line connecting A to B. If the line connecting the actual dose pairs that produces the selected effect level experimentally significantly diverges from a straight line between A and B, then the DC is not additive. The isobologram plots were constructed in MATLAB.
Pharmacodynamic Drug Interaction Model
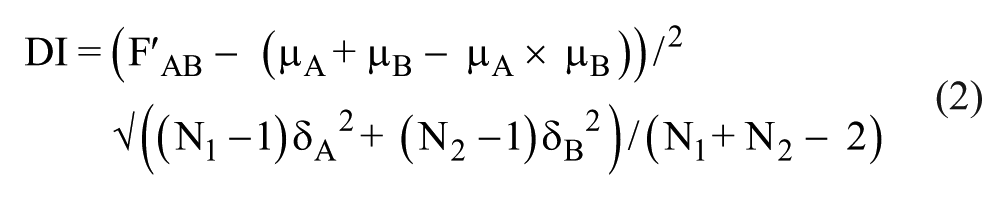
The pharmacodynamic drug interaction model has been used to describe the relation between drug effects such as %GI or CLF. 38 Equation 4 describes the derivation of the drug interaction effect F:
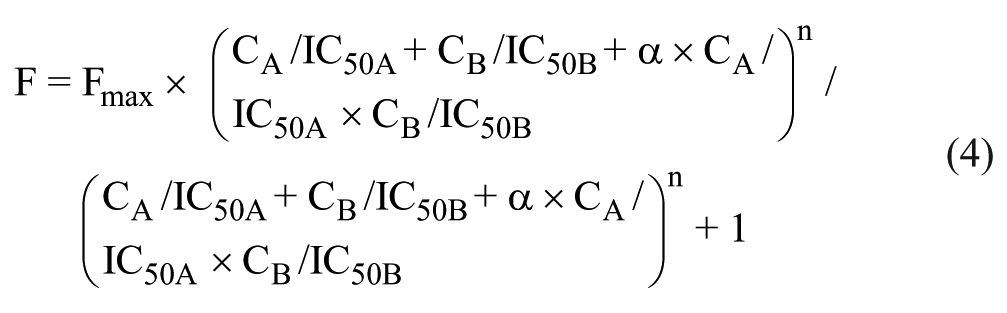
where Fmax is the maximal effect of drug A and drug B, CA and CB are the concentrations of drug A and drug B, IC50A and IC50B are the individual drug concentrations that induce 50% of the max growth inhibition or cell loss, n is the slope of the response surface, and α is a parameter that characterizes the synergistic status of drug interaction. When α = 0, the drug interaction is additive. If α > 0, the drug interaction is synergistic, and if α < 0, the drug interaction is antagonistic. The pharmacodynamic drug interaction model analysis and plots were produced in MATLAB.
Z-Score Analysis
We employed a z-score statistical scoring method to analyze the distribution of DI scores >3 in the NCI-60 pilot DC HTS data grouped by either tumor tissue type, cell line, or DCM: Z score = (Xi –
Results
Reformatting the NCI-60 Cell Line Growth Inhibition Assays
We needed to miniaturize the NCI-60 growth inhibition assays into 384-well plate format, and to utilize a homogeneous viability detection reagent to measure growth inhibition. In addition, we were required to increase the amount of FBS in the media from 5% to 10% and lengthen the compound exposure from 48 to 72 h. We wanted to select a cell seeding density that under the altered 384-well assay conditions would demonstrate active cell proliferation throughout the 96 h cell incubation period and minimize the tissue culture burden. We employed a process that we previously used to develop 384-well growth inhibition assays in melanoma, prostate cancer, and head and neck cancer cell lines using the homogenous CTG detection reagent to measure cellular ATP levels.19,20,34–36 We conducted two independent cell seeding density experiments in each of the 60 cell lines to select suitable cell seeding densities for the 96 h 384-well proliferation assays (
Fig. 1
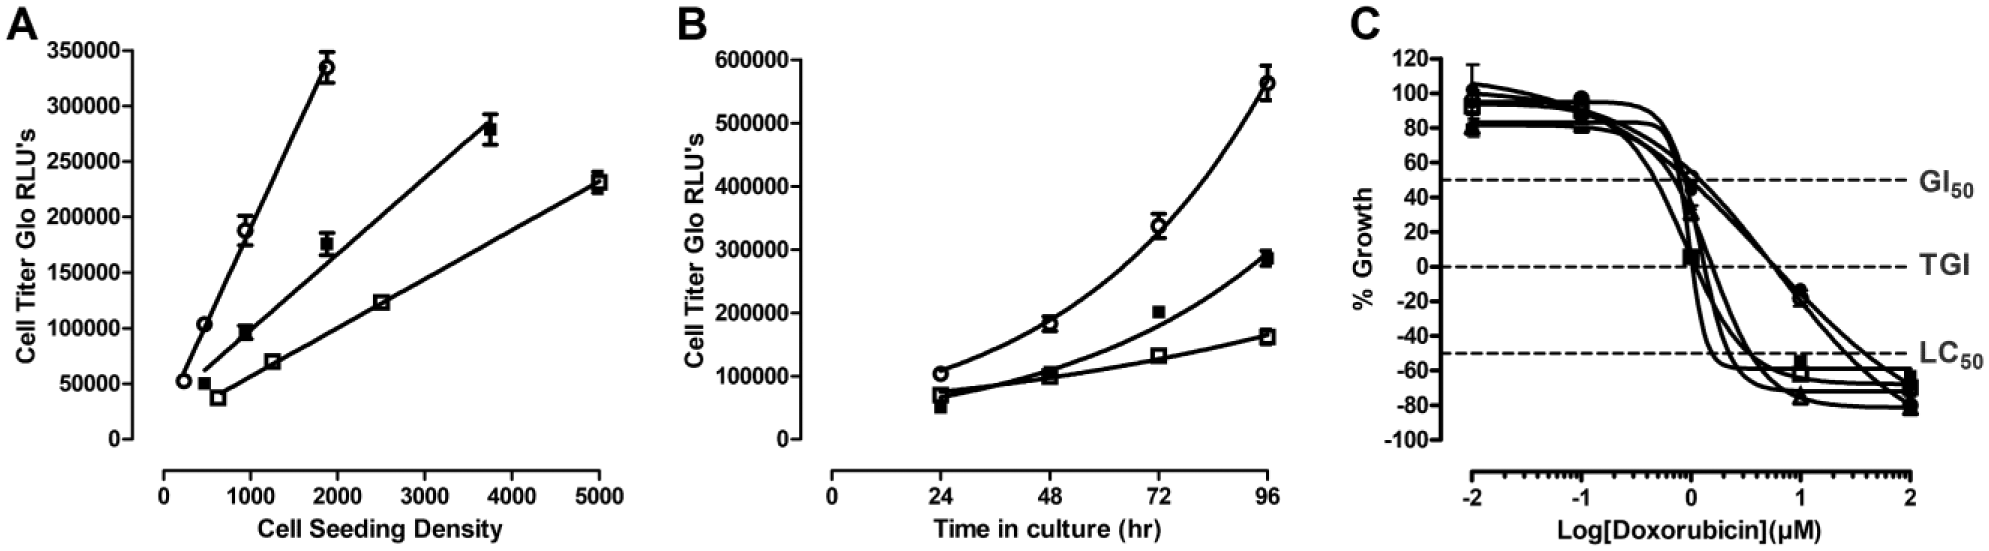
Reformatting the NCI-60 cancer cell line growth inhibition assays into 384-well CTG format. (
NCI-60 Cell Line 384-Well Assay Development HTS Performance Statistics.
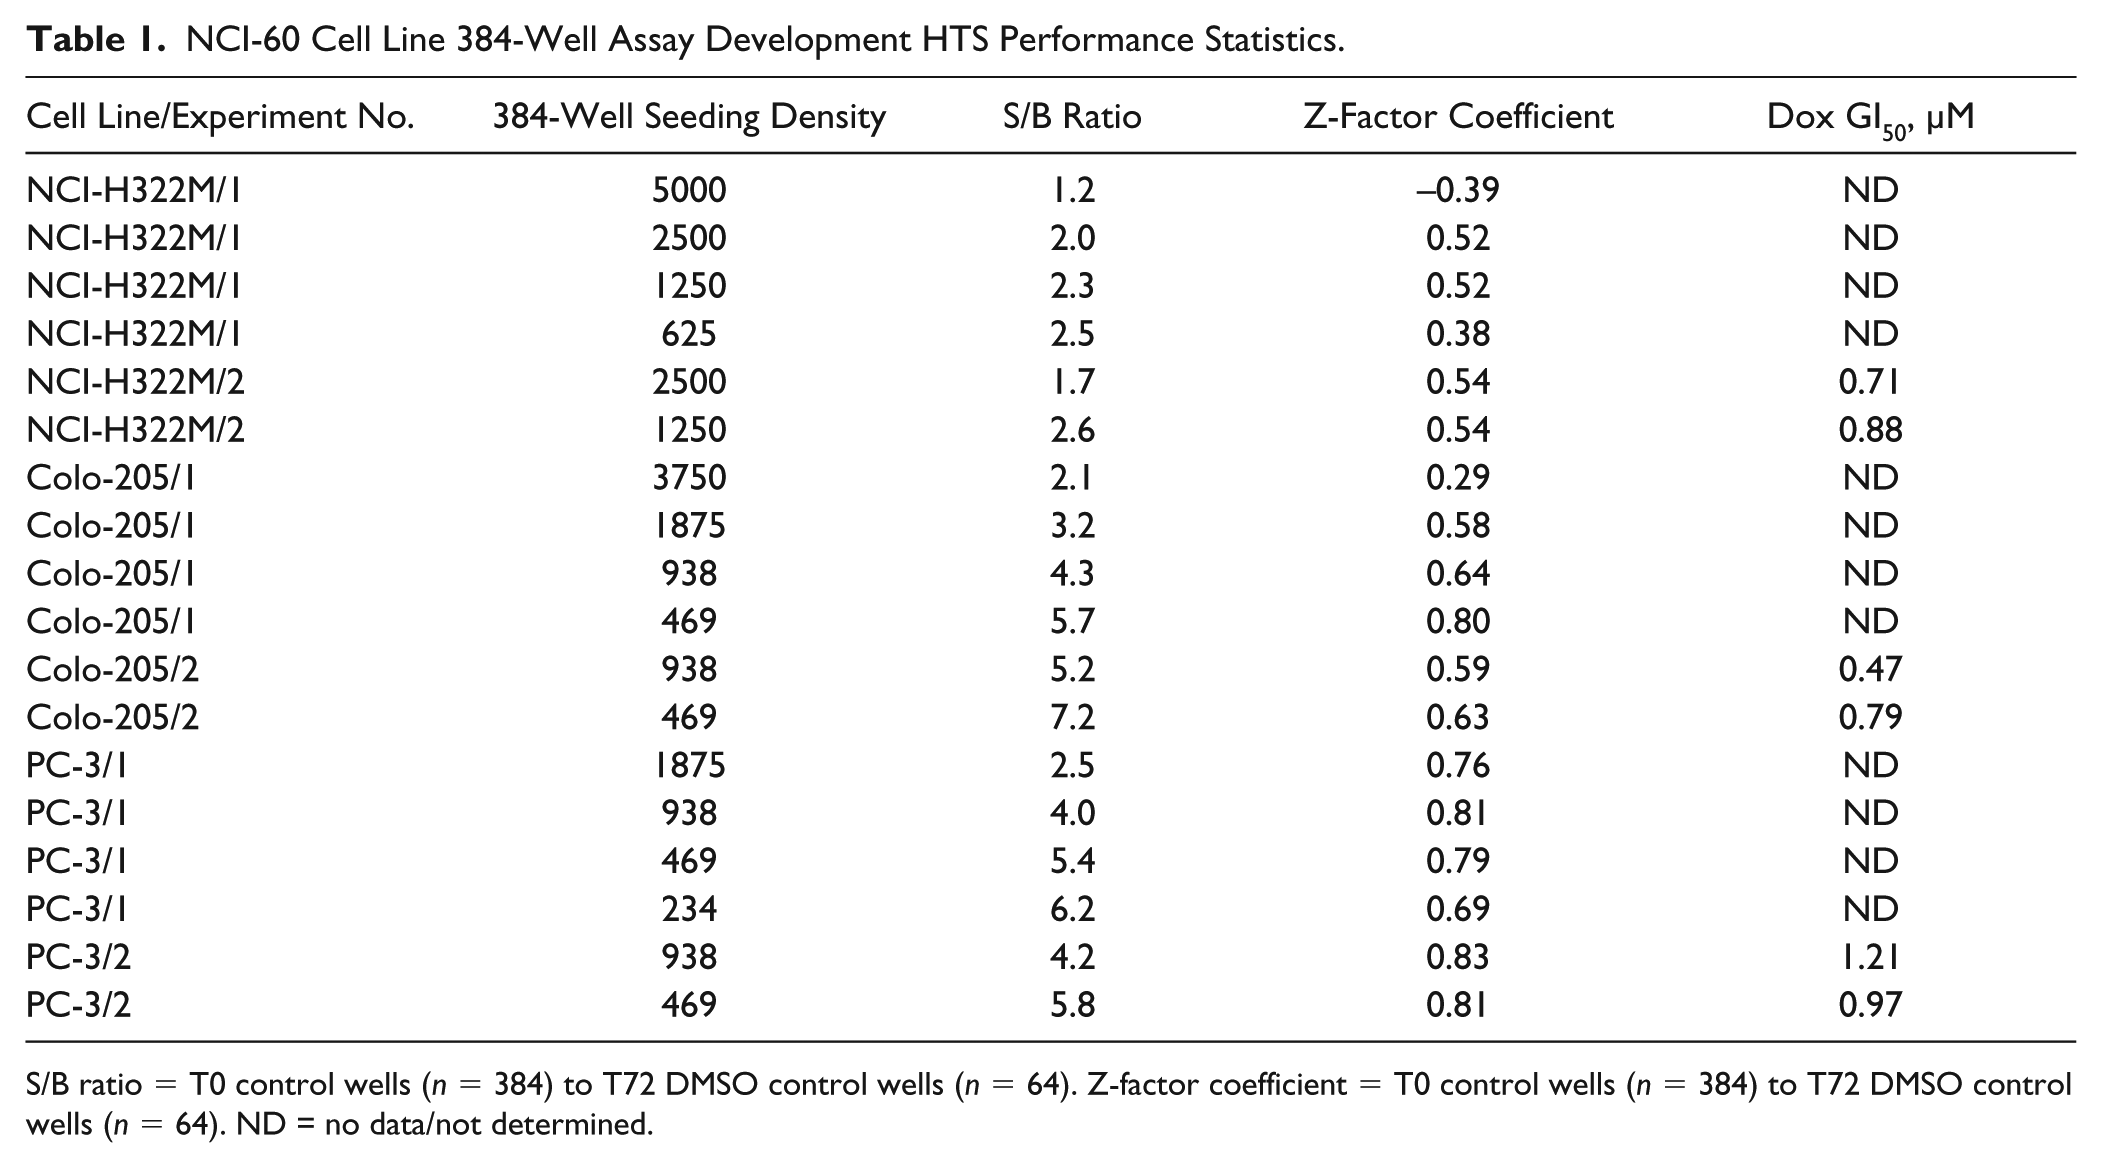
S/B ratio = T0 control wells (n = 384) to T72 DMSO control wells (n = 64). Z-factor coefficient = T0 control wells (n = 384) to T72 DMSO control wells (n = 64). ND = no data/not determined.
Validation of the 384-Well NCI-60 Cell Line Growth Inhibition Assays
To further validate the NCI-60 384-well growth inhibition assay format, we conducted GI50 determinations across the 60 cell lines with 20 drugs selected for the pilot phase of the DC HTS (
Fig. 2
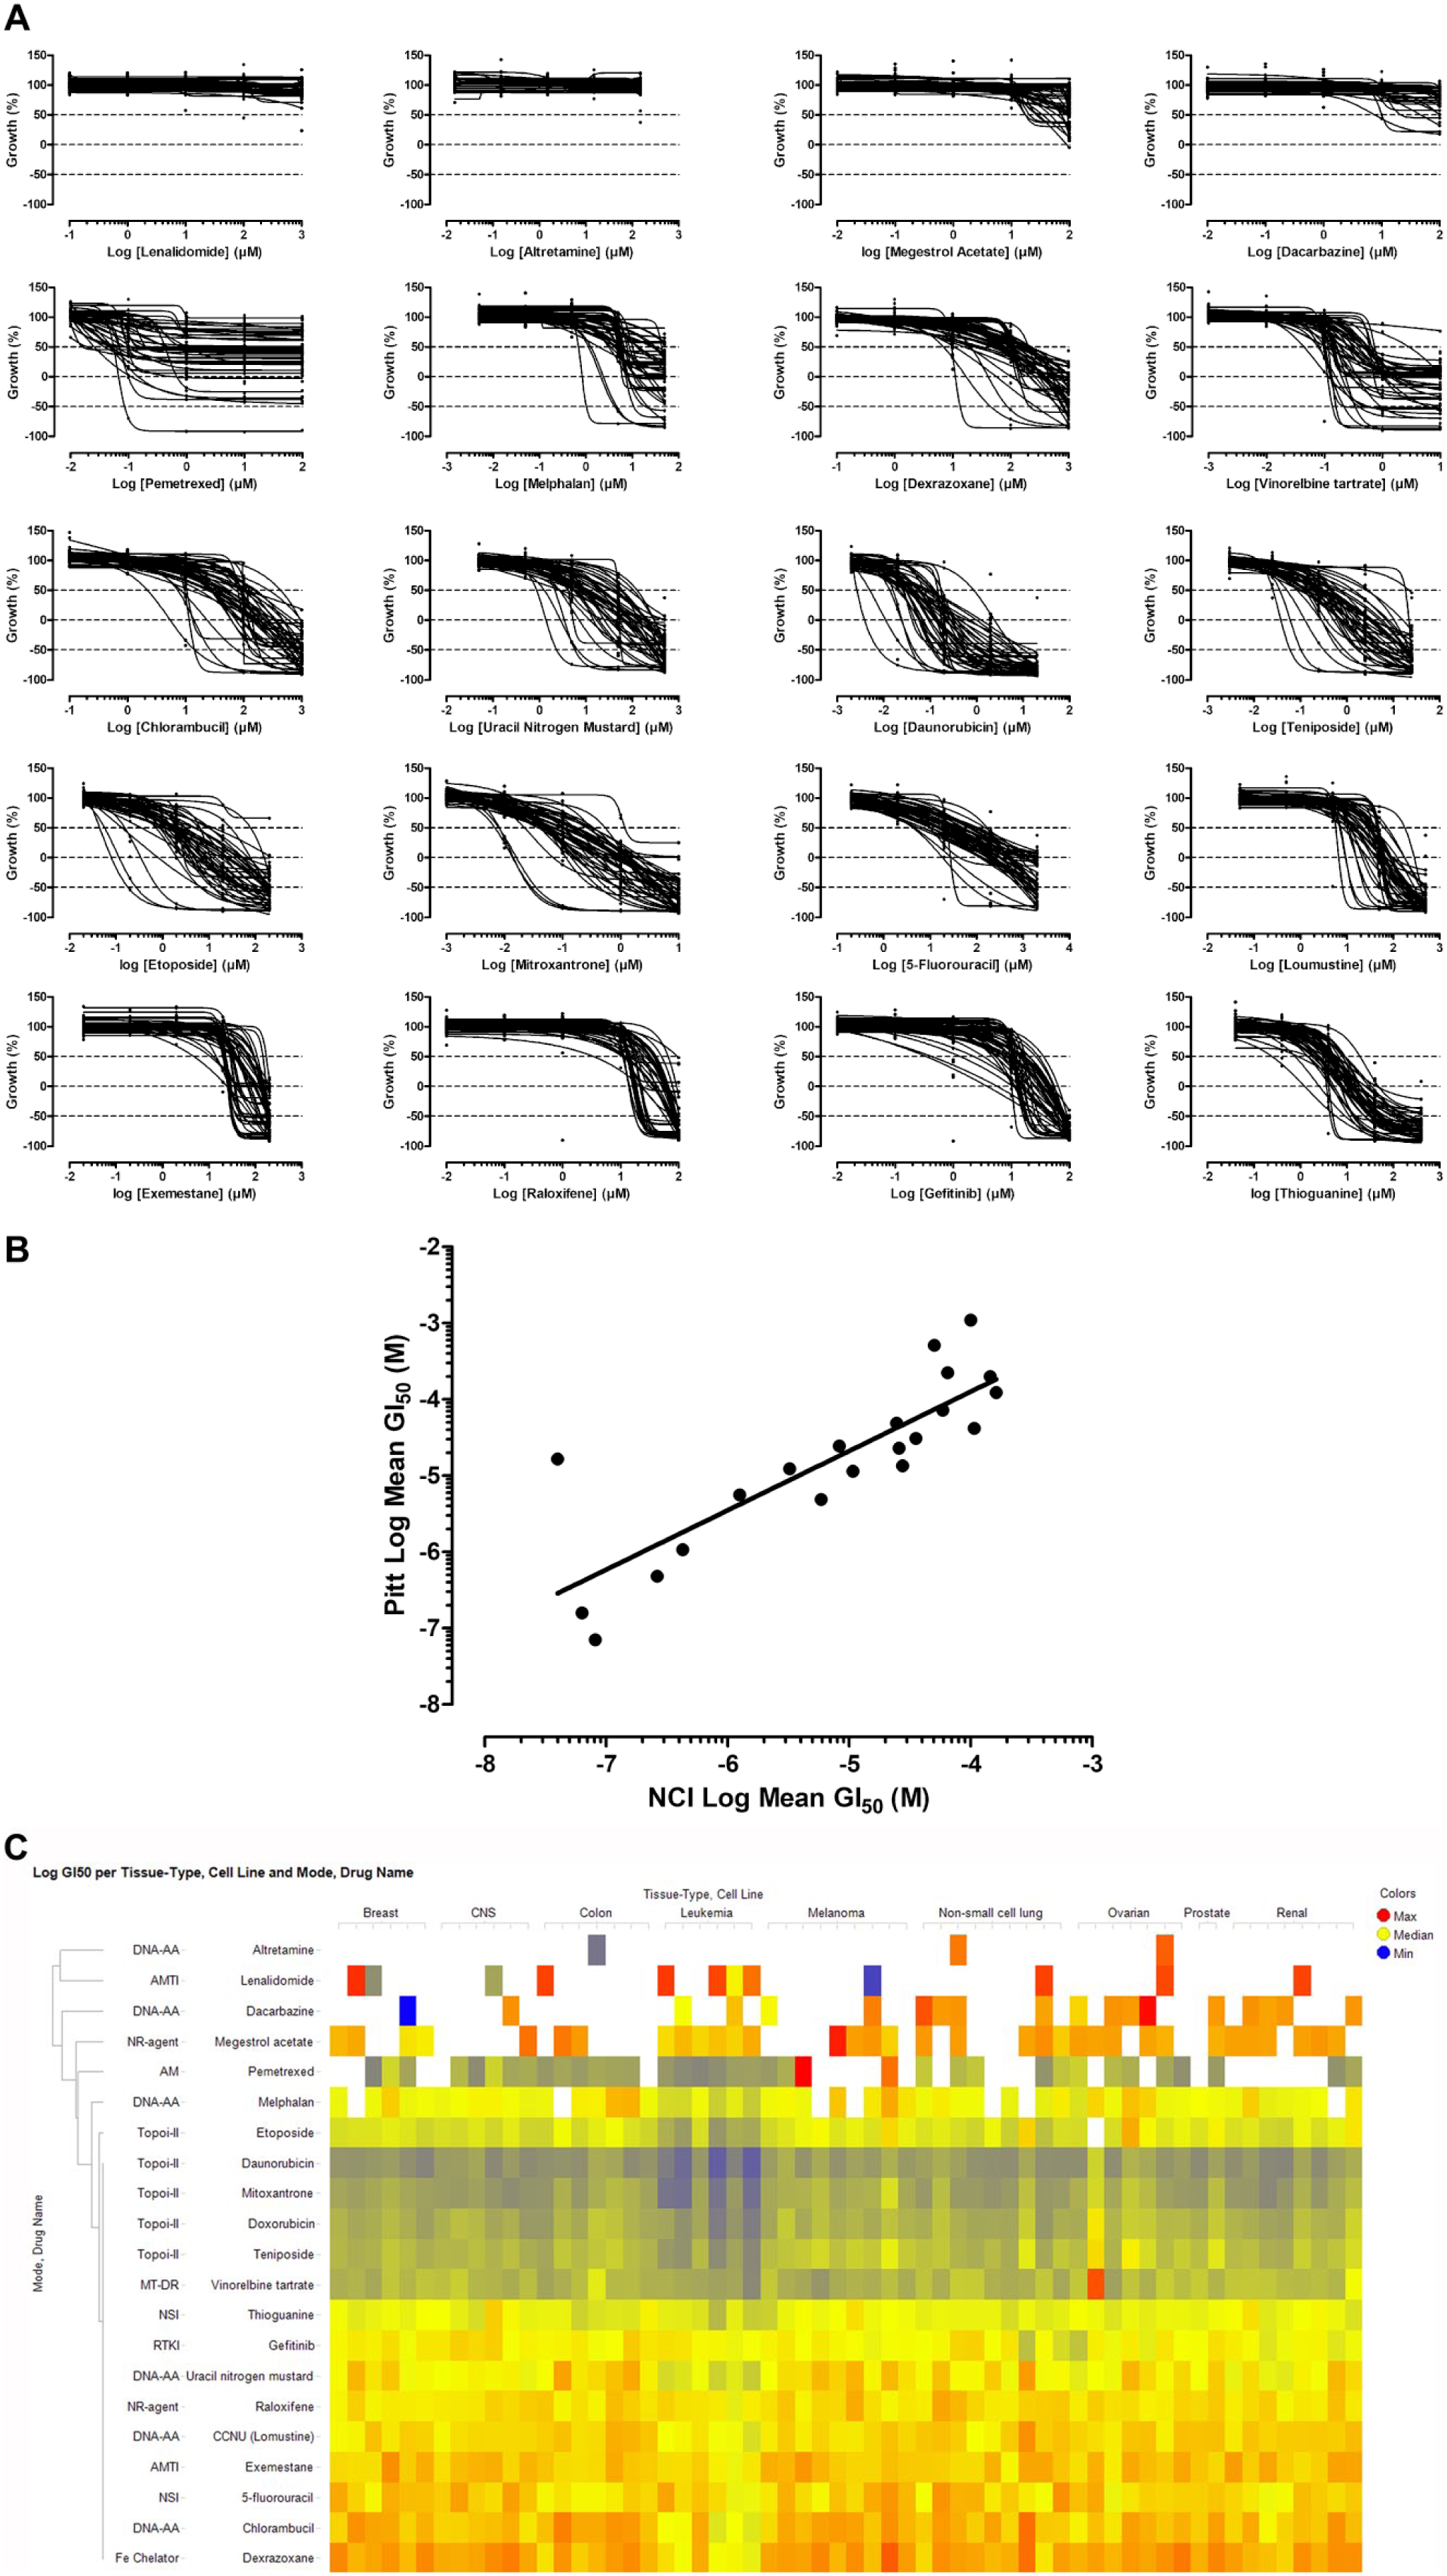
Validation of the 384-well NCI-60 cell line growth inhibition assays. (
DC Pilot HTS: Anticancer Agents, Mode of Action, and DCM Concentrations.
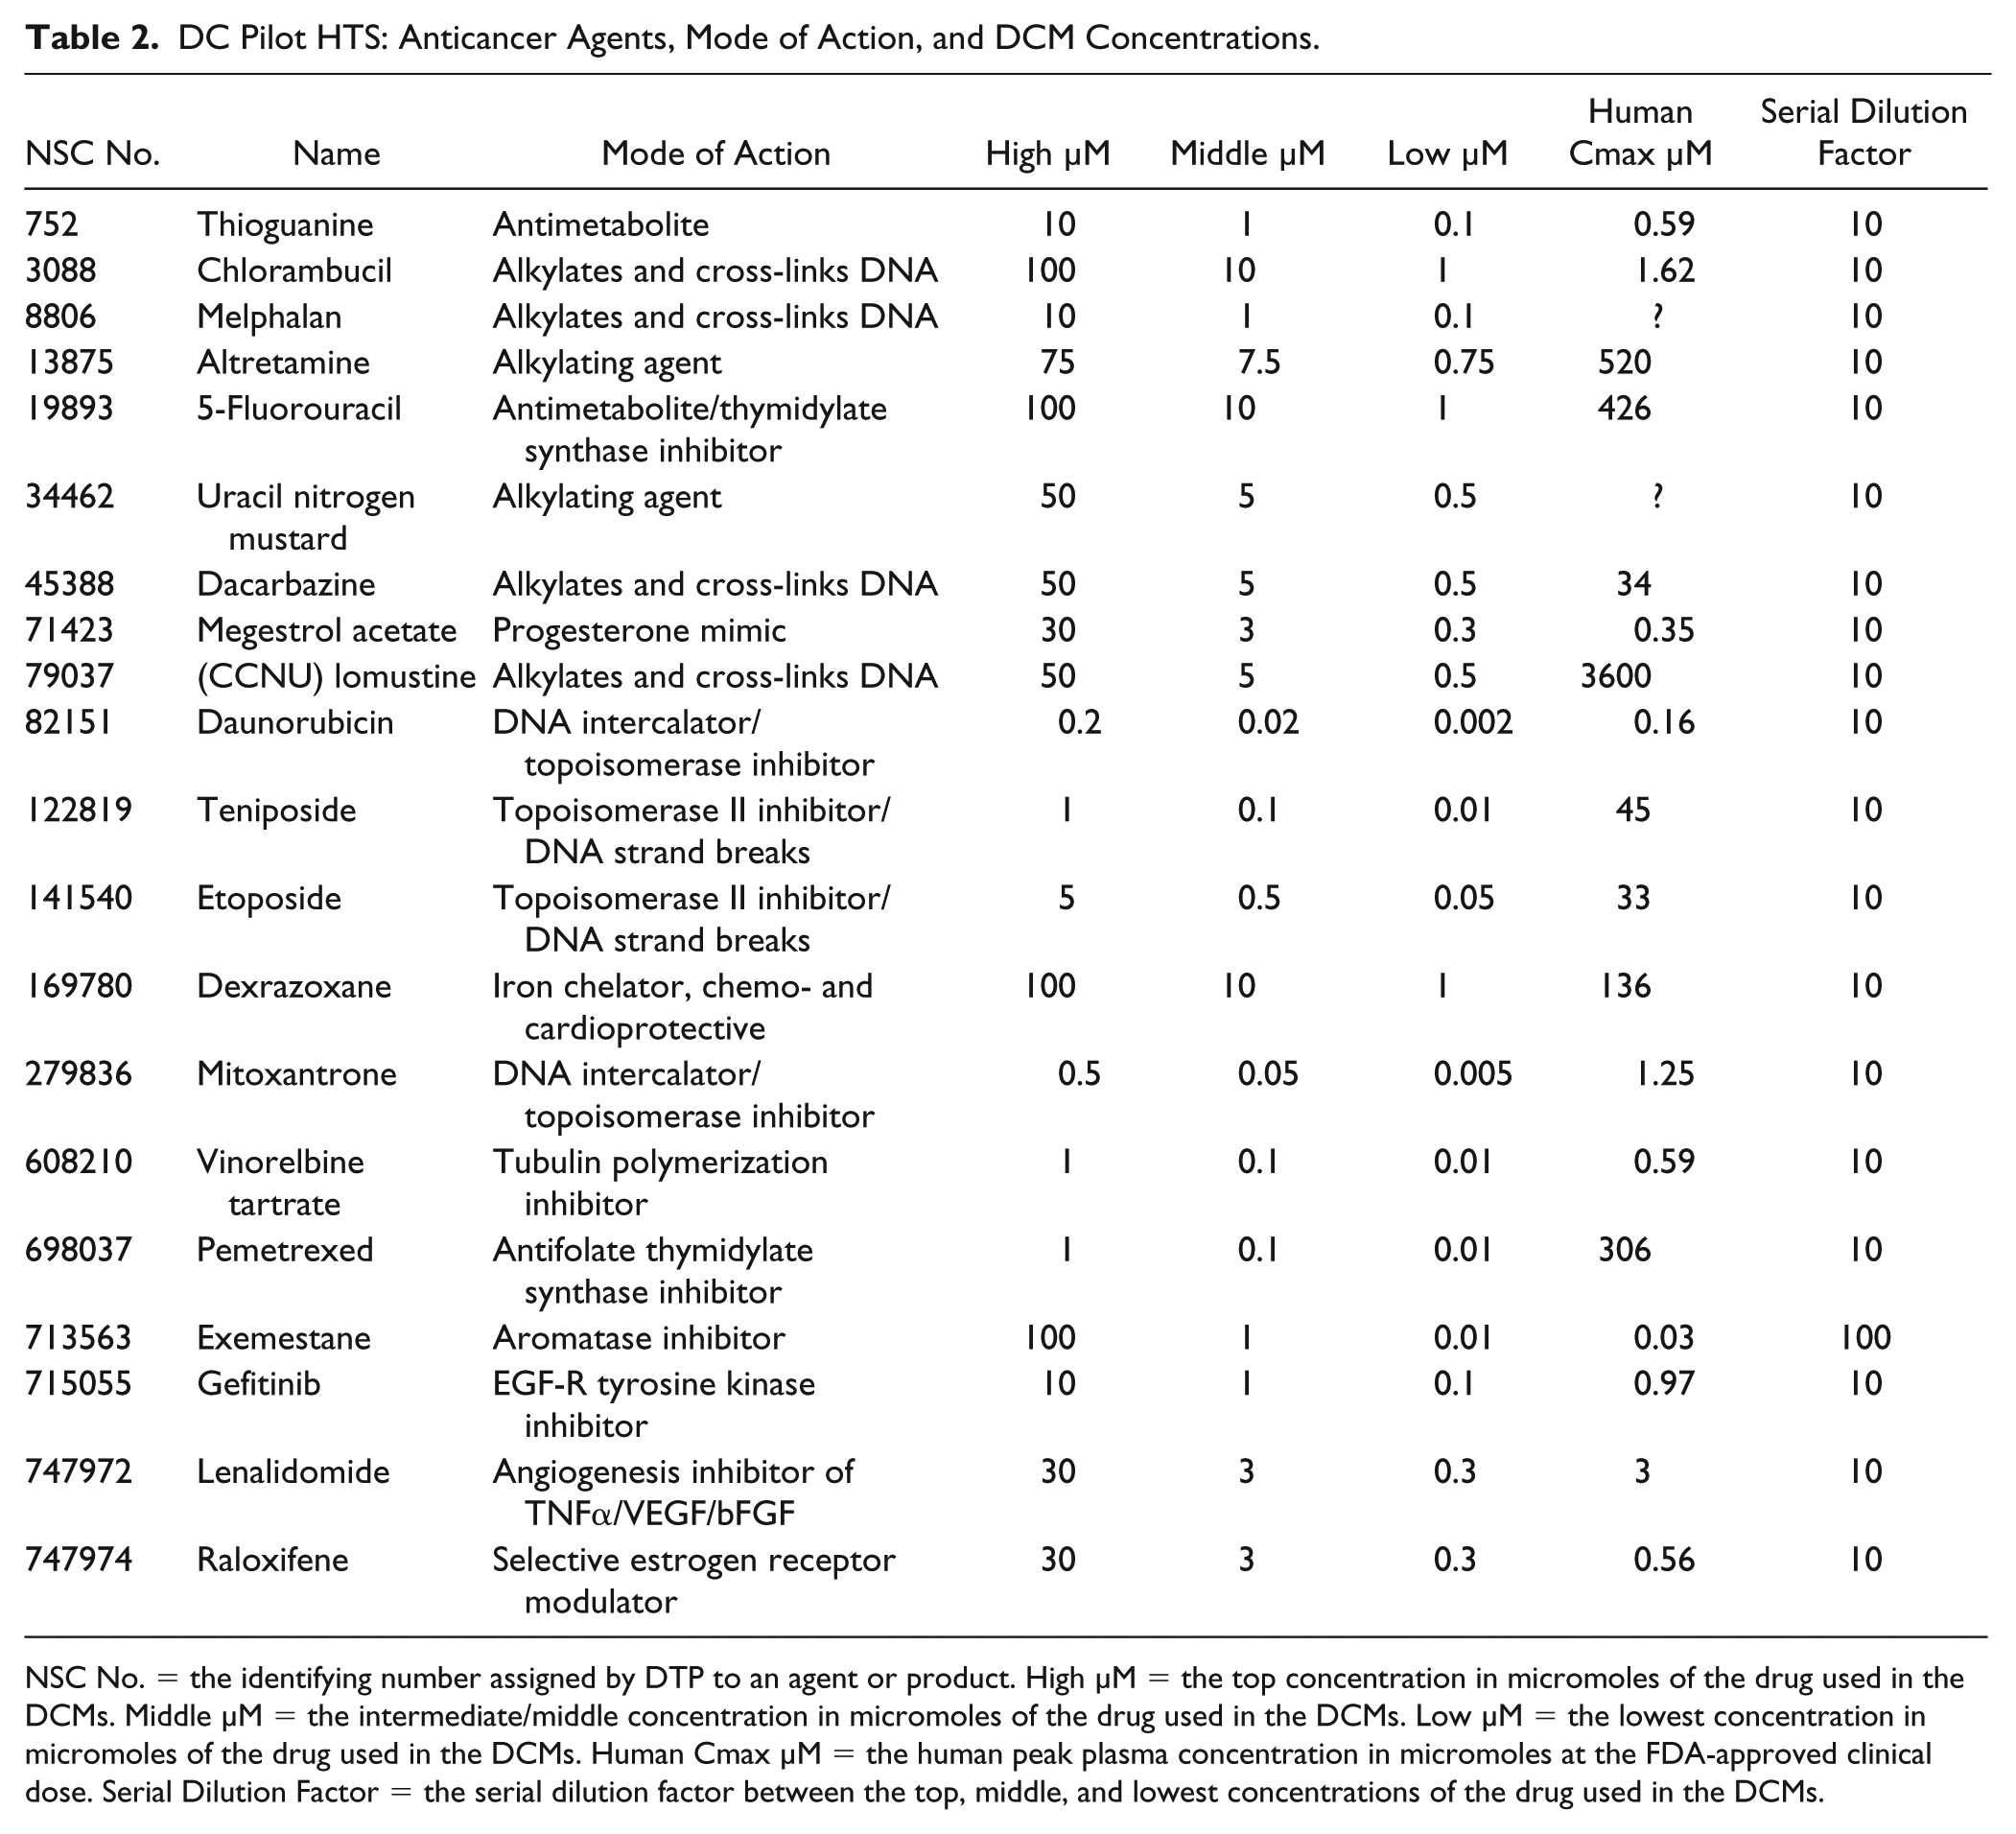
NSC No. = the identifying number assigned by DTP to an agent or product. High µM = the top concentration in micromoles of the drug used in the DCMs. Middle µM = the intermediate/middle concentration in micromoles of the drug used in the DCMs. Low µM = the lowest concentration in micromoles of the drug used in the DCMs. Human Cmax µM = the human peak plasma concentration in micromoles at the FDA-approved clinical dose. Serial Dilution Factor = the serial dilution factor between the top, middle, and lowest concentrations of the drug used in the DCMs.
DCM 384-Well Plate Layout
On each 384-well assay plate, 20 4 × 4 DCMs were arrayed in columns 3–22 together with DMSO (0.2%) controls in columns 1, 2, 23, and 24, and a 5-point 10-fold serial dilution Dox GI50 curve arrayed in quadruplicate wells in columns 23 and 24 ( Fig. 3A ). Including the DMSO control well in each DCM, there were a total of 64× DMSO control wells on each plate. Each individual DCM included 3 × 3 DC wells (9 total) together with 3 wells (6 total) containing each of the corresponding individual drug concentrations, and 1 DMSO control well ( Fig. 3B ). The three drug concentrations in the DCMs were selected based on the response profiles produced in the individual GI50 determinations and their clinical relevance. If a single-agent concentration produces too much growth inhibition by itself, then there is little or no ability to detect a DC effect. A top concentration was selected that achieved ⩽30% growth inhibition in the majority (⩾70%) of NCI-60 cell lines. Where possible, concentrations were selected to be within the range of the human peak plasma concentration (Cmax) at the FDA-approved clinical dose ( Table 2 ). In most cases, the middle and low drug concentrations represent 10-fold serial dilutions of the top concentration in the DCM, and this helped to ensure that even the most sensitive lines had at least two concentrations where growth was not highly inhibited. Table 2 shows the high, middle, and low concentrations that were selected for the 20 drugs and 190 DCMs that were screened in the pilot-phase DC HTS.
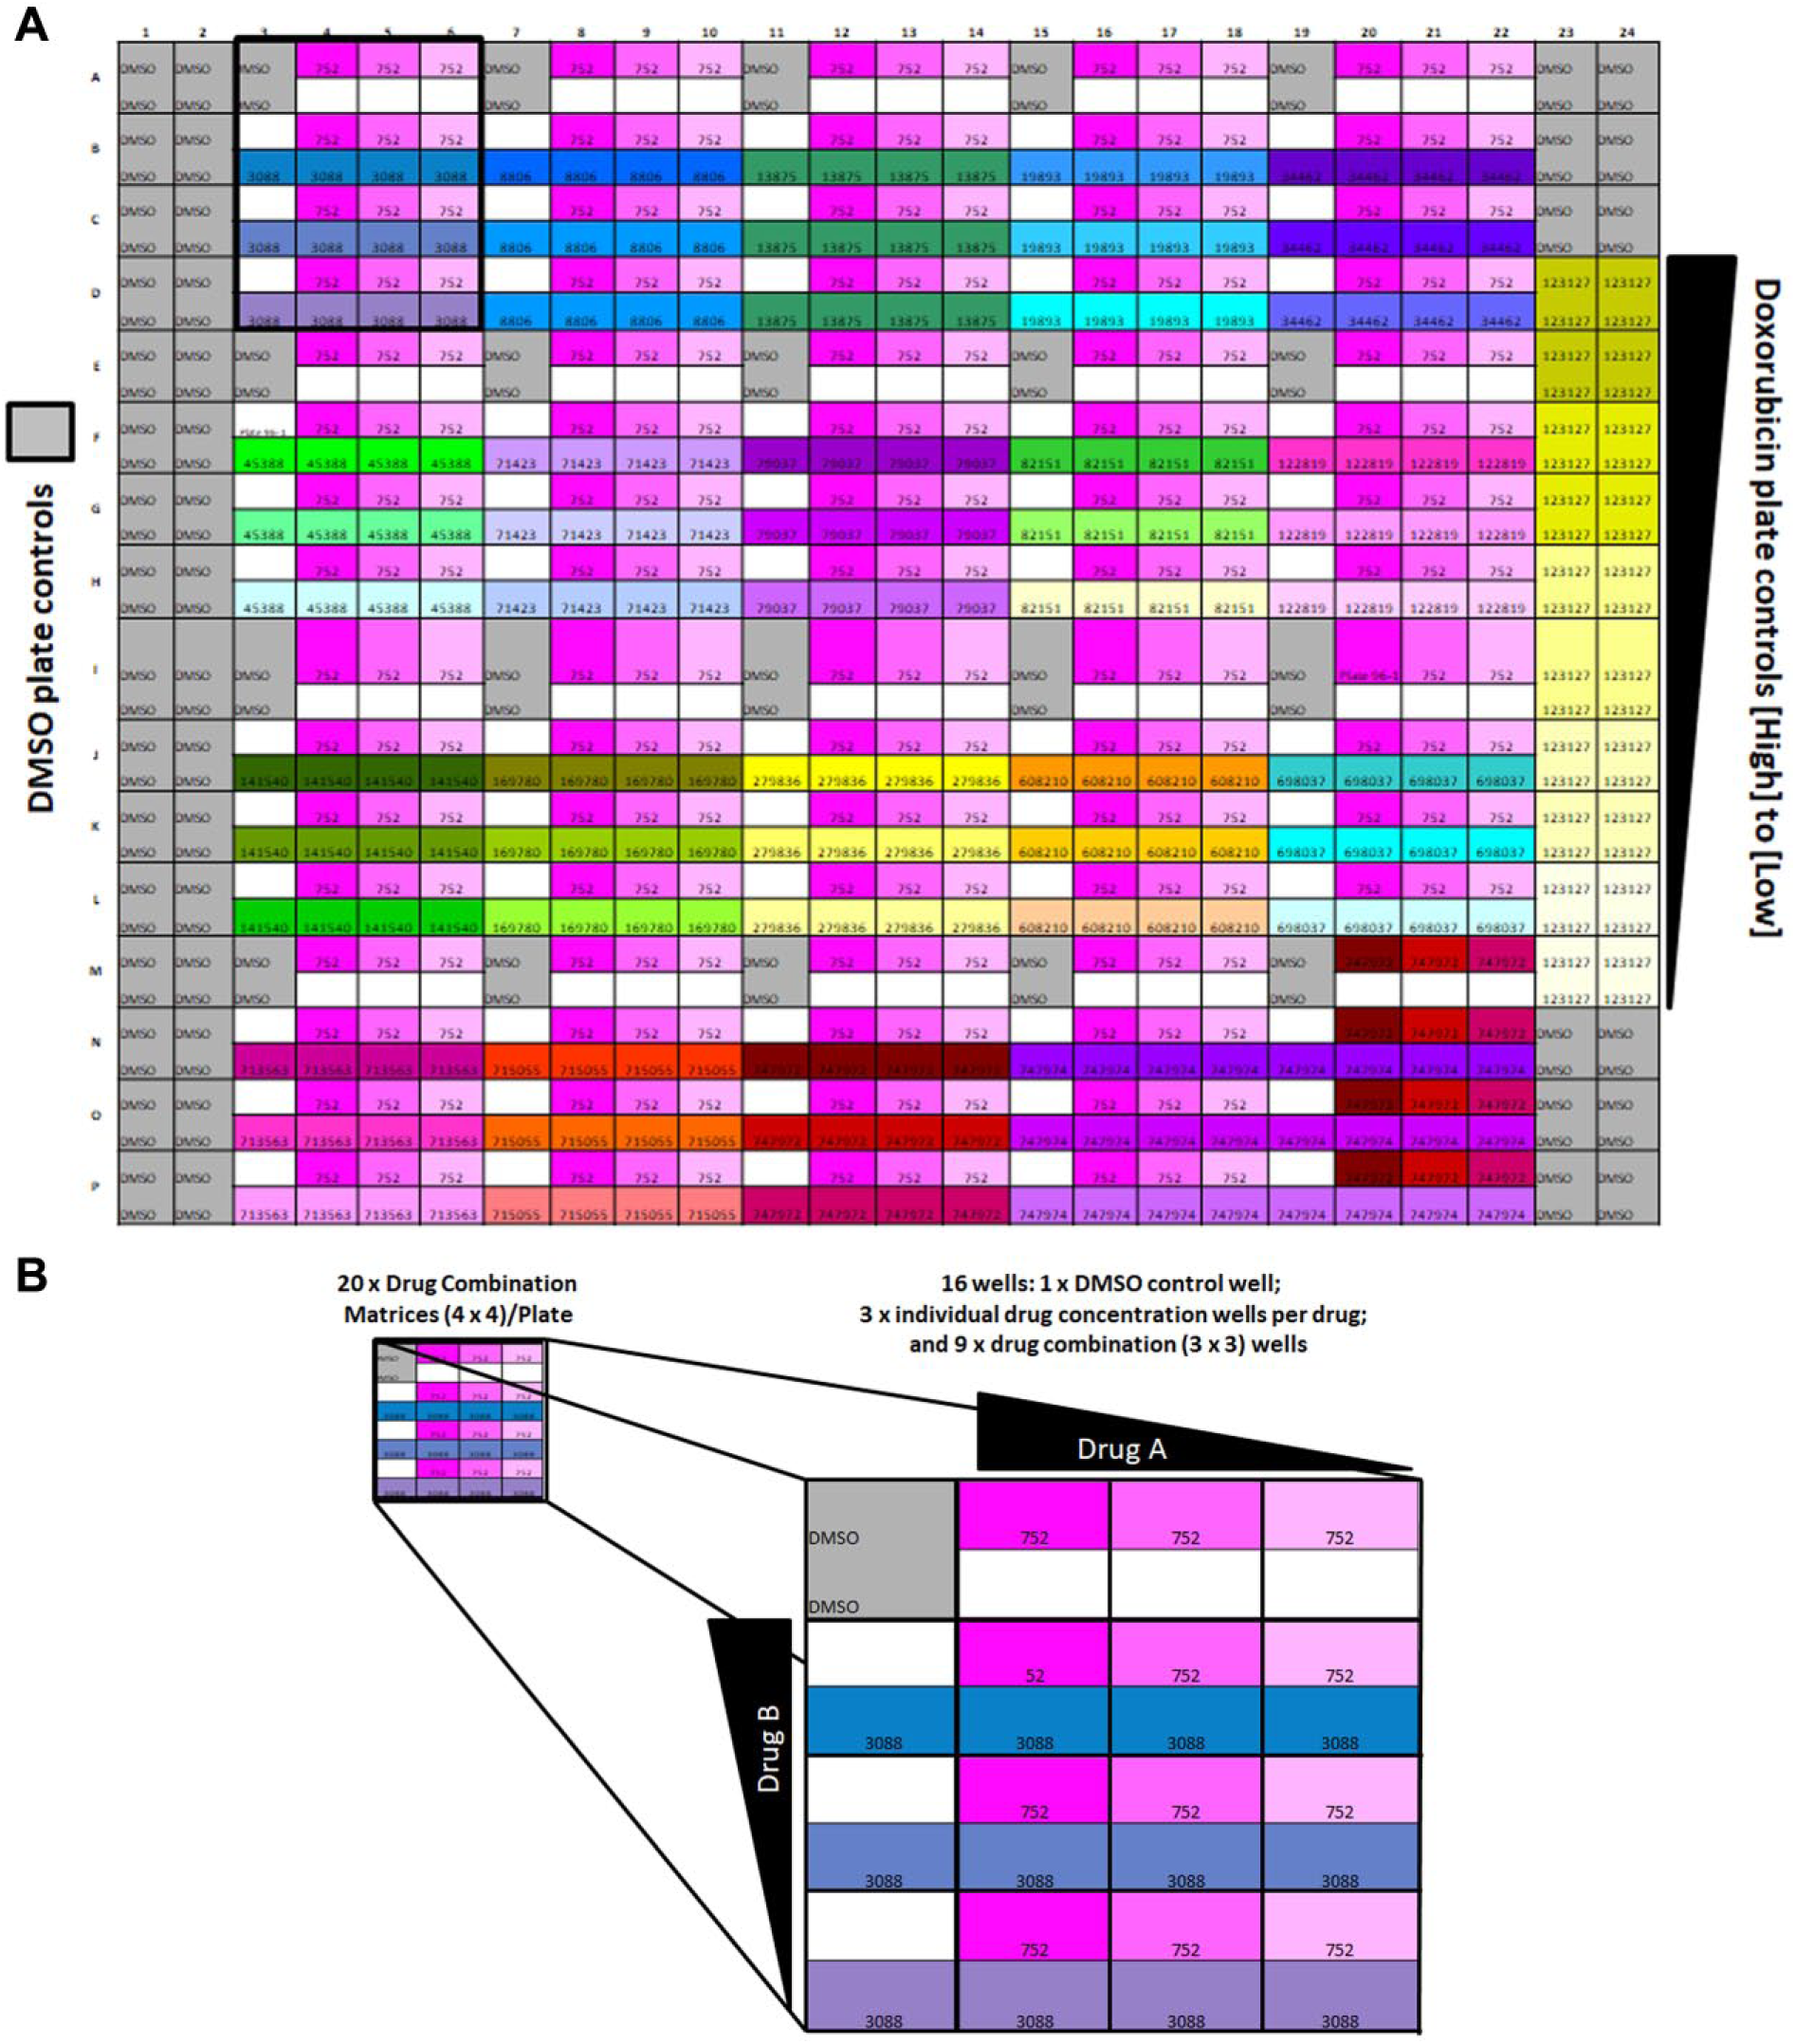
384-well DC plate layout. (
DCM HTS Implementation
On most days of DC HTS operations, 10 NCI-60 cell lines were screened against 10 DC replica daughter plates in 100× 384-well assay plates. The pilot-phase DC HTS was completed in 6 days of HTS operations while the first and second production phases were accomplished in 42 and 30 days of operations, respectively. In the pilot phase of the DC HTS, 190 individual 4 × 4 DCMs made from all possible pairwise combinations of 20 drugs were arrayed as 11,400 DCMs on 600× 384-well assay plates to generate 230,400 data points, including plate controls. In production phase I, the 20 pilot-phase drugs were screened in combination with 72 other drugs in 1440 individual 4 × 4 DCMs arrayed on 4320× 384-well assay plates, and the 86,400 DCMs and controls produced 1,658,880 data points. In the second production phase, 10 drugs were screened in combination with 99 drugs from the previous phases in 990 individual 4 × 4 DCMs arrayed on 3000× 384-well assay plates and the 59,400 DCMs and controls generated 1,152,000 data points.
DCM HTS QC Data Review
Figure 4
shows the HTS assay performance statistics and QC data for the three representative NCI-60 cell lines with slow, medium, and fast growth phenotypes that were used to illustrate the assay development process (
Fig. 1
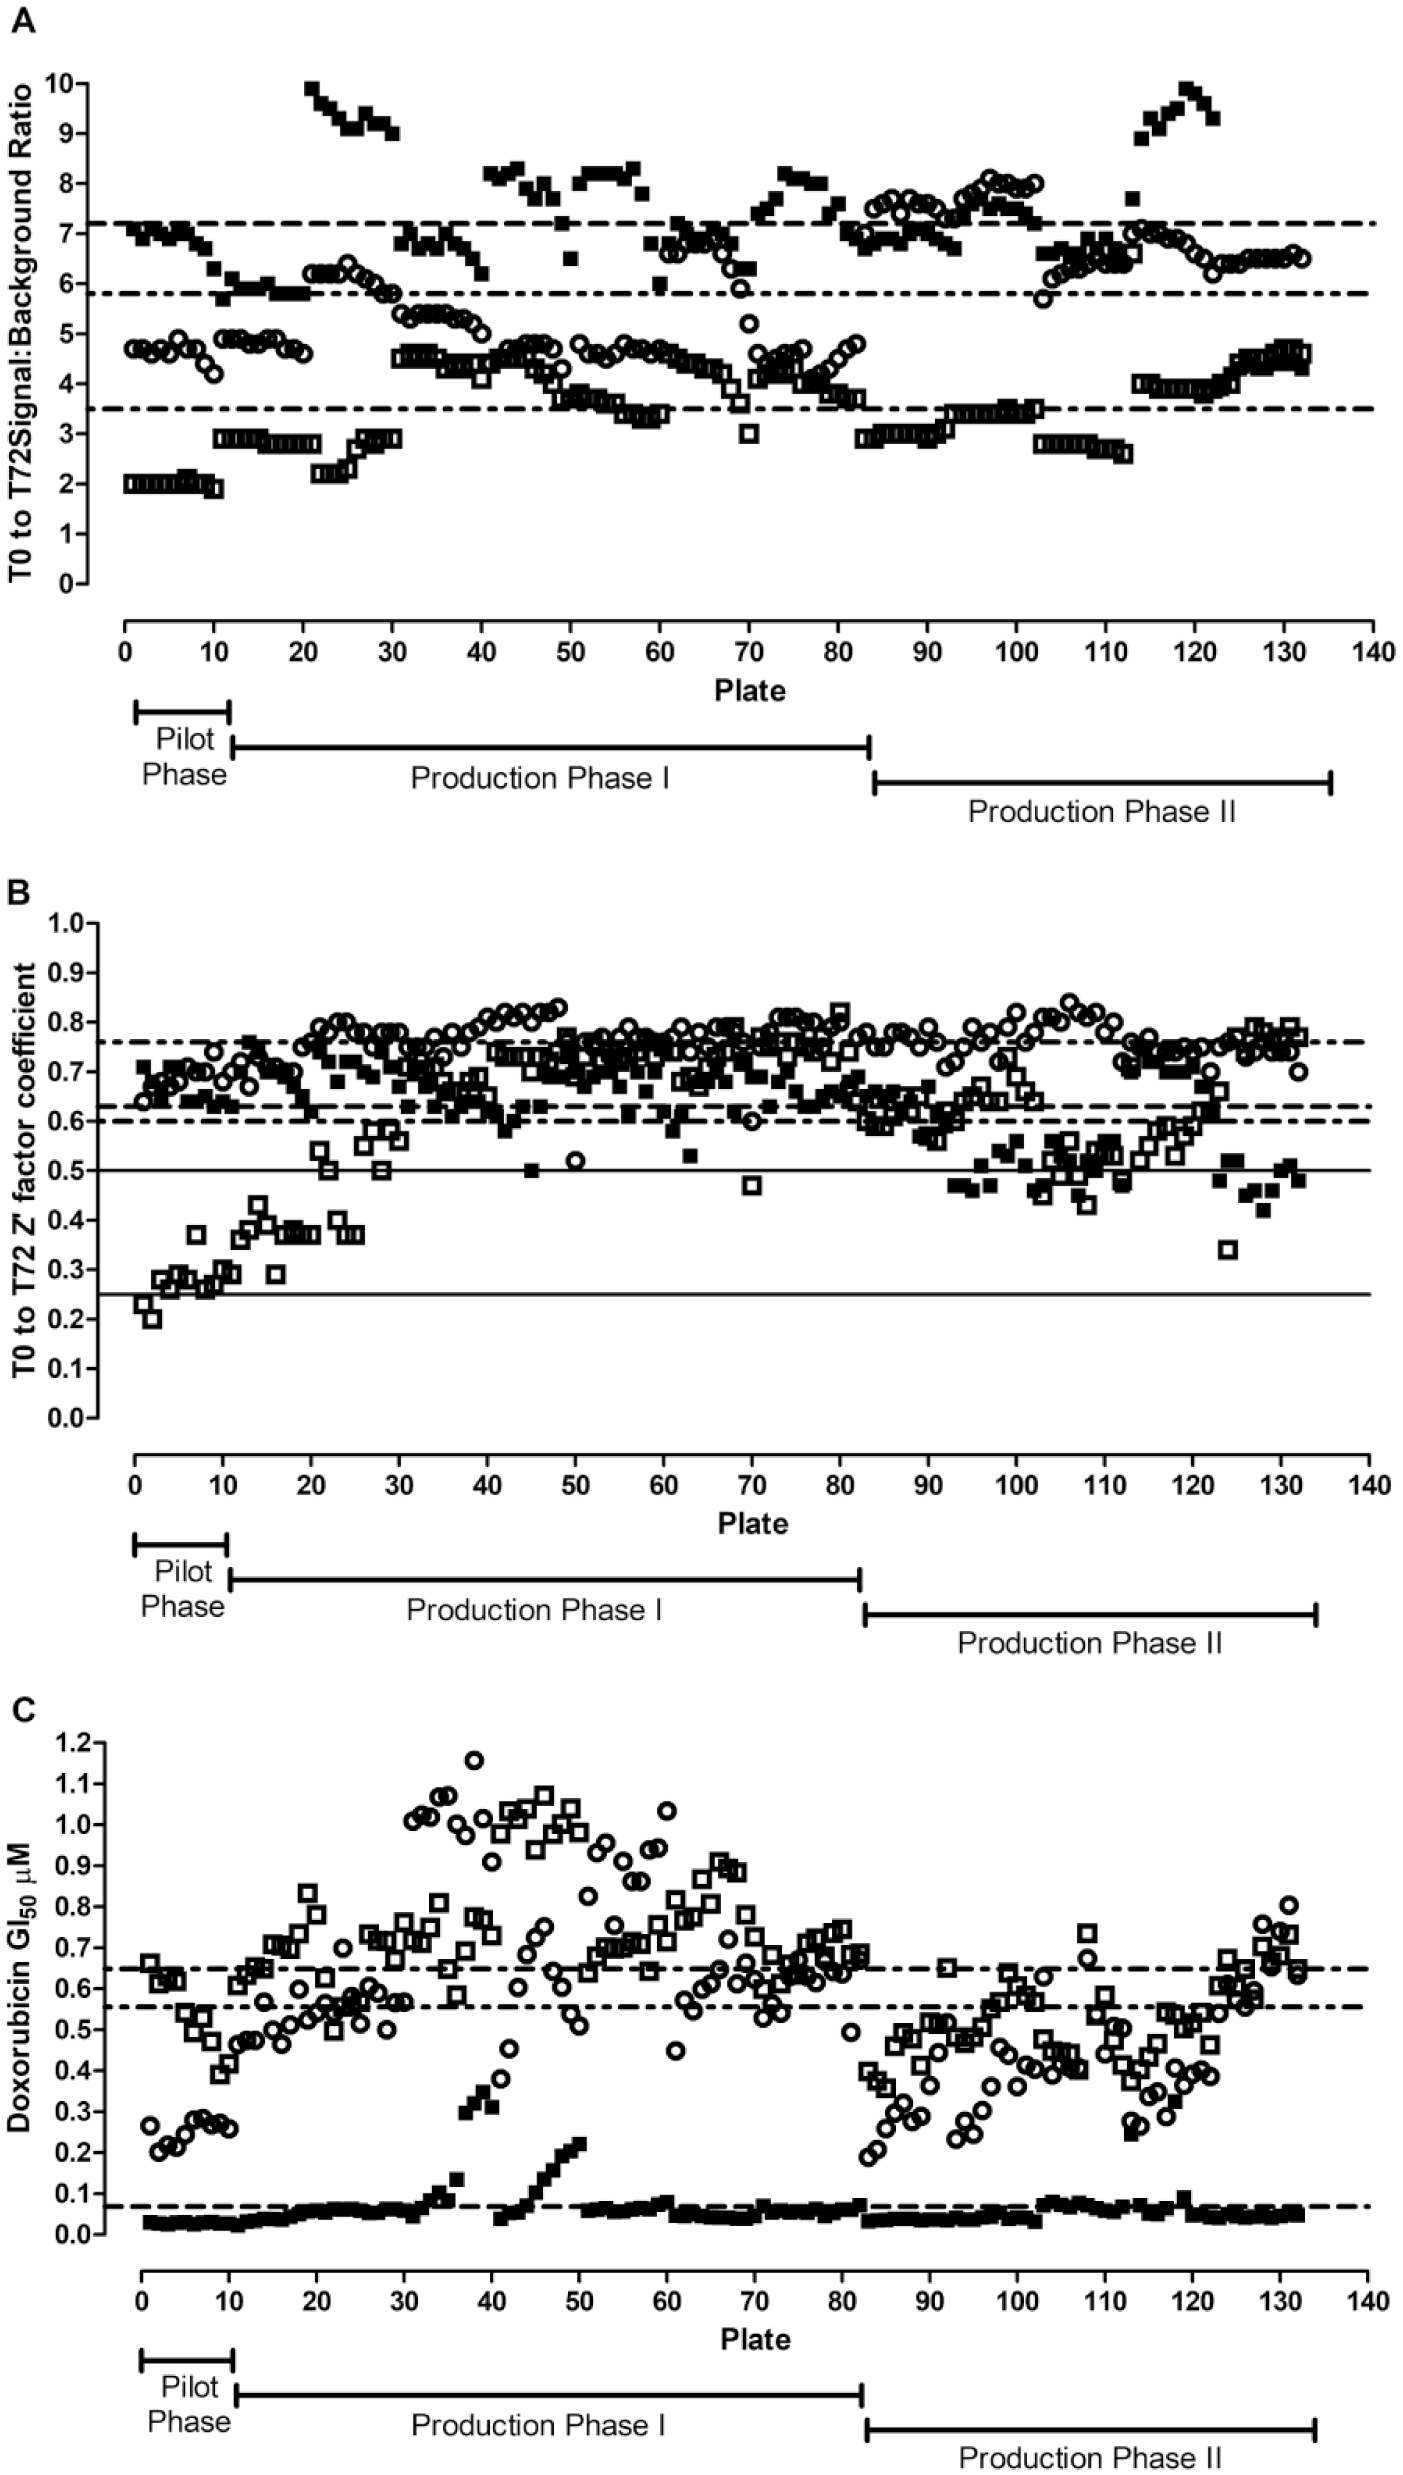
DC HTS assay performance QC statistics. The PG for the DC HTS campaign was calculated using the T0 and T72 DMSO control wells and the standard NCI-60 protocol as described in the Materials and Methods section. To monitor assay performance, for each assay plate the T0 (n = 384) and T72 (n = 64) DMSO control wells were used for calculation. (
Pilot DC HTS Results
Figure 5A shows a heatmap of the DI scores for the 190× DCMs in the NCI-60 pilot DC HTS. Cell lines are grouped by tumor tissue type on the Y axis, and the DCM number is on the X axis. DI scores were used to flag whether the two drugs in a DCM were interacting synergistically (DI scores >3, green), were interacting antagonistically (DI scores < –3, red), or were additive (–3 < DI < 3, blue). In the pilot DC HTS, 1366 (1.3%) out of 102,600 DC wells produced DI scores >3, and their drug interactions were flagged synergistic. The NCI-60 cell line panel comprises nine distinct cancer lineages with six to nine cell lines from each tumor type, except for prostate cancer, which is only represented by two cell lines. When grouped by tumor tissue type, the number of DI scores >3 was close to the average of 152 for five of the nine tumor lineages, with colon and melanoma exhibiting ~33% and 100% higher than the average, and ovarian and prostate producing ~50% and ~66% lower than the average ( Fig. 5B ). In the individual cell lines, the mean number of DI scores >3 was 23. A z-score analysis of the distribution of DI scores >3 in the individual cell lines indicated that 54 (90%) of the cell lines were within 1 SD of the mean (z scores between –1 and 1), and only six cell lines produced z scores between 1.4 and 3.7 ( Fig. 5C ): two colon cancer cell lines, KM12 and SW-620; one leukemia cell line, MOLT-4; and three melanoma cell lines, M14, MDA-MB-435, and UACC-62. Based on Figure 5B , C , there does not appear to be an obvious tissue type or cell line bias in the distribution of DI scores >3 in the NCI-60 DC pilot HTS. With respect to DCMs, 38 (20%) of the 190 DCMs failed to produce a single DC well with a DI score >3. A z-score analysis of the distribution of DI scores >3 in the remaining 152 individual DCMs produced an average of 9 per DCM and demonstrated that 11 (5.8%) DCMs produced z scores between 1.6 and 4.7 and accounted for 54% of DI scores >3 ( Fig. 5D ). Furthermore, the 11 DCMs were formed between a small number of interacting drugs, each participating in three or four of the DCMs: megestrol acetate, mitoxantrone, vinorelbine tartrate, raloxifene, gefitinib, and daunorubicin. These data indicate that a DCM bias exists in the distribution of DI scores >3 in the NCI-60 DC pilot HTS.
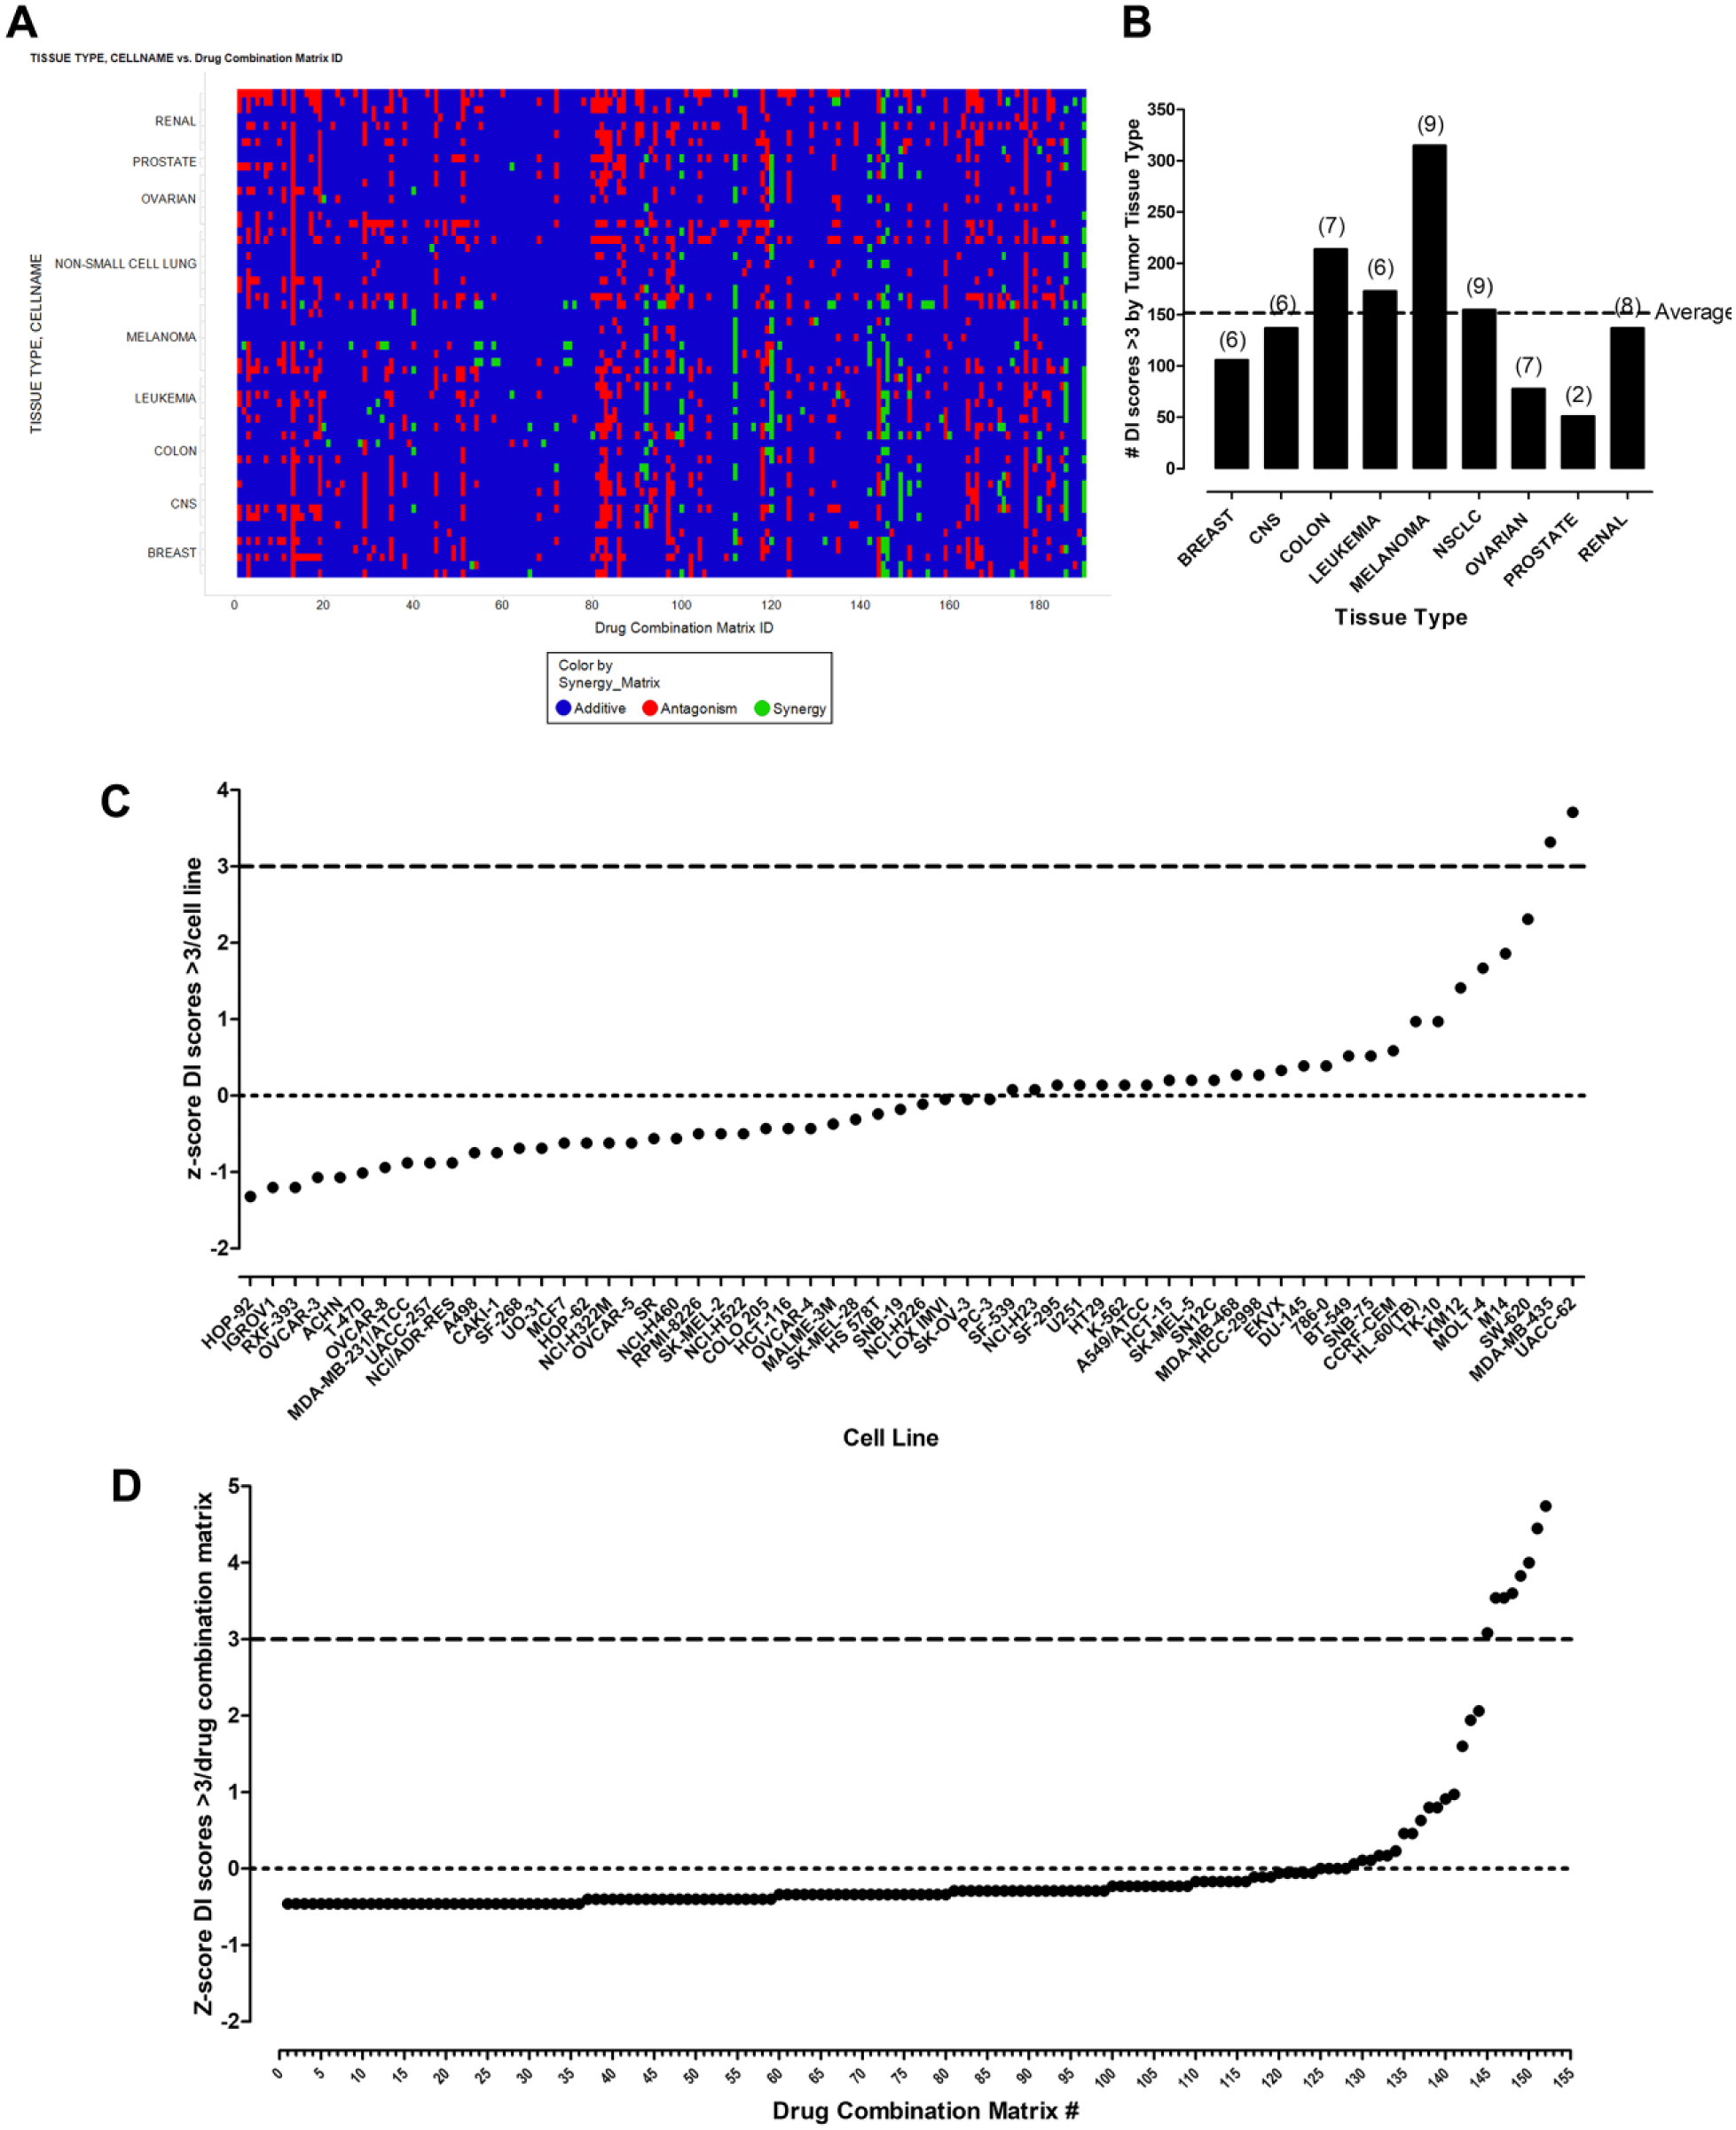
DC pilot HTS results. (
Confirmation of Synergistic Drug Interactions Flagged in the Pilot DC HTS
We selected a single DCM example with DC wells that had produced DI scores >3 to illustrate the process to confirm synergistic drug interactions flagged in the DC HTS. Three of the DC wells in DCM 12 between the vinca-alkaloid microtubule assembly inhibitor vinorelbine (Navelbine) tartrate and the EGF-R tyrosine kinase inhibitor gefitinib (Iressa) produced DI scores >3 in the SK-MEL-5 melanoma cell line ( Fig. 6A ). Individual drug control wells from DCM 12 match up well with the replicate data from other DCMs, and the small error bars indicate the reproducibility of the HTS data. The DC wells of 0.1 µM vinorelbine tartrate in combination with all three gefitinib concentrations (A2-B1, A2-B2, or A2-B3) had a greater than additive effect on SK-MEL-5 PG. To confirm the synergistic interactions between vinorelbine and gefitinib in SK-MEL-5 cells, we prepared a more extensive 10 × 10 DCM between the two drugs and analyzed the growth inhibition/fraction of SK-MEL-5 cells affected using the COMUSYN software to calculate CI scores ( Fig. 6B ). For fixed DC ratios of gefitinib/vinorelbine of 20:1 and 10:1, most of the CI scores were <1.0, confirming that the two drugs interacted synergistically. We also plotted the data as an isobologram contour graph ( Fig. 6C ) and used the pharmacodynamic drug interaction model to fit the experimental data and construct a three-dimensional (3D) graph of the data ( Fig. 6D ). The synergistic interaction between gefitinib and vinorelbine was also confirmed by the concave contour lines of the isobologram plot, and because the fitted α parameter of the pharmacodynamic drug interaction model was 0.77 and therefore >0.
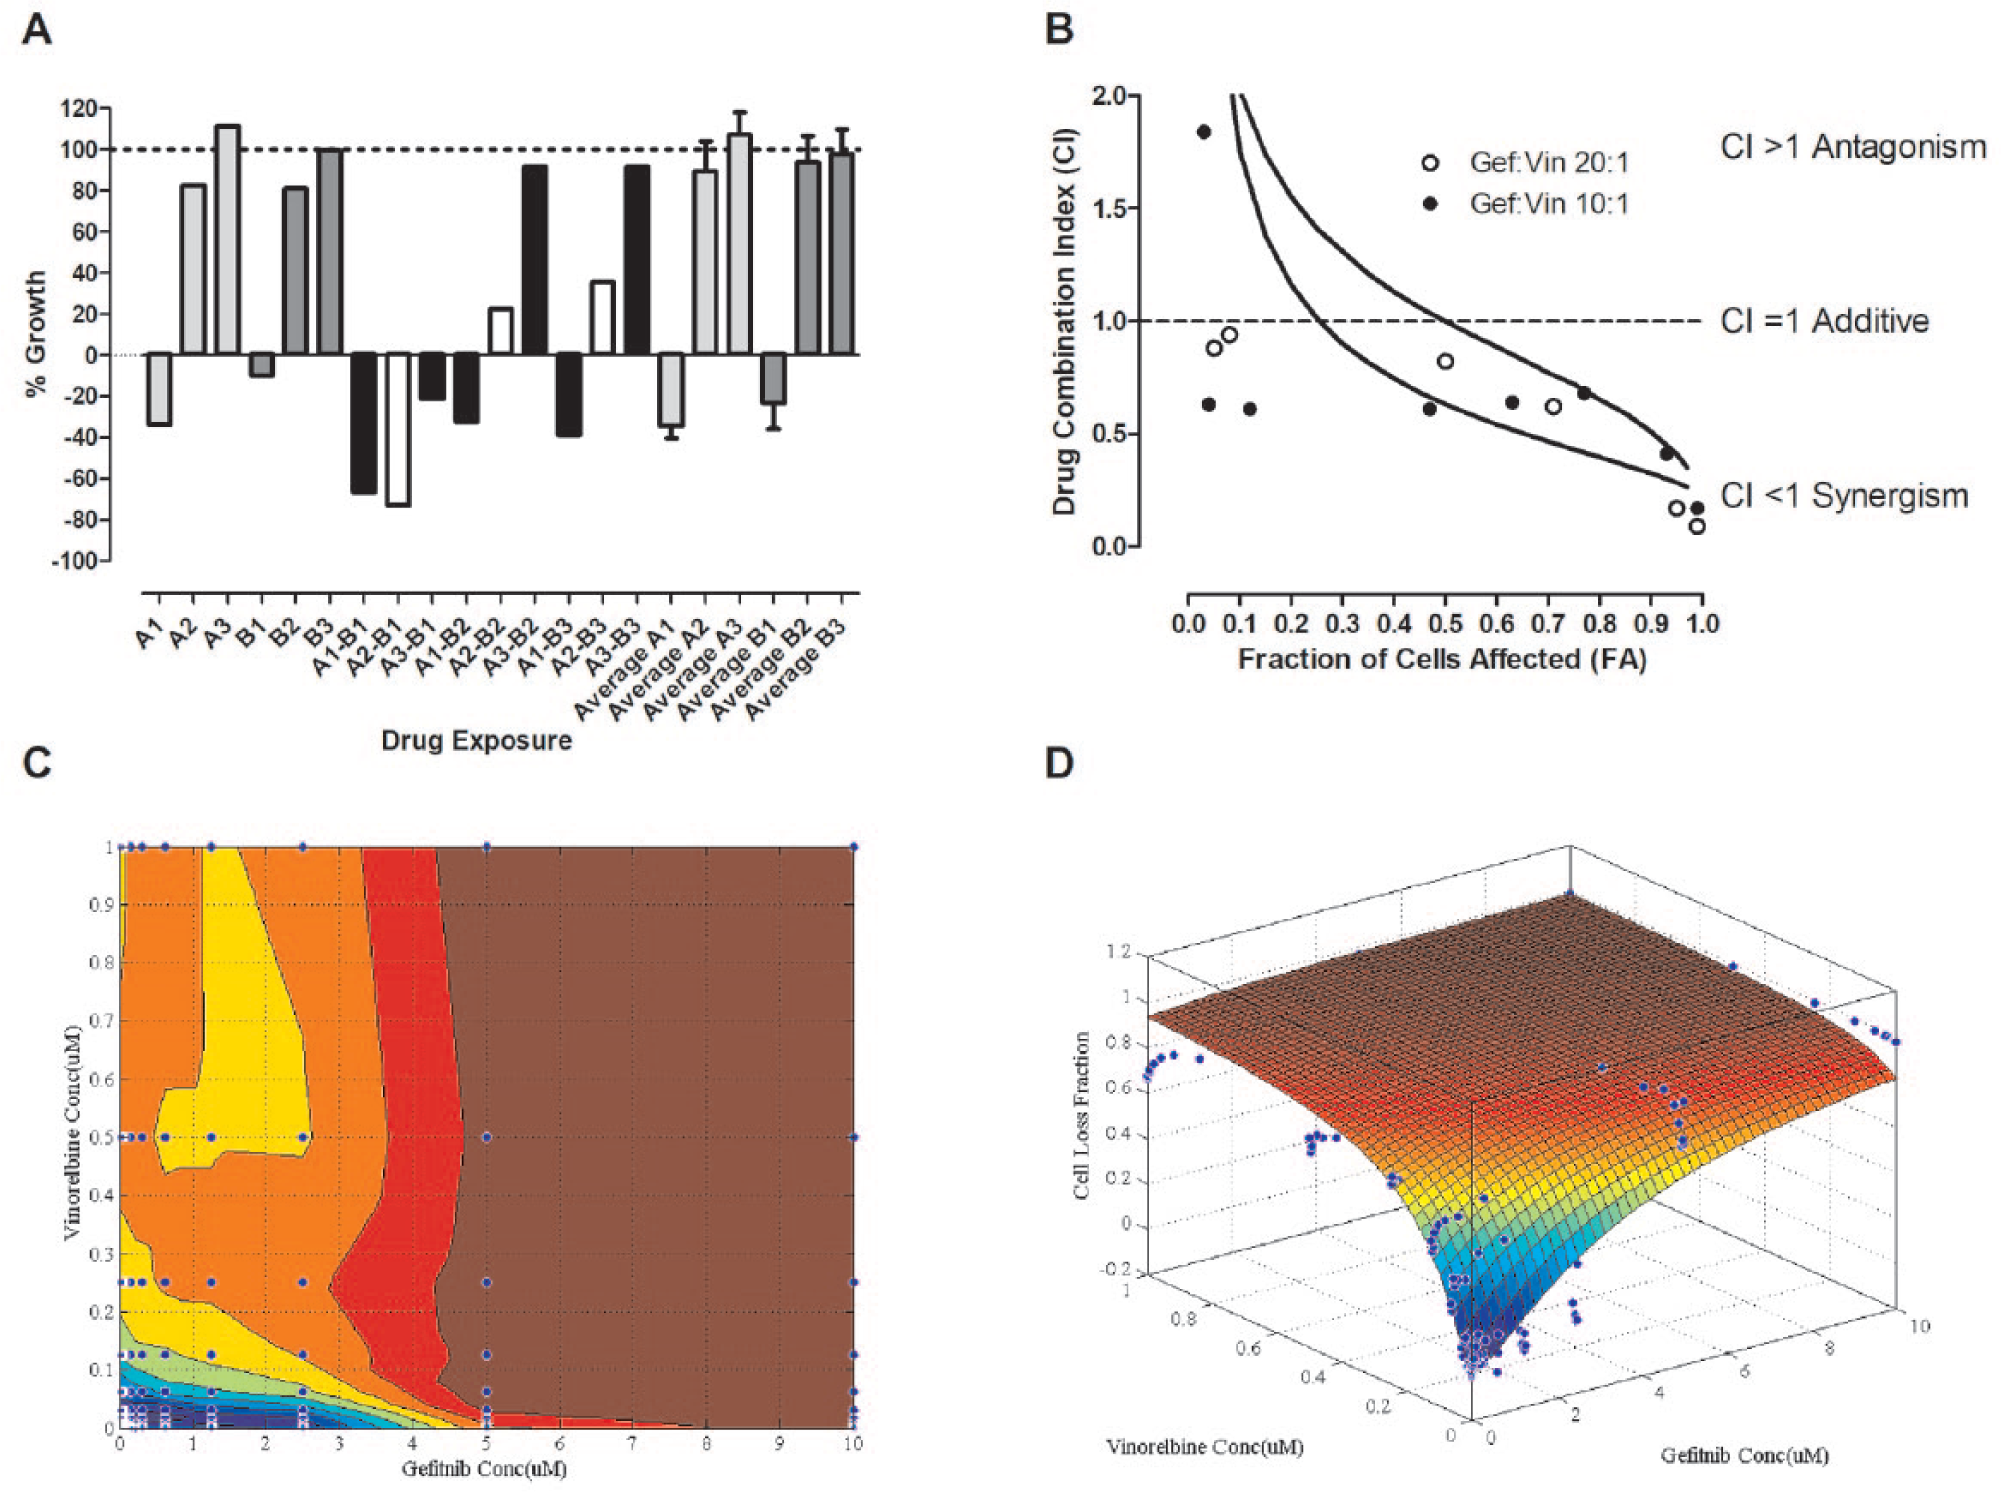
Confirmation of gefitinib-vinorelbine flagged synergy. (
Discussion
The NCI-60 panel represents nine major cancer lineages, and together with two other cancer cell line panels that have been assembled, they have been utilized for cancer drug screening in conjunction with multitiered omics profiling; the GlaxoSmithKline (GSK) panel of >300 cancer cell lines, which encompasses 24 tumor tissue types; and the Cancer Cell Line Encyclopedia (CCLE) of 947 cancer cell lines, which were derived from 21 distinct cancer types.28,31,32 We believe that the NCI-60 DC HTS campaign described herein represents the first application of any of these large, extensively characterized tumor cell line panels to screen for synergistic and effective combinations of cancer drugs. 30 DC screening is more challenging than typical HTS strategies, including those that utilize compound mixtures (pooled libraries) or that are intended to find compounds that interact with a specific small molecule or RNAi to elicit synthetic lethal effects.41–43 Relatively few anticancer DC HTS campaigns have been reported, and none were implemented for a full unbiased HTS campaign of all possible DCs.12–14,16,44–47 One group screened a single 9 × 9 DCM composed of a MEK inhibitor and an ERK inhibitor against 16 cancer cell lines of different lineages. 13 Another group screened seven dose combinations of an EGFR/ERBB2 inhibitor with a PI3K/mTOR inhibitor against 65 cancer cell lines. 16 A third group screened 6 × 6 DCMs formed between 459 compounds and a single drug, Bruton’s tyrosine kinase inhibitor ibrutinib, against two B-cell tumor cell lines. 14 In a fourth study, 420 DCs formed between 7 primary and 60 secondary drugs were screened against 13 tumor cell lines: 7 bladder cancer, 3 head and neck cancer, and 3 prostate cancer cell lines. 12 The Combinatorix group screened 5 × 5 DCMs formed from ~600 approved drugs against the A549 NSCLC cell line to generate 100,000 DC data points. 44 A sixth group screened 583 4 × 4 DCMs formed by 22 experimental cancer drugs in all pairwise combinations, as well as in combination with 16 approved drugs in a panel of 39 cancer cell lines. 45 Heske et al. screened 946 6 × 6 DCMs formed from 679 anticancer agents against four Ewing sarcoma cell lines. 47 The 679 anticancer drugs had individually displayed concentration-dependent growth inhibitory activity against all four of the Ewing sarcoma cell lines. 47 He et al. describe an experimental-computational DC analysis pipeline that has been used to test and score the effects of DCs in cancer cells. 46 The pipeline uses the FIMMcherry computer program to produce and visualize combination assay plates that can be directly exported to the robotic system for automated dispensing, and uses the R-package SynergyFinder software to implement synergy scoring models, including highest single agent (HAS), Loewe, Bliss, and zero interaction potency (ZIP). 46 The pipeline method was implemented for screening 8 × 8 DCMs formed from 525 small-molecule cancer drugs against four cancer cell lines: two breast, one ovarian, and one acute monocytic leukemia cell line. 46 During this DC HTS campaign, we screened a total of 2620 4 × 4 DCMs formed from 100 FDA-approved drugs in the NCI-60 panel to generate 3.04 million data points that were uploaded to the NCI and used to populate the ALMANAC database ( Table 3 ).
NCI-60 DC HTS Campaign Summary.
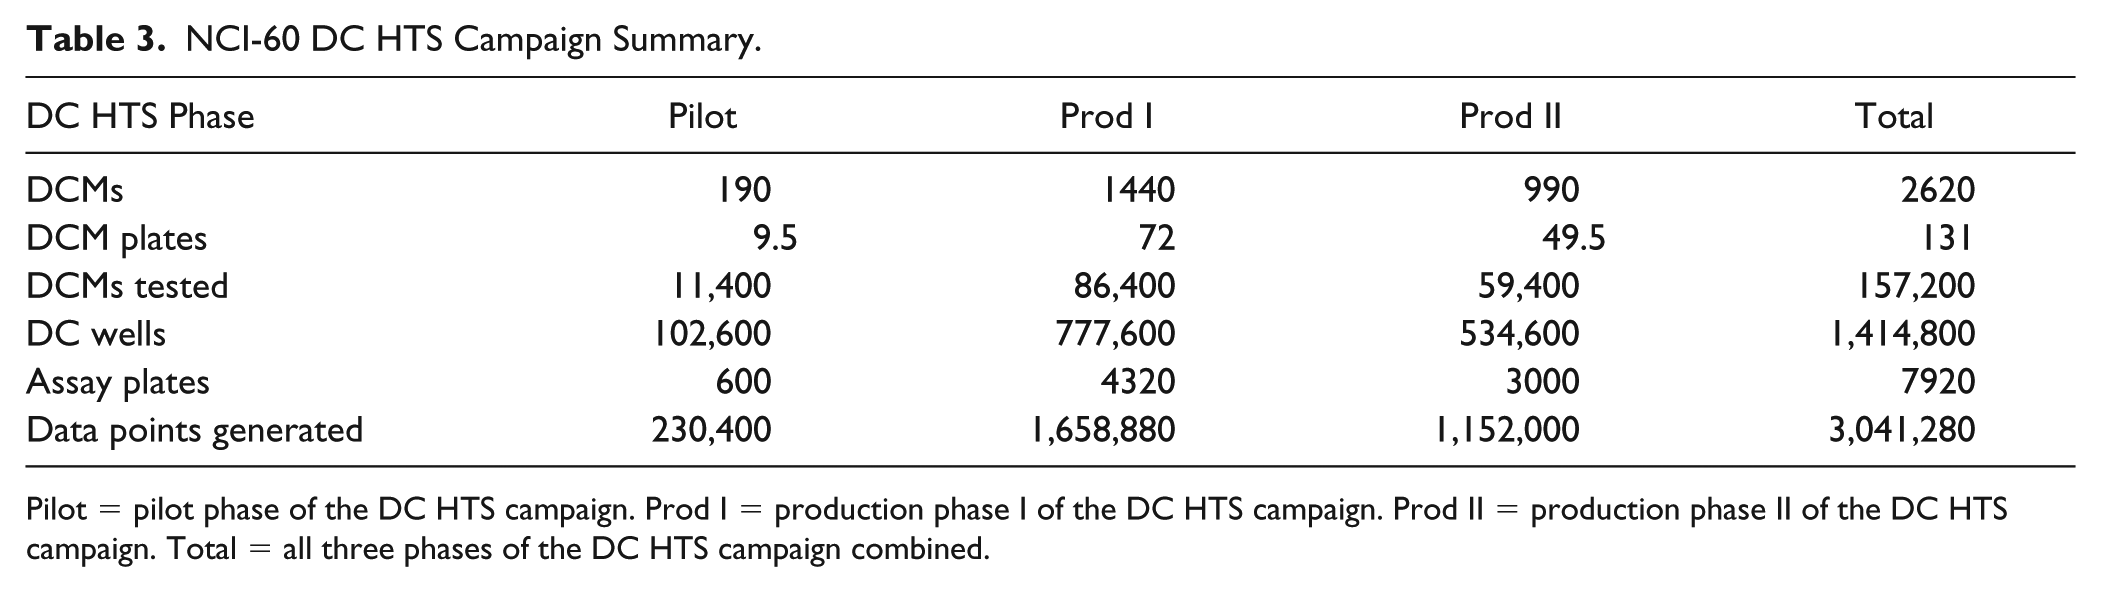
Pilot = pilot phase of the DC HTS campaign. Prod I = production phase I of the DC HTS campaign. Prod II = production phase II of the DC HTS campaign. Total = all three phases of the DC HTS campaign combined.
Tumor cell line panels that have been annotated both genetically and pharmacologically have provided tremendous value for the preclinical stratification and prioritization of anticancer agents.27–29,31,32 However, these panels also have some limitations. Tumor cell lines adapted to growth and maintained in two-dimensional (2D) culture conditions for extensive periods, some >20 years, proliferate more quickly than cells from primary tumors, exhibit different drug resistance profiles, and favor the discovery of antiproliferative agents while neglecting the self- and population-renewing tumor stem cells that contribute to recurrence and metastasis.48–52 A genomic comparison of HNSCC cell lines to primary tumors revealed that although 51% of genetic alterations were shared at similar mutation frequencies, subsets of mutations were unique to patient tumors and cell lines, respectively, and those unique to cell lines favored immortalization and continuous maintenance in tissue culture. 17 For solid tumors, it would be desirable to utilize 3D tumor cultures where extensive cell–cell and cell extracellular matrix interactions mimic the solid tumor architecture, morphology, and their ability to develop microenvironments with differential zones of proliferation due to oxygen, nutrient, and pH gradients that affect drug permeability, distribution, and efficacy.53–55 NCI-60 cell lines cultured in 96-well ultra-low-attachment microtiter plates for 72 h exhibited four distinct morphologies: 28 formed condensed multicellular tumor spheroids (MCTSs) with smooth and even peripheries, 19 formed rounded MCTSs with uneven perimeters, 12 formed cell aggregates with irregular outer margins, and CAKI-1 cells formed irregularly shaped loose aggregates of cells. 56 Although HT29 colon cancer MCTSs were more resistant than monolayers to topotecan and Dox, A549 NSCLC monolayers and MCTSs were equally sensitive to carboplatin and MK1775. 56 In head and neck cancer MCTSs, ellipticine, idarubicin, daunorubicin, and Dox exhibit restricted drug penetration and distribution gradients, accumulating preferentially in cells in the outer layers of MCTSs, and monolayer cultures are 6-, 20-, 10-, and 16-fold more sensitive than MCTSs to growth inhibition by these drugs, respectively. 55 From a logistical standpoint, screening the NCI-60 panel in MCTSs would have increased the cell culture burden by ~5- to 10-fold, and the use of MCTSs might have significantly altered the sensitivity/resistance profiles of many compounds relative to historical 2D NCI-60 data.
To accommodate the scale of the NCI-60 DC HTS campaign, we needed to miniaturize the cell line growth inhibition assays into 384-well format and select suitable cell seeding densities where cells were actively proliferating throughout the 96 h culture period (
Fig. 1
One limitation of the NCI-60 DC HTS campaign was that the 4 × 4 DCMs restricted the analysis of the drug interaction space to only 3 × 3 DCs. Another limitation was that only a co-administration treatment schedule was utilized. We anticipate that miniaturization into 1536-well format14,45,47 and the application of acoustic compound dispensing13,14 could greatly facilitate the implementation of future DC HTS campaigns. A variety of tumor cell line growth inhibition assays have been successfully implemented in 1536-well formats for quantitative HTS
57
and DC HTS,14,45,47 and the use of higher-density plates would be expected to reduce both the cell culture burden and compound requirements, and might also enable larger DCMs with more DC concentrations to be implemented in the primary HTS, thereby enhancing the drug interaction space analysis. The ability to screen a larger DCM might also facilitate the selection of the drug concentration ranges for the matrices, especially for drugs that exhibited a wide range of sensitive/resistant response profiles spanning 2–4 logs of drug concentrations. Although a small number of the NCI-60 cell lines failed one or more of the QC review criteria during the DC HTS campaign and had to be repeated, overall the reformatted 384-well assays performed very well (
Figs. 1
Several methods have been utilized to analyze drug interactions in DC HTS campaigns: HAS, Bliss and Loewe additivity models, ZIP, isobologram analysis, Chou–Talalay median effect models, and population-based lifetime modeling.12–14,16,44–46 In this paper, we used a DI score calculation (eq 2) that is a modification of the Bliss independence model. The numerator represents the difference between the experimentally observed %GI for each DC and the %GI for a Bliss additive effect calculated from the sample means of all measured replicates of the individual concentrations of drug A and drug B alone. In the pilot DC HTS, each individual drug concentration was measured in 19 replicate wells. The denominator uses the sample standard deviations of measured replicates of drug A and drug B alone to calculate a value for the variability associated with the individual drug measurements, which was then divided into the difference between the DC %GI and the calculated Bliss independence additivity for the individual drugs, and to classify the interactions between the two drugs; DI >3 indicates synergy, DI < –3 indicates antagonism, and for −3 < DI < 3 the interaction is additive. In the pilot DC HTS, 1.3% of the DC wells exhibited DI scores >3 and were flagged as synergistic ( Fig. 5A ). Although there did not appear to be a substantial tumor tissue type or cell line bias in the distribution of synergistic DI scores ( Fig. 5B , C ), there was an apparent DCM bias produced by six drugs that each participated in three or four DCMs ( Fig. 5D ).
Just as with any primary HTS, synergistic DC interactions flagged in the screen need to be confirmed. We have confirmed several of the DCMs flagged as synergistic in the pilot DC HTS in larger higher-density concentration coverage 10 × 10 DCMs (manuscript in preparation). To illustrate this process, we showed data for DCM 12 between the microtubule assembly inhibitor vinorelbine and the EGF-R tyrosine kinase inhibitor gefitinib because three of the DC wells in the HTS produced DI scores >3 in the SK-MEL-5 melanoma cell line ( Fig. 6A ). We analyzed the 10 × 10 DCM data using three independent methods. The Chou–Talay median effect model CI scores ( Fig. 6B ), isobologram contour plots ( Fig. 6C ), and pharmacodynamic drug interaction model ( Fig. 6D ) all confirmed the synergistic interactions between gefitinib and vinorelbine for inhibiting the growth/viability of SK-MEL-5 melanoma cells. Gefitinib and vinorelbine combinations have been investigated previously in preclinical studies using tumor cell line models of head and neck squamous cell carcinoma (HNSCC) and NSCLC.58,59 In a panel of six HNSCC tumor cell lines, the combination of gefitinib plus vinorelbine had a supra-additive cytotoxic effect in four of six cell lines, and additive cytotoxic effects in the other two cell lines. 58 Gefitinib and vinorelbine are both metabolized by the CYP3A4 P450 isoenzyme, and when co-administered in vivo, drug–drug interactions may alter their respective exposure levels. 58 In 17 NSCLC cell lines that included 4 that overexpressed P-glycoprotein (Pgp/MDR1) and 3 with sensitizing EGF-R mutations, combinations of gefitinib with vinorelbine exhibited synergism (mean CIs <1) in cell lines without sensitizing EGF-R mutations. 59 Although the synergism between gefitinib and vinorelbine was more robust in the Pgp-overexpressing NSCLC cell lines, it was also apparent in cell lines where Pgp expression was below detection limits. 59 Since vinorelbine is a Pgp substrate and gefitinib a Pgp inhibitor, it seems likely that blocking the efflux pump active resistance mechanism contributed to the synergy apparent between these two agents in Pgp-overexpressing NSCLC cell lines, but that other mechanisms of active resistance were also affected by this DC. 59
The NCI utilized a different modification of the Bliss independence model to analyze the DC HTS data that were generated in the DC HTS campaign described herein. 30 Positive “ComboScores” indicated greater than additive in vitro activity, and while most DCs exhibited selective activity for a subset of cell lines, some were active across most of the NCI-60 cell lines, and except for leukemia cell lines, DC sensitivity was independent of cellular histology. 30 Based on the DC ComboScores in the ALMANAC database, the ability of the specific cell lines to grow as xenograft implants, and their potential clinical utility, a subset of DCs were selected for follow-up in human tumor xenograft models. 30 Five of 13 nonnovel DCs exhibited greater than single-agent efficacy in at least one xenograft model and have demonstrated appreciable efficacy in clinical trials. 30 Fourteen of 44 unique DC plus xenograft model experiments, designed to test 20 novel DCs flagged in the ALMANAC database, exhibited significant antitumor efficacy for the DCs compared with both single agents (p < 0.05), and for 7 more tumor regressions appeared superior for DCs than for single agents. 30 DCs of the purine nucleoside analog clofarabine and the proteasome inhibitor bortezomib that were identified in our DC HTS campaign and flagged as synergistic in the ALMANAC database were tested in five solid tumor xenograft models and exhibited significant tumor regressions in two colon cancer models (HCT116 p < 0.01, HT29 p < 0.001), and in the NCI-H522 NSCLC model (p < 0.01). 30 However, despite showing greater than additive efficacy in the ovarian cancer cell line OVCAR-3 and melanoma line M14 in vitro, neither the single agents nor clofarabine and bortezomib DCs were effective in the corresponding xenograft models. 30 Mechanistic studies provided evidence that DNA damage, cell cycle arrest, and apoptosis contributed to the efficacy of the bortezomib–clofarabine combination in the responsive HCT-116 xenograft model. 30 A phase I trial has been initiated for the bortezomib–clofarabine combination in patients with advanced refractory myelodysplastic syndromes and lymphomas (NCT02211755). DCs of the microtubule-stabilizing agent paclitaxel and the BCR-Abl kinase inhibitor nilotinib from the DC HTS campaign produced positive ComboScores in the ALMANAC database in all six hematopoietic tumors and three of the triple-negative breast cancer cell lines, but negative ComboScores in two estrogen receptor-positive breast cancer lines. 30 The nilotinib–paclitaxel DC was well tolerated, highly efficacious, and superior to both single agents in the triple-negative MDA-MB-468 breast cancer xenograft model and produced complete tumor regression with no tumor regrowth observed for >80 days after therapy ended. 30 Biomarker studies failed to identify any obvious positive associations between NCI-60 molecular markers and nilotinib–paclitaxel ComboScores, which suggested that their synergy does not involve nilotinib-mediated reduction in paclitaxel efflux via ABC transporter inhibition. 30 A phase I trial has been initiated for the nilotinib–paclitaxel combination in adults with refractory solid tumors (NCT02379416).
Almost 75% of the DC pairs in the NCI-60 HTS campaign data that were uploaded to the NCI and used to populate the ALMANAC database (https://dtp.cancer.gov/ncialmanac) have not been registered in the clinical trials database (clinicaltrials.gov). 30 Since only FDA-approved anticancer agents were screened, selected DCs have the potential for rapid clinical translation. The ability to confirm selected synergistic drug interactions flagged in the DC HTS both in vitro and to demonstrate that they had greater than single-agent efficacy in mouse xenograft human cancer models in vivo 30 indicates that the NCI ALMANAC database constitutes a valuable resource for selecting promising DCs for confirmation, mechanistic studies, and clinical translation.
Footnotes
Acknowledgements
The authors would like to thank Richard DeBiasio and Seia Comsa for their expert technical support throughout the NCI-60 DC screening project.
Declaration of Conflicting Interests
The authors declared no potential conflicts of interest with respect to the research, authorship, and/or publication of this article.
Funding
The authors disclosed receipt of the following financial support for the research, authorship, and/or publication of this article: This project was funded in part with federal funds from the National Cancer Institute, National Institutes of Health, under contract no. HHSN2612005522002C, NCI-N01-CM-52202, ARRA-funded project Work Assignment 14, “In Vitro Screening of Combinations of Chemotherapy Drugs.” The content of this publication does not necessarily reflect the views or policies of the Department of Health and Human Services, nor does mention of trade names, commercial products, or organizations imply endorsement by the U.S. government.