
Abstract
We describe the development, optimization, and validation of 384-well growth inhibition assays for six patient-derived melanoma cell lines (PDMCLs), three wild type (WT) for BRAF and three with V600E-BRAF mutations. We conducted a pilot drug combination (DC) high-throughput screening (HTS) of 45 pairwise 4×4 DC matrices prepared from 10 drugs in the PDMCL assays: two B-Raf inhibitors (BRAFi), a MEK inhibitor (MEKi), and a methylation agent approved for melanoma; cytotoxic topoisomerase II and DNA methyltransferase chemotherapies; and drugs targeting the base excision DNA repair enzyme APE1 (apurinic/apyrimidinic endonuclease-1/redox effector factor-1), SRC family tyrosine kinases, the heat shock protein 90 (HSP90) molecular chaperone, and histone deacetylases.
Pairwise DCs between dasatinib and three drugs approved for melanoma therapy—dabrafenib, vemurafenib, or trametinib—were flagged as synergistic in PDMCLs. Exposure to fixed DC ratios of the SRC inhibitor dasatinib with the BRAFis or MEKis interacted synergistically to increase PDMCL sensitivity to growth inhibition and enhance cytotoxicity independently of PDMCL BRAF status. These DCs synergistically inhibited the growth of mouse melanoma cell lines that either were dabrafenib-sensitive or had acquired resistance to dabrafenib with cross resistance to vemurafenib, trametinib, and dasatinib. Dasatinib DCs with dabrafenib, vemurafenib, or trametinib activated apoptosis and increased cell death in melanoma cells independently of their BRAF status or their drug resistance phenotypes. These preclinical in vitro studies provide a data-driven rationale for the further investigation of DCs between dasatinib and BRAFis or MEKis as candidates for melanoma combination therapies with the potential to improve outcomes and/or prevent or delay the emergence of disease resistance.
Introduction
Melanoma represents <5% of skin cancers but accounts for 80% of skin cancer–related deaths.1,2 Melanoma incidence is rising at ~3% per annum and represents the sixth most common cancer, fifth and seventh in men and women, respectively.2,3 In the United States in 2020, it is projected that there will be 100,350 new melanoma patients, and 6850 will die of the disease. UV exposure is the predominant risk factor for cutaneous melanoma.1,2 Somatic mutation rates of cutaneous melanoma are significantly higher than in other cancers, and the four histologic subtypes (uveal, cutaneous, mucosal, and acral) exhibit considerable heterogeneity in both the number and patterns of driver mutations involved.1,2,4–6 Thirteen core genes are frequently mutated in melanomas: BRAF, NRAS, TP53, NF1, CDKN2A, ARID2, PTEN, PPP6C, RAC1, IDH1, DDX3X, MAP2K1, and RB1.5,6 The largest genomic subtype exhibits BRAF hotspot mutations; the second is characterized by RAS hotspot mutations; the third exhibits somatic mutations in NF1, a GTPase-activating protein known to downregulate RAS activity; and the fourth is a heterogeneous subgroup lacking hotspot BRAF, N/H/KRAS, or NF1 mutations termed the Triple-WT subtype that features KIT mutations, focal amplifications, and complex structural rearrangements.5,6
Patients with localized stage I melanomas are largely curable by surgical excision with 5-year survival rates of >98%.1,2,7 After melanoma progresses to regional or distal sites, 5-year survival declines to 62.4% and 17.9%, respectively.1,2,7 Patients with nonresectable stage III or IV melanoma have a median survival of 6–10 months despite existing systemic therapies.1,2 Dacarbazine and recombinant human interleukin-2 are approved by the US Food and Drug Administration (FDA) for metastatic melanoma.1,2,7–9 These agents yielded objective responses (ORs) in ≤20% of patients, however, with no discernable overall benefit to either progression-free survival (PFS) or overall survival (OS).1,2,7–9 Several molecularly targeted drugs and immunotherapies have recently been approved for advanced melanoma treatment: drugs that inhibit B-Raf or MEK, and monoclonal antibody (MAbs) immunotherapies that block immune checkpoints (IC-MAbs).3,7–10 Monotherapy with first-generation inhibitors of B-Raf (BRAFi, vemurafenib, or dabrafenib) or MEK (MEKi, trametinib) significantly improved patient OR rates and prolonged median PFS and OS.3,7–10 BRAFi and MEKi monotherapies were well tolerated with low-grade adverse events (AEs) that can be managed.3,8,11–13 Although BRAFis and MEKis induce rapid disease stabilization with ~50% and 22% ORs, respectively, PFS is limited to 5–7 months because drug resistance emerges and the disease progresses.14–16 Second-generation BRAFis like encorafenib (BRAFTOVI) and MEKis cobimetinib (Cotellic) and binimetinib (MEKTOVI) exhibit improved efficacy, and the ecorafenib plus binimetinib drug combination (DC) produced median PFS of 14.9 months and OS of 33.6 months for metastatic melanoma.17–19 BRAFis plus MEKis DCs are the standard of care treatment for locally advanced or metastatic V600E-mutated BRAF melanoma. IC-MAbs such as ipilimumab [anti-cytotoxic T-lymphocyte antigen-4 (CTLA4)] or pembrolizumab and nivolumab [anti-programmed cell death-1 protein (PD1)] have lower OR rates, but more durable responses that prolong both median PFS and OS.3,7–10 The clinical benefits of ipilimumab are balanced by low response rates (~10%), slow onset of action, and significant (~25%) autoimmune toxicity.10,20 Pembrolizumab and nivolumab achieve higher clinical response rates (~20% and 30–40%, respectively) with lower levels of autoimmune toxicity (<10%).10,20 Although small-molecule drugs and IC-MAbs have revolutionized melanoma therapy and improved tumor response rates, patient responses are rarely durable, and no cure exists for advanced metastatic melanoma. There is a need to identify new drugs and/or treatment options for the clinical management of melanoma.
Intrinsic and acquired drug resistance are major obstacles to achieving long-term clinical benefit for advanced-stage melanoma.15,16,21–25 5–20% of melanoma patients don’t respond to BRAFis due to innate resistance mechanisms.3,16,21,24,25 Acquired resistance to single-agent BRAFis develops within 6–7 months due to mitogen-activated protein kinase (MAPK) signaling reactivation or activation of alternative signaling pathways.3,15,16,24–26 Only ~10% of melanoma patients respond to ipilimumab, and most responses are short-lived, suggesting the emergence of resistance. 16 Although pembrolizumab and nivolumab achieve higher ORs, PD1-resistant melanomas exhibit markedly lower T-cell infiltration and lower tumor inflammation. 10 Single-agent cancer therapy rarely provides long-term cures due to the genetic complexity and heterogeneity of cancers and their propensity for drug resistance.22,27–32 Animal and clinical studies demonstrate that DCs are more effective than single-agent therapies.22,27–32 The most effective cytotoxic DCs increase tumor cell killing either additively or synergistically by combining agents with different molecular mechanisms and non-overlapping toxicities.22,27–32 DCs are being implemented clinically to improve efficacy in melanoma and to prevent or delay drug resistance.9,15,16,25,33–35 Even though BRAFi plus MEKi DCs improved PFS and OS rates compared to individual drug treatment, acquired drug resistance is a major limitation to good clinical outcomes.3,33,35,36 Immuno-oncology DC strategies are also emerging, either anti-CTLA4 plus anti-PD1 approaches, or combinations of IC-MAbs with small-molecule drugs.3,8,16,25,35 It is difficult, however, to predict which DCs will effectively provide long-term benefits to patients beyond single-agent therapy. Systematic high-throughput screening (HTS) of DCs against tumor cell line panels provides an unbiased data-driven strategy to identify DCs that might have potential to be developed into effective therapeutic regimens.27–32,37–47
We implemented a DC HTS campaign in the National Cancer Institute’s (NCI) NCI-60 tumor cell line panel to screen pairwise DC matrices (DCMs) prepared from 100 FDA-approved cancer drugs that generated 3.04 million data points to populate the ALMANAC (A Large Matrix of Anti-Neoplastic Agent Combinations) database for the NCI.39,40,42,43 Selected synergistic DCs from the HTS were confirmed in vitro, potential synergy mechanisms of action (MOAs) were explored, and several DCs exhibited greater than single-agent efficacy in mouse xenograft human cancer models. 42 Phase I clinical trial enrollments were opened for the bortezomib plus clofarabine DC in patients with advanced refractory myelodysplastic syndromes and lymphomas (NCT02211755), and for the nilotinib plus paclitaxel DC in adults with refractory solid tumors (NCT02379416). Four DCs flagged in the NCI-60 DC HTS were confirmed to interact synergistically in vitro in several tumor cell lines, and it was shown that interactions between adenosine triphosphate (ATP)-binding cassette (ABC) drug efflux inhibitors and their substrates likely contributed to the observed synergy.39,43 Tumor resistance to anticancer drugs that generate DNA adducts is often associated with enhanced apurinic/apyrimidinic endonuclease-1/redox effector factor-1 (APE1) expression, a critical component of base excision repair (BER). 40 The APE1 inhibitor AJAY4 has a median 50% growth inhibition (GI50) of 4.19 µM across the NCI-60 cell line panel, and a DCM with the BRAFi vemurafenib was flagged for synergistic growth inhibition in a DC HTS in the SK-MEL5 melanoma cell line that expresses V600E-mutated B-Raf, but not in SK-MEL2 cells expressing wild-type (WT) B-Raf. 40 This article describes the development and implementation of an unbiased pairwise DC pilot HTS of 10 selected anticancer agents in patient-derived melanoma cell lines (PDMCLs) equally represented by WT and V600E mutant BRAF genotypes. We wished to determine whether the vemurafenib plus AJAY4 DC would behave synergistically in PDMCLs, if synergy depended on the BRAF status, and if other novel synergistic DC interactions would be identified. Novel synergistic DCs that are effective in PDMCLs and/or overcome BRAFi or MEKi resistance have the potential to be developed into effective melanoma therapeutic regimens.
Materials and Methods
Reagents
DMSO (99.9% high-performance liquid chromatography grade) was obtained from Alfa Aesar (Ward Hill, MA). Dulbecco’s Mg2+-free and Ca2+-free phosphate-buffered saline (PBS) was purchased from Gibco (Grand Island, NY). Roswell Park Memorial Institute Medium (RPMI 1640) and Dulbecco’s modified Eagle’s medium (DMEM) were purchased from Corning (Manassas, VA). Fetal bovine serum (FBS), L-glutamine (L-glut), HEPES, minimal essential amino acids [minimal essential medium (MEM)], and penicillin and streptomycin (P/S) were purchased from Thermo Fisher Scientific (Waltham, MA). FDA-approved anticancer compounds were obtained from commercial sources and provided by the NCI Developmental Therapeutics Program (DTP), as previously reported. 39 The APE1 inhibitor AJAY4 was provided by Dr. Barry Gold, 40 and STA-9090 (Ganetispib) was obtained from Dr. Walter Storkus. The homogeneous cellular ATP detection reagent Cell Titer Glo (CTG) and the homogeneous cellular Caspase-Glo 3/7 apoptosis detection reagents (CG-3/7) were purchased from Promega (Madison, WI).
Cancer Drug Mechanisms of Action
Four of the cancer drugs have been approved for the treatment of melanoma: dabrafenib (Tafinlar) and vemurafenib (Zelboraf) are B-Raf kinase inhibitors, trametinib (Mekinist) is a MEK1/2 kinase inhibitor, and temozolomide (Temodar) is a derivative of the methylation agent dacarbazine. AJAY4 is an inhibitor of the base excision DNA repair enzyme APE1. 40 Dasatinib (BMS-354825, Sprycel) is a multi-BCR/Abl and SRC family tyrosine kinase (SFK) inhibitor approved for patients with chronic myelogenous leukemia and acute lymphoblastic leukemia who are Philadelphia chromosome positive. STA9090 (Ganetespib) is a heat shock protein 90 (HSP90) inhibitor that is currently in clinical trials, either alone or in combination with other drugs, for a variety of cancers. Romidepsin (Istodax) is a histone deacetylase inhibitor approved for the treatment of peripheral and cutaneous T-cell lymphomas. The anthracycline antibiotic doxorubicin (Adriamycin) is a DNA intercalator and topoisomerase II inhibitor approved to treat non-Hodgkin’s lymphoma, multiple myeloma, acute leukemias, Kaposi sarcoma, Ewing sarcoma, Wilms tumor, and cancers of the breast, adrenal cortex, endometrium, lung, ovary, and other sites. Decitabine (Dacogen) is a cytidine analog that inhibits DNA methyltransferase, resulting in hypomethylated DNA that is used for the treatment of myelodysplastic syndromes and for acute myeloid leukemia.
Patient-Derived Melanoma Cell Lines
Ten PDMCLs were established and provided by investigators in the Melanoma and Skin Cancer SPORE (Specialized Program of Research Excellence) at the University of Pittsburgh Medical Center’s Hillman Cancer Center (
Murine Melanoma Cell Lines
Two murine melanoma cell lines, BP-WT and BP-R20, were provided by Dr. Ron Fecek (University of Pittsburgh School of Medicine, Pittsburgh, PA). The BP-WT cell line was obtained from Dr. Jen Wargo at MD Anderson Cancer Center (Houston, TX) and was developed from BRAFV600E mice obtained from the Bosenberg Lab at Yale University. 48 The dabrafenib-resistant BP-R20 melanoma population was isolated by Dr. Fecek from BP-WT cells continuously passaged in culture medium containing 20 µM dabrafenib. 49 The BP-WT and BP-R20 cell lines were maintained in DMEM supplemented with 10% FBS, 1% L-glut, and 1× P/S. BP-R20 dabrafenib resistance was preserved by supplementing the media with 20 µM Dab at every other passage.
Determination of Individual-Drug GI50s in Patient-Derived Melanoma Cell Lines and the BP-WT and BP-R20 Murine Melanoma Cell Lines
The homogeneous 384-well PDMCL growth inhibition assays using the CTG cellular ATP detection reagent were adapted from previously described tumor cell line growth inhibition (GI) assays.39,43 Briefly, PDMCLs and murine melanoma cell lines (WT and BP-R20) were harvested by trypsinization and centrifugation, and viable trypan blue–excluding cells were counted using a hemocytometer. 45 µL of cells at the appropriate cell density were seeded into the wells of white, opaque, clear-bottomed, time 0 (T0) and time 72 h (T72), 384-well barcoded assay plates (cat. no. 781098; Greiner BioOne, Monroe, NC) using a Matrix multichannel pipettor (Thermo Fisher Scientific) or a Microflo (BioTek, Winooski, VT) bulk reagent dispenser. T0 and T72 assay plates were then incubated at 37 °C in 5% CO2 and 95% humidity for 24 h. After 24 h, 5 µL of test drugs was transferred into the test wells of the assay plate (0.2% DMSO final) using the 384-well transfer head on a Janus MDT Mini (Perkin Elmer, Waltham, MA) robotic liquid-handling platform; plates were centrifuged at 100×g for 1 min and returned to an incubator at 37 °C in 5% CO2 and 95% humidity for 72 h. Also, on day 2, the T0 control cell-seeding plates were removed from the incubator, and 25 µL of the CTG detection reagent was added to the wells using a Matrix multichannel pipettor, and after a 15 min incubation at room temperature, the relative luminescence signals (RLUs) of the T0 control plates were captured on the SpectraMax M5e (Molecular Devices, Sunnyvale, CA) microtiter plate reader. After 72 h, assay plates were removed from the incubator, 25 µL of CTG was added to the wells using a Microflo bulk reagent dispenser, and after 15 min the RLUs were read on the SpectraMax M5e plate reader. To analyze the growth inhibition data, we used a concentration–response template to process the raw RLU data to % growth (PG); generate HTS assay performance statistics, S:B ratios, and Z-factor coefficients; and fit the data to curves and derive the GI50 values. PG was calculated using the standard NCI-60 protocol, and as described in Ref. 39 .


where Ti is the compound well test value at 72 h, Tz is the average of the test values from the T0 control plate at time zero (n = 384), and C is the average of the test values (n = 64) in the T72 DMSO (0.2%) control wells. GraphPad Prism 5 software (GraphPad, San Diego, CA) was used to plot and fit data to curves using the sigmoidal concentration–response variable slope equation: Y = Bottom + [Top − Bottom] / [1 + 10^(LogEC50 − X) × HillSlope], where Bottom is the Y value at the bottom plateau, Top is the Y value at the top plateau, Log EC50 is the X value when the response is halfway between the bottom and top, and HillSlope describes the steepness of the curve. The growth inhibition 50 (GI50) value represents the concentration at which cell growth was inhibited by 50%, the total growth inhibition (TGI) value represents the concentration at which cell growth was fully inhibited, and the lethal concentration 50 (LC50) value represents the concentration at which 50% of the cells were killed.
Preparation of Drug Combination Matrix (DCM) Master and Replica Daughter Plates
For the pilot DC HTS, a total of 45 pairwise 4×4 DCMs were generated from the 10 test compounds, and these were arrayed onto 3×384-well master plates. In addition to the nine DC wells, each 4×4 DCM contained a DMSO control and three single-drug control wells for each of the two drugs at concentrations tested within the matrix. Source A (40 µL) and Source B (20 µL) 10× master plates were arrayed manually using a matrix pipettor (
Patient-Derived Melanoma Cell Line Drug Combination Matrix Screening
On day 1 of the assay, PDMCLs were harvested, counted, and seeded in 45 µL of complete growth medium at the appropriate cell density into T0 and T72 384-well assay plates using the Multiflo bulk dispenser. On day 2, the T0 control cell-seeding plates were removed from the incubator, 25 µL of the CTG was added to the wells, and the RLU signals were acquired as described above. Also on day 2, DCM replica daughter plates prepared as described above were thawed at 37 °C and diluted in 98 µL of serum-free RPMI 1640 medium using a Microfil dispenser to an intermediate drug concentration (2% DMSO), and then 5 µL was transferred into the test wells of the T72 assay plates using the 384-well transfer head on a Janus MDT Mini robotic liquid-handling platform, and the plates were then returned to an incubator at 37 °C in 5% CO2 and 95% humidity for 72 h. On day 5, the compound-treated T72 assay plates were removed from the incubator, 25 µL of CTG was added to the wells using a Multiflo bulk reagent dispenser, the RLU signals were captured on the SpectraMax M5e, and PG was calculated using the standard NCI-60 protocol as described above.
Drug Interaction Index Score Analysis of HTS Data
To take advantage of our DC HTS strategy in which individual drugs are tested in multiple replicates as well as in combination, we developed a drug interaction index score (DIIS) to classify the interaction status of two drugs, 39 as shown in Equation (1):
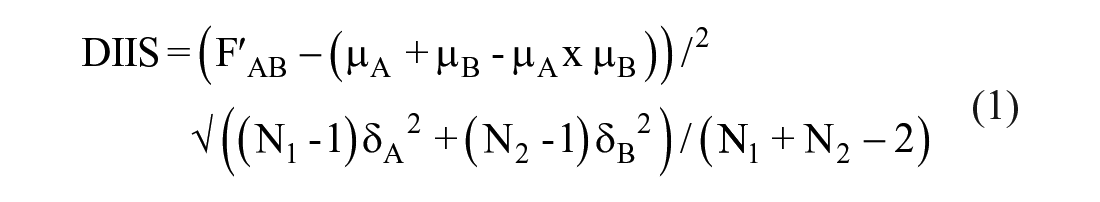
where F’AB is the experimentally observed % growth inhibition (%GI) for each drug combination, µA and µB are the sample means of measured replicates of %GI or CLF at X and Y concentrations of drug A or drug B alone, δA and δB are the sample standard deviations of measured replicates of drug A or drug B alone, and N1 and N2 are the number of sample replicates of drug A or drug B alone. The drug interaction score analysis was implemented in MATLAB (Natick, MA). The drug interaction score calculation is a modification of the Bliss independence model. 50 The numerator represents the experimentally observed %GI for each DC in the DCM minus the %GI for a Bliss additive effect calculated from the sample means of all measured replicates of the individual concentrations of drug A and drug B alone. It represents the difference between the experimentally observed %GI of a DC and the calculated Bliss additive effect of replicate means of the two drugs individually. The denominator of Equation (1) takes advantage of the individual drug concentration replicates and uses the sample standard deviations of measured replicates of drug A and drug B alone to calculate a value for the variability associated with the individual drug measurements, which when divided into the difference between the DC %GI and the calculated Bliss independence additivity for the individual drugs can be used to classify the interactions between the two drugs. A DIIS >3 indicates synergy, a DIIS <−3 indicates antagonism, and for −3 < DIIS < 3, the interaction is additive.
Confirmation of Drug Combinations Scored as Synergistic in the Pilot DC HTS
We arrayed 10×10 DCMs onto 384-well master plates. Each DCM included 9×9 DC wells (81 total) together with nine wells (18 total) containing each of the corresponding individual drug concentrations, and one DMSO control well. Two 10×10 DCMs were arrayed in columns 3 to 22 of the 384-well plates, together with DMSO (0.2%) controls in columns 1, 2, 23, and 24 (n = 64). We used the Chou–Talalay median-effect model to calculate a combination index (CI) score. 51 CI = (D1 / DX1) + (D2 / DX2), where D1 and D2 denote, respectively, the concentrations of compound 1 and compound 2 required to reach an effect of X% as individual drug treatments; and DX1 and DX2 are, respectively, the concentrations needed in combination to inhibit X%. DCs with CI > 1 exhibit antagonistic interactions, DCs with CI = 1 exhibit additivity, and DCs with CI < 1 exhibit synergistic interactions. The COMPUSYN freeware program (Combosyn, http://www.combosyn.com) was used to calculate CI values and evaluate DC synergy, as described previously.39,43
Determination of Apoptosis in Patient-Derived and Murine Melanoma Cell Lines
To measure compound-induced activation of apoptosis in PDMCLs and the BP-WT and BP-R20 murine melanoma cell lines, we used the homogeneous Caspase-Glo 3/7 reagent from Promega. The CG-3/7 reagent provides a pro-luminescent substrate (Z-DEVD-aminoluciferin), which is cleaved by caspase 3/7, to release aminoluciferin, a substrate of luciferase used to produce light. The CG-3/7 reagent has been optimized for cell lysis and luciferase output to measure caspase 3/7 activity.52,53 Briefly, PDMCLs and murine melanoma cell lines were harvested by trypsinization and centrifugation, and viable trypan blue–excluding cells were counted using a hemocytometer. 45 µL of cells at the appropriate cell density was seeded into the wells of white, opaque, 384-well barcoded assay plates using a Matrix multichannel pipettor. Assay plates were then incubated at 37 °C in 5% CO2 and 95% humidity for 24 h. After 24 h, 5 µL of test drugs was transferred into the test wells of the assay plate (0.2% DMSO final) using the 384-well transfer head on a Janus MDT Mini robotic liquid-handling platform; plates were centrifuged at 100×g for 1 min and returned to an incubator at 37 °C in 5% CO2 and 95% humidity for 24 h. After 24 h, assay plates were removed from the incubator, 25 µL of CG-3/7 was added to the wells using a Microflo bulk reagent dispenser, and after 1 h the RLUs were read on the SpectraMax M5e. GraphPad Prism 5 software was used to plot and fit data to curves using the sigmoidal concentration–response variable slope equation described above.
Results
PDMCL Growth Inhibition Assay Development, Validation, and Individual Drug GI50 Determinations
To determine whether PDMCLs, whether WT for BRAF or with V600E-BRAF mutations, would be compatible with 384-well growth conditions, we conducted cell-seeding density and time course experiments in 10 PDMCLs to select 384-well cell-seeding densities that allowed for active proliferation throughout a 96 h culture period with acceptable HTS assay performance statistics (

Formatting patient-derived melanoma cell line (PDMCL) growth inhibition assays into 384-well Cell Titer Glo (CTG) format and drug growth inhibition 50 (GI50) determinations.
Test Compound Growth Inhibition 50 (GI50) Values in Patient-Derived and Mouse Melanoma Cell Lines.
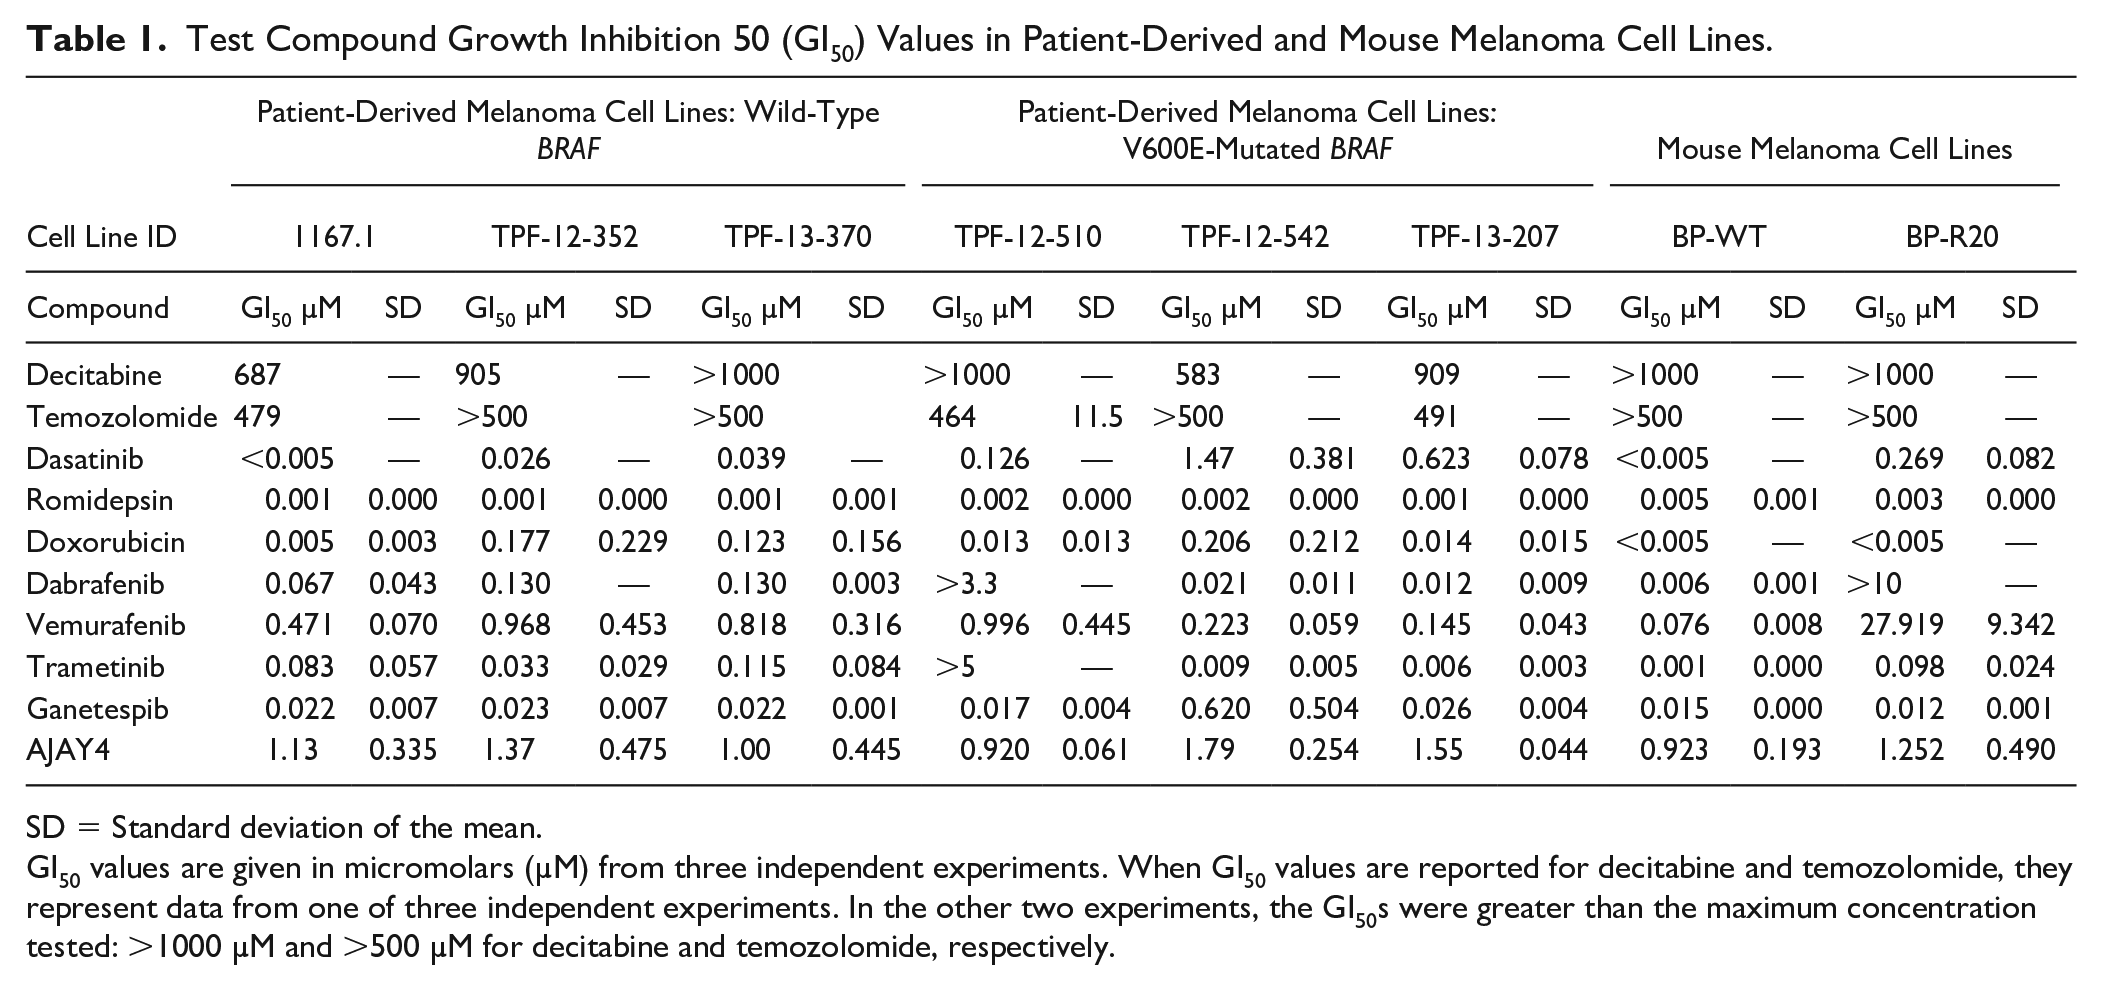
SD = Standard deviation of the mean.
GI50 values are given in micromolars (µM) from three independent experiments. When GI50 values are reported for decitabine and temozolomide, they represent data from one of three independent experiments. In the other two experiments, the GI50s were greater than the maximum concentration tested: >1000 µM and >500 µM for decitabine and temozolomide, respectively.
To further validate the PDMCL 384-well growth inhibition assays and to generate data for the selection of the three individual drug concentrations in the HTS DC matrices, we conducted GI50 determinations throughout the six PDMCLs for all 10 selected anticancer drugs (
Drug Combination Matrix Pilot HTS in Patient-Derived Melanoma Cell Lines
When the concentration of a single agent achieves a profound inhibition of growth by itself, the remaining response window is too small to detect any synergistic growth inhibition effects of a second agent.
39
Consistent with previous DC HTS campaigns39,40,43 and based on the individual GI50 determination data (
Replica daughter plates prepared from the DCM master plates were used to conduct two independent DC pilot screens in four of the six PDMCLs. The 24×384-well PDMCL assay plates of the two independent DC pilot screens passed our quality control criteria with S:B ratios greater than or equal to twofold, and Z’-factor coefficients ≥0.25; 19 of 24 assay plates produced Z’-factor coefficients ≥0.5, and the others were ≥0.47.
Figure 2
shows representative scatterplots of the PG inhibition data (

Unbiased drug combination (DC) pilot high-throughput screening (HTS) in patient-derived melanoma cell line (PDMCL) growth inhibition assays. Each individual drug was tested in pairwise DCs with the nine other test drugs. In addition to nine DC wells, each 4×4 drug combination matrix (DCM) contained a DMSO control and three control wells at the individual drug concentrations in the matrix. A total of 45 pairwise 4×4 DCMs were generated from the 10 test compounds, and these were arrayed onto 3×384-well master plates.
Confirmation of Synergistic Drug Interactions Flagged in the Drug Combination Matrix Pilot HTS in Patient-Derived Melanoma Cell Lines
To choose DCs flagged as synergistic in the PDMCL DC HTS for confirmation, we selected DCMs in which synergy had been indicated in multiple DC wells of the DCM and against more than one PDMCL. Only DCMs that contained dasatinib in combination with the BRAFis dabrafenib or vemurafenib, or with the MEKi trametinib, met these criteria. To confirm flagged synergies, we generated an expanded 10×10 DCM to test against the PDMCLs.39,40,43
Figure 3
shows the GI50 determinations and Chou–Talalay median-effects model CI analysis for the DCs of dasatinib plus dabrafenib, vemurafenib, or trametinib in two PDMCLs: the 1167.1 WT BRAF PDMCL and the TFP-13-207 V600E-BRAF PDMCL. In concentration–response curves, we present the GI50 curves for individual drugs together with the concentration response of one of the drugs at a fixed concentration of the other drug. In the CI plots, selected fixed DC ratios extracted from diagonal wells in the 10×10 DCMs are presented. In both PDMCLs, exposure to the DC of dasatinib with dabrafenib, vemurafenib, or trametinib dramatically left-shifted the concentration–response curves, consistent with substantially enhanced sensitivity relative to treatments with the individual drugs, and produced more cytotoxicity (

Confirmation of synergistic drug interactions identified in the drug combination (DC) pilot high-throughput screening (HTS) conducted in patient-derived melanoma cell line (PDMCL) growth inhibition assays.
Evaluation of Synergistic Drug Interactions in Murine Melanoma Cell Line Models Sensitive or Resistant to Dabrafenib
Drug resistance, both intrinsic and acquired, remains a major barrier to the attainment of long-term clinical benefit in advanced melanoma.15,16,21–25 We wanted to explore whether the DCs between dasatanib and BRAFis or MEKis might also behave synergistically in drug-resistant melanoma cell lines. The dabrafenib-resistant BP-R20 murine melanoma cell population was isolated from BP-WT cells continuously passaged in culture medium containing 20 µM dabrafenib. BP-R20 cells were completely resistant to growth inhibition by dabrafenib (≤10 µM), while BP-WT cells were exquisitely sensitive with a GI50 ~6 nM (

Individual drug growth inhibition 50 (GI50) determinations and combination index (CI) analysis in dabrafenib-sensitive (BP-WT) and -resistant (BP-R20) mouse melanoma cell lines. The dabrafenib-resistant BP-R20 murine melanoma cell population was isolated from BP-WT cells continuously passaged in culture medium containing 20 µM dabrafenib.
To further investigate the synergy between dasatinib DCs with BRAFis or MEKis, we examined their ability to activate apoptosis in four melanoma cell line models: the 1167.1 WT BRAF PDMCL, the TFP-13-207 V600E-BRAF PDMCL, and the BP-WT and dabrafenib-resistant BP-R20 murine melanoma cell lines (

Activation of apoptosis in patient-derived melanoma cell lines (PDMCLs) and dabrafenib-sensitive and -resistant mouse melanoma cell lines by individual drugs and drug combinations (DCs).
Discussion
We describe the development, optimization, and validation of 384-well growth inhibition assays for six PDMCLs, three WT for BRAF and three with V600E-BRAF mutations (
Dasatinib is a small-molecule, broad-spectrum, ATP-competitive tyrosine kinase inhibitor (TKI) that targets BCR-Abl/SRC but also inhibits other SFK members and growth factor receptor tyrosine kinases (RTKs), including c-KIT, c-FMS, PDGFRα and β, discoidin domain receptor-1, and Ephrin receptors.55,56 Dasatinib has demonstrated robust antiproliferative and antitumor activity against numerous hematologic and solid tumor cell lines in vitro, and exhibited in vivo activity in tumor xenograft models.55,56 In addition to promoting cell cycle arrest, growth inhibition, and the induction of apoptosis, dasatinib inhibited angiogenesis, cellular adhesion, migration, and invasion, and reduced osteoclast-mediated bone resorption and metastasis.55,56 The SRC family of protein tyrosine kinases (c-SRC, LYN, FYN, LCK, HCK, FGR, BLK, YRK, and YES) are nonreceptor tyrosine kinases that regulate the signal transduction of diverse receptors and intracellular pathways that modulate key cellular processes: growth, proliferation, differentiation, cell shape, adhesion, migration, invasion, angiogenesis, and cell survival.55,57 SFKs have been identified as cellular oncogenes implicated in the development and progression of many cancers, including colon, lung, pancreatic, breast, prostate, and melanomas.55,57–59 Dasatinib is approved for acute lymphoblastic leukemia (ALL) and chronic myelogenous leukemia (CML) that are Philadelphia chromosome positive. Clinical evidence suggests that TKI drugs are associated with adverse effects, including cardiotoxicity, cardiac dysfunction, and cardiomyocyte damage, that may result in cardiovascular complications. 60 Pooled safety outcomes from dasatinib clinical trials have produced mixed conclusions about the significance of cardiotoxicity. Single-arm dasatinib trials revealed a statistically significant QTc prolongation of 3–6 ms in the electroencephalograms (ECGs) of patients receiving dasatinib. The clinical significance of the QTc prolongation is unresolved, however, since only 1% of patients exceeded a clinically significant threshold of 500 ms, and only 2.9% experienced an elevation beyond a significant threshold of 60 ms from baseline. 60 Although 4% of patients treated with dasatinib experienced congestive heart failure or ventricular dysfunction, >50% of patients had a prior history of cardiovascular disease. The incidence of cardiovascular ischemia in patients receiving dasatinib was 2–4%; however, most patients had a history of or risk factors for atherosclerosis. When adjusted for age and sex, dasatinib-treated patients did not have a significantly higher risk of cardiovascular ischemia compared to control populations. Superficial edema (11%), fluid retention (27%), and pleural effusion (15%) were observed in the DASISION trial, and 36 months into the follow-up, pulmonary arterial hypertension (PAH) was identified in 3% of patients that received dasatinib. 60 Dasatinib product labeling currently includes warnings for fluid retention, cardiac ischemia, PAH, and QT prolongation. A search of the clinical trials database (clinicaltrials.gov) returned 294 studies for dasatinib individually (189) or in combination with other agents (105), in a variety of leukemias and solid tumor conditions. 56 Around 50% of the clinical trials investigating dasatinib administration either alone or in combination have been completed; ~25% were suspended, withdrawn, or terminated; and ~25% remain active, with 13% still in the recruiting phase. Six dasatinib studies were listed for melanoma: four for metastatic, recurrent, stage IIIA, or stage IIIB melanoma (NCT00700882, NCT01092728, NCT00436605, and NCT01916135, respectively); one in combination with dacarbazine (NCT00597038); and one with dendritic cell vaccines (NCT01876212). It is unclear whether dasatinib either alone or in combination will be approved for other indications such as melanoma, but it would seem prudent to exercise caution if using dasatinib combinations with cardiotoxic therapies or in patients with a history of cardiovascular disease, and to monitor cardiac function during therapy.
Several preclinical studies support the use of SRC inhibitors as therapeutic agents for melanoma.36,55,56,58,59,61,62 Melanoma cell lines and tumor samples express SFK members, and c-SRC expression is elevated compared to normal melanocytes.58,59 In 124 melanoma patient samples analyzed by immunohistochemistry, 77% of tumors were positive for c-SRC expression;
58
and in 35 samples from patients with primary cutaneous (13), mucosal (13), or metastatic (9) melanomas, 48% of biopsy samples were positive for activated SRC (SRC-pY416).
59
In this study, dasatinib produced GI50s ≤623 nM in five of six PDMCLs tested and a GI50 of 1.5 µM in the TPF-12-542 V600E-BRAF PDMCL (
Table 1
). PDMCLs WT for BRAF had greater than threefold sensitivity to dasatinib exposure compared to V600E-BRAF PDMCLs, and the GI50s for four of the six PDMCLs tested were at or lower than the clinically attainable 264 nM Cmax of dasatinib.
54
The dasatinib GI50 data in PDMCLs are in alignment with previously published studies in melanoma cell lines.58,59 In eight melanoma cell lines, three sensitive cell lines displayed >30% growth inhibition after exposure to 155 nM dasatinib for 5 days, while five resistant cell lines exhibited <25% growth inhibition after 5-day exposure to 310 nM dasatinib.
58
In another study, SFK inhibitors dasatinib and bosutinib inhibited the growth of three melanoma cell lines with IC50s in the 3–10 µM and 1–6 µM ranges, respectively.
59
In PDMCLs, vemurafenib produced GI50s in the 0.145 to 1 µM range, with two of the V600E-BRAF PDMCLs (TPF-12-207 and TPF-12-542) showing 3–5-fold more sensitivity to growth inhibition by vemurafenib (
Table 1
). PDMCL vemurafenib GI50s are substantially lower than the clinically relevant 127 µM Cmax of vemurafenib.
54
The two sensitive V600E-BRAF PDMCL vemurafenib GI50s are consistent with a study conducted in seven WT or 20 V600E mutant BRAF melanoma cell lines, in which vemurafenib sensitivity depended on V600E-BRAF but was independent of other gene alterations common in melanomas.
61
In that study, 18 of the 20 V600E-BRAF cell lines exhibited vemurafenib IC50s ranging between 0.01 and 1 µM, with two resistant V600E-BRAF cell lines producing IC50s ~10 µM.
61
Dabrafenib produced GI50s in the 0.012 to 0.13 µM range, with one V600E-BRAF PDMCL (TPF-12-510) demonstrating resistance to dabrafenib at concentrations ≤3.3 µM (
Table 1
). The same two V600E-BRAF PDMCLs (TPF-12-207 and TPF-12-542) exhibited 3–5-fold more sensitivity to growth inhibition by dabrafenib than PDMCLs WT for BRAF (
Table 1
). Dabrafenib GI50s in PDMCLs are much lower than the clinically achievable 4.86 µM Cmax of dabrafenib.
54
Trametinib produced GI50s in the 0.006 to 0.115 µM range in PDMCLs, with one V600E-BRAF PDMCL (TPF-12-510) demonstrating resistance to trametinib at concentrations ≤5 µM (
Table 1
). Again, two V600E-BRAF PDMCLs (TPF-12-207 and TPF-12-542) exhibited 3–5-fold more sensitivity to growth inhibition by trametinib than PDMCLs WT for BRAF (
Table 1
), and only these PDMCL GI50s were lower than the clinically relevant 0.021 µM Cmax of trametinib.
54
Dasatinib DCs with vemurafenib, dabrafenib, or trametinib synergistically increased PDMCL sensitivity to growth inhibition and enhanced cell death by activating apoptosis independently of BRAF status (
In the BP-WT mouse melanoma cell line, the average GI50s for dabrafenib, vemurafenib, trametinib, and dasatinib were 0.006 µM, 0.076 µM, 0.001 µM, and <0.005 µM, respectively (
Several RTKs have been implicated in melanoma growth and metastasis, including c-KIT, PDGFβR, and Eph receptor families, prompting the investigation of the broad-spectrum BCR-Abl/SRC inhibitor dasatinib that also inhibits SFK members, c-KIT, c-FMS, PDGFRα and β, discoidin domain receptor 1, and Ephrin receptors in the melanoma clinical context.55,56,58,63–65 In a Phase II study of 36 evaluable patients with stage III–IV chemotherapy and naïve unresectable melanomas, initially administered 100 mg of dasatinib twice daily, it was concluded that dasatinib had minimal activity in unresectable melanoma patients. 65 Two patients exhibited partial responses (response rate: 5%), three had minor responses, the median PFS was 8 weeks, and the 6-month PFS rate was 13%. 65 One patient with a c-KIT mutation had a partial response, while another showed disease progression. Dasatinib was poorly tolerated, requiring dose reduction to 70 mg or interruption due to adverse events (AEs), with the most common grade 3–4 AEs being fatigue, dyspnea, pleural effusion, nausea, and anorexia. 65 A Phase I clinical trial of dasatinib in combination with dacarbazine was conducted in 51 patients with stage III–IV unresectable melanomas. 63 Dose expansion cohorts at three levels were accrued, and dose-limiting toxicities were observed at dasatinib 70 mg PO b.i.d. (by mouth, twice daily) and dacarbazine 1000 mg m−2, with the most common grade 3–4 AEs (50% of patients) being neutropenia, anemia, and thrombocytopenia. 63 In 29 patients receiving dasatinib 70 mg PO b.i.d., the OR rate was 13.8%, the 6-month PFS was 20.7%, and the 12-month OS was 34.5%, and a Phase II dose of dasatinib 70 mg PO b.i.d. and dacarbazine 800 mg m−2 was recommended. 63 A Phase II trial of dasatinib was conducted in 57 patients with locally advanced or Stage IV mucosal, acral, or vulvovaginal melanoma. 64 Patients received 70 mg of oral dasatinib twice daily, and the worst degree of toxicity observed was grade 3 (44% of patients), with fatigue, dyspnea, nausea, anemia, and pleural effusion being the most prevalent AEs in patients. 64 5.9% of evaluable patients (51) achieved a partial response, all were KIT−, and in a second stage conducted in KIT+ patients, 18.2% of evaluable patients (22) achieved a partial response. 64 The median PFS was 2.1 months, and median OS was 7.5 months; both were independent of KIT status or subtype. 64 Due to the low accrual rate and modest clinical activity of dasatinib observed in unresectable KIT+ melanoma, it was recommended that imatinib remain the KIT inhibitor of choice for this patient population. 64 It was concluded that it will be critical to identify predictive mutational profiles and/or biomarkers for the future development of dasatinib in melanoma, either alone or in combination.55,56,58,63–65 In that respect, elevated expression of Annexin-A1 (ANXA1), Caveolin-1 (CAV1), and Ephrin-A2 (EphA2) proteins correlated with dasatinib sensitivity in melanoma cell lines, and 81%, 44%, and 74% of 124 melanoma patient tumor samples analyzed by immunohistochemistry were positive for ANXA1, CAV1, and EphA2 expression, respectively. 58
In a DC HTS campaign conducted in 10 NCI 60 cell lines, we identified and confirmed that DCs between the BRAFi vemurafenib and APE1 inhibitor AJAY4 synergistically inhibited the growth of the V600E-BRAF SK-MEL5 melanoma cell line, but not that of the WT BRAF SK-MEL2 cell line. 40 The synergy between vemurafenib and AJAY4 was confirmed in the V600E-BRAF MALME3M and SK-MEL28 melanoma cell lines, but was not observed in MCF7 or MDA-MB-468 breast cancer cell lines that are WT for BRAF. 40 In this study, however, the vemurafenib plus AJAY4 DC did not synergistically inhibit the growth of either WT or V600E-BRAF PDMCLs, which may reflect differences in the mutational profiles and/or signaling pathway alterations between PDMCLs and the SK-MEL5 cell line. SK-MEL5 cells were isolated more than 44 years ago, 66 and genomic comparisons between established cell lines and primary tumors have shown that while many (51%) genetic alterations may be shared at similar mutation frequencies, subsets of mutations are unique to patient tumors or cell lines, and those that are unique to cell lines favor immortalization and continuous maintenance in tissue culture. 67
The in vitro studies presented here provide a data-driven rationale to explore DCs between dasatinib and BRAFis or MEKis as candidates for melanoma combination therapies with the potential to improve outcomes and/or to prevent or delay the emergence of resistance. Effective DC strategies are also a focus of immuno-oncology research, either in combinations of immunotherapies or with small-molecule chemotherapies and/or targeted drugs.3,8,16,25,35 Several studies suggest that immune responses against mutant forms of BRAF can be harnessed in melanoma to boost antitumor immune responses. 68 Conversely, increased expression of mediators [interleukin-6 (IL6), IL10, and vascular endothelial growth factor (VEGF)] by V600E-BRAF melanoma cells could promote the recruitment of immunosuppressive myeloid-derived suppressor cells (MDSCs) and regulatory T cells (Tregs). 68 Clinically relevant concentrations of BRAFis do not affect the viability or function of lymphocytes, and BRAFi treatment of melanoma cell lines or primary tumor samples produced enhanced expression of melanocyte differentiation antigens (gp100 and MART1) important for immune recognition. 68 There is clinical evidence that melanoma treatment with BRAFis reverses some tumor-associated immunosuppressive signals but that the stimulation of immune responses subsides with the emergence of resistance and disease progression. 68 BRAFis and MEKis may condition the tumor microenvironment to favor immune activation by promoting antigen expression, antigen recognition, and T-cell infiltration. 68 Although it has been reported that dasatinib blocks T-cell activation by inhibiting LCK-mediated T-cell receptor signaling, administration of dasatinib in vivo can enhance T-effector-cell activation, expansion, and function. 69 In an M05 (B16.OVA) mouse melanoma model, 7-day administration of dasatinib combined with a dendritic cell–based vaccine against an OVA peptide epitope more potently inhibited tumor growth and extended OS compared to the individual treatment groups. 69 The combination of dasatinib plus vaccine treatment reduced levels of MDSCs and Tregs in the melanoma tumor microenvironment, and increased type 1 T-cell CXCR3 ligand-recruiting chemokines in the stroma, which correlated with recruitment and activation of type 1 CXCR3+CD8+ tumor-infiltrating lymphocytes and CD11c+ dendritic cells. 69 The combination of dasatinib plus vaccine treatment promoted a broader therapeutic CD8+ T-cell repertoire in both the draining lymph nodes and tumor. 69 In addition to their superior direct antitumor effects, DCs between dasatinib and BRAFis or MEKis might therefore also be beneficial in combination with immunotherapies. Some of the critical safety and efficacy factors that would need to be established for immunotherapies in combination with dasatinib plus BRAFis or MEKis will be optimal dosing, timing, and sequencing regimens. A critical next step for the studies reported herein will be to investigate whether dasatinib DCs with dabrafenib, vemurafenib, or trametinib exhibit enhanced in vivo outcomes in mouse melanoma cell line or PDMCL xenograft models and/or melanoma models of BRAFi resistance. For future DC HTS campaigns, it would be important to characterize the mutational profiles of the PDMCLs more extensively beyond their BRAF status to facilitate the investigation of the mechanism of action of synergistic drug interactions. Similarly, increasing the number of approved and/or investigational cancer drugs screened would improve the probability of finding novel DCs with potential to be developed into effective melanoma therapeutic regimens.
Supplemental Material
sj-pdf-1-jbx-10.1177_2472555220970917 – Supplemental material for Unbiased High-Throughput Drug Combination Pilot Screening Identifies Synergistic Drug Combinations Effective against Patient-Derived and Drug-Resistant Melanoma Cell Lines
Supplemental material, sj-pdf-1-jbx-10.1177_2472555220970917 for Unbiased High-Throughput Drug Combination Pilot Screening Identifies Synergistic Drug Combinations Effective against Patient-Derived and Drug-Resistant Melanoma Cell Lines by David A. Close, John M. Kirkwood, Ronald J. Fecek, Walter J. Storkus and Paul A. Johnston in SLAS Discovery
Footnotes
Acknowledgements
The authors would like to thank Cindy Sander, who provided the patient-derived melanoma cell lines, and Dr. Ron Fecek for providing the two murine melanoma cell lines, BP-WT and BP-R20.
Supplemental material is available online with this article.
Abbreviations
ABC: ATP-binding cassette
AE: adverse event
ALMANAC: A Large Matrix of Anti-Neoplastic Agent Combinations
ATP: adenosine triphosphate
BRAFi: B-Raf inhibitor
CI: combination index
CTG: Cell Titer Glo
DC: drug combination
DCM: drug combination matrix
DIIS: drug interaction index score
DMEM: Dulbecco’s modified Eagle’s medium
EGF: epidermal growth factor
EGFR: epidermal growth factor receptor
FBS: fetal bovine serum
FDA: US Federal Drug Administration
GI50: 50% growth inhibitory concentration
HTS: high-throughput screening
IC-MAbs: monoclonal antibody immunotherapies that block immune checkpoints
LC50: lethal concentration 50
MAb: monoclonal antibody
MEKi: MEK inhibitor
MOA: mechanism of action
NCI: National Cancer Institute
NCI 60: National Cancer Institute panel of 60 tumor cell lines
OR: objective response
OS: overall survival
PBS: Dulbecco’s Mg2+- and Ca2+-free phosphate-buffered saline
PDMCL: patient-derived melanoma cell line
PFS: progression-free survival
P/S: penicillin and streptomycin
RLU: relative light unit
TGI: total growth inhibition
TKI: tyrosine kinase inhibitor
V600E-BRAF: BRAFV600E mutation
WT: wild type
Declaration of Conflicting Interests
The authors declared no potential conflicts of interest with respect to the research, authorship, and/or publication of this article.
Funding
The authors received the following financial support for the research, authorship, and/or publication of this article: These studies were funded in part by a Developmental Research Project (PI: Paul Johnston) award from the SPORE (Specialized Program of Research Excellence) in Skin Cancer (P50 CA121973; PI: John Kirkwood) and an award (R01 CA214018; PI: Walter J. Storkus) at the University of Pittsburgh Medical Center and Hillman Cancer Center.
References
Supplementary Material
Please find the following supplemental material available below.
For Open Access articles published under a Creative Commons License, all supplemental material carries the same license as the article it is associated with.
For non-Open Access articles published, all supplemental material carries a non-exclusive license, and permission requests for re-use of supplemental material or any part of supplemental material shall be sent directly to the copyright owner as specified in the copyright notice associated with the article.