
Abstract
The identification of effective and long-lasting cancer therapies still remains elusive, partially due to patient and tumor heterogeneity, acquired drug resistance, and single-drug dose-limiting toxicities. The use of drug combinations may help to overcome some limitations of current cancer therapies by challenging the robustness and redundancy of biological processes. However, effective drug combination optimization requires the careful consideration of numerous parameters. The complexity of this optimization problem is clearly nontrivial and likely requires the assistance of advanced heuristic optimization techniques. In the current review, we discuss the application of optimization techniques for the identification of optimal drug combinations. More specifically, we focus on the application of phenotype-based screening approaches in the field of cancer therapy. These methods are divided into three categories: (1) modeling methods, (2) model-free approaches based on biological search algorithms, and (3) merged approaches, particularly phenotypically driven network biology methods and computation network models relying on phenotypic data. In addition to a brief description of each approach, we include a critical discussion of the advantages and disadvantages of each method, with a strong focus on the limitations and considerations needed to successfully apply such methods in biological research.
Keywords
Introduction
The benefits of using drug combinations to treat various complex diseases have become of major importance across many medical fields.1–3 This is particularly true in the case of complex disorders such as cancer, where some major obstacles restricting the efficacy and overall success of many treatments still exist.4,5 The introduction of targeted agents and genotype-based treatments for cancer has provided new avenues for the improvement of therapy.4,5 In contrast to chemotherapeutic treatment strategies, targeted drugs provide an increased level of selectivity toward malignant cells. This also applies to the development of genetic biomarkers, which identify the patient subgroups that are most likely to benefit from a given therapy. The clinical application of genomic data and targeted agents has shown some important successes in treatment efficacy and overall patient survival.6–8 Even so, there still remain major limitations to the use of single targeted agents. The development of drug resistance to targeted agents appears to be almost inevitable. Moreover, the “one-size-fits-all” approach in cancer therapy, where all patients are given the same treatment based on their cancer type, does not seem to be an adequate treatment strategy. Therefore, the need for personalized medicine approaches is becoming more obvious.
Optimized drug combinations (ODCs) may help to overcome some of the above-mentioned limitations by challenging the robustness and redundancy of biological processes. 9 Major advantages of combination therapies are based on the fact that treatment options and parameters can be “fine-tuned” for optimal therapy, and eventually even patient tailored as an approach to personalized medicine. Thus, the optimal treatment strategy can be designed in a way that the therapeutic effect would be maximized via the exploitation of synergistic drug interactions, while limiting side effects. Moreover, the presence of synergy leads to enhanced therapeutic efficacy, allowing for drug dose reductions. It has been proposed that the enhanced selectivity seen with drug combinations may be related to the fact that drug–drug synergies are largely a result of multitarget interactions, in which case, one would “expect synergies to occur in a narrower range of cellular phenotypes.” 2 Additionally, it has been suggested that combination therapies may carry reduced risks for the development of acquired drug resistance.10,11 For example, the probability of developing two (or more) sequential mutations, or a single mutation that is capable of conferring resistance to multiple agents, is much lower than the chance of developing a single mutation against a single drug.11,12 Moreover, it is believed that robust biological networks may be more vulnerable to multiple weaker interactions than one strong intervention: “a robust network is fragile to the malfunction of multiple nodes, a phenomenon known as ‘fail-on’ failure.” 13
In order to effectively optimize a drug combination to treat a complex disease, numerous parameters 14 must be correctly addressed ( Fig. 1 ). These include (1) the drugs or treatment modalities; (2) the relative drug dose ratio, as synergistic, additive, or antagonistic drug interactions are largely dose dependent; (3) the treatment schedule, that is, concurrent or sequential drug administration; (4) the administration route; (5) the treatment history; (6) genotypic information; and (7) the disease stage. In addition, treatment decisions in clinical settings must be defined in a timely and robust manner, and may need to be adapted over the course of treatment based on the patient’s response.
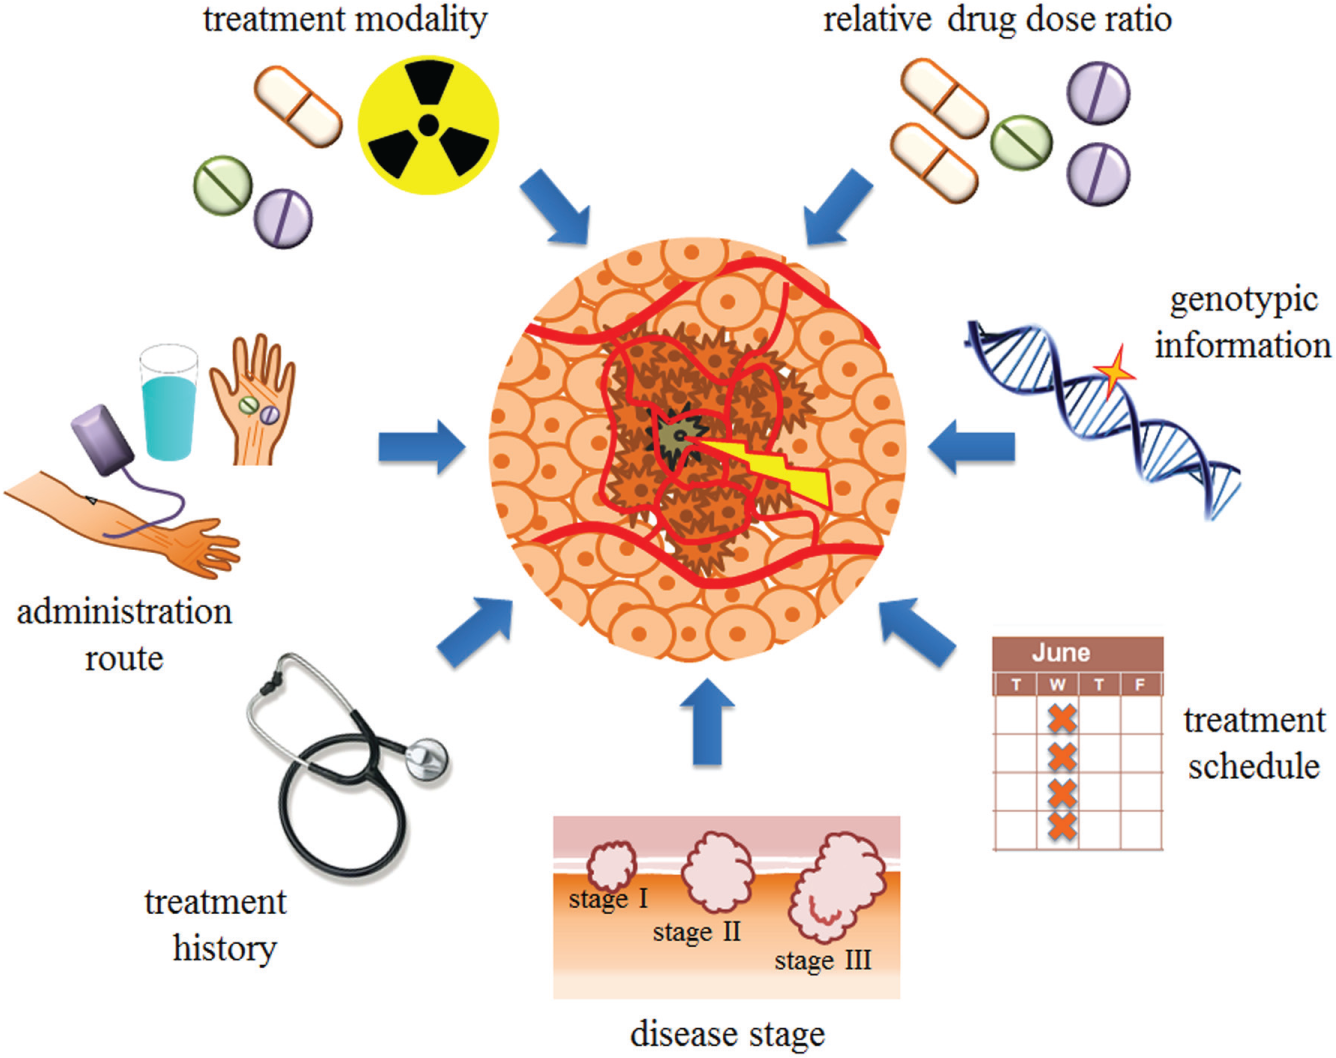
Schematic overview of parameters to consider when effectively optimizing a drug combination, including the drugs or treatment modalities; the relative drug dose ratio, as synergistic, additive, or antagonistic drug interactions are largely dose dependent; the treatment schedule, that is, concurrent or sequential drug administration; the administration route; the treatment history; genotypic information; and the disease stage.
The first combination therapies for cancer were developed in the 1960s and were generally based on the ideology that increased efficacy could be attained by combining multiple agents known to be active as single drugs at their maximal tolerable dose (MTD).
15
This approach is still largely applied in clinics today, where the design of combination therapies is largely based on nonsystematic approaches utilizing clinical experience gained from treatment with individual drugs.16–18 This may, at least in part, explain the clinical failure of many combination therapies due to intolerable toxicity.18–20 Another possible explanation for the limited success of previous clinical trials may be the incomplete preclinical testing of drugs on cell types with diverse genotypic signatures or the ability to correlate patient response with genetic markers. Most clinically approved anticancer drugs are only tested on a few genetic backgrounds before being administered in patients.
21
On a larger scale, a genotype-based approach may be fundamentally limited due to the genetic instability of cancer cells, which mutate quickly in response to the therapy. Moreover, tumor heterogeneity and tumor cell subpopulations are believed to play a key role in the eventual failure of many therapies.
22
The lack of overwhelming success of genotype-based medicine has also led to the debate of the missing heritability in complex disease, such as the phenotypic effects of epistasis, the effects of large genomic variants, including deletions, inversions, and copy number polymorphic duplications.23,24 As the following quote reflects, the problem of precision medicine is much greater than one of genomics alone and will require the integration of many types of patient data:
A defining assertion of precision medicine is that genomics—no matter how powerful or economical—is far from sufficient to understand human physiology and pathophysiology. Myriad other components—molecular, developmental, physiological, social and environmental—also must be monitored, aligned, and integrated in order to arrive at a meaningfully precise and actionable understanding of disease mechanism and of an individual’s state of health and disease.
25
Along with empirical and genotype-based approaches for treatment design, alternative methods using phenotype-based screens are gaining attention, not only in the field of cancer research.26,27 For example, in a study on the use of combination therapies to target antibiotic-resistant bacteria, using CombiGEM methodology, researchers looked for genes that could infer increased sensitivity to clinically used antibiotics. 28 It was believed that this method could help in analyzing multifactorial genetics, where “epistatic interactions between genes have been suggested to account for part of the ‘missing heritability.’”24,28 The authors highlighted the limitations of characterizing disease based on a single gene mutation and support the power of a phenotype-based approach: “CombiGEM can reveal unexpected interactions between pathways yielding strong phenotypes and empower system-biology approaches to uncover network interactions.” Moreover, an adapted approach based on this method may be applicable to cancer research where changes in cancer cell sensitivity to drugs could be assessed depending on different gene knockdown models.
Genotype-based approaches generally are classified as bottom up ( Fig. 2 ). Here, the system is divided into smaller parts (subunits), and the activity of the entire system is based on understanding each subunit and how these subunits interact with each other. Alternatively, a phonotype-based approach can be viewed as top down. The cell system is then treated as a “black box,” and the aim is to determine an input–output relationship that can be used to describe or control overall cell behavior without the necessity of defining the underlying mechanisms. A bottom-up approach generally carries a greater experimental burden and reduced computational requirements, while a top-down approach requires the opposite. Moreover, there are methods positioned at the interface of these two approaches, where some mechanistic or network topology information is integrated into a model, which is derived or trained based on phenotypic response data.
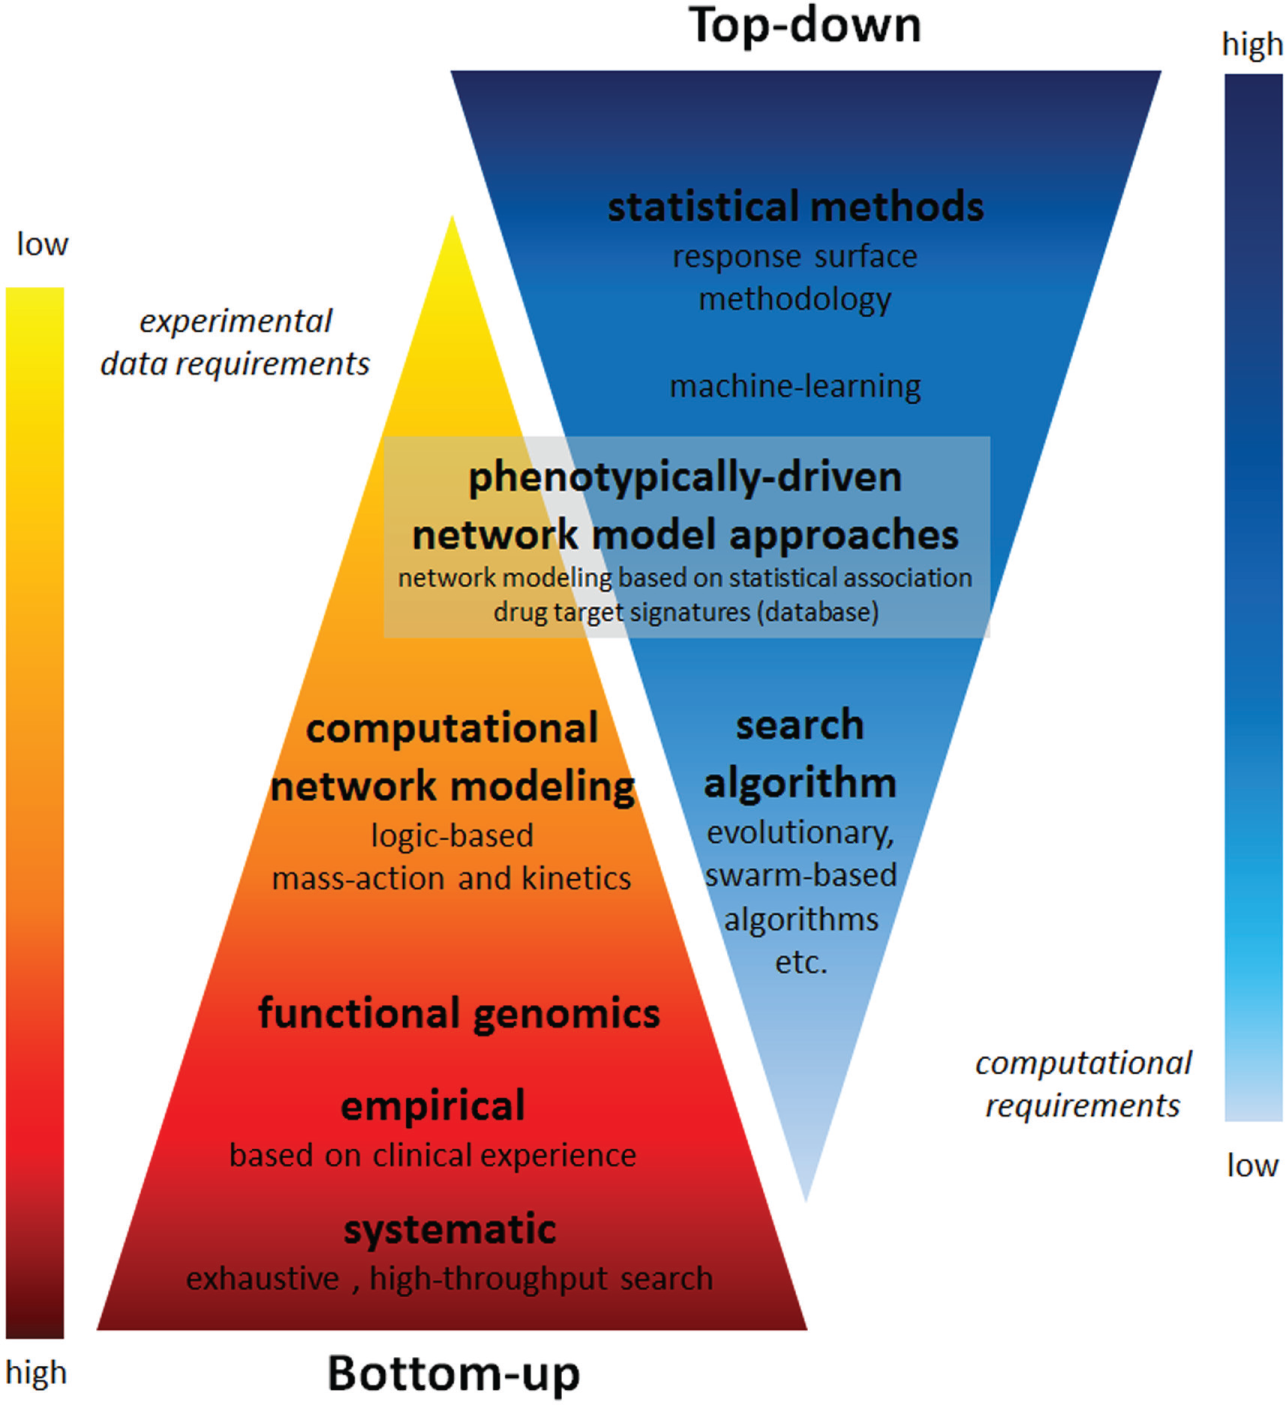
Overview of top-down and bottom-up optimization techniques presented with regard to their experimental data requirements and computational requirements.
In the current review, we present the available phenotype-based approaches for multidrug combination optimization that could particularly be used in the field of cancer research. A brief description of each methodology will preface each section, followed by a review of its recent applications and the major findings associated with these studies. Phenotype-based screening approaches will be presented as three different groups ( Fig. 3 ):
Section 1: Modeling methods where the input–output relationship between drug combinations and cell fate are determined based on various data modeling techniques. This section will be further broken down into two categories: statistical modeling methods (1.1) and machine learning techniques (1.2).
Section 2: Model-free approaches based on biological search algorithms.
Section 3: Merged approaches, particularly phenotypically driven network biology approaches and computation network models relying on phenotypic data.
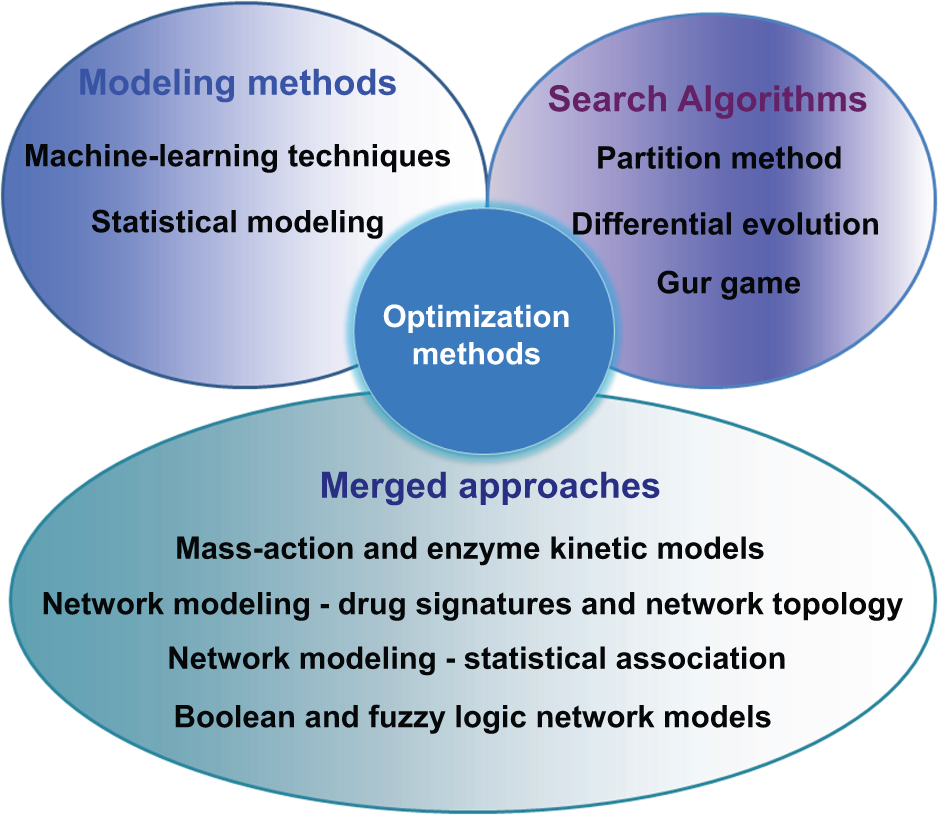
Overview of optimization techniques described in the text.
Finally, a critical discussion of the advantages and disadvantages of each method will be provided, including important concerns for their application in biological research and the experimental design considerations needed for their successful application.
Modeling Methods
Data modeling has been extensively used to analyze component interactions in various fields, including statistics, risk assessment, and toxicology. The application of such techniques in biological research hinges on one major assumption: that complex cell behavior can be accurately described and predicted based on statistical models. Moreover, the question arises as to what type of model is sufficient and/or most appropriate to represent such data. Many research groups have shown that simple linear regression models, including only single-drug and two-drug interaction terms, are sufficient to predict the activity of larger drug combinations,29,30 while other studies propose that the use of more complicated methods requiring larger volumes of data, such as machine learning techniques, is needed to truly predict complicated biological activities. The complexity of a studied model has a direct link to the quantity of experimental data points required for its definition (i.e., to define model coefficients or for training). The model complexity can therefore be prohibitive in a biological setting, and even more so in a clinical setting, where time and the limited number of test subjects are major considerations. For these reasons, the data modeling techniques are presented here as two major subtypes based on their data input requirements: statistical methods, which generally aim to minimize data input requirements (section 1.1), followed by the machine learning approaches (section 1.2).
Statistical Modeling
One of the main approaches to develop statistical models of input–output relationships in complex systems is through the use of response surface methodology (RSM). RSM is a collection of statistical procedures originally proposed by Box and Wilson. 31 It is based on performing series of designed experiments in order to define conditions or parameters that obtain an optimal system response. This method has since been widely applied in various fields of science and engineering, particularly for chemical and biochemical process optimizations. 32 The application of RSM to optimizing drug combinations for clinical cancer therapy has only briefly been investigated,33–36 culminating in a pilot clinical trial in squamous cell carcinoma patients. 37 While the sample size was too small to yield statistically significant survival analysis, this study demonstrated the usefulness of such an approach for the design of clinical studies.
Modeling can be achieved with linear or quadratic regression models. Additionally, more complex models have been proposed that incorporate properties designed to better describe the in vivo response surface. The main parameters to consider when applying a statistical modeling method are: (1) the type and number of data points that should be obtained, (2) the type of model to be used, and (3) assessment of the accuracy and predictive power of the selected model. In their first publication, Box and Wilson proposed the use of a second-order polynomial model; 31 however, this was mainly in regard to the optimization of chemical processes. The inclusion of nonlinear terms in biology is still debated. 38 Some studies have reported accurate predictions based on the weighted sum models, including single-drug and interaction terms; however, many argue that nonlinearities are almost certainly present. It is generally accepted that the dose–response curve of a single compound is sigmoidally shaped; thus, the extension of this curvilinearity to a higher-order model including multiple drugs seems applicable. 39 On a similar note, a concern for the inclusion of third-order terms could also be raised; however, it is generally considered that the third- and higher-order terms hold only negligible information.30,40 Therefore, a balancing of trade-offs between increased model accuracy and increased requirements for experimental data will likely play a role in the final model selection.
Linear regression models, including only single-drug and two-drug interaction terms, have been shown to be useful in describing and predicting the effects of multidrug combinations. The success of such an approach is dependent on the fact that complex cellular behaviors can be modeled with relatively low-order models.29,30 Wood et al. showed that the effect of multidrug combinations in killing bacteria could be predicted based on only the single- and two-drug interactions. The authors estimated that the pure three-drug interactions contained a negligible amount of the information (~3%). 30
Moreover, Geva-Zatorsky et al. examined the effects of 2-, 3-, and 4-drug combinations of 13 drugs on the levels of 15 proteins in human cells. 29 They showed that the protein dynamics in combinations could be predicted based on the weighted sum (linear superposition) of individual drug responses, with the exception of 1 out of the 13 compounds, which did not follow the linear superposition rule, possibly due to nonlinear terms that were not accounted for in the models. Pritchard et al. also showed that combinations of chemotherapeutic drugs may act as a linear combination of the action of each of the compounds in a homogeneous tumor. 41 Chen et al. used the statistical design of experiment (DOE) approach with a fractional factorial design to test drug combinations and modeled the data by stepwise regression analysis to identify synergistic antibiotic combinations. 42 In this study, the authors analyzed combinations of three, five, and six drugs, considering each drug at three doses. A major goal was to identify underlying drug synergies; thus, the lowest drug dose was set at zero and the highest dose was selected to be “smaller than the minimum inhibitory concentrations.” The data were modeled using both fractional regression and quadratic response surface models, and in all cases, the most potent interaction identified was a synergistic two-drug interaction, an interaction that was subsequently confirmed in vitro. The following two modeling techniques were investigated: factorial regression to analyze the main effects and interaction terms, and quadratic response surface regression to assess the main interactions and quadratic terms, which allowed for the assessment of nonlinear effects. The use of two modeling techniques provided redundancy, as the regression analysis was only considered valid when both models converged to the same results.
We have also recently investigated the use of linear regression models in the design-optimal drug combinations 38 ( Fig. 4 ). Similarly to Chen et al., 42 a DOE approach was used, but with an orthogonal array composite design (OACD), which contains both a two-level fractional factorial design and a three-level orthogonal array. 43 This design allows for the estimation of single-drug first-order terms and two-drug interaction terms based on the two-level fractional factorial design, as well as the first- and second-order single-drug terms based on the three-level orthogonal array. Therefore, the design allows for cross-validation of the model accuracy as multiple different analyses can be performed on different parts of the data ( Fig. 5a ). The inclusion of second-order single-drug terms was deemed appropriate due to the assumed curvature of the drug response surface. Data analysis is based on fitting the experimental data to second-order linear regression models. Model analysis and the elimination of outlier data points is then achieved globally through the analysis of the coefficient of multiple determination (R2), root mean square error (RMSE), and the correlation between fitted and observed data points ( Fig. 5b ), as well as through the visualization of residual plots, Cook’s distance plot, normal Q-Q plot, and residual histogram ( Fig. 5c ). Through a series of designed experiments and data analysis based on regression modeling, we were able to eliminate ineffective and/or antagonistic compounds from the initial 10-drug pool and identify a subset of three to four effective and synergistic drugs for the design of an optimal drug combination toward viability inhibition of renal carcinoma cells. 38 Silva et al. undertook a similar approach in the optimization of drugs targeting tuberculosis. 44 Starting from 14 drugs in various stages of clinical development, a four-stage optimization was performed: (1) determination of the dose–response for each compound, (2) a screening test using a two-level orthogonal design matrix for a first-order model to eliminate compounds, (3) an iterative step testing subsets of compounds (selected in step 2) using an OACD design with quadratic response surface analysis, and (4) final optimization of the drug combination and drug dose ratios. This method led to the identification of a very promising drug combination, which is currently being tested in clinical trials.
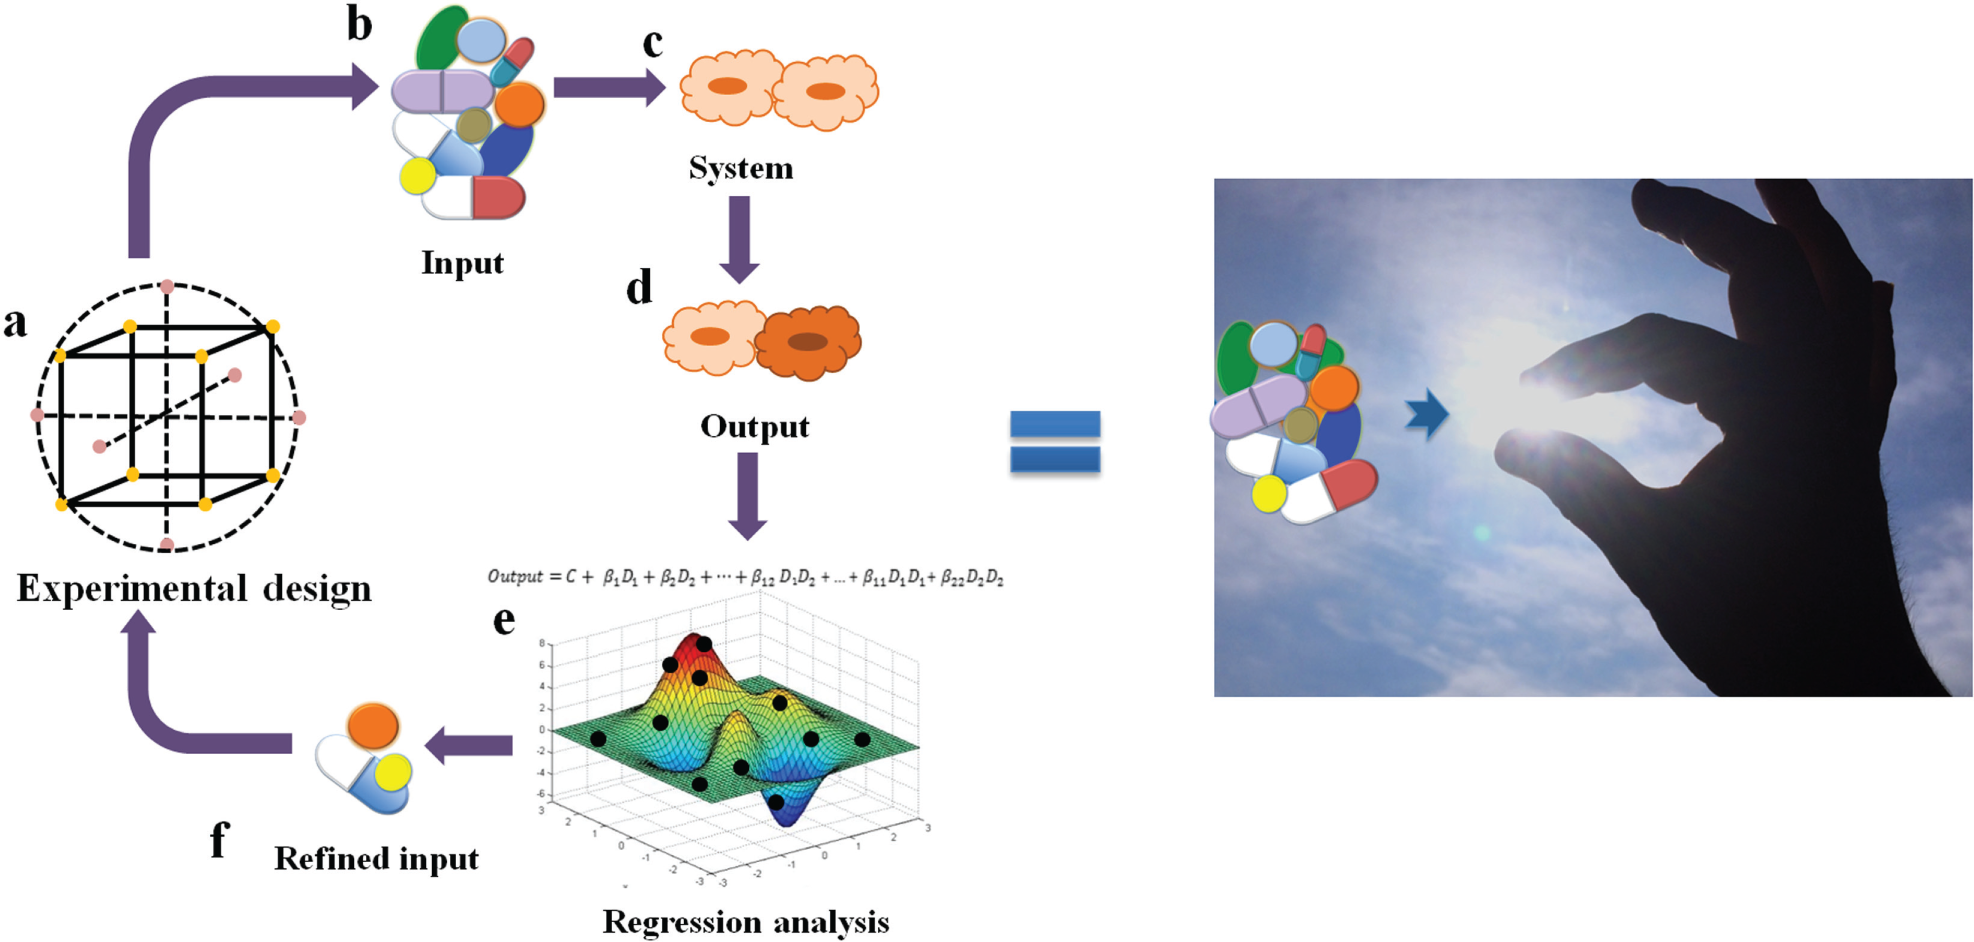
Schematic representation of the sensor by feedback system control technique. The statistical DOE (
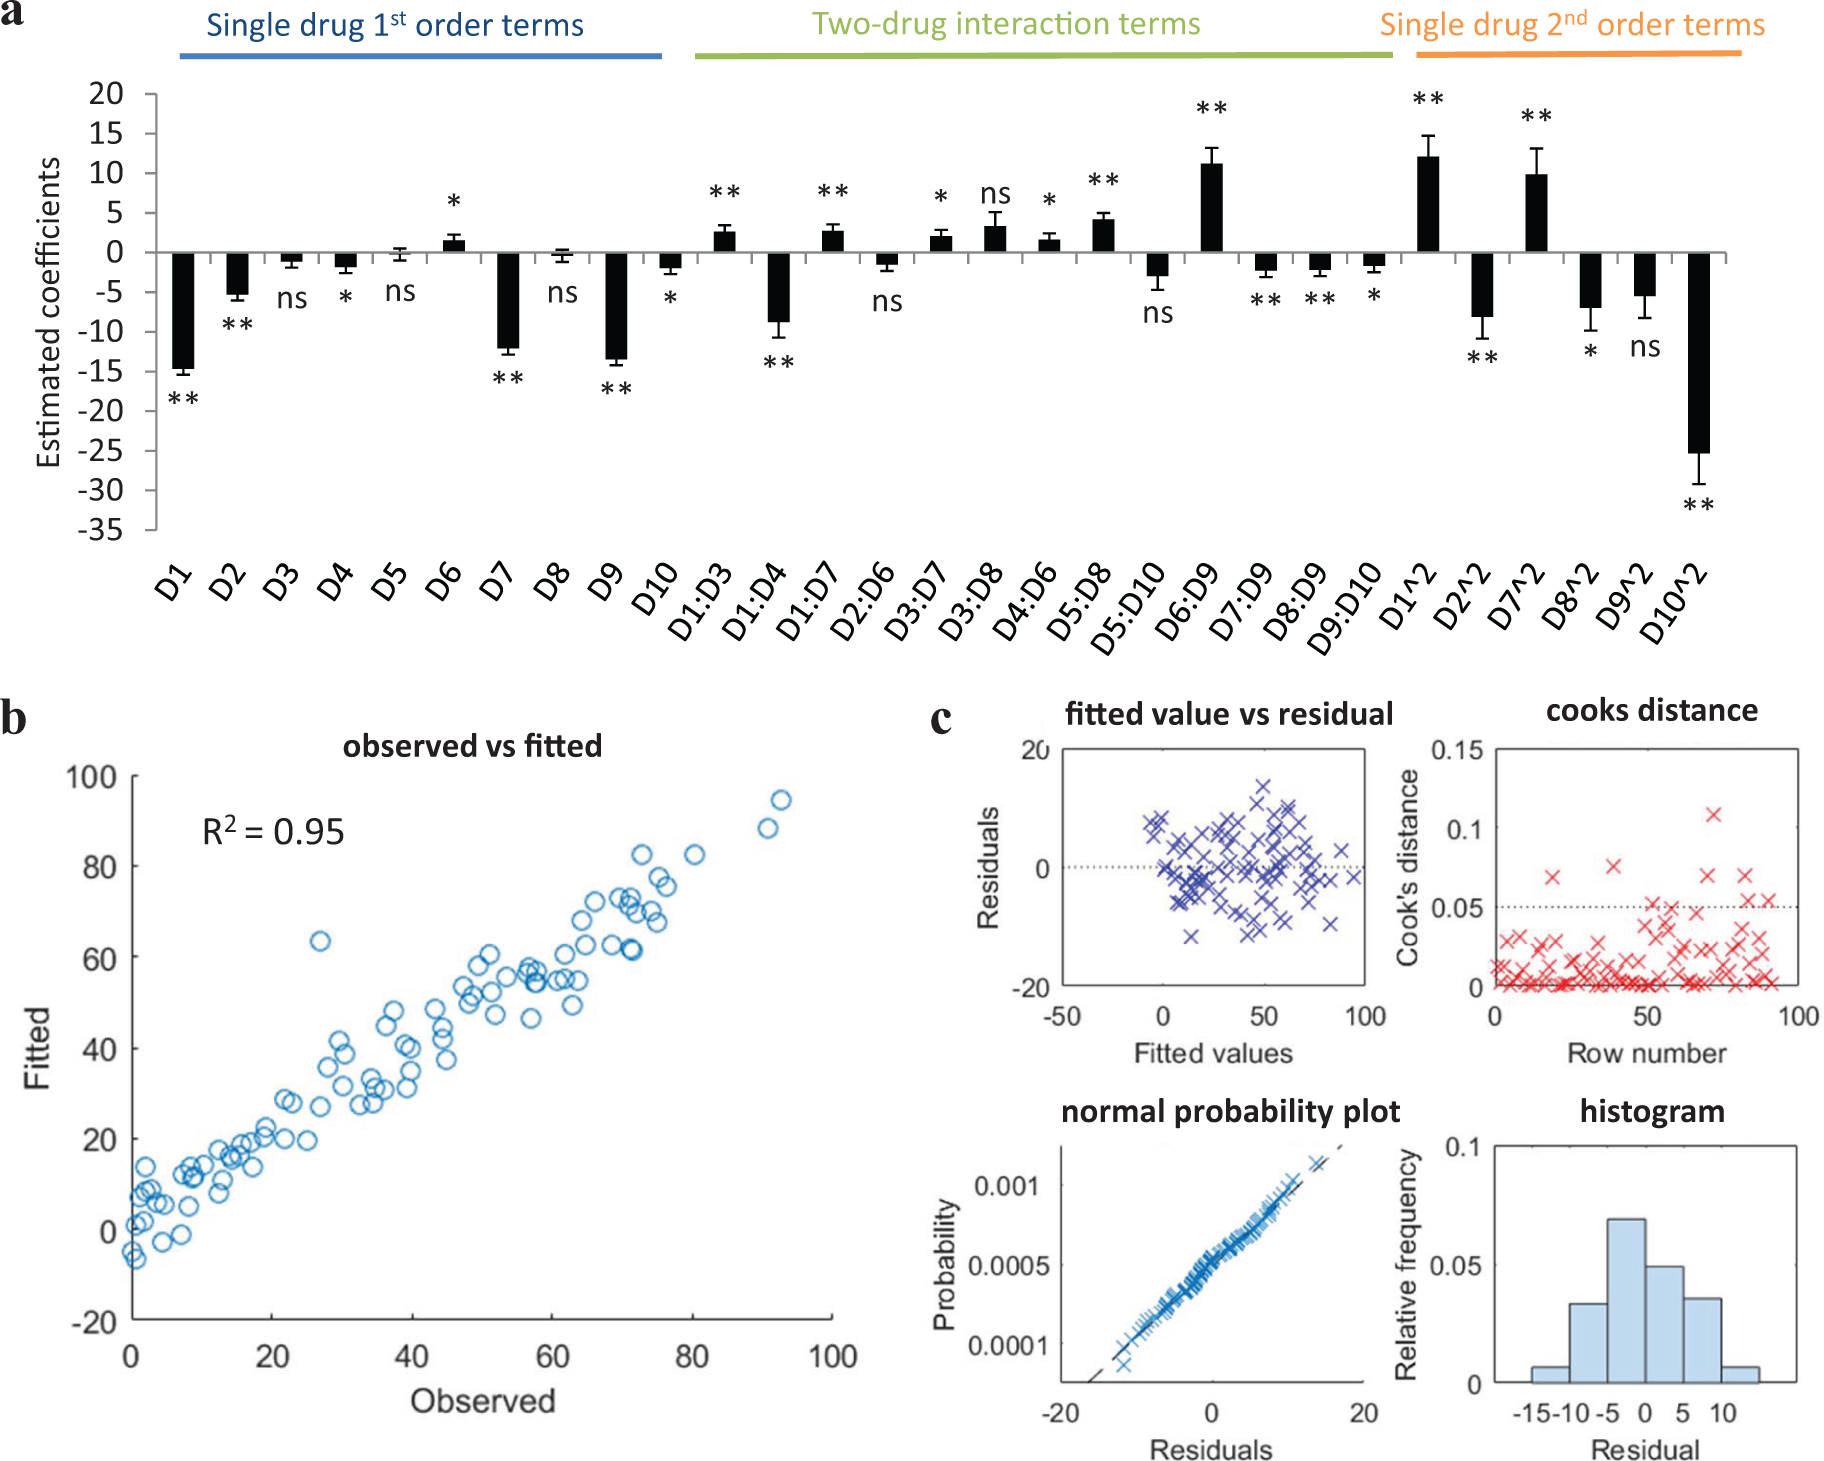
Overview of regression analysis for a 10-drug mixture. (
Wang et al. used Latin hypercube sampling in order to build the surface of the therapeutic index (defined as the difference in response between three control cell lines and three breast cancer cell lines) of cells in response to four chemotherapeutic agents, three of which were loaded into nanodiamonds. 45 The four compounds were considered at seven doses each, and a total of 57 drug combinations were tested, representing 2.4% of all the possible drug combinations. Once the response surface was plotted, the differential evolution search algorithm was used to identify the global optimum after only one experimental iteration.
Lombardi et al. applied a statistical model to integrate information on the combination of antiplatelet drugs acquired from three sources: activator–inhibitor combinations, inhibitor–inhibitor synergy screens, and activator–activator synergy screens. 46 The activator–inhibitor data were modeled using a forward stepwise multiple regression approach where the main effect terms were fixed and interaction terms were added one at a time if they significantly improved the model. As such, the model containing only the main effect terms explained 68% of the variance or activity, while the addition of four interaction terms raised this value to 73%. Subsequently, an integrated model was generated for all three data sets. The predictive power of the model was tested based on in vitro testing and confirmed the accuracy of the integrated model.
Pivetta et al. analyzed two-drug combinations based on 60 experimental data points selected using the DOE approach. 47 Their primary goal was to use the artificial neural network (ANN) model, a machine learning approach, to analyze this data; however, third- and fourth-order linear regression models were also developed from the data as a point of comparison. While these models showed very accurate fits to the experimental data of the training set (R2 from 0.9972 to 0.9993), the fit of the validation and test data sets was considerably lower (R2 from 0.8870 to 0.9869). They concluded that there was a problem of overfitting of the data, resulting in irregularly shaped response surfaces.
Regression models have also been applied to other fields of biological research, for example, to make correlations between genotype and phenotype. In the study of Van der Borght et al., a stepwise linear regression model was used to identify mutations in HIV-1 viral genotype to predict a drug-resistant phenotype. 48 A second-order model, without including single-term quadratic terms, was used and mutations, as well as interaction terms, were selected based on applying threefold cross-validation (i.e., splitting data into training and test groups to validate the predictive power of the model). One of the main goals was to reduce the complexity of the model while maintaining accuracy. Based on the models generated, novel mutations were successfully identified that were associated with resistance.
Others have also proposed the integration of linear regression models with models that are characteristically used to describe biological relationships, such as a sigmoidal response curve. Extension of the classic sigmoidal model (eq 1) to describe multidrug combinations was achieved by Minto et al.
49
through the introduction of a new parameter,
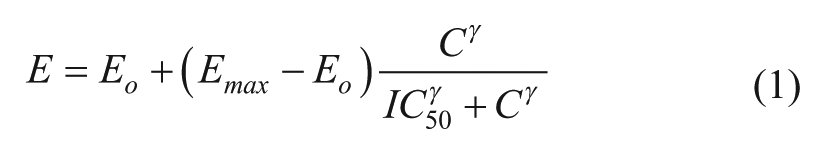
where Eo represents the baseline effect with no drug,
Ning et al. proposed a similar method with the use of the form of a Hill-based model 50 (often used in biochemistry and pharmacology to describe ligand binding, eq 2 51 ):
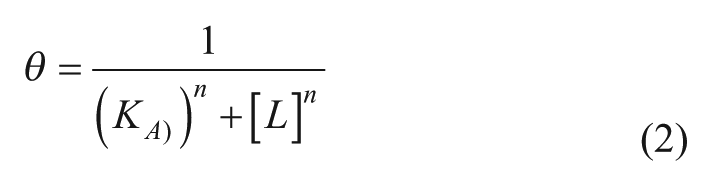
where θ represent the fraction of a receptor protein’s binding sites that are occupied by the ligand, [L] is the concentration of free unbound ligand, KA is the concentration of ligand resulting in half occupancy of the binding sites, and n is the Hill coefficient. Their model is proposed to overcome the major limitation of the polynomial and the simple Hill model, that is, the boundless nature of the polynomial model as drug doses increase, which restricts its predictive power to the experimental dose range, allowing the Hill model to be applied to drug combinations of higher order and at non-fixed-dose ratios. Briefly, it is a global model assuming the parameters of the original Hill function; however,
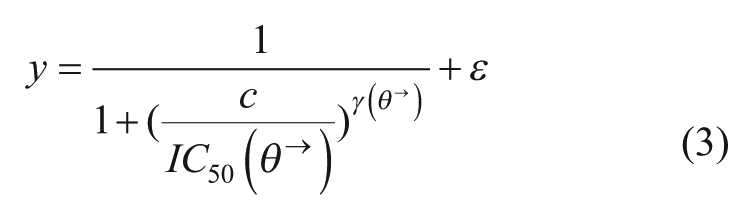
for a multidrug combination of k drugs, where the concentration of each drug (Ci),
Finally, a model-based approach has also been applied in patients following liver transplant surgery in order to obtain a personalized medicine approach to select the dosage of immunosuppression medications. 54 The authors developed a parabolic personalized dosing (PPD) platform for each patient based on the standard three-drug combination therapy generally administered. This method is based on fitting the patient’s response (a phenotypic output such as tumor size, cell viability, or pathogen load) to a second-order polynomial equation, which depends on the dose of each compound being administered. In this study, the blood plasma trough level of one of the immunosuppressive drugs is monitored as a phenotypic response, due to the fact that the target plasma range is already known for clinical applications and could be used as the optimization goal. Treatment was initiated based on the physician-guided standard of care dosing for the first 3 days, during which time plasma levels were monitored and used to fit the parabolic response curve. The number of days/data points needed to fit the curve depends on the number of variables being optimized. The dose of only one of the three compounds was optimized here, therefore requiring the estimation of three regression coefficients (intercept and first-order and second-order single-drug effect). This model was then used to predict the optimal drug dosage to obtain the desired blood plasma trough level of the compound. This method was successfully applied in four patients and, when compared with four other patients treated with standard regimen, revealed a reduction in the average time that patients had drug levels outside of the desired trough level range (54.2 ± 4.27% vs. 72.6 ± 14.3% in PPD and standard treatment groups, respectively) and significantly reduced the variability between patient responses in the PPD-treated groups.
The above-mentioned studies indicate that quadratic response surfaces are capable of capturing the complexity of biological responses, and that this analysis aids in the optimization of drug combinations. It is generally known that second-order terms are necessary to successfully describe combination drug activity; however, higher-order terms do not appear to be necessary. Moreover, the study of Pivetta et al. 47 indicated that the use of higher-order terms may not be appropriate in biological applications, as it resulted in the overfitting of data. A variety of sampling techniques based on DOE have also been successfully applied, indicating that their use in biological applications is appropriate and effective. Moreover, it seems that the accuracy of these linear models can be further improved upon by incorporating second-order linear response terms for compounds into the structure of well-known biological response models, such as the Hill form or sigmoidal model. These models appear to capture the complexity of drug–drug interactions (DDIs) while maintaining a more biologically shaped response surface, particularly in regard to their activity at the lower and higher bounds, that is, as drug doses approach zero or infinity.
Machine Learning Techniques
Various machine learning techniques have been applied to biological optimization processes. Generally, machine learning algorithms are data driven and learn to make associations between input and output variables based on training data sets. The most common machine learning algorithm applied in biology is the ANN model. Machine learning approaches can be very effective in biological applications, as they are capable of mimicking and predicting the behavior of highly complex, nonlinear systems. They require, however, a large amount of input data for model training, compared with other methods, such as statistical modeling methods (section 1.1) or search algorithms (section 2).
The ANN model is “a learning system based on a computational technique which can simulate the neurological processing ability of the human brain.” 55 Generally, the ANN consists of an input layer, one or more hidden layers, and an output layer. Each layer contains units (representing neurons) and links between the units (representing synapses). These networks are trained using data sets in order to assign different strengths or weights to each link or synapse in the model. This allows the network to learn an approximate nonlinear relationship between the input and output variables. Overall, the process is similar to least-squares fitting (model fitting by minimizing the sum of the squared residual), as it optimizes a set of weight values to minimize the squared error between the observed and predicted values in the output layer of neurons.
There are only a few studies that implement machine learning to evaluate drug interactions for optimizing drug combinations. Pivetta et al. applied the DOE together with ANN to evaluate synergistic drug interactions in various two-drug combinations. 47 The authors developed an alternative definition for drug synergy (referred to as the net multidrug effect index [NMDEI]) based on the difference between the nonalgebraic additive effect and experimentally obtained activity of drugs in combination. A nonsymmetric experimental design was selected to sample 60 data points for each two-drug combination (including single-drug data points), out of which 25 data points were used as the training set, 24 as the validation set, and 11 as the test set. An ANN was then developed using a standard back-propagation training algorithm based on the criteria of minimizing the RMSE. It was determined that a three-layer structure (one input, one hidden, and one output) with four or five neurons in the hidden layer was sufficient to model the drug combinations considered. Overall, the ANN models showed very accurate fits and response surfaces were developed based on combination efficacy and synergy. Experimental validation of the model-predicted optimal combinations showed high accuracy of the predicted solutions.
In another approach, Cheng et al. applied various machine learning approaches in order to make predictions about drug interactions based on information concerning drug properties. 56 More specifically, they employed a heterogeneous network-assisted inference (HNAI) framework, which is developed based on the information of DDIs between 721 approved drugs and including 6946 DDIs (using a range of agents from the DrugBank database). Drug–drug pair similarities were assessed using the following criteria: (1) phenotypic similarities (based on adverse drug reactions network), (2) therapeutic similarity (based on the drug Anatomical Therapeutic Chemical Classification System), (3) chemical structure similarity (based on SMILES data), and (4) genomic similarity (based on drug–target interaction network built using the DrugBank and Therapeutic Target Database). Five different machine learning approaches, that is, naïve Bayes, decision tree, k-nearest neighbor, logistic regression, and support vector machine, were applied to the HNAI network developed for the data set of antipsychotic drugs identifying a DDI that has previously been reported in the literature. Moreover, Cheng et al. indicated that two drugs have a higher probability of DDI if they have increased similarity in terms of the four above-mentioned classifiers analyzed. This observation was further confirmed in another study where machine learning technology was used to determine the relationship between drug interactions and similarities in molecular structure. 57
Machine learning algorithms have frequently been applied in various other fields of oncological research, for example, in the processes of drug discovery,58,59 pharmacokinetics optimization of drug formulations, 55 diagnostic application,60,61 and the classification of cancer types based on genomic data. 62 One study applied machine learning algorithms using neural networks to predict cancer cell sensitivity to drugs based on cell’s genomic features and chemical properties of the candidate drugs. 63 In this study, data from the Genomics of Drug Sensitivity in Cancer (GDSC) database were used. 64 Considering only genomic cell line features as input parameters resulted in a model with very limited predictive power. Therefore, additional inputs of drug properties were also included. Finally, the model contained the genomic characterization of 608 cell lines and the chemical properties of 111 drugs. The network was trained using data of the activity of the drugs in different cell lines, together with almost 40,000 IC50 values, representing approximately 58% of the total data. Subsequently, the model was capable of predicting IC50 values of cell lines not used in training data sets with relatively good accuracy (R2 = 0.61).
Machine learning techniques have more frequently been applied in the field of virology, particularly in the prediction of drug sensitivity and resistance development for HIV therapy.65,66 Altmann et al. applied five different machine learning techniques (linear discriminant analysis, least-squares regression, linear support mechanisms, decision trees, and logistic regression) to identifying genomic predictors of virus response to drug combinations. 65 In this study, the authors showed that the selection of the predictors has more effect on the predictive power of the model than the type of machine learning technique selected. More specifically, inclusion of phenotypic, as well as evolutionary, information was more effective than using evolutionary information alone. Bickel et al. applied a multitask learning approach to predict therapeutic success of drug combinations for HIV patients given their genetic background and treatment history. 66 This study is of relevance to the problem of optimizing cancer drug combinations, as one of the major problems faced was the limited training data available. Data obtained from the EuResist project67,68 contained almost 53,000 treatment records of 16,999 patients. This overwhelming amount of data was addressed by applying multitask learning by distribution matching. This method improved the accuracy of model predictions by 10%–14% compared with independently trained models.
ANNs have also been clinically implemented to aid in treatment decisions. For example, PAPNET is a Food and Drug Administration–approved system using an ANN to identify cells with the most abnormal appearance from vaginal smear slides to be further examined by experts. 69 ANNs have also been evaluated for aiding in treatment decisions for prostate cancer patients, 70 that is, to predict biopsy results and treatment outcome after radical prostatectomy based on the results of screening tests (prostate-specific antigen [PSA] and digital rectal examination).
Summarizing, machine learning algorithms have not been frequently used for the optimization of multidrug combinations. This is likely due to the relatively large data requirements for model training. 66 As nowadays genomic and drug target data are becoming more readily available through online database sources, there may be an increased interest in applying machine learning techniques to combinatorial drug design. However, due to the variability of biological data and the importance of experimental settings and procedures, it may be unlikely that the reproducibility of data will allow for the merging of different preclinical data sources. On the other hand, the use of clinical data for such applications may be possible due to higher levels of conservation in regard to practice and reporting methods.
Search Algorithms
An alternative phenotype-driven approach for drug combination optimizations is through the use of search algorithms. Search algorithms are a type of heuristic, global optimization technique that optimize a function given input values and selected criteria. Major considerations for the application of the search algorithm approach include: (1) the type of search algorithm, (2) the influence of noise on the successful exploration of the search space, and (3) the discretization of the input data, that is, how many drug doses to consider for each compound, the efficacy of each compound, and so forth. The discretization of input parameters addresses the problem of resolution in the search. If the resolution is too large, the optimum could be missed; alternatively, if the resolution is too small, additional experimental effort may be required to identify the optimum. As in the regression analysis method described above, this again brings us back to drawing the line between accuracy and loss of time/effort due to collecting unnecessary data.
One of the first attempts to apply a search algorithm in the optimization of drug combinations for cancer treatment was published by Berenbaum in 1990 on the combination of chemotherapeutic agents to treat mice inoculated with L1210 leukemia cells. 71 In this study, the partition method was developed. This method is based on testing a group of drug combinations and selecting the direction of the next step in the search based on the therapeutic response surface. This was done by partitioning the combinations in half, into the most and least effective groups, and moving along the line joining the mean positions, the so-called centroids, of these two groups. Additionally, to reduce toxicity, movement down the toxicity response surface was used instead of movement down the therapeutic surface. This method was developed as an improvement over the triangle method, which tested three combinations and always discarded the least effective one. The triangle method, however, was proven to not have enough robustness against noise to be applied in a biological system. The partition method was compared with the Nelder–Mead method 72 and Box method 73 in mice inoculated with L1210 leukemia cells and resulted in fewer toxicity-related deaths. The partition method was subsequently applied directly in patients to optimize a combination of analgesic drugs following major abdominal surgery. 74 One hundred ninety patients were included in the study. The first phase of the procedure was to identify six empirically designed drug combinations that did not show unacceptable side effects. In the second phase, the optimization was performed, where the regiments were ranked from best to the worst, partitioned into two groups, and a new regiment was developed based on eq 3:
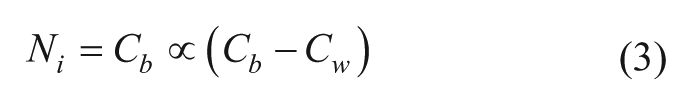
where Ni represents the new regiment, Cb and Cw represent the mean value of each variable in the best and worst partitioned groups, and α is a constant that describes the rate of convergence. The new regiment was tested in the next group of patients. If the new treatment did not cause side effects, it was accepted, while the single worst combination from the previous group was discarded. The optimization procedure appeared to be effective, bringing a reduction in side effects, as well as a reduction in the mean number of doses required.
An improved version of Berenbaum’s algorithm 75 was proposed and applied by Sveticic et al. in patients following lumbar or hip surgery. 76 This was achieved via the following adaptations to the method: (1) selection of the optimal number of analgesic drug combinations to be included in each stage of the search, as well as the number of patients to be included per combination, was based on a previous study; 74 (2) a new partitioning method using a probability model that gives a more accurate estimate of the centroid of each group was applied; and (3) the combinations were ranked based on the distribution of scores instead of just the average score. The search was initiated with 8 drug combinations, and a total of 12 drug combinations were investigated (i.e., 4 during the optimization process), leading to a combination of 2 drugs at a 1:1 ratio. The treatment with the optimized two-drug combination resulted in very low pain scores and a low incidence of side effects, albeit at higher concentrations than used in the original eight combinations tested.
To the best of our knowledge, search algorithm–based optimizations have yet to be evaluated in the clinic for the optimization of cancer therapies. However, they have been the subject of many preclinical studies. Calzolari et al. applied a sequential decoding algorithm originally developed for digital communications for the problem of drug combination optimization. 77 Generally, the algorithm uses a tree to represent the space of possible drug combinations. Combinations are represented as nodes linking to all possible additions of one drug in the next level, where single drugs form the base of the tree and combinations with the maximum number of drugs are at the top. The tree is explored from the bottom up, giving more weight to the lower-order drug interactions. The algorithm starts at the base of the tree by testing all two-drug pairs and incrementally adds drugs at a given dose to the most effective pair. If adding a drug does not bring a benefit to the response, the algorithm backtracks to the previous node. The ability of the algorithm to backtrack to the previous node allows for the algorithm to deal with nonlinearities in the response. This algorithm was tested based on simulations in two different computational models for heart function in Drosophila melanogaster and for in silico apoptosis network analysis in lymphoma cells. The apoptosis predictions showed more effective cell viability inhibition than randomly selected combinations. Disadvantages of this algorithm include 78 (1) the push toward multidrug combinations based on the assumption that a larger drug number in the mixtures would give better activity than a mixture composed of less drugs, and (2) the limitation on the size of the search space, as the computational power and memory grows significantly with larger starting sets of drugs.
Genetic algorithms, the most common type of evolutionary algorithms, have also been applied to drug combination screenings. These algorithms randomly vary a drug combination in each “generation” of the algorithm based on the information gained from the previous experiment. The selection of the better response is generally based on best performance. Genetic algorithms generally have lower computational requirements than other algorithms; however, they can become trapped in local maxima/minima and may perform poorly in a noisy system.
The Gur Game stochastic search algorithm was successfully applied by Wong et al. in the optimization of an antiviral drug cocktail against vesicular stomatitis virus infection in NIH 3T3 fibroblasts. 79 The algorithm was applied in a closed-loop optimization process resulting in the rapid identification of highly effective drug combinations obtained in only 10 iterative cycles of experimental effort and composed of drugs administered at significantly reduced doses. Unlike the genetic algorithms, the Gur Game algorithm, due to its stochastic nature, is thought to be relatively robust to noise and unlikely to become trapped in local maxima/minima. A limitation of the Gur Game algorithm is the need to normalize the cellular response, which can be difficult in situations where the range of response values is unknown 78 and can affect the performance of the algorithm. 80 Yoon proposed a modified version of the Gur Game algorithm where the reward state transition is not predetermined, but adapts based on the previous drug response. 80 This additional information allows for the interpretation of how the concentration change of a specific compound influences the efficacy of the combination. Although both algorithms turned out to be highly effective, the new algorithm showed a higher success rate of identifying the top 5% of drug combinations and required fewer iterations than the Gur Game algorithm. Moreover, the new algorithm was less sensitive to the normalization of the cell response. 78
The differential evolution algorithm has been successfully applied to various optimization problems by various groups, including the maintenance of human embryonic stem cells, 81 the optimization of an antiviral drug combination to inhibit herpes simplex virus type 1 infection, 82 and the identification of optimal ion concentrations to maximize sensitivity and detection time for the electrochemical aptasensor of BoNT Type A detection. 83
We used differential evolution, together with linear regression modeling of the in vitro inhibition of endothelial cell (EC) viability, in order to effectively target in vivo tumor angiogenesis. By iterative in vitro testing of EC viability and algorithm-based analysis, this procedure identified an optimal, low-dose three-drug combination. This synergistic combination therapy was successfully translated into several in vivo tumor models. 84 Drug doses in the optimal drug combination (ODC) were reduced by 5- to 11-fold, compared with optimal single-drug concentrations. In another study, we identified a drug combination showing strong synergistic activity on human endothelial (ECRF24) and human ovarian carcinoma (A2780) cell viability inhibition. This two-drug combination was equally effective toward A2780 and A2780 cis-platinum resistant cells, as well as in in vivo tumor models. 85
Tse et al. applied a memetic algorithm (MA) to a three-drug schedule optimization of chemotherapeutic agents whose response in tumor growth inhibition was defined based on mathematical models developed based on the clinical oncological data. 86 They developed an algorithm that maximally exploited two important design features of global search algorithms: exploration (which allows the algorithm to identify the global optimum) and exploitation (which allows the algorithm to search in the neighborhood of the optimal solutions in order to identify possible improvements). The MA is a combination of an evolutionary algorithm with a local search method, which can effectively improve the solution by searching locally. Finally, iterative dynamic programming (IDP), a local search strategy based on Bellman’s dynamic programming, was integrated with an adaptive elitist genetic algorithm (MA-IDP). The algorithm was able to successfully solve the schedule optimization of three-drug combinations of chemotherapeutics and outperformed both the IDP and adaptive elitist genetic algorithms when used individually.
Zinner et al. applied a search strategy called medicinal algorithmic combinatorial screen (MACS). 87 The MACS is based on a genetic algorithm called a hill climbing search algorithm that attempts to identify the optimal combination by an iterative process of changing one element at a time in the mixture and accepting combinations with an improved “fitness function.” The fitness function took into account the inhibitory effect of the drug combination, as well as a penalty for each drug included to compensate for different-sized mixtures. The authors discussed that other algorithms may be more successful to search in the complex landscape. Indeed, Park argued that an algorithm such as the Gur Game algorithm would be more effective, as it looks for the new combination that is most likely to have increased fitness, as opposed to looking at all neighboring drug combinations by changing one drug at a time. 78 Additionally, the authors claim that it is quite likely that the algorithm does not identify the optimal drug combination, but may fit an existing drug combination or identify the drug combinations that are better than the randomly identified ones. Therefore, Park and colleagues proposed a novel approach with the use of an information-theoretic active learning paradigm to select data points to be tested applied under a Gaussian process (GP). 88 The GP regression is a nonparametric technique, which does not require optimization to follow a predetermined model, but requires the selection of a covariance function. This is achieved by applying a GP prior to an unknown function f(x), representing the biological system’s response to drug cocktails. The function f(x) is then characterized with minimal data by sampling based on an information-theoretic approach, which selects the next input in such a manner that the expected information gain (or expected change in entropy) is maximized. This approach was used for optimizing a drug combination targeting three nodes in the epidermal growth factor receptor (EGFR) signaling network based on monitoring three downstream output variables (or targets). A response is represented by a nonlinear function (eq 4):
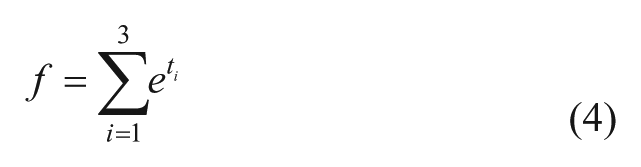
where ti represents the three target values. The method was compared with a genetic search algorithm and randomly selected drug combinations based on 50 experimental data points (in the GP, 45 data points were used to characterize the function f(x) and the last five experiments were used to identify the optimum). This approach outperformed both the genetic algorithm and random sampling by identifying a more effective combination. Moreover, it required fewer experimental values to optimize in different conditions than the above-mentioned methods. The same authors also applied the GP to model the system based on continuous drug dose combination inputs. 78 This allowed bypassing the problem of dose discretization, which can be prohibitive in higher-dimension optimizations, or sensitivity of the system to changes in which the drug dose is unknown. Thus, the authors apply a GP to model the effect of drug combinations as continuous inputs. The optimization is performed based on an expected improvement criterion using a hybrid Monte Carlo algorithm, and the GP is marginalized out when determining the criteria using a particle filter. The efficacy of the method was demonstrated in a fully factorial Drosophila data set, an antiviral data set for herpes simplex virus type 1, and a simulated human apoptosis network, and was compared with the performance of the Gur Game algorithm. Park’s algorithm resulted in a rapid and steady convergence to the optimal solution and identified more effective combinations than the Gur Game algorithm. Moreover, the oscillation of response seen in the Gur Game search made the convergence to the optimal solution harder to identify.
Merged Approaches
In the previous sections, we have addressed the purely top-down methodologies focused on determining the input–output relationship that can be used to describe and/or predict behaviors by using statistics, machine learning, or search algorithms. In the subsequent section, we address the bottom-up approaches, such as network topology or systems biology approaches, but with a focus on methods whose development and/or characterization is phenotypically driven, resulting in a merged top-down/bottom-up approach.
At its origin, the network modeling approach is based on a bottom-up methodology, as it aims to predict cell behavior based on developing a detailed topology map of cellular pathways and interactions. System biology models are frequently based on mass action or enzyme kinetic models and can require a substantial amount of experimental data in order determine all rate constants and parameters. Moreover, network modeling is dependent on knowledge of the network topology, which, if incomplete or incorrect, may lead to erroneous interpretations. Therefore, the application of systems biology networks to predicting optimal drug combinations and dosage regimens may be difficult. This approach, however, can be very useful in developing generalized theories about network interactions or underlying mechanistic generalizations that may be exploited for optimal therapies.
The network model approach can be subdivided into multiple categories requiring varying amounts of experimental data and computational efforts. For example, logic-based models have a reduced requirement for experimental data, as they utilize the network topology where pathway behavior is controlled by Boolean logic gates (i.e., modeled as AND, OR, or NOT) instead of ordinary differential equations (ODEs), therefore eliminating the need to estimate network parameters. A review discussing systems biology approaches for the analysis of drug combinations and synergies was recently published. 89 Network modeling approaches have been applied in conjunction with top-down approaches in order to help predict model constants or train network relationships based on experimental data. In the subsequent sections, we present some examples of how these models can be phenotypically defined or how they can be combined with other optimization techniques to simplify and/or expedite the development of the network model.
Mass Action and Enzyme Kinetic Models
Iadevaia et al. applied a network modeling method based on mass action modeling, where the model parameters were determined using a particle swarm optimization technique to train the model using experimental data, and the model was then used to predict optimal drug combinations. 90 This method was applied to the insulin growth factor (IGF-1) signaling network in a breast cancer cell line using a reverse-phase protein array to measure changes in protein phosphorylation after stimulation of IGF-1. First, a simplified mass action ODE model of the IGF-1 signaling network was developed containing 41 chemical reactions, 65 ODEs, and 161 unknown model parameters. The unknown model parameters were then approximated using the particle swarm optimization technique applied to the time course of six readout proteins based on 126 experimental data points. Simulated annealing and genetic algorithms were also tested but were outperformed by the particle swarm optimization technique. The most influential combinations of single targets were identified by comparing the model parameters determined by the particle swarm optimization with randomly sampled model parameters that restore the signaling output to a user-defined state. This analysis led to the prediction that the combined inhibition of PI3K/AKT and MAPK pathways would optimally inhibit aberrant signaling pathways based on the identification of the following most influential targets: p-IGFR, p-IRS-1, p-MEK, p-MAPK, and p-AKT. This prediction was experimentally validated based on measurements of target protein phosphorylation and cell viability assays. The combination MEK and mTOR inhibition was tested as a comparison and shown to be ineffective at decreasing phosphorylation of the key output proteins (and increased phosphorylation on nontarget proteins) and rescue cells from cell death in vitro, resulting in increased cell viability when a MEK inhibitor was added to mTOR inhibition. Moreover, modeling results suggested the limitations of targeting single molecules, due to the fact that nontargetable molecules may be activated in a negative feedback loop, limiting overall efficacy.
Zhang et al. studied how varying pairs of parameters in different network motifs can alter the synergy or antagonism of the network’s response to different stimuli. 91 Ten common network motifs were described using first-order ODEs. Notably, they identified certain common network motifs that are more likely to enhance synergy and may be good targets for combination therapy. For example, they identified mutual inhibition feedback loops and inhibition between a downstream target and an upstream element as good combination targets. They proposed that these motifs might help to prevent the saturation of target activation, thereby enhancing synergy. The authors also noted the sensitivity of synergy to the strength of the stimulus and to feedback or feedforward interactions between elements and their targets, attributing the behavior to saturation of the signaling cascade.
Araujo et al. proposed a mathematical model of the EGFR signaling network to study the effects of administering multiple targeted small-molecule agents in combinations. 92 They showed that the attenuation of a biochemical signal is much more effective when blocking multiple upstream processes instead of just one. In particular, blocking serially connected processes had synergistic effects on downstream signals, partially attributed to the highly nonlinear relationships between kinetic parameters and signals. Moreover, a desired response could also be achieved by blocking multiple nodes with reduced doses, compared with the dose required to achieve the same response with a single agent.
Facchetti et al. applied an algorithm based on flux balance analysis (FBA) to investigate drug synergies based on inhibiting the metabolism of cancer cells while preserving the metabolism of healthy cells. 93 FBA is a method of mathematically modeling the metabolism on a genome level by developing metabolic networks containing all known metabolic reactions and the genes that encode each enzyme. It is generally considered to have low computational and data input requirements compared with traditional modeling methods. 94
Boolean and Fuzzy Logic Network Models
Although the use of Boolean logic gates allows for the use of network topology knowledge while reducing the complexity of parameter predictions, results of such models can be more difficult to interpret due to discretization of continuous variables (such as drug concentrations), sensitivity of the model predictions to temporal updating schemes (steady-state solutions can be predicted but predictions of dynamic reactions in time is limited), and lack of compatibility with other system analysis tools (such as quantitative sensitivity analysis).95,96 These limitations have been addressed by using piecewise linear differential equation models97,98 or continuous approximations of Boolean functions. 99
One such approach to overcome the limitations of Boolean logic gates is proposed by Kraeutler et al. and is based on the use of normalized Hill differential equation modeling and logic AND/OR operators. 96 The authors applied this method to modeling the cardiac β-adrenergic signaling pathway. The activity and interactions of network nodes are modeled using normalized Hill functions using three reaction parameters: the reaction weight (W), the half-maximal effective concentration (EC50), and the Hill coefficient (n). A reaction time constant (T) and species maximal fractional activation (Ymax) is used to describe the activity of each species, and finally, cross talk between species is modeled as continuous functions similar to Boolean AND/OR gates. Default values can be used for these parameters, or they can be estimated based on experimental data to refine the model (in the current example, 11 parameters would need to be estimated, compared with 88 parameters in the biochemical model). The pathway topology was generated to reflect previously published models, and default parameters were used to compare the model predictions with those of previously validated biochemical models. Quantitative sensitivity analysis showed “substantial quantitative agreement” between the outputs of the two models even though default parameters were used for the model. Although the authors noted some limitations, the method outperformed piecewise linear, Hill, and linear activation functions.
Aldridge et al. applied fuzzy logic operators to network topology maps in order to reduce the number of parameters required to describe the interactions between the tumor necrosis factor (TNF), EGF, and insulin receptor pathways. 100 Contrary to Boolean logic, where variables take “crisp” values (AND/OR/NOT), fuzzy logic allows variables to take a range of values (e.g., any real number from 0 to 1), which may be more realistic for biological applications. The authors proposed the use of fuzzy logic models, as they may provide a more flexible option for biological applications that can be applied to qualitative and noisy data, and still provide quantitative predictions, as well as insight into properties of biological signaling networks.
Network Modeling Based on Statistical Association and Search Algorithms
Instead of starting from an assumption of the network topology, one can take the opposite approach of trying to define the network topology based on patterns or correlations in experimental data. Ryall and Tan applied such an approach in attempting to link five phenotypic regulatory shape features (area, perimeter, form factor, elongation, and integrated intensity) of myocytes associated with cardiac hypertrophy with the transcription levels of 12 genes after the application of 15 hypertrophic agonists based on statistical association. 101 Hierarchical clustering was performed for each agonist at an intermediate dose based on the number of fold change in mRNA abundance and shape, compared with the control myocytes. Output data were normalized (mean of zero and standard deviation of 1, in order to compare outputs with varying effect sizes), and k-means clustering (a partitioning method where data are classified into one of k-groups) of data was applied to identify strongly correlated input and output modules. Five input and five output modules were identified, where lines between species within a module had p < 0.01 as a correlation. Maladaptive outputs tended to group together, while beneficial outputs also grouped together, as well as with fetal genes. Input and output modules were connected by calculating the median normalized fold change in output between input–output pairs within an input and output module. The selection of combination therapies was then guided by the selection of targets that support beneficial outputs and the avoidance of maladaptive outputs.
Molinelli et al. adapted a similar approach using the belief propagation (BP) algorithm in order to infer de novo the computational network model based on in vitro cell inhibition that could then be utilized to design drug combinations. 102 This method was applied to the signaling pathways in a BRAF-mutant melanoma cancer cell line to develop a network model containing both known and novel pathway interactions. Their approach applies a method from statistical physics, and it is based on calculation of the probability distribution of all the possible interactions in the network. Subsequently, a set of the most probable solutions is selected based on sampling the probability distributions. BP is an iterative algorithm that is applied as a local optimizer to update the probability distributions of model parameters individually. This model was capable of predicting proteomic and phenotypic responses to drug combinations.
Nelander et al. derived a computational modeling approach using differential equation models developed based on combinatorial perturbation experiments to develop a platform referred to as combinatorial perturbation-based interaction analysis (CoPIA). 103 This was achieved by developing a network where nodes represent molecular concentrations or levels of activity and edges represent the influence of one node on the time derivative of another. The evolution of the system over time could then be modeled via differential equations with the addition of nonlinear transfer functions for nonmodelable system properties (i.e., epistasis and downstream effects). An optimization algorithm (a combination of a gradient descent method and a Monte Carlo process) was then applied to select the model that most accurately reflected experimental data. Thus, this method is capable of developing a network model of signaling pathways and phenotypic output based on the experimental results of drug combination perturbation experiments in cells via reverse engineering. This method was applied in the MCF7 breast cancer cell, and the results showed remarkable similarities with known network models of the regulatory pathways in this cell line. Importantly, the inclusion of nonlinear model components reduced the prediction error by up to 50%.
In a subsequent study, a refined version of the above-described platform was applied to finding drug combinations that target resistant melanoma cells. 104 This version incorporated previous knowledge of the network pathways from signaling databases and used a computational tool referred to as pathway extraction and reduction algorithm (PERA). Moreover, proteomic data (50 phospho- and 88 total protein measurements) were integrated with five phenotypic responses of cell cycle progression (G2M, G1 arrest, G2 arrest, S arrest, and viability) after perturbation of cells with 89 two-drug combinations or single drugs. In order to address the problem of model complexity, a network modeling algorithm based on BP was applied in order to search the possible network models based on probability distributions representing the set of network models with the lowest error. 102 The network model predicted an effective combination of c-Myc with either BRAF- or MEK-targeted therapies, a prediction which was experimentally validated.
Network Modeling Based on Drug Signatures and Network Topology
Tyner et al. applied an approach integrating network topology with phenotypic cell responses to drugs and preexisting information about drug targets. The authors tested the sensitivity of samples obtained from 151 leukemia patients to 66 different small-molecule tyrosine kinase inhibitors (TKIs) and applied an algorithm to use this information to predict kinase pathways that would be sensitive to inhibition. 105 The algorithm applied the available information about the target kinases of different inhibitors. By cross-referencing the efficacy of different compounds with the partially overlapping target spectra, the algorithm could be used to predict underlying kinase sensitivities in different cells. From the 151 samples tested, 70% showed a hypersensitivity to one or more drugs; moreover, 40% of the samples showed sensitivity to 1 of 9 clinically approved compounds included in the screen. These results clearly indicate “the need for a personalized approach to application of kinase-targeted therapies.” Moreover, this method could be useful in identifying subsets of kinases that are frequently malfunctioning in certain cancer types. It is interesting to note the limited input data that are required in this methodology, that is, only single-drug sensitivities and drug targets to obtain relatively complex analysis of drug-sensitive pathways in different cells.
Pal et al. also used the kinase inhibitor profile of drugs to build sensitivity maps for cell lines based on tumor cell line or animal model’s sensitivity data to different kinase inhibitors. 106 The kinase inhibiting maps were constructed as circuits based on Boolean logic and given the following assumptions: (1) if all pathways are inhibited by blocking a set of kinases, blocking more kinases will not open new pathways, and (2) if blocking a set of kinases does not inhibit all pathways in the circuit, then blocking fewer kinases within this set will not inhibit all pathways. These sensitivity maps were then used to predict the response of cells to new drugs and drug combinations, and to predict which kinases need to be blocked in order to prevent tumor growth. The models were validated using experimental data from four canine osteosarcoma cell lines with 36 targeted drugs interacting with 317 kinases. A high level of accuracy was achievable in predicting the sensitivity of cancer cells to targeted agents.
Tang et al. proposed an improvement over this approach by developing the target inhibition inference using maximization and minimization averaging (TIMMA) algorithm, 107 reducing the computational cost and increasing the prediction accuracy compared with the algorithm of Pal et al. A measure of cell sensitivity to each compound (such as the IC50 or the area under the dose–response curve) was correlated with the targets of each drug mapped into a drug–target inhibition profile to predict the efficacy of new drug combinations. The inhibition profile of each drug combination is assumed to be the union of the individual inhibition profiles used for each drug. Importantly, the network models must be simplified when creating these profiles. Thus, a sequential forward-floating search algorithm was used to select the target to be included in the model for each cancer cell line. The novel maximum and minimum prediction-averaging rule helped TIMMA to overcome possible limitations of the simplified assumptions made between drug targets and cancer cell phenotypes. TIMMA was successfully applied to identify various effective drug combinations for breast and pancreatic cancer cells, showing an ability to identify targets that are essential for cell survival, as well as synergistic drug interactions.
Gujral et al. applied an elastic net regularization to mRNA expression profiles and phenotypic response data of six cell lines in response to inhibition by an optimal set of kinase inhibitors in order to define a set of important drug targets for combination therapy based on target deconvolution. 108 First, an initial set of 178 initial compounds was reduced to 32 kinase inhibitors based on principal component analysis (PCA) of the interaction map (explaining 80% of the variance of the data). Out of these, the top 16 kinase inhibitors (selected based on the B4 forward selection procedure) were included for future screening with 16 additional reasonably selected inhibitors. Subsequently, these kinase inhibitors were screened at a concentration range in six different cell lines in regard to phenotypic response in cell migration and additionally in a kinase inhibitor activity interaction matrix assessing the activity on 300 kinases. Elastic net regularization (a method that regresses one target variable, i.e., phenotypic response, as a function of multiple predictor variables, i.e., activity of each kinase) was applied to model the phenotypic response as a linear function of the kinases, which were each defined based on the interaction map between drugs and kinases. Finally, variable selection was used to select the kinases (not inhibitors) that had the strongest effect on explaining the phenotype. Many of the identified kinases were already established as carrying an important role in cell migration, while many of the newly identified targets were experimentally validated.
A unique approach by Zhao et al. allowed for the prediction of effective drug combinations based on molecular and pharmacological data. 109 Drugs are represented by a set of descriptors: target proteins and downstream pathways, indications for use, therapeutic effects (based on the Anatomical Therapeutic Chemical Classification System), and side effects. Descriptor pairs represent two descriptor variables, each associated with a different drug, respectively. Thus, drug combinations are represented as vectors of descriptor pairs. By studying the patterns of descriptors appearing in already approved drug combinations, new combinations could be predicted.
Finally, the topological relationship or closeness of drug targets has also been used to define potential drug interactions and synergies.110,111 Wang et al. developed a “drug cocktail” network based on pathways exploited by effective drug combinations. 111 Their study analyzed combinations based on their protein targets and the genetic interaction networks, showing that in effective drug combinations, the distance between the proteins targeted by each drug is shorter in the genetic interaction network tham that of randomly selected drug combinations.
Discussion
The optimization of multidrug combinations for the treatment of complex disease presents many unique challenges that must be addressed. They include (1) the large number of parameters and treatment options to be optimized, (2) the reproducibility and inherent noise in biological systems, and (3) the highly complex and nonlinear relationship between control parameters and system responses. Various statistical, mathematical, and engineering-based approaches have been proposed to deal with these challenges. In the sections above, we have presented many of these methods and discussed how various research groups have previously applied them to biological systems. In light of these studies, we address below the major advantages and disadvantages of each approach to solving biological problems in the context of optimizing multidrug combinations.
The development of statistical approaches to characterize the complex relationship between input–output variables in biological systems has been frequently applied. The major advantages of this approach include relative simplicity and interpretability, lower data input requirements (compared with machine learning approaches), and minimal computational requirements (compared with many search algorithms). Interpretability allows for the evaluation of drug mixture components and interactions. Therefore, statistical approaches might be used to perform a tailored design of combination components and parameters that would not be possible with the other methods discussed above. Furthermore, due to the fact that the entire experimentally explored response surface is characterized by the model, the optimal solutions can be visualized and predicted. Therefore, there is a relatively low chance that the identified solution lies in a local and not global optimum/minimum. The presence of noise is acceptable for statistical modeling approaches; however, the experimental error must be uncorrelated and have no bias. 112 The successful application of this approach depends on appropriate data and model verification to ensure the accuracy and reliability of model-based predictions. For example, in linear regression analysis, the main assumptions of weak exogeneity, linearity, constant variance, independence of errors, or lack of multicollinearity must be verified. In the case that the experimental data cannot be accurately modeled using the selected method, other types of models (model structure and/or complexity), data transforms, and/or the inclusion of additional experimental data should be considered. Generally, the residual sum of squares of a linear regression model can be broken down into lack of fit and pure error terms via analysis of variance (ANOVA) analysis. This would facilitate the analysis of experimental error/noise versus problems due to lack of fit.43,113 In our experiments, we have found that the application of second-order regression models to the prediction of the phenotypic behavior of complex systems is appropriate,38,114 a finding that is supported by various other studies.115,116 Moreover, Ding et al. published on the successful use of second-order regression analysis to model and optimize behaviors in various different biological systems. 117
It should also be noted that statistical models are only accurate in the region corresponding to the input experimental data provided. Therefore, predicting responses outside of this region can lead to erroneous and inaccurate results. This limitation is partially addressed by joint models, such as the one proposed by Ning et al., 50 where incorporating the Hill-based models (see section 1.1) with parameters described by polynomial functions allowed them to overcome the boundless nature of a polynomial model, enhancing the predictive power of the model beyond the explored experimental dose range. Additionally, it cannot be forgotten that all models make assumptions about the data and their characteristics, and that no model can completely capture the nature of experimental data. As stated by Box, “All models are wrong, but some are useful.” 118
Finally, the RSM also presents unique advantages over other statistical approaches. Its extensive application across practically all fields of science provides broad experience and knowledge of common pitfalls and limitations. Moreover, the implementation of the DOE approach can further minimize input data requirements, and the possibility to perform parallel experiments can minimize the overall optimization time. Furthermore, different designs can be applied depending on the optimization goal—screening experiments can allow for the rapid evaluation of many drugs at once, or more complete design (full or fractional factorial designs) can be applied in order to characterize the entire response surface and identify the optimal response. Gomeni et al. proposed the joint method applying both RSM and nonlinear optimization methods in order to optimize the clinical dose and regimen of paliperidone in the extended release of long-acting injectable formations. 119 Their method included the development of several models linking in vivo pharmacokinetics time course and in vitro dissolution data, drug exposure and clinical endpoints, and clinical endpoints and clinical benefits, and finally, applied a global optimization algorithm.
The application of search algorithms to biological optimization problems also possesses specific advantages and disadvantages. Unlike model-based approaches, a search algorithm does not require any assumptions about the relationship between variables. This allows for the treatment of highly complex, nonlinear systems. On the other hand, there are also limitations to this approach. A major consideration when applying search algorithms to biological optimizations is how the presence of measurement errors and variability in the inherently noisy biological system will affect the performance of the algorithm. Moreover, there is always a chance that the algorithm will converge to a local minimum or maximum, as there is no guarantee that a global maximum has actually been identified. The impact of both of these factors on the search algorithm’s performance largely depends on the type of algorithm used, and should therefore be taken into consideration when applying this experimental approach.
Considerations for selecting an appropriate search algorithm for use in biological research include (1) robustness against noise, (2) performance in a system with significant nonlinearities, (3) integration of available data about the state of the system as frequently as possible, 77 and (4) not easily being trapped in a local maximum/minimum.
Statistical methods and search algorithms are both concerned with defining the shape of the response surface. While the statistical methods attempt to characterize the response in terms of the input variables, search algorithms identify the optimum based on a discretized grid. For this reason, a major advantage of the data modeling technique over the use of a search algorithm is that this method allows for the continuous analysis of data, while the search algorithm requires (in most cases) the discretization of data. Therefore, when using a search algorithm, the problem of resolution size always remains. Too large resolution could limit the efficacy of the search algorithm and possibly prevent the identification of the optimum response. On the other hand, if the resolution is too small, it could result in the need for additional experiments to locate the optimum.
Machine learning algorithms present many advantages in the fields of biological research. They provide ease and flexibility in the optimization of large data sets with nonlinear models. Moreover, machine learning algorithms do not require generalized assumptions about input data (such as normality, linearity, and variable independence) or about the relation between input and output parameters, an advantage in the field of biological research where the response surface is still generally unknown and assumed to be complex. In addition, machine learning models generally possess more accurate predictive power than statistical modeling-based techniques, as they can contain higher levels of complexity. 120
On the other hand, machine learning or data mining approaches require significantly more input data than the other approaches discussed here. This limitation may be particularly prohibitive for the current application, as evidenced by the relatively limited amount of research applying data mining techniques to drug combination optimization thus far. This may indicate that even given the current high-throughput screening techniques and available data, the data input requirements are still too large for this application. Additionally, unlike diagnostic applications of machine learning algorithms, where clinical standards are more stringent and reproducible, experimental settings can vary dramatically. This experimental data, often pooled from different sources, may be insufficient for obtaining accurate predictive models.
Machine learning algorithms lack transparency, which can limit subsequent analysis. For example, in the approach implemented in our study, 38 as well as the study of Silva et al., 44 analysis of drug combination components and interactions is possible, allowing for more rapid and effective screening of large drug pools, followed by the selection of the most effective drug combinations for further analysis. Therefore, major advantages of using statistical models over data mining approaches include the reduced input data requirement, as well as the fact that the latter approach allows for interpretability. Interpretability can be a major advantage in drug combination optimization, as it allows for the analysis of drug activities and interactions—crucial for the tailored design of optimal regimens. Furthermore, statistical models are frequently not suitable for making quantitative predictions outside the scope of the conditions from which the model has been trained. 102 Finally, model training is generally performed through an iterative process with the experimental data, and can be quite long, as the networks can be very complex. Additionally, ANN models can also frequently converge the training due to local minima.
A few studies have compared the predictive power of machine learning algorithms and statistical models. Pivetta et al. developed an ANN model to describe the activity and synergy of two-drug combinations based on 60 experimental data points selected using the DOE. 47 The accuracy of their ANN model was compared with that of third- and fourth-order linear regression models, showing reduced accuracy in the fit of the validation and test data sets for the latter. The authors concluded that the third- and fourth-order models resulted in overfitting of data, as could be seen by the irregularly shaped response surfaces. In our opinion, the overfitting of data might be expected due to the higher-order models developed, as the inclusion of these higher-order terms can result in the arbitrary assignment of data variability to terms that are not actually representative of true interactions. This raises the question of how the accuracy of a lower-order model would compare. Pivetta et al. state that the exclusion of interaction terms (i.e., first-order model) resulted in unacceptable models; however, they do not address the use of second-order models. Finally, this study also raised the question of data input requirement, as the analysis of a two-drug combination required an input of a high number of experimental data points. This may be a limiting factor for larger drug screening studies, indicating that ANNs may not be optimal for such applications. In our study, where we have applied DOE together with linear regression analysis for a screening design of 10 drugs, only 91 data points were required to perform the successful analysis.
The comparison of predictive power in ANN and linear regression models has also been investigated in the field of cancer diagnostics. Finne et al. demonstrated that using either a multilayered perceptron neural network (supervised learning for binary classifiers) or a logistic regression model to analyze information of the total PSA, digital rectal examination, and prostate volume could more accurately predict the outcome of prostate biopsies than free PSA levels alone, ultimately reducing the number of unnecessary biopsies. 60
System biology–based approaches can also encompass a large spectrum of data and computational requirements, also addressing the trade-off between increased model complexity and information gain. At one end of the spectrum, mechanistic models using ODEs require large amounts of data and knowledge of the network components and interactions; however, they have the capability to detect temporal and spatial dynamics on the level of individual components. 100 On the other hand, Bayesian statistics and logic-based models can graphically depict the influence of different signals with phenotypic output data. These models can still utilize important mechanistic information; however, they can be successfully applied with incomplete or limited network models.
The inclusion of network topology data can be useful, as it may provide unexpected insights into drug interactions and signaling pathway interactions that may not have otherwise been visible, and identify “the key dynamical properties of a network.” 89 For example, the influence of network motif on drug interactions can reveal potential strategies for combination therapy. 91
In future applications, the integration of multiple difference data sources will be applied to maximize information gain. Nelander et al. 103 developed network models described by differential equations and applied optimization algorithms to select the most appropriate model based on experimental cell perturbation experiments. In a modified version of Nelander’s approach, Korkut et al. 104 were able to incorporate proteomic data with five phenotypic cell responses in order to reverse engineer the network topology, and predict synergistic targets for combination therapy. Therefore, the previously published network pathway topologies obtained from other sources could be used to increase the accuracy of predictions.
Summarizing, there are limitations and advantages to the use of network topology data. Attempting to fully define a complex system via mathematical expressions requires significant amounts of experimental data in order to properly define network parameters and coefficients. Moreover, incomplete or incorrect assumptions may lead to erroneous conclusions. On the other hand, the use of simplified network models and/or the ability to apply data from external sources can provide a powerful tool to increase the knowledge that can be gained from minimal experimental data.
Summary
While considering all the methods discussed here, the final selection of an appropriate optimization method will depend on many factors ( Table 1 ). One must consider the type and quality of the experimental data available (i.e., quantitative or qualitative), the questions being asked (i.e., to determine mechanistic information or phenotypic states, or predict conditions for an optimal state), and the type of information already available about the system. 100 For all the methods examined, there is a trade-off between time, computational complexity, the quality and quantity of experimental data points obtained, and the accuracy of the method. Nevertheless, their application in the optimizations of multidrug combinations opens a new promising alley in the era of modern cancer treatment regiments. We support the view that phenotypic searches for drug combinations, which are increasingly being recognized as a complementary element to the target-based drug discovery, will empower the development of effective treatment regiments in oncology in the near future.
Overview of Advantages and Disadvantages of the Discussed Optimization Methods.
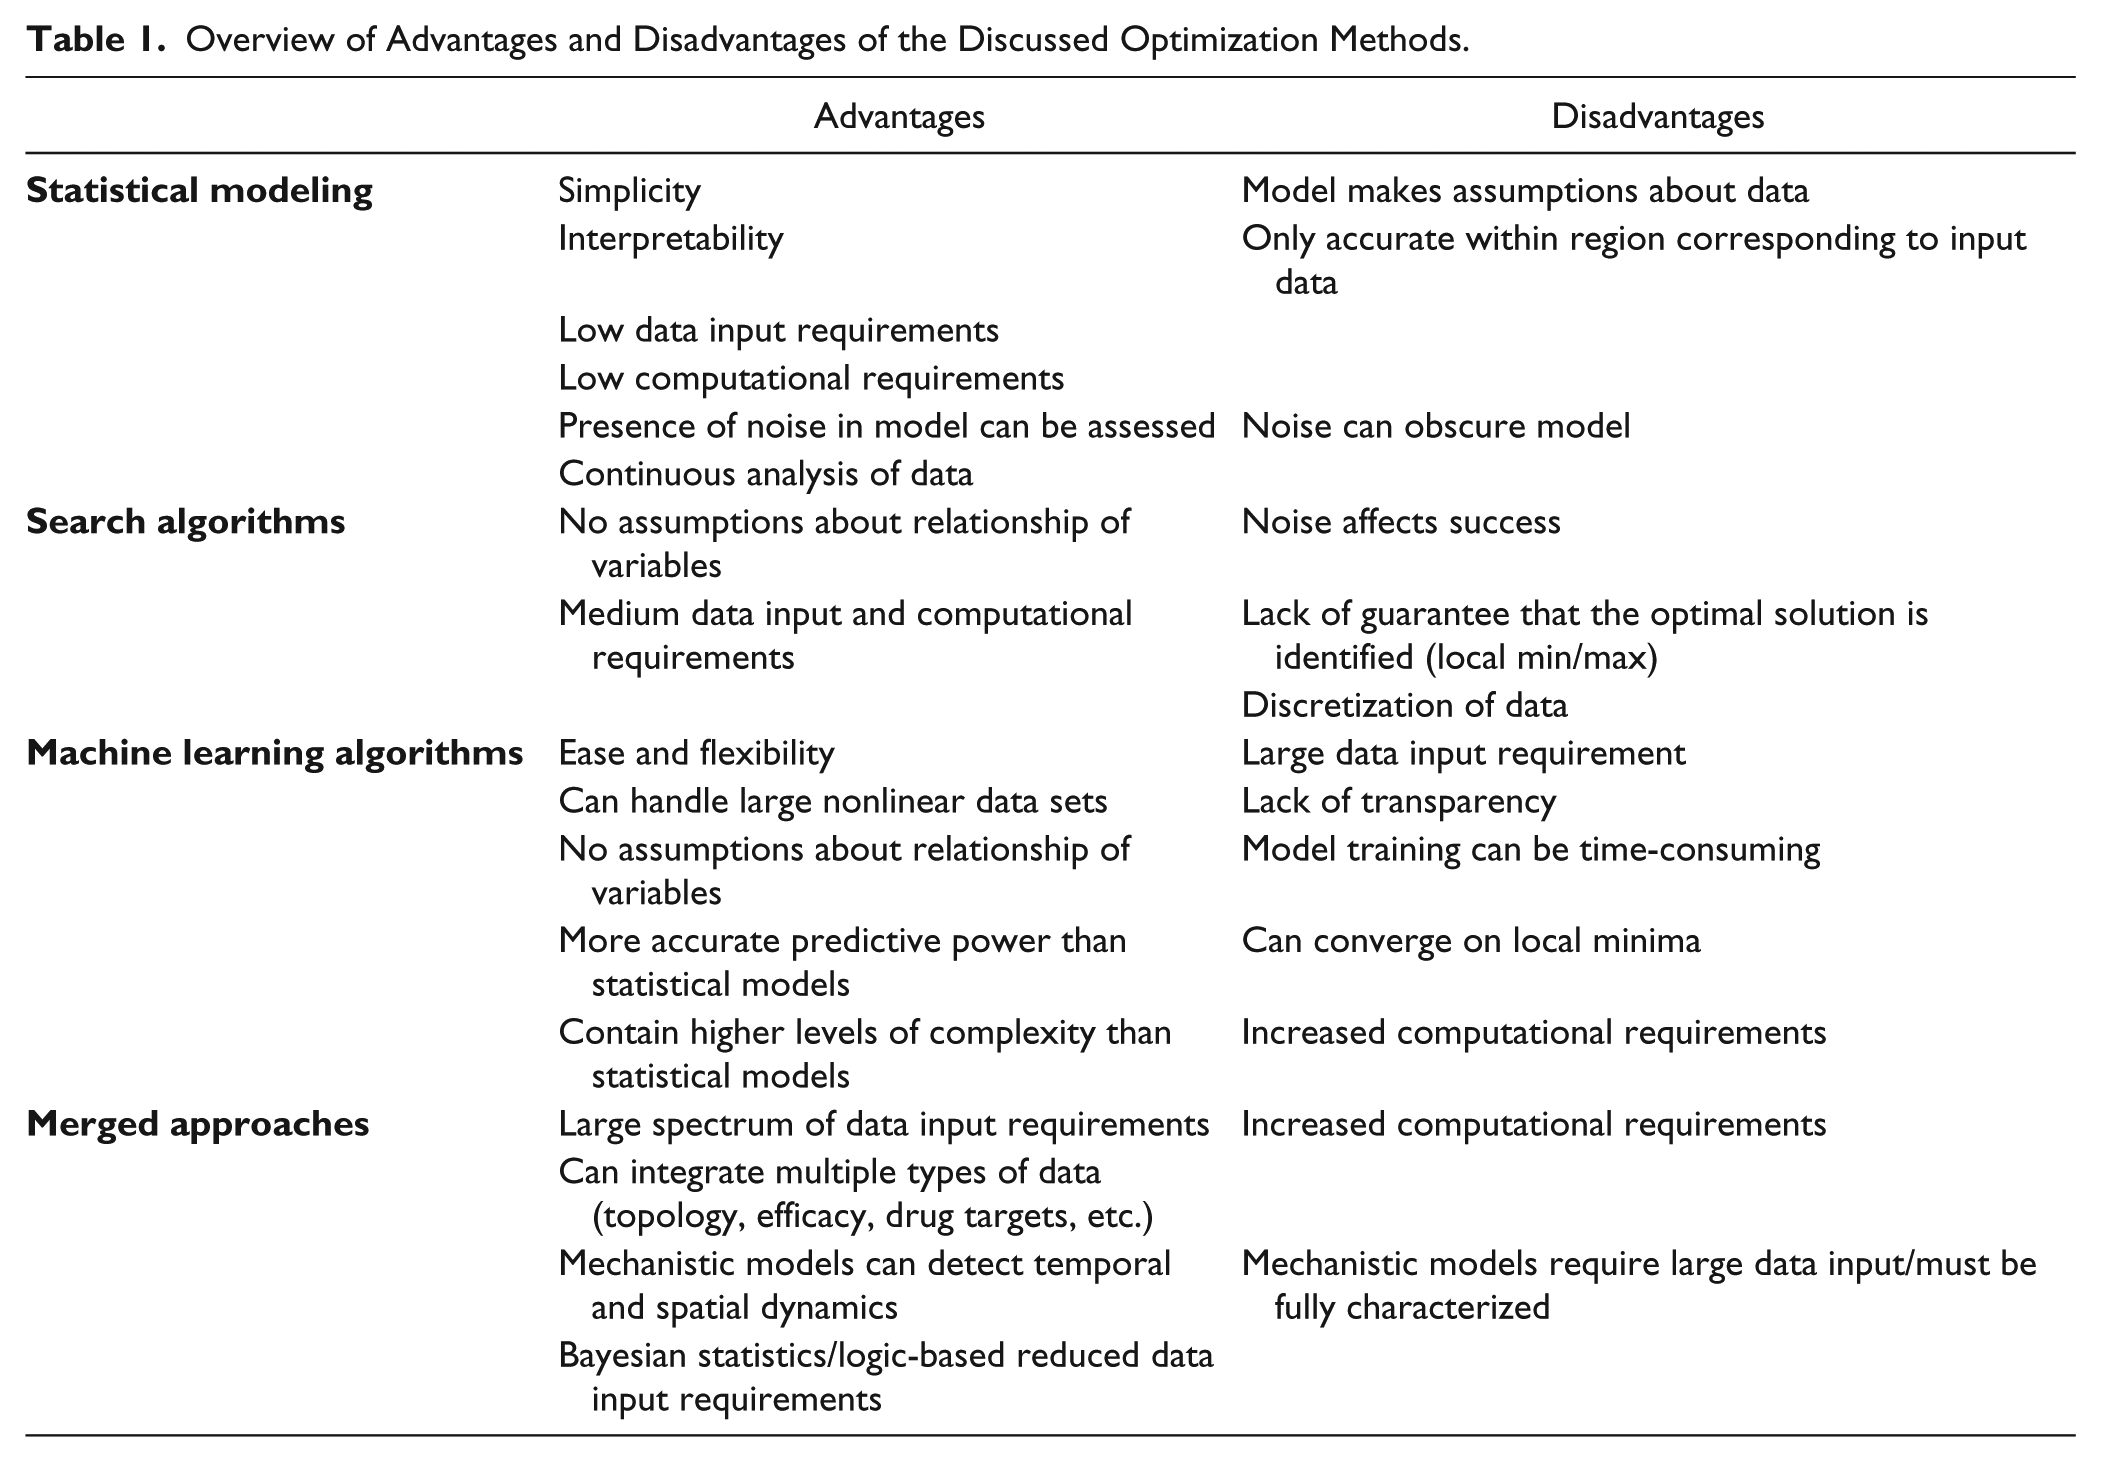
Footnotes
Acknowledgements
P.N.-S. acknowledges the support of the Dutch Cancer Society (VU 2014-7234) and EU (ERC-2015-StG-LS7-680209). The authors acknowledge EPFL for financial support. The authors dedicate this work to Professor Hubert van den Bergh (EPFL, Lausanne), who let us exploring this exciting part of science.
Declaration of Conflicting Interests
The authors declared no potential conflicts of interest with respect to the research, authorship, and/or publication of this article.
Funding
The authors disclosed receipt of the following financial support for the research, authorship, and/or publication of this article: P.N.-S. acknowledges the support of the Dutch Cancer Society (VU 2014-7234) and EU (ERC-2015-StG-LS7-680209). The authors acknowledge EPFL for financial support.