
Abstract
ETS transcription factors from the ERG and ETV1/4/5 subfamilies are overexpressed in the majority of prostate cancer patients and contribute to disease progression. Here, we have developed two in vitro assays for the interaction of ETS transcription factors with DNA that are amenable to high-throughput screening. Using ETS1 as a model, we applied these assays to screen 110 compounds derived from a high-throughput virtual screen. We found that the use of lower-affinity DNA binding sequences, similar to those that ERG and ETV1 bind to in prostate cells, allowed for higher inhibition from many of these test compounds. Further pilot experiments demonstrated that the in vitro assays are robust for ERG, ETV1, and ETV5, three of the ETS transcription factors that are overexpressed in prostate cancer.
Introduction
Site-specific transcription factors influence RNA polymerase activity in a gene-specific manner and are among the major factors that regulate normal development and define cellular fate. Transcription factors are often misregulated in human cancers, with the most abundant examples being the loss of the p53 tumor suppressor and overexpression of the C-MYC oncoprotein. 1 Therefore transcription factors are highly desirable therapeutic targets. With the exception of steroid hormone receptors, transcription factors are difficult therapeutic targets due to the lack of concave ligand binding surfaces. Nevertheless, there are recent examples demonstrating successful modulation of transcription factor activity through the inhibition of protein–protein and protein–DNA interfaces.2–5
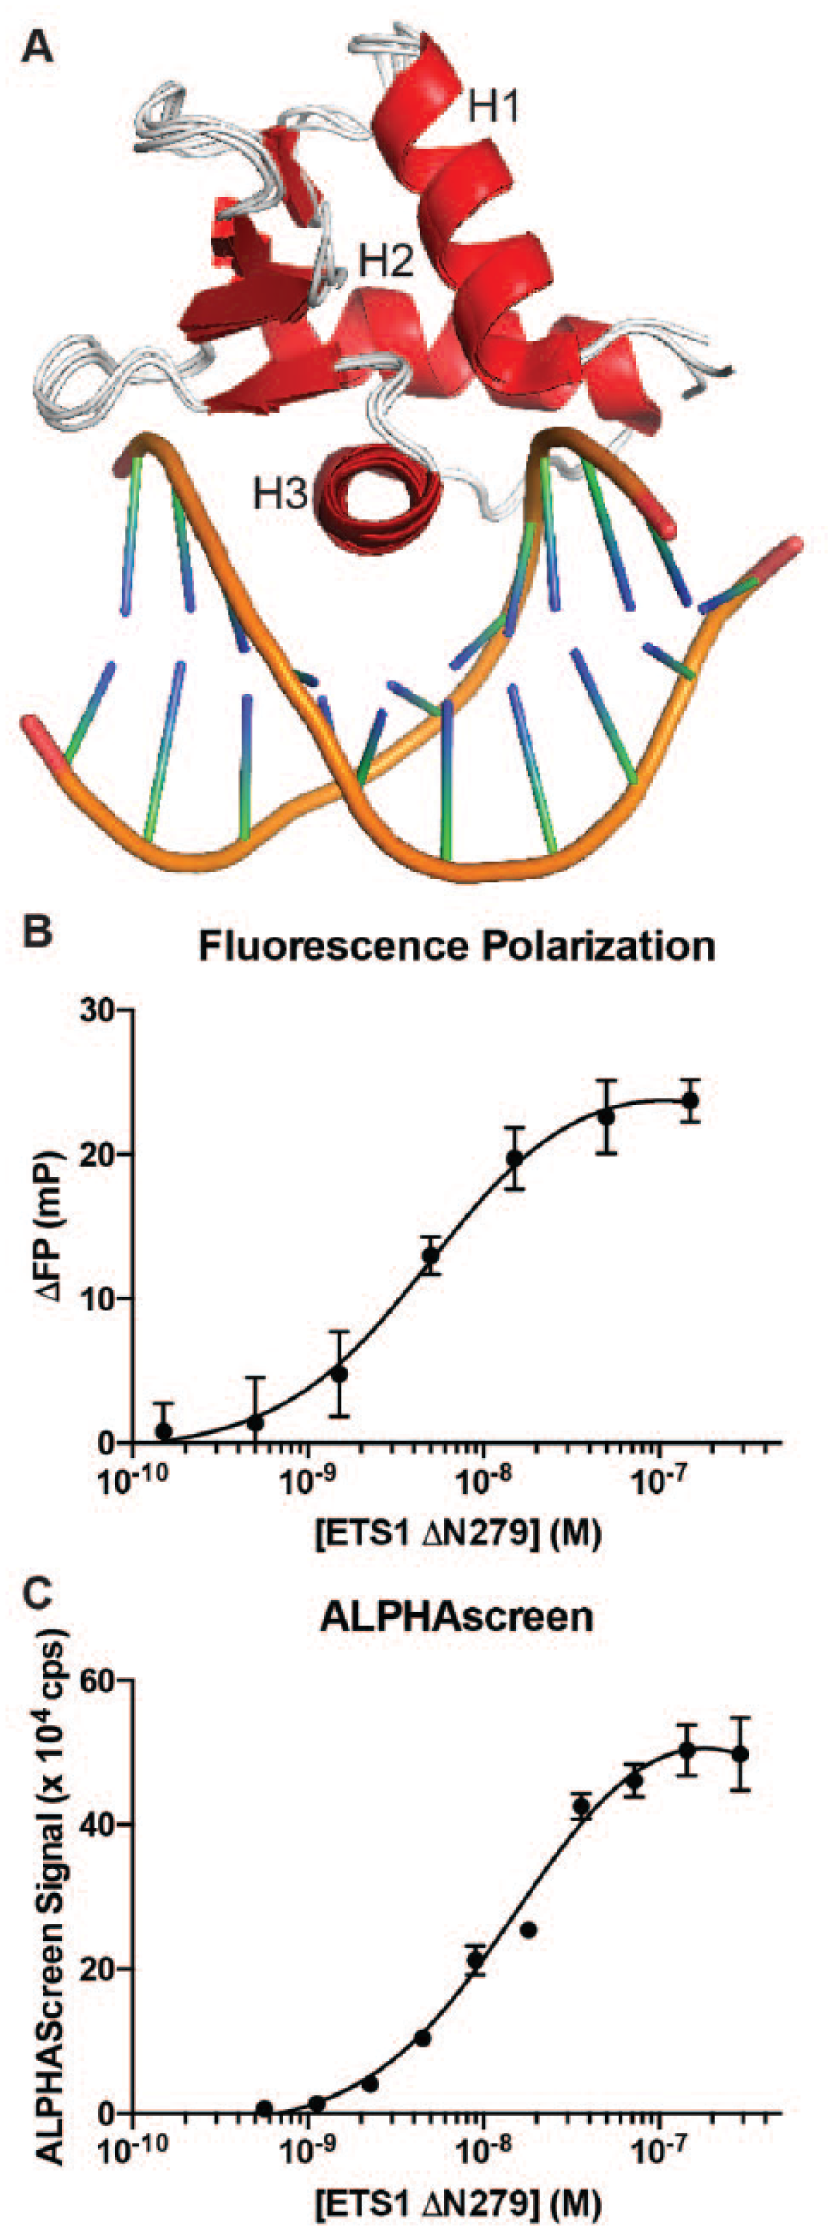
The ETS family of transcription factors contains 28 human genes that have a conserved ETS DNA binding domain ( Fig. 1A ). Factors of the ERG (ERG, FLI1, FEV) and ETV1/4/5 (ETV1, ETV4, ETV5) subfamilies are involved in chromosomal rearrangements that result in the overexpression of one of these proteins in the majority of prostate cancer patients. 6 Preclinical modeling of prostate cancer suggests that the overexpression of ERG, ETV1, or ETV4 contributes to further disease progression, indicating that these transcription factors are desirable therapeutic targets. 7
Assay development for ETS1-DNA interaction. (
Here we have designed in vitro DNA binding assays for ETS transcription factors that are amenable to high-throughput screening. We piloted these assays using ETS1 and a library of 110 compounds derived from high-throughput virtual screening. Furthermore, we demonstrate that using lower-affinity ETS DNA binding sites, similar to those bound by ERG and ETV1 in prostate cancer cells, raises the efficacy of inhibitors of ETS-DNA interactions. Finally, we establish that these in vitro assays can be used with the prostate cancer-relevant ETS factors ERG, ETV1, and ETV5.
Materials and Methods
DNA Constructs
Human cDNAs corresponding to full-length ETV1, ETV5, and ERG were cloned into the bacterial expression vector pET28 (Novagen, Madison, WI) using standard sequence and ligation independent cloning strategies as previously described. 8 The ETS1 ΔN279 construct in pET28 was cloned as previously described. 9
Expression and Purification of Proteins
All proteins were produced in Escherichia coli (λDE3) cells. ETS1 ΔN279 efficiently expressed into the soluble fraction. Cultures of 1 L of Luria broth (LB) were grown at 37 °C to OD600 ~0.7–0.9, induced with 1 mM isopropyl-β-
Harvested cells were resuspended in 25 mM Tris, pH 7.9, 1 M NaCl, 5 mM imidazole, 0.1 mM ethylenediaminetetraacetic acid (EDTA), 2 mM 2-mercaptoethanol (βME), and 1 mM phenylmethanesulfonylfluoride (PMSF). Cells were lysed by sonication and centrifuged at 40,000 rpm in a Ti-45 rotor (Beckmann, Indianapolis, IN) for at least 30 min at 4 °C. After centrifugation, the soluble supernatants were loaded onto a Ni2+ affinity column (GE Biosciences, Marlborough, MA) and eluted over a 5–500 mM imidazole gradient. Fractions containing purified protein were pooled and dialyzed overnight at 4 °C into 25 mM Tris, pH 7.9, 10% glycerol (v/v), 1 mM EDTA, 50 mM KCl, and 1 mM dithiothreitol (DTT). After centrifugation at 40,000 rpm (Ti-45 rotor) for 30 min at 4 °C, the soluble fraction was loaded onto an SP Sepharose cation-exchange column (GE Biosciences) and eluted over a 50–1000 mM KCl gradient. Fractions containing the ETS proteins were loaded onto a Superdex 75 gel-filtration column (GE Biosciences), and eluted fractions were analyzed by SDS-PAGE for purified ETS proteins. The final, purified protein was then concentrated on a 10 kDa molecular weight cutoff (MWCO) Centricon device, snap-frozen in liquid nitrogen, and stored at −80 °C in single-use aliquots for subsequent in vitro studies.
Full-length ERG, ETV1, and ETV5 generally expressed more efficiently in the insoluble fraction using IPTG induction as described above. Harvested cells were resuspended as described above, sonicated, and centrifuged at 15,000 rpm for 15 min at 4 °C. The soluble fraction was discarded, and this procedure was repeated with the pellet/insoluble fraction twice more to rinse the inclusion bodies. The final insoluble fraction was resuspended with 25 mM Tris, pH 7.9, 1 M NaCl, 0.1 mM EDTA, 5 mM imidazole, 2 mM BME, 1 mM PMSF, and 6 M urea. After sonication and incubation for ~1 h at 4 °C, the sample was centrifuged for 40,000 rpm for at least 30 min at 4 °C. The soluble fraction was loaded onto a Ni2+ NTA affinity column (GE Biosciences) and refolded by immediately switching to a buffer with the same components as above, except lacking urea. After elution with 5–500 mM imidazole, the remaining purification steps, ion-exchange and size-exclusion chromatography, were performed as described above. However, a Q Sepharose anion-exchange column was used instead of an SP Sepharose cation-exchange column due to differing isoelectric points of the full-length proteins compared with ETS1 ΔN279.
Full-length cJUN and FOS proteins were expressed and purified as previously described. 10 Briefly, cJUN and FOS proteins expressed into the insoluble fraction and were purified as described for ERG, ETV1, and ETV5, with the following exceptions. FOS was expressed in Rosetta 2 cells for supplementation of rare Arg tRNAs. cJUN and FOS inclusion bodies were purified and solubilized separately as described above; combined to make cJUN-FOS heterodimers, diluted to 200 ng/μL (total protein); and then dialyzed for 3 h each against the following buffers (in sequential order): (1) 25 mM Tris, pH 6.7, 0.1 mM EDTA, 10% glycerol, 5 mM BME, 1 M NaCl, and 1 M urea; (2) same as (1) but without urea; and (3) same as (2) but with NaCl reduced to 100 mM. Refolded samples were then purified using Ni2+ affinity and gel-filtration chromatography as described above.
Purified FOXA1 protein was a kind gift from Dr. Kenneth Zaret. 11
Protein concentrations were measured using averages from the following two methods after ensuring that the concentrations from each method were in agreement with one another (within ~2-fold). (1) Protein concentrations were determined by measuring the absorbance at 595 nm of 20 μL of protein combined with 1 mL of Protein Assay Dye Reagent (diluted 1:5 in deionized water) (Bio-Rad, Hercules, CA) and comparing with a bovine serum albumin (BSA) standard curve. Molecular weights for each ETS protein were calculated using the Peptide Property Calculator (Northwestern University, Evanston, IL). (2) Additionally, absorbance at a wavelength of 280 nm was measured on samples of protein mixed with 6 M Guanidine HCl (Thermo Scientific, Waltham, MA) at a 1:1 ratio and compared with a blank. Protein concentrations were determined using Beer’s law (Abs280nm = ε*l*c) with extinction coefficients for each protein calculated using the Peptide Property Calculator (Northwestern).
Electrophoretic Mobility Shift Assays
DNA binding assays of ETS factors utilized duplexed 27 bp oligonucleotides with one of the following two ETS sites. We first used the high-affinity consensus ETS binding site SC1 (Selected Clone 1): 5′-TCGACGGCCAAGCC
Computational Methods
Computational methods were used as previously described. 13 All computational studies used PDB ID 2NNY for the structural coordinates of ETS1. PocketFinder (ICM, Molsoft, San Diego, CA) and SiteMap (Schrödinger Software, New York, NY) were used to define ligand binding sites. Out of the three ETS1 protein and one DNA ligand binding sites that were defined by PocketFinder and SiteMap, only ETS1 site 1 was used for docking studies.
The compound database was prepared using Ligprep 2.1.23 of the Schrodinger Suite and ICM’s inbuilt preparation of three-dimensional ligands. A small-molecule ligand library of 13 million compounds was docked against ETS1 using Glide High Throughput Virtual Screen. The top ~15% ranked compounds were then redocked with the relatively more computationally expensive Glide standard precision scoring. The top ~0.5% ranked were then subjected to further virtual screening using Glide extra-precision and ICM docking and scoring methods.
The final compounds that were identified for in vitro screening were the top ranking compounds from this final round of virtual screening that also met certain physicochemical criteria, such as solubility >50 μg/mL, permeability >50 nmol/s, and polar surface area <120 Å2, as determined by QikProp. In addition to these rankings, redundant compounds were removed using ICM Molcart to improve the chemical diversity of the final set of compounds. Visual inspection of the docking results was used to evaluate binding mode, position, and orientation. In sum, this process resulted in 110 compounds that were purchased and screened using the in vitro ETS1-DNA binding assays. The top hit from our screens, denoted CIT-0312 in the text, is commercially available from Life Chemicals (ID: F5281-0084).
Fluorescence Polarization
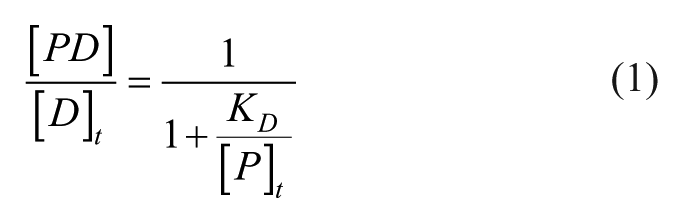
Fluorescence polarization reactions were performed in the same buffer as described above for EMSAs. SC1 DNA was ordered with a 3′ fluorescein. Reactions were carried out in 20 μL volumes in black 384-well plates (Corning, Corning, NY). The protein, DNA, and compound were incubated for 30 min at room temperature, protected from light. Time-course studies demonstrated that less than 5 min was required for the protein–DNA reaction to reach equilibrium; however, we went with a longer incubation time to encourage compound–protein interactions, potentially with significantly lower affinity and kinetics, to also reach equilibrium. Reactions containing up to 5% DMSO showed no influence on the DNA–protein interaction. Plates were then analyzed on an Envision 2104 Multilabel Reader (PerkinElmer). To calculate percent inhibition, the signal (mp) for each compound was compared with positive (10 nM protein, 5 nM DNA, 0 μM compound; set to 0% inhibition) and negative (0 nM protein, 5 nM DNA, 0 μM compound; set to 100% inhibition) controls.
ALPHAScreen
ALPHAScreen reactions were performed in the same buffer as described above for EMSAs, except without 10% glycerol, as this caused uneven distribution of the ALPHA beads. SC1 and SC13 DNA were ordered with a 5′ biotin. Reactions were carried out in 25 μL volumes in 384-well white OptiPlate-384 HB plates (PerkinElmer). ALPHAScreen was performed according to the manufacturer’s recommendations. Briefly, protein, compound, and DNA were incubated at room temperature for 60 min, protected from light. Nickel chelate acceptor beads were then added, followed by another 60 min incubation at room temperature, protected from light. Then streptavidin donor beads were added, followed by another 60 min incubation at room temperature. Plates were then analyzed on an Envision 2104 Multilabel Reader (PerkinElmer). To calculate percent inhibition, the signal (cps) for each compound was compared with positive (10 nM protein, 10 nM DNA, 0 μM compound; set to 0% inhibition) and negative (0 nM protein, 10 nM DNA, 0 μM compound; set to 100% inhibition) controls.
Comparison of Fluorescence Polarization and ALPHAScreen Assays
Equation 2 was used to compare the assay performance between fluorescence polarization and ALPHAScreen assays for ETS1 (μ and σ are the mean and standard deviation [SD] and c+ and c– are the positive and negative controls). 14

Results and Discussion
ETS1 ΔN279 (residues 279–441) was used to pilot in vitro assays that could be utilized for high-throughput screening of potential small-molecule inhibitors of ETS-DNA interactions. This fragment has robust expression in a recombinant system and contains the same affinity for DNA as full-length ETS1.
9
The ETS domains of ETS1, ERG, and ETV1 are sequentially and structurally conserved (
ETS1 ΔN279 was expressed in E. coli and purified using a Ni2+ affinity column, a cation-exchange column, and a size-exclusion column ( Suppl. Fig. S1B ). Using EMSA, we measured the binding of ETS1 ΔN279 to DNA with a consensus ETS site (5′-CCGGAAGT-3′), termed SC1 (Selected Clone 1). 12 The measured KD of 0.4 nM is in agreement with previous measurements for this fragment binding to DNA ( Suppl. Fig. S1C ). 9 The yield of ETS1 ΔN279 was approximately 5 mg of purified protein per liter of bacterial culture, which provided plenty of protein for this study and could be efficiently scaled up to provide enough protein for a high-throughput in vitro screen.
We next optimized screening conditions with the validated ETS1 ΔN279 for two potential high-throughput assays: fluorescence polarization and ALPHAScreen. The fluorescence polarization assay uses a fluorescein-tagged SC1 DNA and measures the change in the polarization of fluorescently emitted light when the DNA is free in solution versus when the DNA is bound by a transcription factor. The ALPHAScreen assay brings beads that engage in fluorescence resonance energy transfer (FRET) into proximity through conjugation to a transcription factor and its recognition DNA site using Ni2+-His6 and streptavidin-biotin interactions, respectively. First, titration of DNA demonstrated that using 5 nM fluorescein-tagged DNA for fluorescence polarization or 10 nM biotin-tagged DNA for ALPHAScreen minimized the amount of DNA while still retaining a robust signal in these assays with ETS1 ΔN279. With these amounts of DNA, titration of ETS1 ΔN279 showed a dose-dependent response in these two assays with a concentration of around 30–50 nM generating the maximum signal ( Fig. 1B , C ). Based on these titrations, 10 nM concentrations of ETS1 ΔN279 were used in the fluorescence polarization and ALPHAScreen assays for compound screening studies. The maximum signal and the baseline were used to calculate a Z′ factor for these assays. Over the course of assay development, fluorescence polarization had Z′ factors of 0.4 ± 0.1 (mean ± SD) and ALPHAScreen had Z′ factors of 0.6 ± 0.1 ( Suppl. Fig. S2A ). Z′ factors above 0.5 are considered to be excellent assays for high-throughput screening purposes. 14 Whereas the ETS1 ALPHAScreen assay already clears this guideline, the ETS1 fluorescence polarization assay is close and could likely be optimized to achieve Z′ factors over 0.5.
Computer modeling was utilized to enrich for likely bioactive compounds to be screened using these newly established in vitro assays. Briefly, PocketFinder (ICM) and SiteMap (Schrodinger) were used to define ligand binding pockets in the ETS domain of ETS1 ( Suppl. Fig. S3 ). Sequential rounds of virtual screening using one of these defined ligand binding pockets, termed ETS1 site 1, culled a starting library of 13 million compounds down to 110 compounds to be tested in the in vitro ETS1 DNA binding assays. In addition to the predicted strength of interaction with ETS1, these compounds were also filtered to optimize chemical diversity and enrich for compounds with favorable physicochemical properties.
A constant concentration of protein and DNA, as indicated above, was used to test the inhibition of each of the 110 compounds that resulted from virtual screening. These compounds were tested at a single concentration of 60 μM, and each compound or control was measured in quadruplicates. Using 3 SD above the baseline as a cutoff, only two compounds in the fluorescence polarization assay and four compounds in the ALPHAScreen assay, respectively, inhibited the ETS1 ΔN279-DNA interaction. Only one of these compounds inhibited this interaction in both assays ( Fig. 2A ).
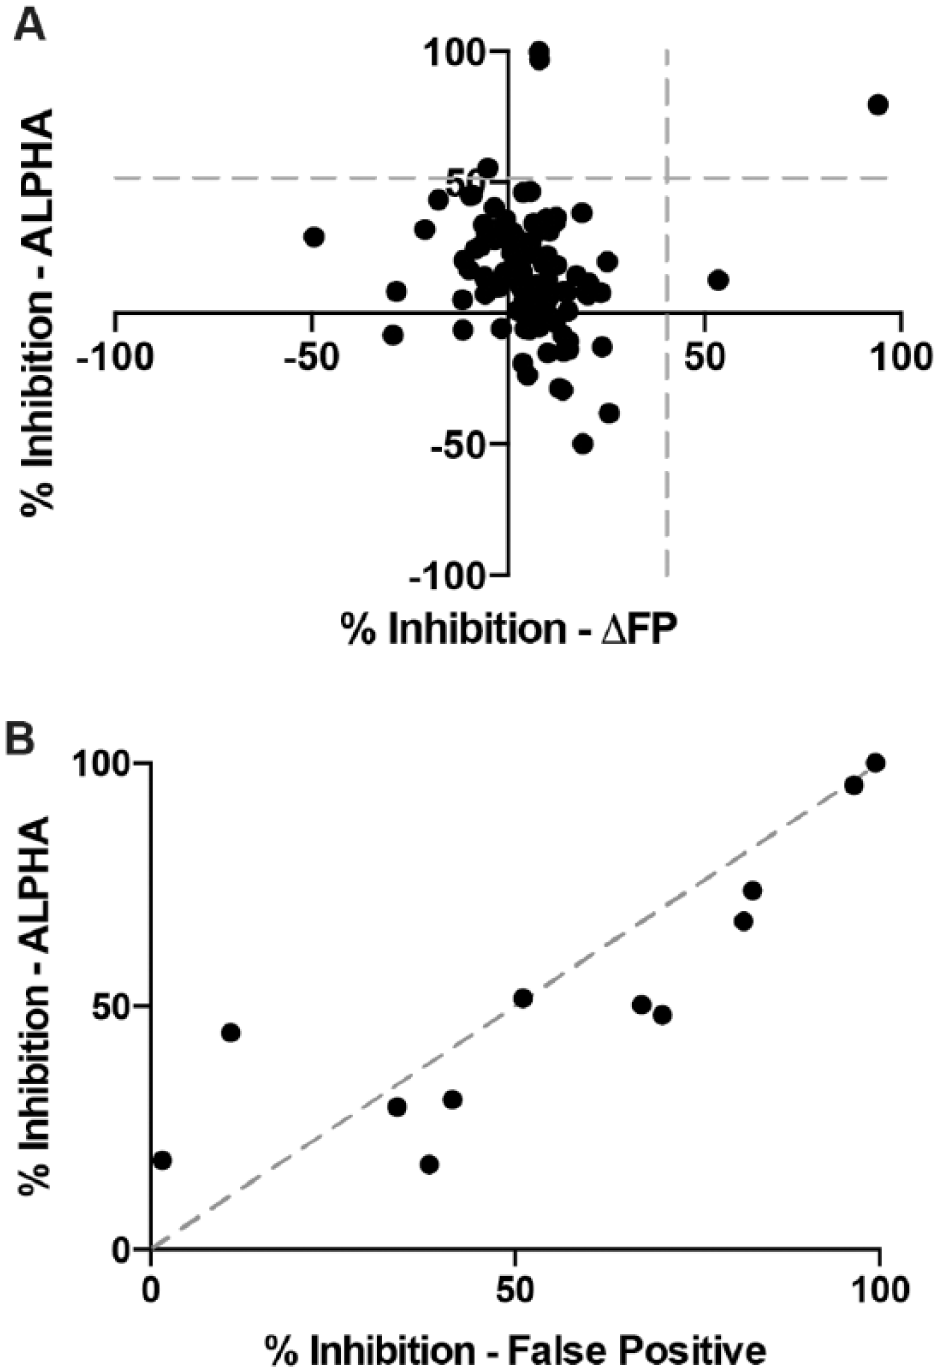
In vitro screens for inhibitors of ETS1-SC1 DNA interaction with fluorescence polarization and ALPHAScreen. (
To further investigate these compounds, as well as some additional compounds that were close to the 3 SD cutoff, we utilized the “TruHits” false-positive screen in ALPHAScreen. In this assay, a small molecule that covalently conjugates biotin and His6 together is used in lieu of the biomolecules of interest, in this case ETS1 ΔN279 and SC1 DNA. Compounds that inhibit the false-positive assay do so through a manner inherent to the assay itself, such as by absorbing light in the donor or emission wavelengths or by disrupting the streptavidin-biotin or His6-Ni2+ interactions that conjugate the biomolecules to the ALPHA beads. All the compounds that strongly inhibited the ALPHAScreen assay also strongly inhibited this false-positive assay ( Fig. 2B ). Only two compounds that had weak to moderate inhibition of the ALPHAScreen assay displayed differential preference for inhibiting the ALPHAScreen assay more robustly than the false-positive assay.
With very few, if any, actual hits from our first round of in vitro screening, we next considered potential adjustments to our assays. One potential challenge with this screen is that the strength of the ETS1 ΔN279-SC1 DNA interaction (KD = 0.4 nM) might conceal the discovery of starting compounds with relatively lower affinity for ETS1 ΔN279, which then could be further optimized for inhibition. To address this, we switched from SC1 (5′-GCCGGAAGTG-3′), the highest-affinity DNA sequence for ETS1, to a weaker ETS1 binding sequence, SC13 (5′-
We rescreened the 110 compounds against ETS1 and SC13 DNA. Eighteen of these compounds inhibited the ETS1-SC13 interaction above the 3 SD cutoff, compared with only four for the ETS1-SC1 interaction (
Fig. 3A
). While many of these compounds still inhibited the TruHits false-positive assay, 12/20 compounds showed more inhibition in the ETS1-SC13 assay than the false-positive assay (
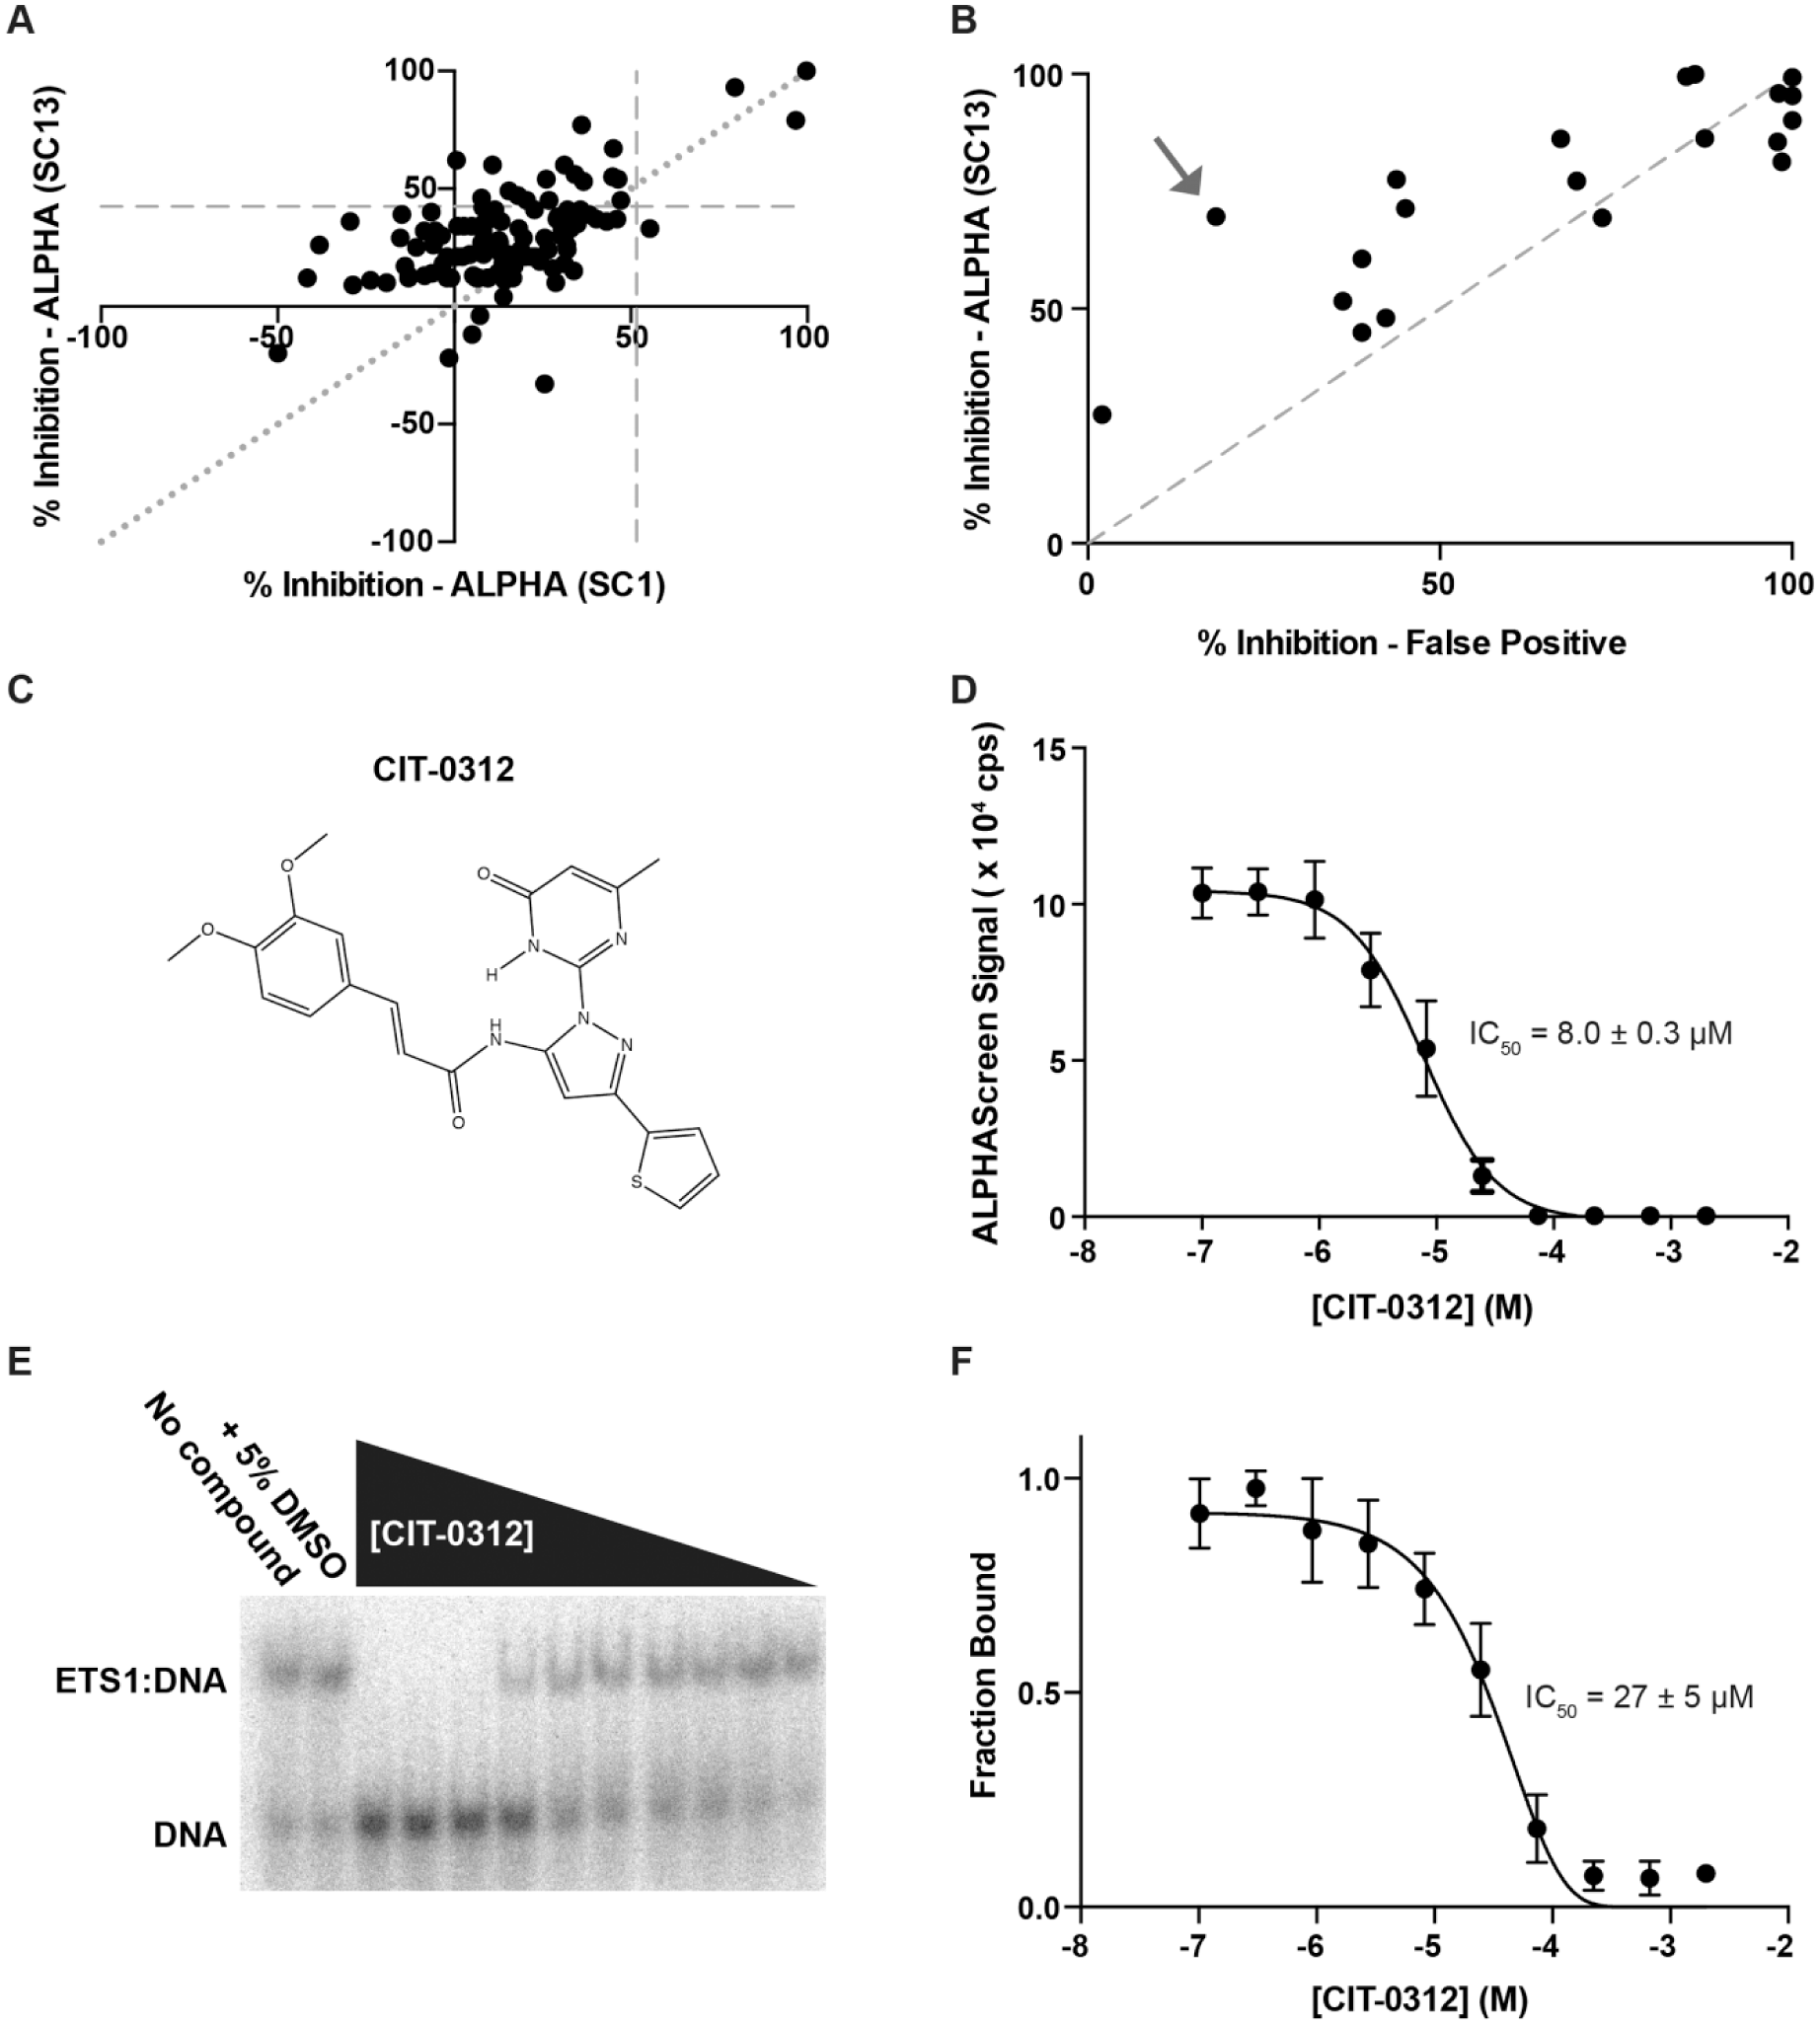
Screen for inhibitors of ETS1-SC13 DNA interaction using ALPHAscreen. (
In both the ETS1-SC1 and ETS1-SC13 screens the same compound, CIT-0312, displayed the largest differential between inhibition of ETS1-DNA assays and inhibition of the false-positive assay ( Fig. 3B , C and Suppl. Fig. S4 ). Therefore, this compound displayed the most specific inhibition of the ETS1-DNA interaction. Additionally, CIT-0312 more robustly inhibited the ETS1-SC13 interaction (73%) than the ETS1-SC1 interaction (36%), as would be expected given the relatively weaker affinity of the ETS1-SC13 interaction. This compound inhibited ETS1-SC13 DNA interaction in the ALPHAScreen assay with an IC50 of 8.0 ± 0.3 μM ( Fig. 3D ). To confirm this inhibition, we tested CIT-0312 using EMSAs. In this orthogonal assay, CIT-0312 inhibited the ETS1-SC1 DNA with an IC50 of 27 ± 5 μM ( Fig. 3E , F ). Further investigation demonstrated that this compound lacked specificity as it similarly inhibited cJUN-FOS and FOXA1 transcription factors from binding to their cognate DNA recognition sites ( Suppl. Fig. S5 ). Therefore, this particular compound must be inhibiting the DNA binding of ETS1, as well as other transcription factors, through a nonspecific mechanism that is distinct from the prediction of our in silico modeling ( Suppl. Fig. S3 ).
Within the ETS family of transcription factors, ERG and ETV1/4/5 subfamily proteins are overexpressed in prostate cancer and contribute to disease progression, making therapeutic inhibition of these proteins desirable.3–7 To establish that the screening assays used here for ETS1 are also suitable for these oncogenic proteins, we expressed and purified full-length, His6-tagged ERG, ETV1, and ETV5 ( Suppl. Fig. S6 ). Titrations of these proteins with 10 nM biotin-tagged SC13 DNA and streptavidin donor and nickel chelate acceptor beads established that these proteins similarly generate robust ALPHAScreen signal, with a maximum signal observed around 20–70 nM, depending on the individual protein ( Fig. 4 ). Each of these interactions had Z′ factors over 0.5 (ERG, 0.7 ± 0.2; ETV1, 0.6 ± 0.1; ETV5, 0.7 ± 0.2), suggesting that they would also be suitable for high-throughput screening ( Suppl. Fig. S2B ).
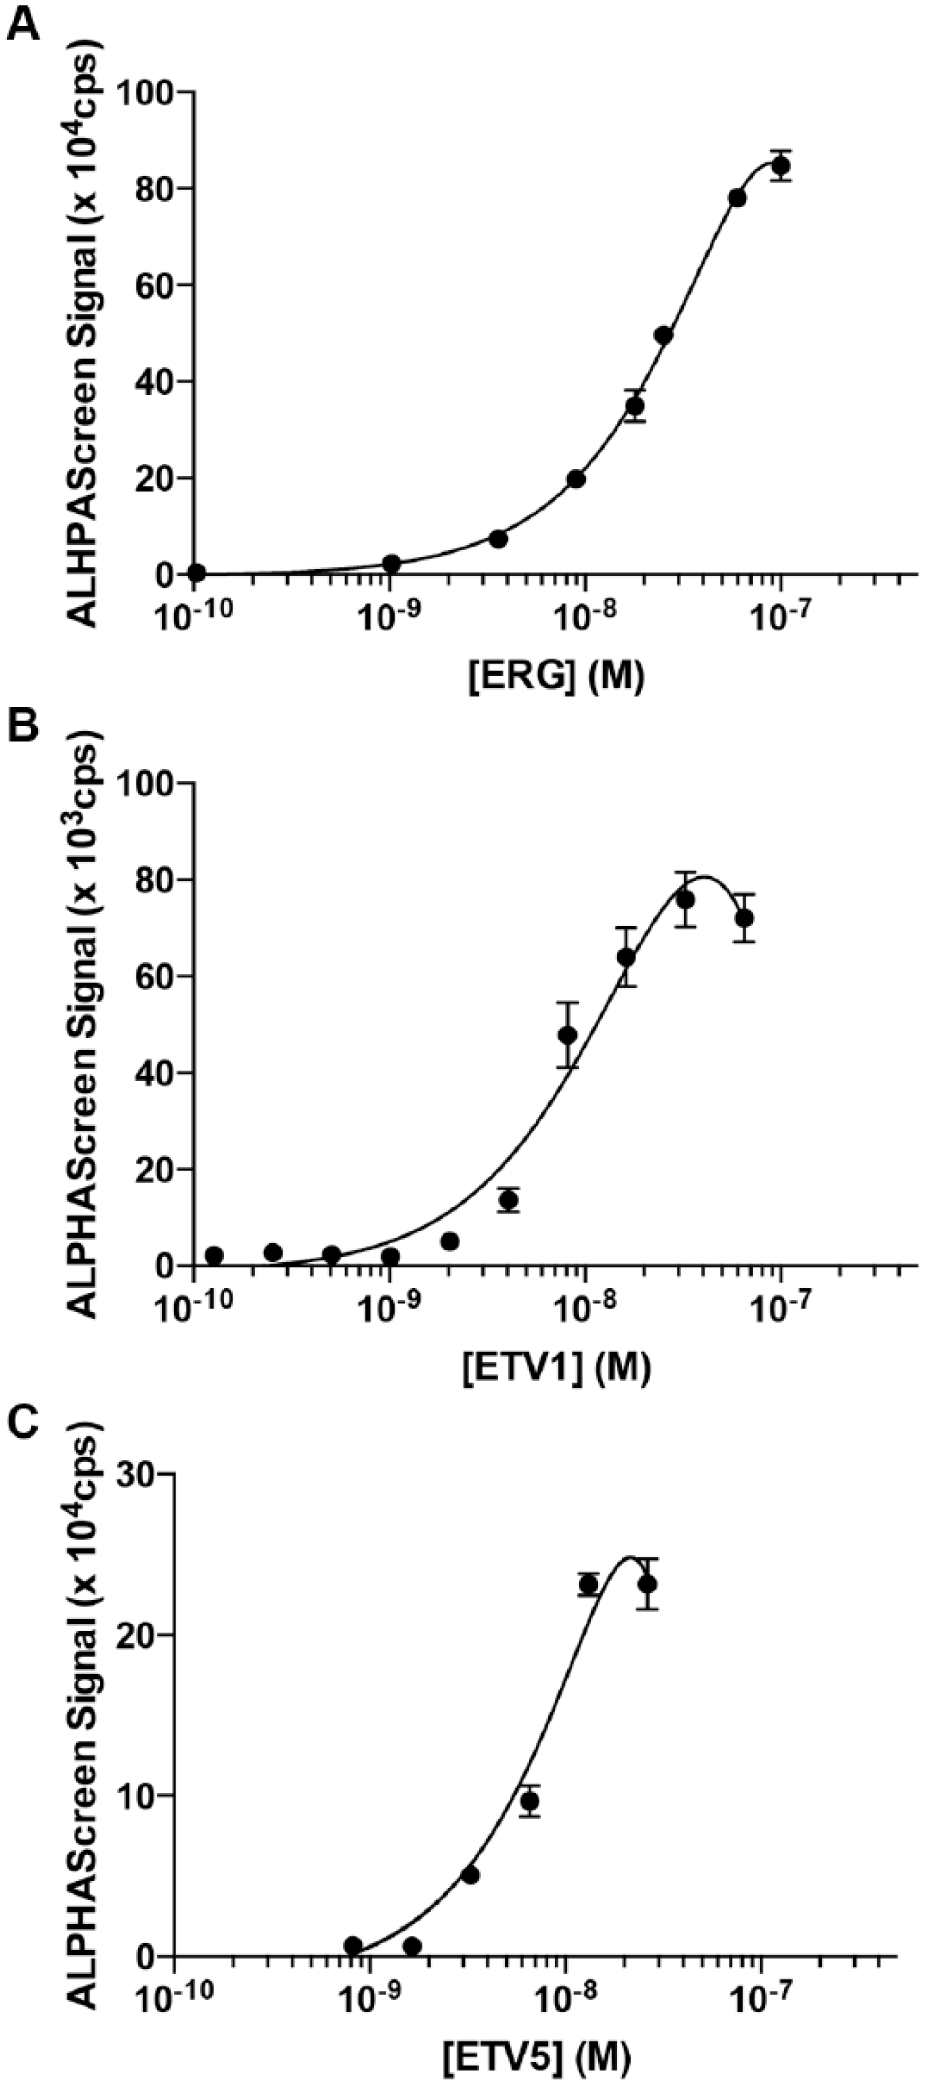
Assay development for ERG-, ETV1-, and ETV5-DNA interactions. ALPHAScreen assay with a titration of ERG (top), ETV1 (middle), or ETV5 (bottom) and 10 nM 5′ biotin-labeled SC13 DNA.
In summary, we have established two in vitro assays, ALPHAScreen and fluorescence polarization, that are suitable for high-throughput screening of potential small-molecule inhibitors of ETS-DNA interactions. Using weaker-affinity DNA, such as SC13, was advantageous for more readily identifying potential lead compounds from the screens. Interestingly, these weaker-affinity DNA sites may also be more biologically relevant as they more closely resemble the ERG and ETV1 DNA binding sites in prostate cancer. 7 In contrast, consensus ETS sites, such as SC1, are redundantly regulated by multiple ETS factors and control the expression of housekeeping genes. 15 These in vitro assays are suitable for ETS factors with high clinical relevance, such as ERG and ETV1, and can be used for performing high-throughput screens of these factors. Furthermore, as directly inhibiting transcription factor–DNA interactions remains a difficult target, 1 these assays could also be used to screen for compounds that inhibit the function of ETS factors through alternative mechanisms. For instance, screens could be conducted for small molecules that reinforce the diverse autoinhibitory mechanisms of ETS factors. 8 Alternatively, these assays could be readily modified to search for disruptors of protein–protein interactions between ETS factors and important transcriptional coregulators.
Supplemental Material
Supplementary_Material_for_ETS_inhibitor_screen_by_Currie_et_al – Supplemental material for Development of High-Throughput Screening Assays for Inhibitors of ETS Transcription Factors
Supplemental material, Supplementary_Material_for_ETS_inhibitor_screen_by_Currie_et_al for Development of High-Throughput Screening Assays for Inhibitors of ETS Transcription Factors by Simon L. Currie, Steven L. Warner, Hariprasad Vankayalapati, Xiaohui Liu, Sunil Sharma, David J. Bearss and Barbara J. Graves in SLAS Discovery
Footnotes
Acknowledgements
Purified FOXA1 protein and cJUN-FOS expression plasmids were kind gifts from Kenneth Zaret and Peter Hollenhorst. The authors are grateful to Charles Meeker, Christian Millsop, Katherine Chandler, and Krista Meyer for invaluable discussions, and Jack Skalicky, Frank Whitby, and Christopher Hill for advice and collaboration on structural experiments.
Supplemental material is available online with this article.
Declaration of Conflicting Interests
The authors declared no potential conflicts of interest with respect to the research, authorship, and/or publication of this article.
Funding
The authors disclosed receipt of the following financial support for the research, authorship, and/or publication of this article: This study was funded by the National Institutes of Health (R01GM38663 to B.J.G.); support to B.J.G., D.J.B., and S.S. from the Huntsman Cancer Institute/Huntsman Cancer Foundation and to B.J.G. from the Howard Hughes Medical Institute is acknowledged. Shared resources at the University of Utah were supported by the National Institutes of Health (P30CA042014 to the Huntsman Cancer Institute). The contents of this publication are solely the responsibility of the authors and do not necessarily represent the official views of NIH or other funding agencies.
References
Supplementary Material
Please find the following supplemental material available below.
For Open Access articles published under a Creative Commons License, all supplemental material carries the same license as the article it is associated with.
For non-Open Access articles published, all supplemental material carries a non-exclusive license, and permission requests for re-use of supplemental material or any part of supplemental material shall be sent directly to the copyright owner as specified in the copyright notice associated with the article.