
Abstract
Estrogen receptor (ER) is a ligand-inducible transcriptional factor involving in cell growth, differentiation, and diseases, so detection and identification of compounds having estrogenic effects are of great importance in the drug discovery industry. We have developed and validated a rapid, simple, and homogeneous method that can detect estrogenic compounds. This human ERα/β binding assay uses fluorescence polarization (FP) by applying an autofluorescent phytoestrogen, coumestrol (CS). A nonspecific adsorption assay shows that no obvious nonspecific adsorption is detected between CS and ERs. In the Scatchard plot analysis, the convex curve exhibits a positive cooperative binding, indicating that the binding of CS induces a conformational change of the ER to form a dimer and increases the affinity for the additional CS. In the Hill plot analysis, CS shows moderate binding affinity with both ERα and ERβ, and the measured Kd of CS is 32.66 µM and 36.14 µM, respectively, indicating that CS is applicable to the ER binding assay for determination of potent ligands of moderate binding affinity. Four typical ligands are selected to verify the ER binding assays, and the results are consistent with the reported data. All of above make the FP method based on CS suitable for high-throughput screening.
Introduction
Estrogen receptor (ER), a member of the nuclear receptor superfamily, is a ligand-inducible transcriptional factor consisting of two different subtypes, estrogen receptor α (ERα, 66 kDa) and estrogen receptor β (ERβ, 59 kDa), involving cell growth and differentiation.1,2 Hormone binding to the ER initiates a series of events, including conformational change, dimerization, binding to a specific DNA sequence such as an estrogen response element (ERE), and interaction with coactivators.3–6 Those events induce a transcription of the target gene, and the estrogenic action is caused by such products. Detection and identification of compounds having estrogenic effects are of great importance in the drug discovery industry because ER-subtype selective agonists or antagonists are proved to be of therapeutic value in treating a variety of estrogen-linked pathologies (such as breast cancer, osteoporosis, cardiovascular disease, type II diabetes, and Alzheimer disease).7–10
With regard to detection and identification of estrogenic ligands, several ER binding assay methods based on competing binding have been developed. The most prevalent method is based on autoradiography by employing radioactive ligands, such as tritium or iodine-labeled estradiol derivatives.11–15 This method is reliable and accurate; however, it requires exclusive facilities under strict management to avoid any radiation hazard. In addition, a filtration step is required prior to the measurement of radioactivity to remove any unbound radioactive derivatives from those bound to ER. To overcome these disadvantages, Adamczyk et al. 15 have prepared some fluorescent ligands to substitute for radioactive ones, but these fluorescent ligands have not been employed in practical situations. The reason is that the fluorescence properties of these ligands are not stable, with the fluorescence intensity and excitation/emission spectra changing with the ligand molecular environment. In recent years, fluorescence polarization (FP) has been introduced to determine relative binding affinities (RBAs) of the estrogenic compounds, and several synthetic fluorescence compounds have performed well. FP is promising because no extra filtration step is required. However, none of those fluorescent compounds have been suitable for large-scale high-throughput screening (HTS) due to the high cost of the synthetic fluorescent ligands by either companies or individual researchers.16,17 Therefore, alternative fluorescent ligands suitable for the screening of potent ligands by FP are still desired.
In this article, we introduce coumestrol (CS), an autofluorescent phytoestrogen, into FP. We set up a rapid, simple, and homogeneous ER binding assay suitable for HTS assays. CS, cheap and easy to obtain, gives a stable and strong fluorescence with excitation (365 nm) and emission (440 nm) wavelengths. The moderate binding affinity with ER makes it more suitable to determine the binding affinity of potent ligands.
Materials and Methods
Materials
Plasmid pVP16-ERα and pVP16-ERβ (long) were obtained from Invitrogen (Carlsbad, CA), and plasmid PGEx-KG was a gift from Professor Min Wu (Wuhan University). 17β-Estradiol (ES), CS, propylpyrazoletriol (PPT), diaprylpropionitrile (DPN), fulvestrant (ICI 182,780, short for ICI), and testosterone propionate (TP) were purchased from Sigma-Aldrich (St. Louis, MO). Bovine gamma globulin (BGG) was purchased from Thermo Fisher Scientific (Waltham, MA). GSH-resin was purchased from Genscript (Nanjin, China). Other chemical and biology reagents, such as phenylmethanesulfonyl fluoride, dithiothreitol (DTT), isopropylthio-β-galactoside (IPTG), and Luria-Bertani medium, were purchased from Guoyao (Beijing, China). Escherichia coli DH5α and BL21 (DE3) were used for cloning and expression.
The FP assays were performed using the multifunctional microplate reader SpectraMax M5 (Molecular Devices, CA, USA) with a 365-nm excitation filter and a 440-nm emission filter at the regulated temperature of 25 °C.
Gene Clone and Protein Purification
Ligand binding domain (LBD) of the human ERα and ERβ genes was amplified by PCR from plasmid pVP16-ERα and pVP16-ERβ (long), respectively. (ERα_UP_BamHI: ATAGG ATCCA TCAAA CGCTC TAAGA AG; ERα_DN_XhoI: A TACTC GAGGC TAGTG GGCGC ATGTA G; ERβ_UP_BamHI: ATAGG ATCCG AAGTG GGAAT GGTGA; ERβ_DN_NcoI: AT TCC ATGGC TTTTA CTGTC CTCTG CC.) The PCR product was cloned into plasmid PGEx-KG, and E. coli BL21 (DE3) was used for the overexpression of ER-LBD. After being induced by IPTG (10 µM) for 2 h, the cells were harvested, frozen, and thawed in 100 mM phosphate-buffered saline (PBS), containing 1 mM EDTA and 1 mM DTT. Then, the cells were ultrasonicated in an icy bath (working, 5 s; interval, 3 s; total, 12 min). Next, the supernatant was applied to a column of GSH-resin. The column was first washed with 100 mM PBS (pH 8.0), 1 mM EDTA, and 1 mM DTT, followed by 100 mM PBS (pH 8.0), 1 mM EDTA, and 1 mM DTT in 1% Triton X-100. ER-LBD was eluted with 50 mM Tris-HCl (pH 8.2) and 10 mM glutathione (reduced). To remove the glutathione, the collection was dialyzed in icy buffer (100 mM potassium phosphate, pH 7.4) for 4 h. After being checked by a combination of sodium dodecyl sulfate–polyacrylamide gel electrophoresis and Western blotting, the protein was prepared as a 10-mM stock in potassium phosphate (100 mM, pH 7.4) at −80 °C.
Nonspecific Adsorption Assay
A nonspecific adsorption assay was performed to investigate the nonspecific adsorption ability of CS. CS and ES were diluted to a concentration of 40 nM and 20 µM, respectively, with 100 mM potassium phosphate (pH 7.4) containing 200 µg/mL BGG. ERα-LBD and ERβ-LBD were diluted with 100 mM potassium phosphate (pH 7.4) to a different concentration (20 nM, 63.2 nM, 200 nM, 632 nM, 2 µM, 6.32 µM, 20 µM, 63.2 µM, 200 µM, and 632 µM). Equal volume of CS (or CS-ES cocktail) and ERα/β-LBD of different concentrations were added to 384-well plates, for a total of 40 µL. After being allowed to stand for 2 h at room temperature (25 °C), each sample was subjected to the FP method in triplicate.
Saturation Binding Assay
A saturation binding assay using FP was performed to examine the affinities of the CS with ERα/β-LBD. The protocol was similar to a nonspecific adsorption assay. The final concentration of CS was fixed to 20 nM, and the final concentration of ER-LBD varied from 31.6 nM to 10 µM (31.6 nM, 100 nM, 316 nM, 1 µM, 3.16 µM, and 10 µM). ES did not need the saturation binding assay. Equal volume of CS and ERα/β-LBD of different concentration were added to 384-well plates, for a total of 40 µL. After being allowed to stand for 2 h at room temperature (25 °C), each sample was subjected to the FP method in triplicate.
The measured polarization values (Pobs) were transformed into the bound receptor concentrations (Rb) using the following equation:
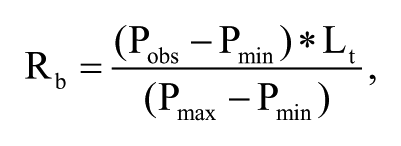
where Pmax and Pmin are the polarization values when the fluorescent ligand was completely bound and not bound to ER-LBD, respectively. Lt is the total concentration of ligand. The free receptor concentration (Rf) was calculated by subtracting Rb from the total receptor concentration (Rt). The bound ligand concentration (B) was equal to Rb, and the free ligand concentration (F) was calculated by subtracting B from Lt as follows:

On the basis of the above equations and calculations, the Scatchard and Hill plots were analyzed.
Competitive Binding Assay
A competitive binding assay was carried out to investigatethe relative binding affinity of competitors (ES, PPT, DPN, ICI, and TP). In this assay, the final concentrations of CS and ERα/β-LBD were fixed to 20 nM and 400 nM, and the concentration of competitors was diluted to a concentration of 2 nM, 6.32 nM, 20 nM, 63.2 nM, 200 nM, 632 nM, 2 µM, 6.32 µM, and 10 µM, respectively. After being allowed to stand for 2 h at room temperature (25 °C), each sample was subjected to the FP method in triplicate.
Results and Discussion
Nonspecific Adsorption Assay: CS Had Little Nonspecific Adsorption with ERs
Nonspecific adsorptions, which can increase FP value, exhibit a strong effect on FP and result in a large measurement error. Although a few studies18,19 reported that CS could bind with ER, to our knowledge, they did not report whether CS was suitable for FP (e.g., Adamczyk’s fluorescent molecule is not suitable for FP 24) and whether CS had the nonspecific adsorption. We noticed that the CS could bind with ER, and the FP value of the CS-ERs solution increased with the increasing concentration of the ER; when all CS was saturated by ER, the FP value reached the maximum. Further increase of the ER concentration did not change the FP value ( Figure 1 ). In the control group, by addition of excess ES, the binding site of ER was saturated by ES; as a result, CS only could bind to ER through nonspecific adsorption. The FP value of the buffer stayed constant with the increasing concentration of ER, which suggested that CS had no nonspecific adsorption or the nonspecific adsorption was too weak to be observed. CS was confirmed to be a suitable fluorescent molecule for FP.
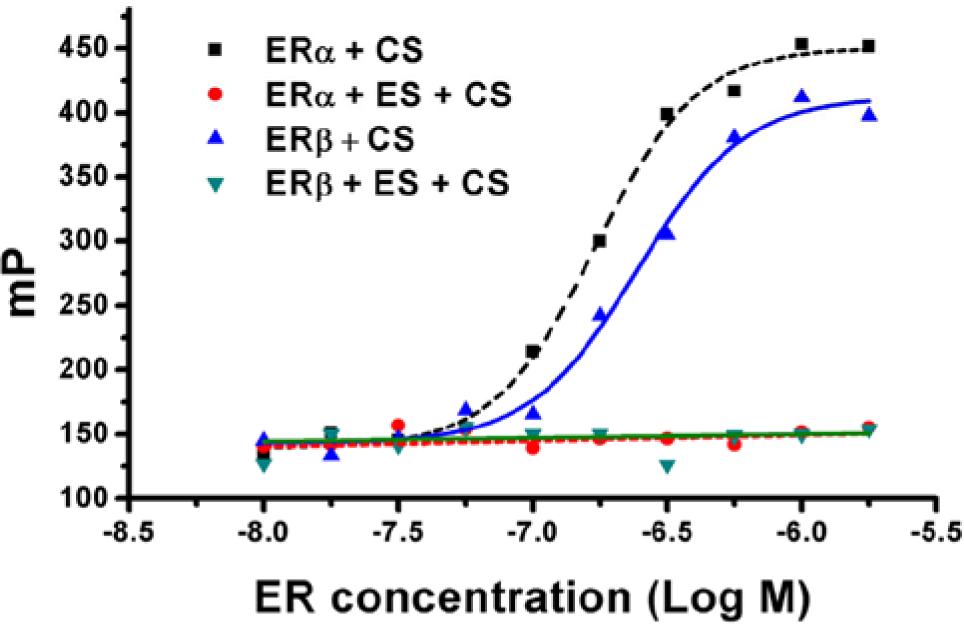
Nonspecific adsorption of coumestrol (CS) to estrogen receptor α (ERα)–ligand binding domain (LBD) and estrogen receptor β (ERβ)–LBD. The red and green points represent the fluorescence polarization (FP) value of CS-ER with excess 17β-estradiol (ES), which remains constant with the increasing concentration of ERα-LBD/ERβ-LBD. The black and blue points represent the FP value of CS-ER, which increases with the increasing concentration of ERα-LBD/ERβ-LBD. The EC50 of CS with respect to ERα/β-LBD is 1.7E-7and 2.5E-7, respectively.
Saturation Binding Assay: CS Had a Moderate Binding Affinity with ERs
CS is not a newly discovered or synthesized compound; its IC50 and RBA with respect to the ES have been reported by many authors,18,19 but as a tracer, some of its properties need to be further determined.
The Scatchard plot analysis of the FP values was performed to obtain the Kd of CS to ER-LBD. As shown in Figure 2A , B , the shape of the Scatchard curve showed a typical convex curve, which suggested a homotropic allosteric effect; the binding of the first ligand to an oligomer protein afforded an increase in the affinity of the protein to the additional ligands. CS might act as an allosteric factor to increase the affinity of the additional ligand, as observed for the tritium-labeled ES. 19 In this work, only ER-LBDs but not full-length ERs were used to bind with CS. However, it was still possible to find a homotropic allosteric effect in the Scatchard plot. The reason was that some X-ray structures, such as PDB ID: 1A52, confirmed that ER-LBD alone could form a dimer. Therefore, different ligands could induce conformation changes, and a homotropic allosteric effect might happen.
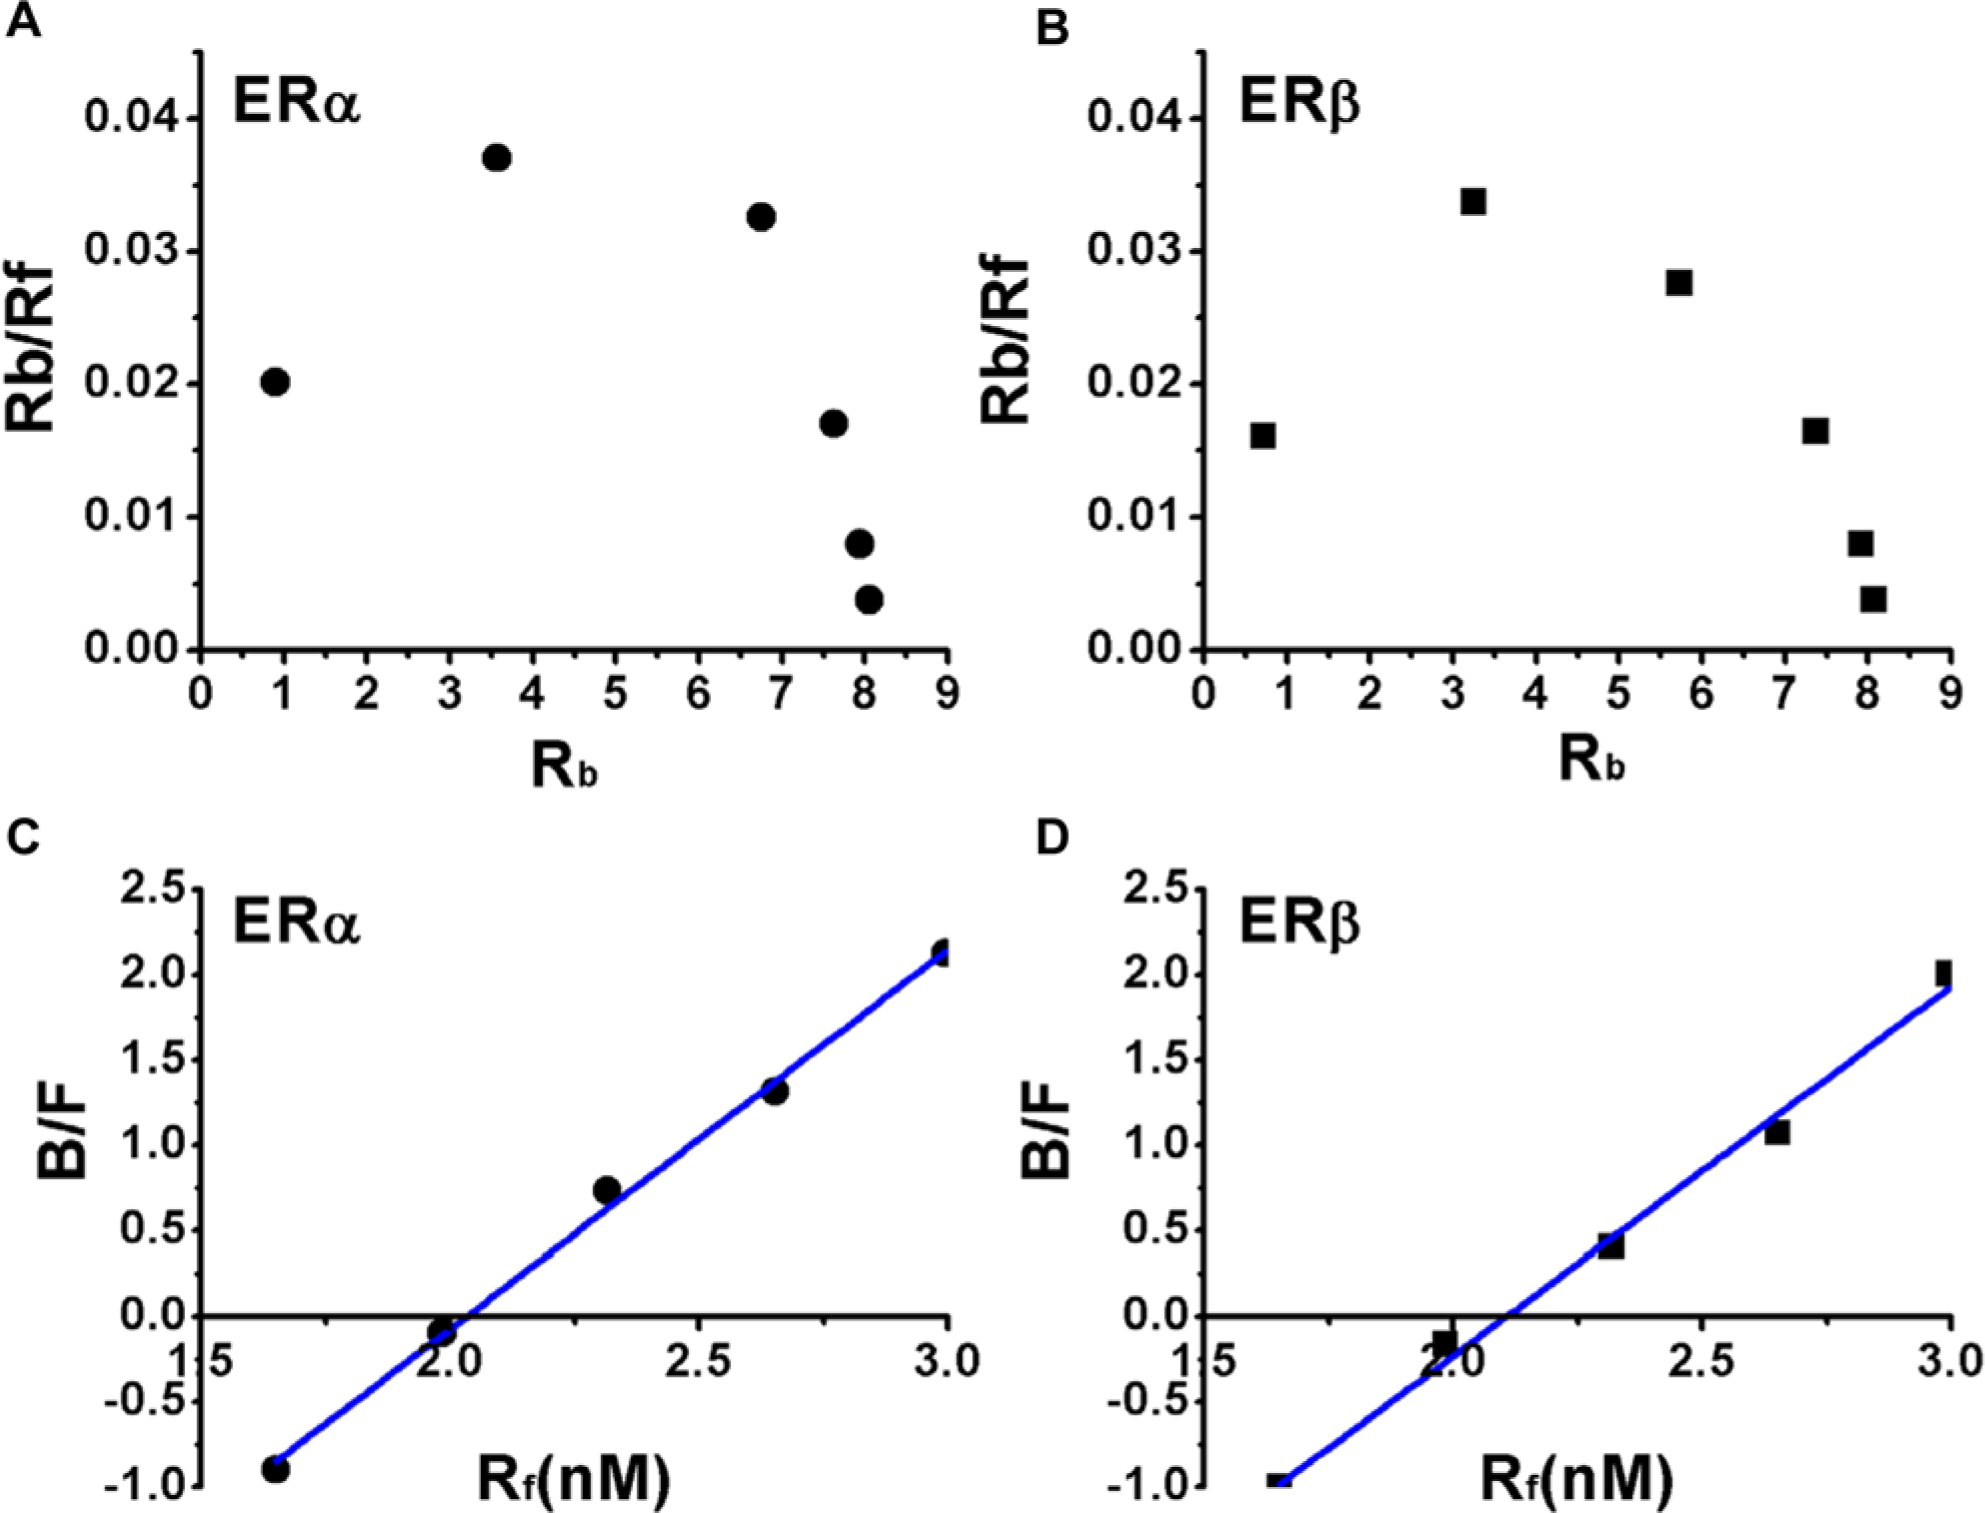
Scatchard and Hill plot analysis. Analyzing the interaction of coumestrol (CS) (20 nM) with estrogen receptor α (ERα)–ligand binding domain (LBD) and estrogen receptor β (ERβ)–LBD by the proposed saturation binding study. The convex Scatchard curve (
Since the Kd value was not obtainable from the convex curve in the Scatchard curve, the data were transformed into a Hill plot, which normally gives a linear curve. As shown in Figure 2C , D , the obtained Kd value of ERα-LBD/ERβ-LBD was 32.66 µM and 36.14 µM, respectively. The Hill coefficients to ERα-LBD/ERβ-LBD were 2.22 and 2.16, which are identical with the Scatchard plot.
The above results confirmed the previous report that ER is an allosteric protein and forms a dimer, with the conformational change induced by the binding with the ligand. 19 The measured Kd values, which were a little bit higher than the reported values, suggested that CS had a moderate binding affinity with ERs. Compared with other fluorescent ligands with a high affinity to ERs, CS might be more appropriate to perform a competitive binding assay. For example, the diethylstilbestrol (DES) derivative had a Kd value to ERα of 0.3 nM, which meant high affinity to ERα, so high concentrations of the competitors must be used to displace the derivative. 20
Competitive Binding Assay: The RBA Values Were Consistent with Previously Reported Data
Four typical ligands (PPT, DPN, ICI, and TP) were selected to verify the availability and accuracy of the ER binding assays. PPT was an ERα-selective estrogen-receptor modulator (SERM), DPN was an ERβ SERM, ICI was an inhibitor for both ERs, and TP, an androgen, could not bind with ERs. These ligands represented different types of typical ligands for each, and their RBA values have been reported in many studies.20-23
The data were first normalized and then fitted in the DoseResp equation. The log IC50 values, with respect to the CS, were calculated. The RBA value of the ES was set to 100% and the RBA value of the other competitors was calculated by the following equation:

PPT had a stronger binding affinity to ERα than ERβ. Our result confirmed this, with the measured RBA values to ERα and ERβ being 50.8% and 1.8%, respectively, which were consistent with the reported values of 49% and 0.12% ( Table 1 and Fig. 3 ). 23 DPN had a stronger binding affinity to ERβ; our result showed that DPN had a stronger binding affinity to ERβ than that of ERα. The measured RBA values to ERα and ERβ were 1.3% and 11.5%, respectively, while the reported RBA values were 0.25% and 18%. 21 ICI was an inhibitor to both ERα and ERβ. The measured RBA values to ERα and ERβ were 4.6% and 13.7%, respectively, and the reported values were 5.9% and 3%. 22 As an androgen, it was proved that TP could not bind with both types of ERs, 20 and our result confirmed it.
Comparison of the Measured and Reported RBA Values.
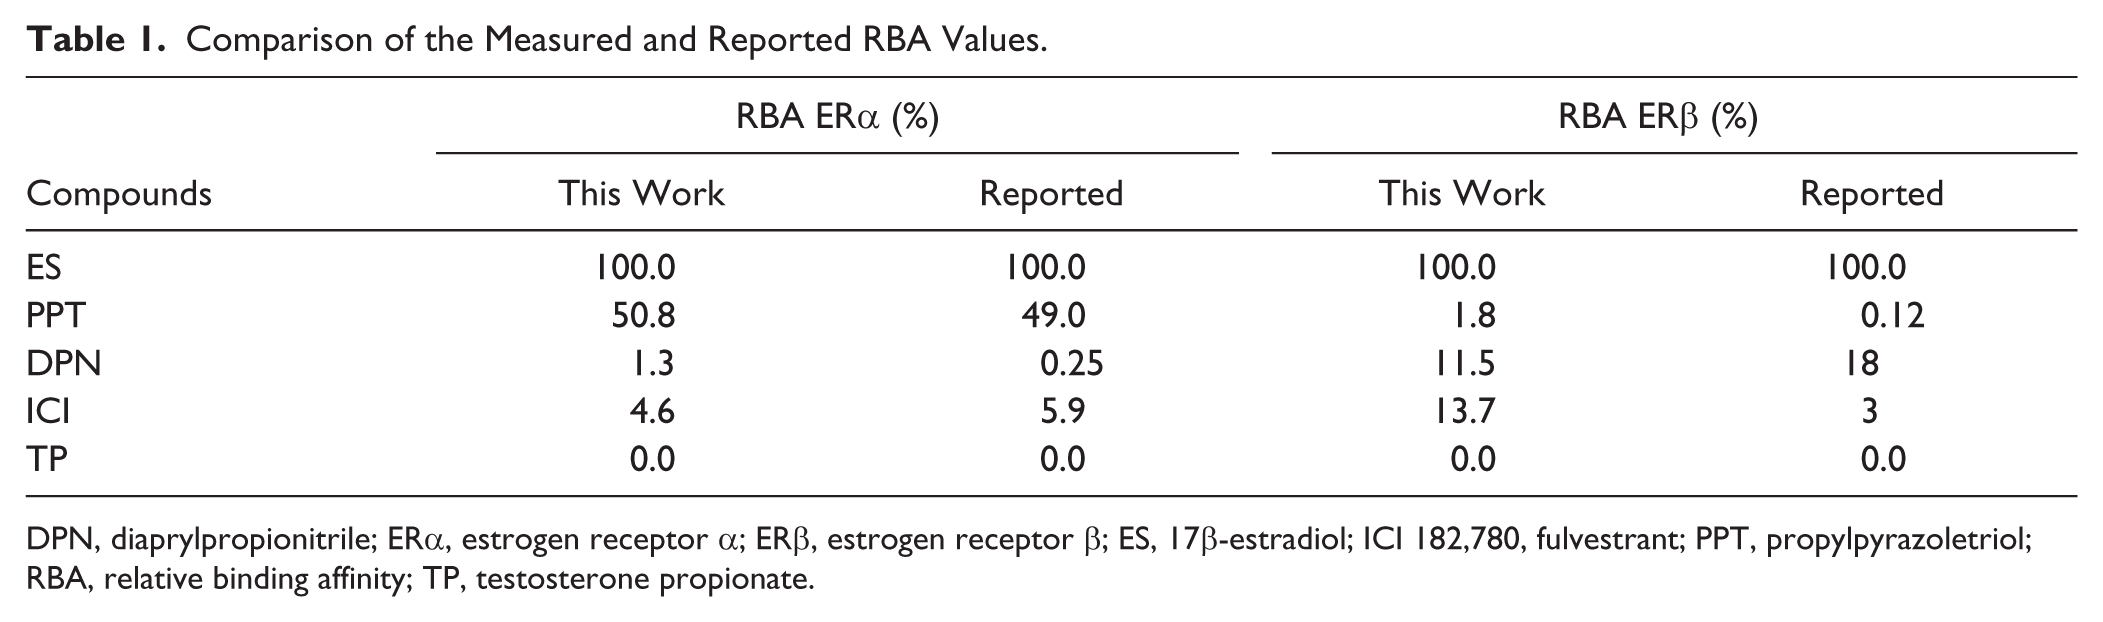
DPN, diaprylpropionitrile; ERα, estrogen receptor α; ERβ, estrogen receptor β; ES, 17β-estradiol; ICI 182,780, fulvestrant; PPT, propylpyrazoletriol; RBA, relative binding affinity; TP, testosterone propionate.
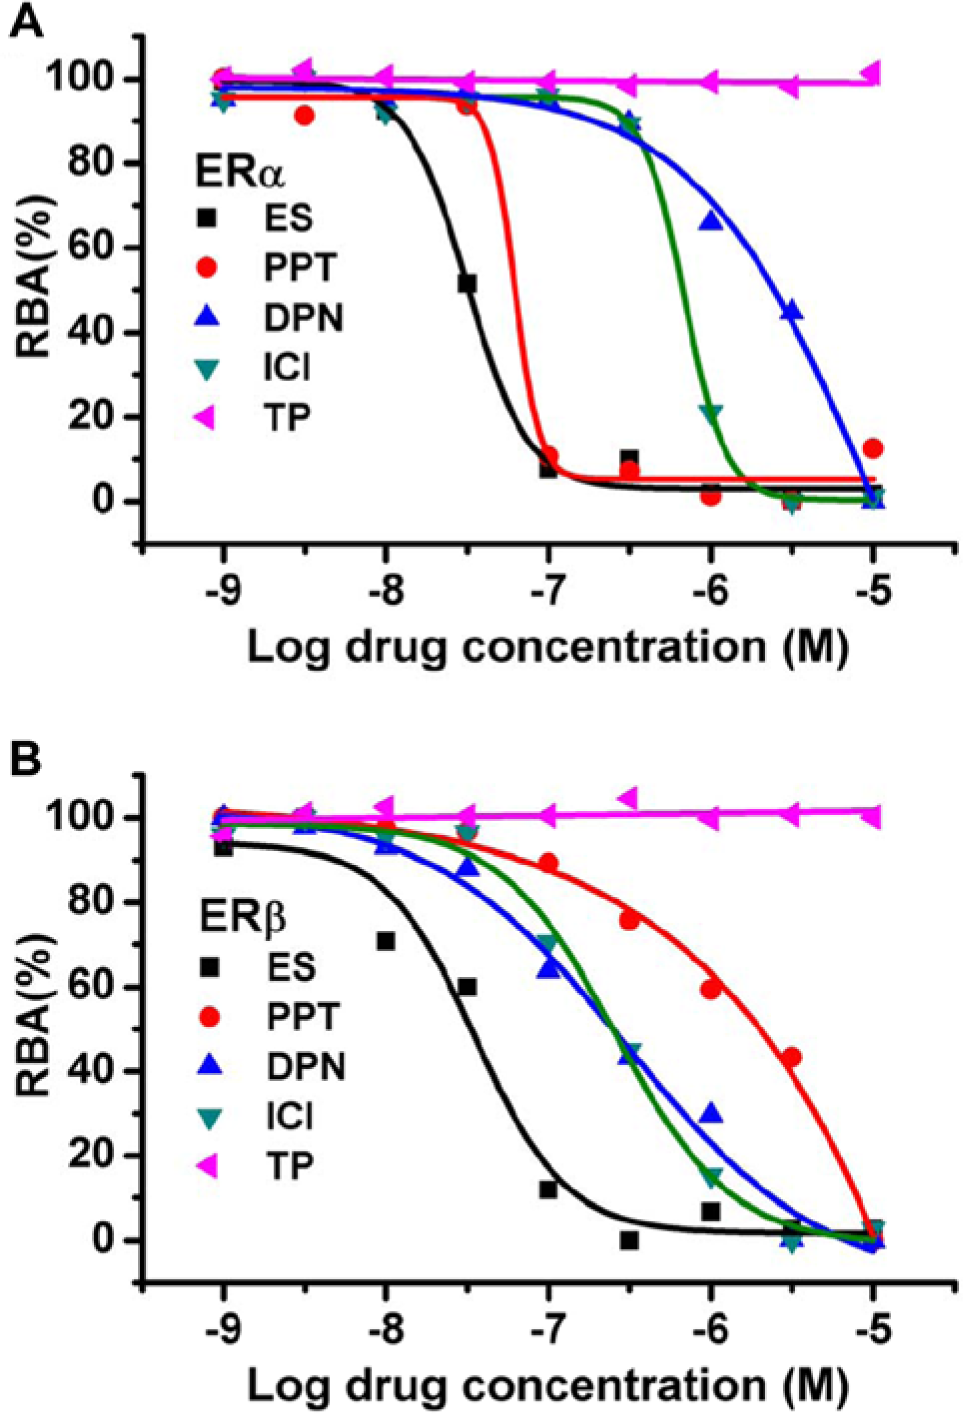
Fluorescence polarization (FP) curves of 17β-estradiol (ES), propylpyrazoletriol (PPT), diaprylpropionitrile (DPN), fulvestrant (ICI), and testosterone propionate (TP) to estrogen receptor α (ERα)–ligand binding domain (LBD) and estrogen receptor β (ERβ)–LBD. IC50 values were calculated according to the following equation using Origin software. Y = mP100% + (mP0% – mP100%)/(1 + 10(LogIC50 – X) × Hill slope)), where Y = mP, X = Log [inhibitor], mP100% = 100% inhibition, and mP0% = 0% inhibition. The Y values were normalized from 0% to 100%. The IC50s of ES, PPT, DPN, and ICI were 3.2E-8, 6.2E-8, 2.4E-6, and 6.9E-7, respectively, for ERα and 3.5E-8, 2.0E-6, 3.1E-7, and 2.6E-7, respectively, for ERβ.
We noticed that the measured RBA value of ICI to ERβ was a little bit higher than the literature value. As far as we know, sometimes the RBA values were inconsistent when the ligand binding affinity to ERs was measured with different methods. 24 For example, IC50 values for ES and estrone were 2.82 and 9.85 nM, respectively, in Ohno et al. 24 but 13 and 626 nM, respectively, in Bolger et al. 20 That might be due to the experimental conditions and some thermodynamic factors, such as the conformation difference of tracer binding with ERs. Another thing we wanted to stress was that four typical ligands were used to verify accuracy, and some were SERMs, but our method did not identify SERMs and agonists or antagonists. This method just focused on the binding affinity of the tested compound to ERs. To test whether the binding ligand is an agonist or antagonist, other methods such as reporter gene system could be applied.
The FP method has been proven to be a powerful way to determine the RBA of the estrogenic compounds. However, none of those synthetic fluorescence compounds were suitable to be adopted in large-scale HTS. In contrast, CS, a natural fluorescence compound, was cheap and easy to obtain by both companies and individual researchers, and also the moderate affinity with ERs made CS more appropriate to perform a competitive binding assay compared with other FP probes.
However, there still exist some limitations of the proposed method. For example, fluorescent interference cannot be completely avoided. It is difficult to predict which compounds will interfere no matter which synthetic fluorescence estrogen or natural fluorescence compound is applied. More work needs to be done to avoid fluorescent interference as much as possible.
In summary, the method based on FP is rapid, simple, homogeneous, and suitable for HTS. The characteristics of CS make it more suitable to determine the binding affinity of the potent ligands and to serve as a tracer to identify the new ER ligands. Furthermore, a simple and effective receptor preparation method is also provided.
Footnotes
Acknowledgements
We thank Peng Yuan, Nan Zheng, and Lijuan Deng for technical support and valuable suggestions. We also acknowledge Professor Min Wu (Wuhan University, China) for providing plasmid PGEx-KG.
Declaration of Conflicting Interests
The authors declared no potential conflicts of interest with respect to the research, authorship, and/or publication of this article.
Funding
The authors disclosed receipt of the following financial support for the research, authorship, and/or publication of this article: NSFC (30970914 and 81172935) and the National Basic Research Program of China (973 Program) (2012CB720600).
References
Supplementary Material
Please find the following supplemental material available below.
For Open Access articles published under a Creative Commons License, all supplemental material carries the same license as the article it is associated with.
For non-Open Access articles published, all supplemental material carries a non-exclusive license, and permission requests for re-use of supplemental material or any part of supplemental material shall be sent directly to the copyright owner as specified in the copyright notice associated with the article.