
Abstract
Image-based analysis is an increasingly important tool to characterize the effect of drugs in large-scale chemical screens. Herein, we present image and data analysis methods to investigate population cell-cycle dynamics in patient-derived brain tumor cells. Images of glioblastoma cells grown in multiwell plates were used to extract per-cell descriptors, including nuclear DNA content. We reduced the DNA content data from per-cell descriptors to per-well frequency distributions, which were used to identify compounds affecting cell-cycle phase distribution. We analyzed cells from 15 patient cases representing multiple subtypes of glioblastoma and searched for clusters of cell-cycle phase distributions characterizing similarities in response to 249 compounds at 11 doses. We show that this approach applied in a blind analysis with unlabeled substances identified drugs that are commonly used for treating solid tumors as well as other compounds that are well known for inducing cell-cycle arrest. Redistribution of nuclear DNA content signals is thus a robust metric of cell-cycle arrest in patient-derived glioblastoma cells.
Introduction
Glioblastoma is the most common primary malignant brain tumor in adults, 1 characterized by necrotizing neural tissue surrounded by cells with changes in their morphological structure. The 1-year survival rate after diagnosis is merely 35%. 2 Standard-of-care therapy combines chemotherapy, radiation, and surgery, of which the pharmacological component is estimated to provide a mere 3 mo of extended survival. 3 The pharmacological treatment of glioblastoma is complicated by several factors, including the blood-brain barrier, as well as intratumoral heterogeneity4–6 and the postulated presence of stemlike tumor cells with the capability of reestablishing the tumor following treatment. 7
Two important methodological advances in the screening of glioblastoma drugs are (1) the adoption of primary cell cultures that are representative of patient diversity and (2) image-based screening methods that extract additional information relevant to assess compound response.8–14 Combining these two approaches, we here considered glioblastoma cells from the human glioblastoma cell culture (HGCC) resource. 15 Using early access data from a chemical screen of the HGCC repository, we here present image analysis methods to analyze the response of 249 compounds at 11 doses in 15 patient cases, representing multiple subtypes of glioblastoma. Given such data, we sought to establish a protocol that robustly identifies chemical compounds that affect cell-cycle phase distribution in the glioblastoma cells. A large group of commonly used chemotherapy drugs for cancer treatment are cell-cycle specific (i.e., their main role is to disrupt the cell cycle of cancer cells). Therefore, analysis of cell-cycle subpopulations of treated cells is of high interest. Image-based screening can be used to study the cell dynamics at a single time point based on population statistics.16,17
In this article, we present a method for investigating population dynamics in image-screening data by automated selection of wells of interest (i.e., those with highest drug dose but still unaffected cell count) for each drug across the cell cultures. We reduce per-cell descriptors to histograms (represented by one-dimensional vectors) and apply a blinded approach to compare the cell-cycle effects of 249 different drugs on 15 different cell cultures, established from different glioblastoma patients. Finally, we infer information on drug- and/or patient -specific cell-cycle disruption for each selected histogram using negative controls (cells treated only with the vehicle control, i.e., DMSO) as a reference. We apply our proposed analysis pipeline to numerically compare various drugs and show that it identifies positive controls as well as potential new drugs that have a general and/or patient-specific cell-cycle effect. The proposed method will thus be a practical, robust, and cost-efficient method to define cell-cycle perturbing compounds in patient-derived glioblastoma cells on a large scale.
Materials and Methods
Data Set
We used images from a drug screen of primary cell cultures derived from surgical samples of glioblastoma patients in Sweden. 15 The available data represent the early access data from a screening experiment (Johansson et al., unpublished data, 2018), which involved cell cultures that were cultured and placed in 384-well microtiter plates. The plates were organized so that the first column of wells (i.e., 16 wells) of each plate contained negative control cells treated with DMSO (i.e., the drug vehicle only). All other wells contained cells treated with 1 of 11 doses of 249 tested pharmacological substances organized across eight plates per cell culture. The drug library consisted mainly of U.S. Food and Drug Administration (FDA)–approved drugs from the Prestwick Chemical Library with the addition of some investigational experimental compounds. From all the screened drugs, only temozolomide is FDA approved for glioblastoma, but it typically requires higher concentrations than what was used in the screen to be effective in cell cultures. 3 Seventy-two hours after the automatic drug addition, the cells were fixed and stained with Hoechst for highlighting DNA and thus nuclei. Images of size 1360 × 1024 pixels were captured at four different locations in each well with 10× or 20× optical magnification, which resulted in square pixels with a side length corresponding to 0.497 and 0.993 µm, respectively. The Hoechst stain was excited with 380-nm ultraviolet light, and the peak emission was recorded at 445 nm.
Image and Data Analysis
We created a dedicated CellProfiler pipeline (Broad Institute, Cambridge, MA)18,19 for image analysis. We used the Hoechst fluorescent stain image to detect and segment individual nuclei. In this step, we used three-class Otsu thresholding 20 followed by intensity-based watershed segmentation for separating clumped cells 21 and size thresholding for rejecting potential debris (objects too small to be nuclei) and staining artifacts (large stain drops).
In our analysis pipeline, we focused on investigating cell population dynamics based on a measurement of DNA content per cell, as inspired by Chan et al. 16 The log2 of the integrated DNA intensity (intensity sum within nucleus) is interpreted as DNA content, and by analyzing the distribution of per-cell DNA content in a well, we show that it is possible to infer information about the cell-cycle status, as described below.
Dose selection
Ideally, if the doses in a dose-response screen are well chosen for a given combination of drugs and cell cultures (note that different cell cultures tend to have a slightly different sensitivity to the same drug), we would observe little or no effect with the lowest doses. The effect would intensify with the increase of the dose until a lethal concentration is reached, causing the majority of the cells to die. However, this is not always the case. Very often, a drug has the lethal dose so high that it is not included in the screen, or on the contrary, it is so toxic that even the lowest dose causes the death of more sensitive cell cultures. The drug-dose combination that kills the majority of cells would most probably also affect many healthy cells, and if cell viability were the main interest of the screen, a much simpler (not image-based) assay could be used. Therefore, we aim to elucidate the mechanism of action and to find the appropriate dose for each drug (i.e., a dose that affects cells by changing their phenotype rather than killing them). By reducing the data set to a single dose for each drug, we not only avoid redundancy of multiple doses having a very similar effect on cell populations but also quickly reject less interesting cases of too low (to cause a noticeable morphological effect) or lethal doses. Therefore, in the first step of our data analysis pipeline, we reduce the data set by finding the dose of interest for each drug. We do this by analyzing cell counts for each drug dose across all cell cultures (see
Fig. 1A
). To find the highest dose with a reasonably large number of live cells, we analyze the derivative of the combined drug-dose cell count curves across all the cell cultures (see
Fig. 1B
). We calculate the maximum value of the approximation of the first forward derivative for each drug using formula (1) with
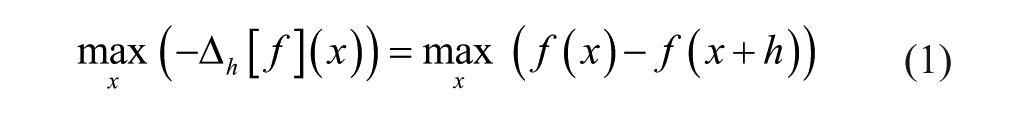
where x is the dose for a given drug and f(x) is the sum of cell counts for all cell cultures at dose x of the drug. The h = 2 was used to reduce noise and pick the dose before the largest cell count drop.
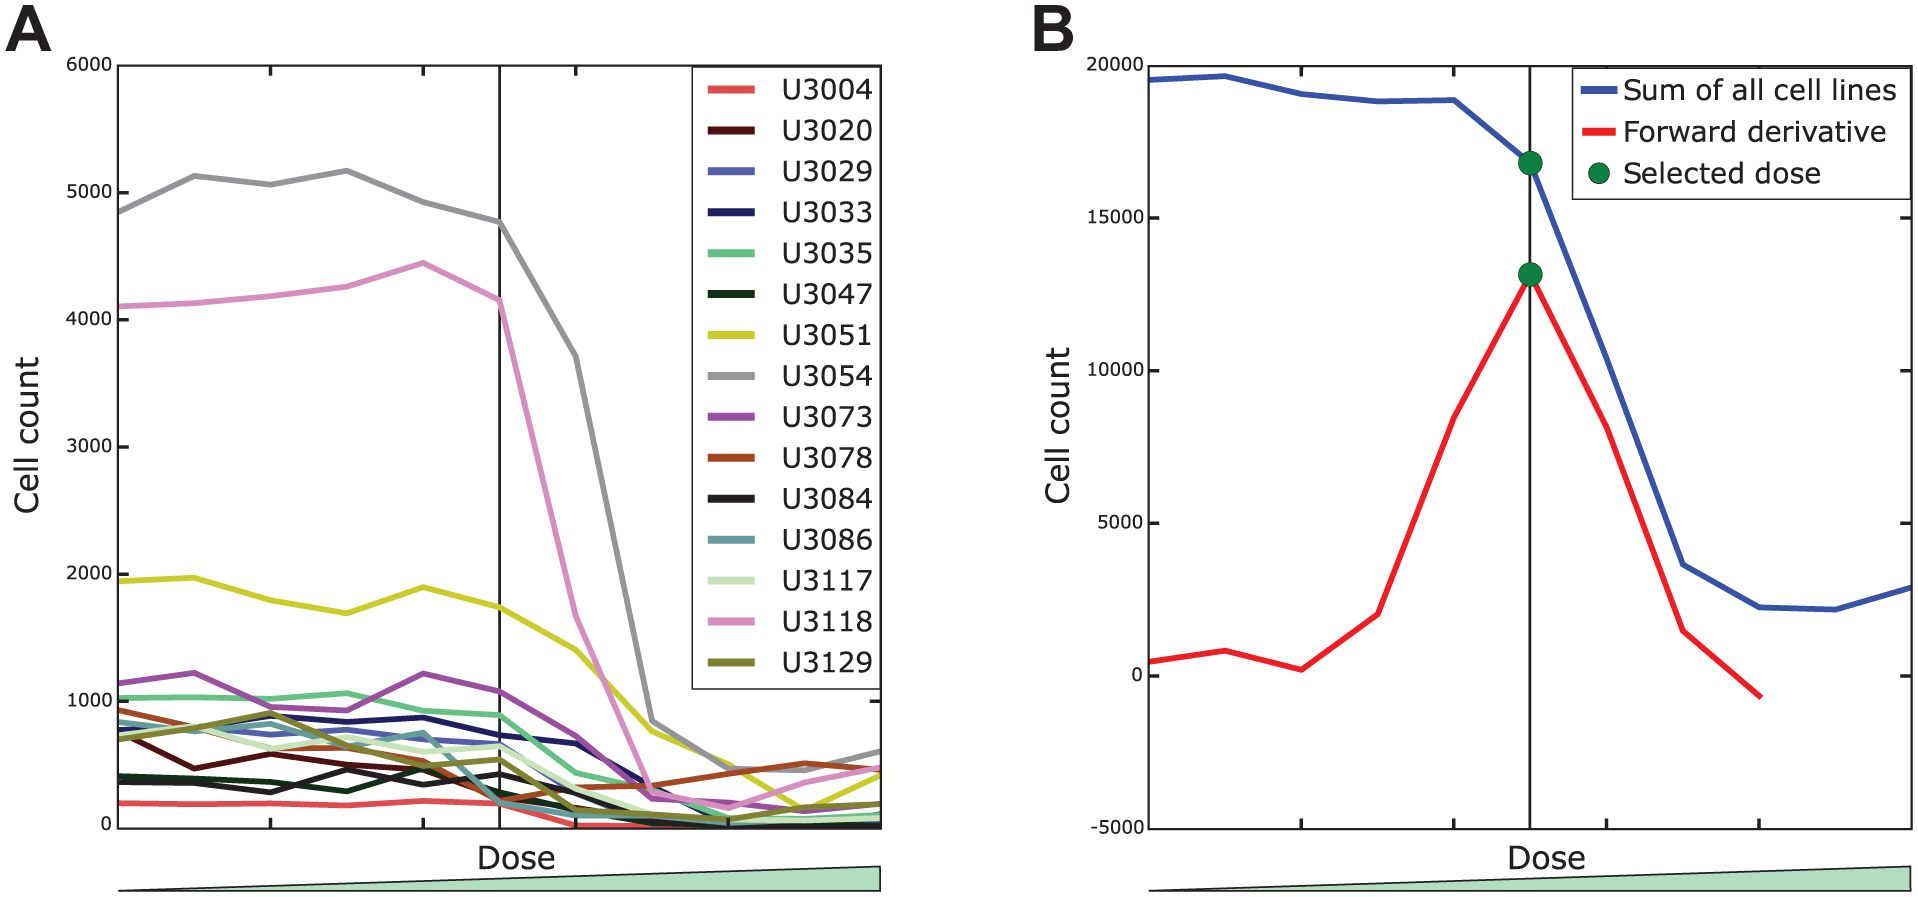
Selection of the dose of interest. (
Three of the cell cultures had much more cells than the others (see Fig. 1A ). That is because cell cultures U3051, U3054, and U3118 were imaged with 10× magnification while the rest were imaged with 20× magnification. As a consequence, the well area covered by these (10×) images is roughly four times larger and hence so are the cell counts. Although normalizing for this might appear necessary to avoid bias, we decided to use the raw cell counts in the dose selection. The main reason is that the drop in cell count is much clearer and easier to distinguish from the noise in samples with more cells. On the other hand, the obvious normalization of all cell cultures by dividing each dose cell count by the cell culture total would introduce a lot of noise from relatively large cell count fluctuations in less populated samples.
Some of the tested drugs appeared to be so strong that even the lowest dose was enough to kill the majority of the cells in the well. On the other hand, some drugs did not cause any substantial change in the cell number for the analyzed dose range. We detected these cases based on the mean and standard deviation of cell counts across all doses for a given drug and all analyzed cell cultures. In the first case, we selected the lowest dose for further analysis, whereas in the latter, the highest.
Cell-cycle analysis
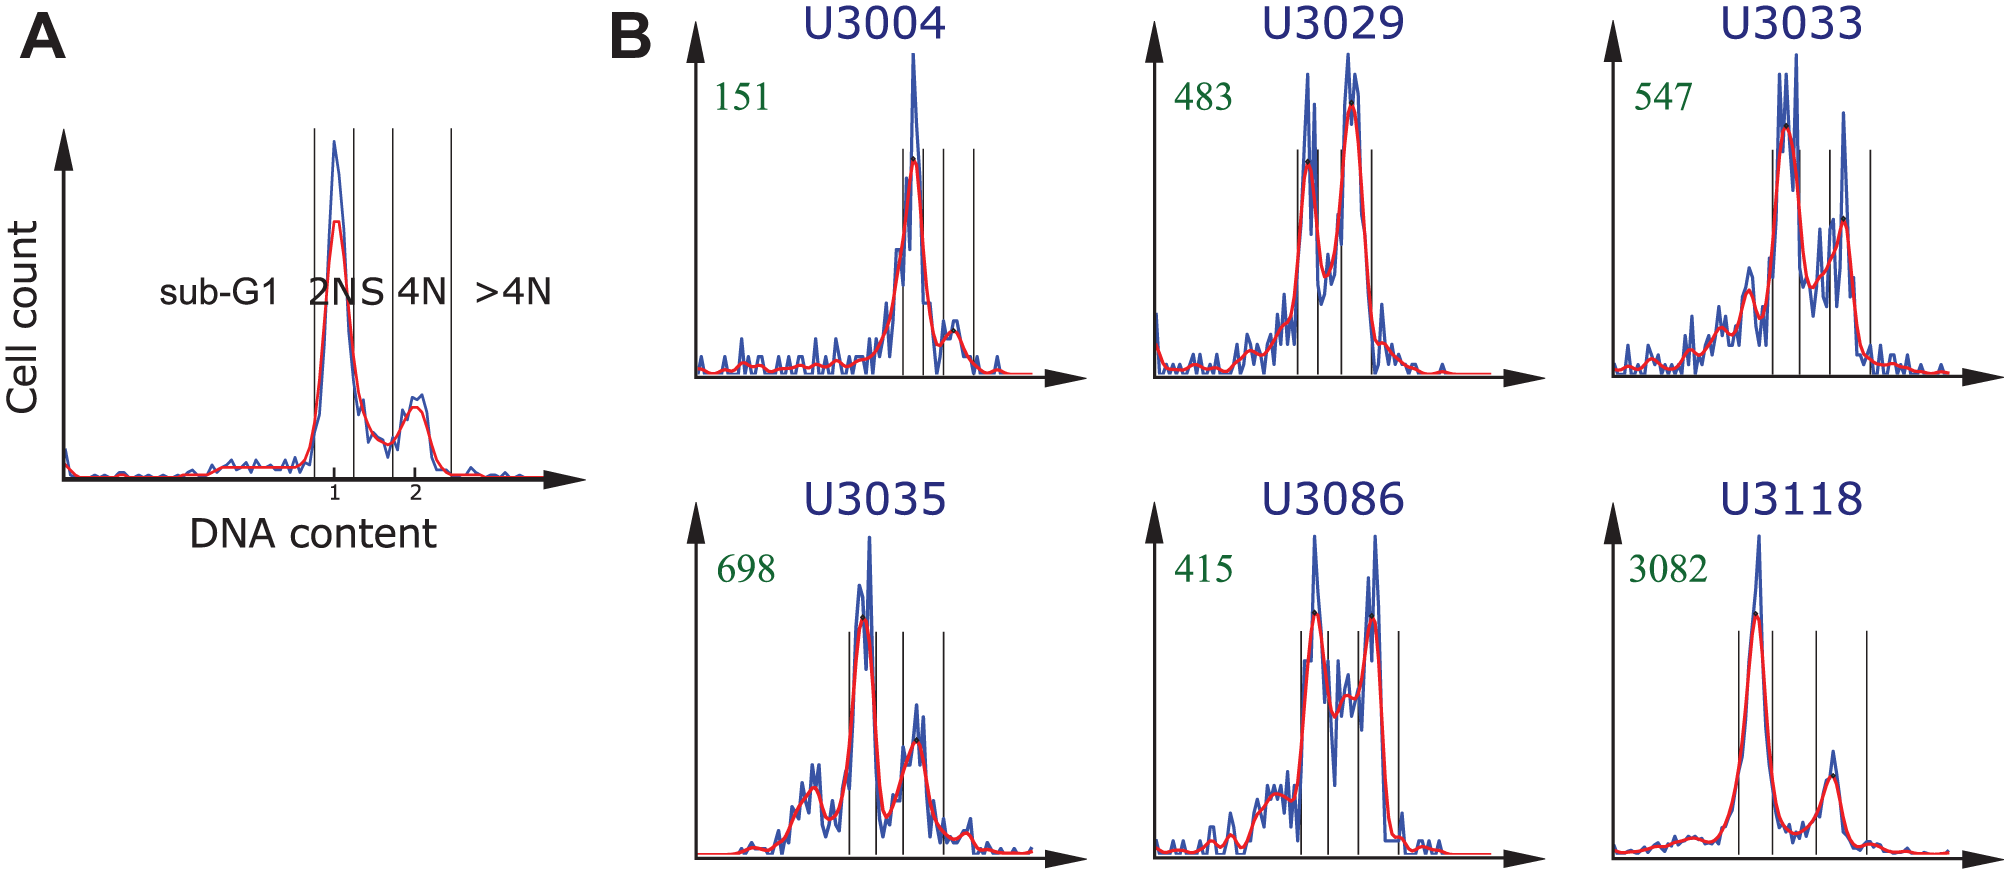
Next, we computed a histogram of the DNA content for each of the selected drug-dose combinations and for each cell culture. We transformed the DNA content with the log2 to improve the separation between cell-cycle subpopulations. 16 Each microtiter plate contained one column (i.e., 16 wells), with negative controls (cells treated with only DMSO). The negative control histograms typically presented two peaks. We used these peaks to estimate the distribution of cells in the different cell-cycle phases, as shown in Figure 2A . The higher peak on the left corresponds to the normal amount of DNA (2N), whereas the smaller peak on the right corresponds to the double amount present in the nucleus after DNA replication and prior to cell division (4N). For each plate in each cell culture, we pooled the nuclei in the 16 control wells with DMSO to create a single per-plate histogram representation of all negative control cells. We used it to determine the intensity values corresponding to the centers of the 2N and 4N subpopulations. To avoid multiple peaks at 2N and 4N locations, we first smoothed the histograms with a Gaussian filter (σ = 1.5). These peak locations were then applied to normalize the DNA intensity values, such that the position of the maximum of the 2N peak corresponded to 1 and the position of the center of the 4N DNA peak corresponded to 2. By normalizing the histogram this way, we could categorize each individual cell to one of the following five subpopulations based on its DNA content (following Chan et al. 16 ):
sub-G1: all cells with DNA intensity below 0.75
2N: DNA intensity between 0.75 and 1.25
S: DNA intensity between 1.25 and 1.75
4N: DNA intensity between 1.75 and 2.5
>4N: DNA intensity greater than 2.5
Histograms representing populations of treated cells are often shifted with respect to the negative controls. This can be caused by the applied drug increasing or decreasing the uptake of fluorescence, nonhomogeneous staining, or a variability in illumination. To cope with this problem, we used adaptive binning. We found new locations for the 2N and 4N peaks using the corresponding intensity values in negative controls as starting points and then searching for local maxima in their neighborhood. Once the new peaks were found for each of the selected wells, we normalized the histograms and defined the cell-cycle subpopulations in the same way as for the negative controls.
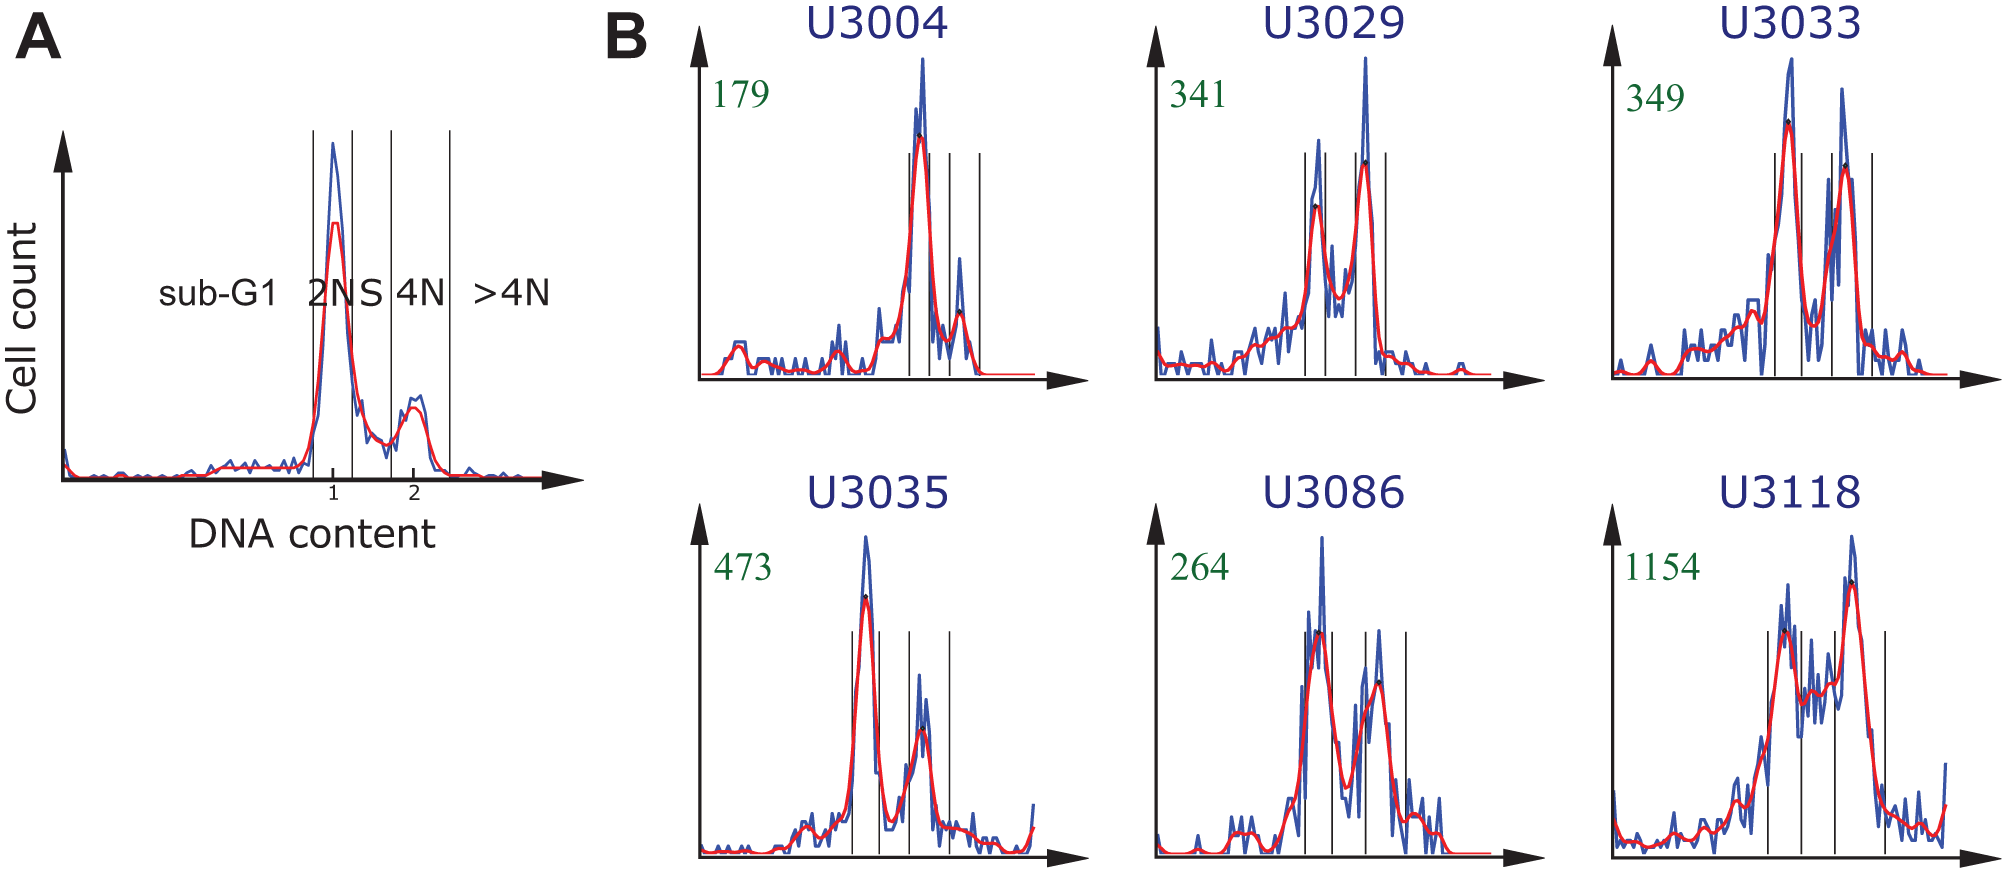
Identification of the cell-cycle subpopulations based on DNA content histograms. The blue and red lines show data before and after smoothing (Gaussian, σ = 1.5), respectively. The black vertical lines indicate the bins of the automatically identified cell-cycle subpopulations. (
We produced and analyzed the DNA content histograms with our own PopulationProfiler 22 software (Centre for Image Analysis, Uppsala University, Sweden), a cross-platform open-source tool for analysis of image-based screen data.
In this proof-of-concept study, we manually selected 15 cell cultures based on the shape of the DNA content histograms of their per-plate negative controls (i.e., 8 histograms per cell culture). We selected these cell cultures as they showed DNA content histograms very similar to the typical negative controls of cancer stem cells CSCs populations (see Fig. 2A ). This way, we avoided confusion of an atypical population behavior with a drug effect on the cell-cycle.
Drug detection
We designed and evaluated two approaches for drug detection: (1) searching for the drugs that induce the largest differences from the negative controls and (2) searching for outliers among all data points including the negative controls. In both cases, we decided to reduce noise by keeping only those samples that contained at least 100 cells after the treatment.
Differences from negative controls
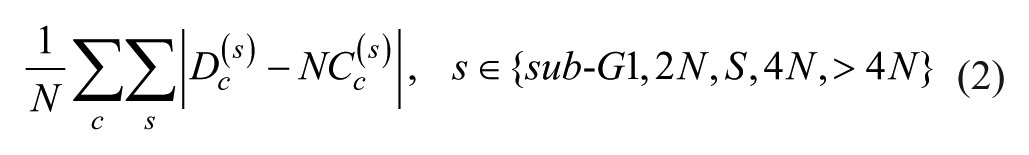
After the histograms were divided into the five cell-cycle subpopulations, we normalized by the total number of cells in each histogram so that the sum of the histogram was equal to 1. For each cell culture c, we compared the cell-cycle subpopulations of the selected drug-dose combinations Dc with the corresponding plate negative control NCc. We approximated the cell-cycle subpopulation dissimilarity as the sum of absolute differences between the corresponding cell-cycle subpopulations
Outliers
The majority of the drugs in the screening collection did not show a clear effect on the cell cycle. We used this fact to design the approach in which we considered all selected drug-dose samples
By visually analyzing the DNA content histograms, we noticed that the main source of variation between the same treatment samples were the two extreme cell-cycle subpopulations: sub-G1 and >4N. The sub-G1 population could be a result of apoptotic cells and the >4N population a result of mitotic misaggregation. However, we decided to focus on the 3-dimensional space with the 3 main cell-cycle subpopulations: 2N, S, and 4N. This leaves two ways to normalize the data: (1) before or (2) after the sub-G1 and >4N subpopulations are excluded. In the first case, we passed the information about the cell count sum of these two subpopulations indirectly to the reduced data, whereas in the second case, we did not use any information on sub-G1 and >4N in the drug selection.
Once the data were normalized, we used two different outlier selection methods implemented in Weka 23 (University of Waikato, Hamilton, New Zealand): bagged local outlier factor (BLOF) 24 and interquartile range. BLOF computes an outlier score for each instance in the data set based on its neighborhood statistics. 24 We used the bagged variation of this algorithm that performs multiple runs each time using different data projections and combines the results for improved outlier detection. Once the outlier scores were computed, we set a threshold to classify the data points as either belonging to the cluster or as outliers (negative or positive effect). In our setup, we interactively set this threshold to 30 and 32 for data normalized before and after the sub-G1 and >4N exclusion, respectively, and 25 BLOF runs. We could use the default number of BLOF runs (10); however, a larger number produces a larger spread of the outlier scores, which results in a lower sensitivity to the threshold choice. These parameters resulted in a similar number of outlier data points to the interquartile range for the corresponding data set.
The second method detects outliers based on the interquartile ranges. In this case, we defined the outliers as the data points x fulfilling the following inequalities:

or

where Q1 is the 25% quartile, Q3 is the 75% quartile, IQR is the interquartile range (the difference between Q1 and Q3),
In both outlier detection methods, we used the ratio of outlying cell cultures of a given drug-dose combination (Dc) as the criterion to sort and rank the drugs according to their effect.
Doxorubicin has a known effect on the cell-cycle distribution25,26 and shows a clear shift at the lowest dose in our experiments. We used this as a positive control in the last step to select the drugs with the strongest cell-cycle effect for each drug selection method. For each method, we used doxorubicin as a soft threshold and selected only those drugs that ranked higher than it (i.e., drugs showing stronger effect on the cell-cycle than doxorubicin).
Visual result verification
After the drug selection, we visually assessed the corresponding image data and the segmentation quality. We visually analyzed neighboring doses to verify the drug selection and to investigate the nature of the drug effect on the cell cycle.
Results
Table 1 presents the drugs with the strongest effect on the cell cycle selected by the five methods. We limit the presentation to compounds that satisfied the soft threshold (i.e., those having a stronger effect than doxorubicin) in at least one of the methods. The drugs were sorted according to their average rank across all methods. Although the drug ranks are slightly different between methods, the selection of the top drugs converged to the same group with an average rank below 20 for the first 13 drugs (see Table S1 in the Supplemental Material for the individual drug ranking with each of the selection methods). This list of compounds contains many well-known cell-cycle–specific agents currently used in chemotherapy. All drugs except for colchicine, RITA, zonisamide, and hexetidine are FDA-approved chemotherapeutic drugs. Although none of the selected drugs are FDA approved for glioblastoma, half of them are listed in clinical trials for glioma patients. 27 The top-scoring compound, camptothecine, is a topoisomerase inhibitor believed to block the ligation step of DNA strands in the cell cycle, hence generating breaks that lead to apoptosis. The antibiotic antineoplastic agent dactinomycin, the anthracyclines daunorubicin and idarubicin, as well as mitoxantrone are DNA intercalating drugs known to cause single-strand breaks and G1 phase arrest. The alkaloid colchicine and the vinca alkaloid vinblastin are antimicrotubule agents exerting their action by disrupting microtubule formation leading to mitotic arrest, and bortezomib and carfilzomib are first- and second-generation proteasome inhibitors, known to induce cell-cycle arrest and apoptosis.
Drug Selection Results. a
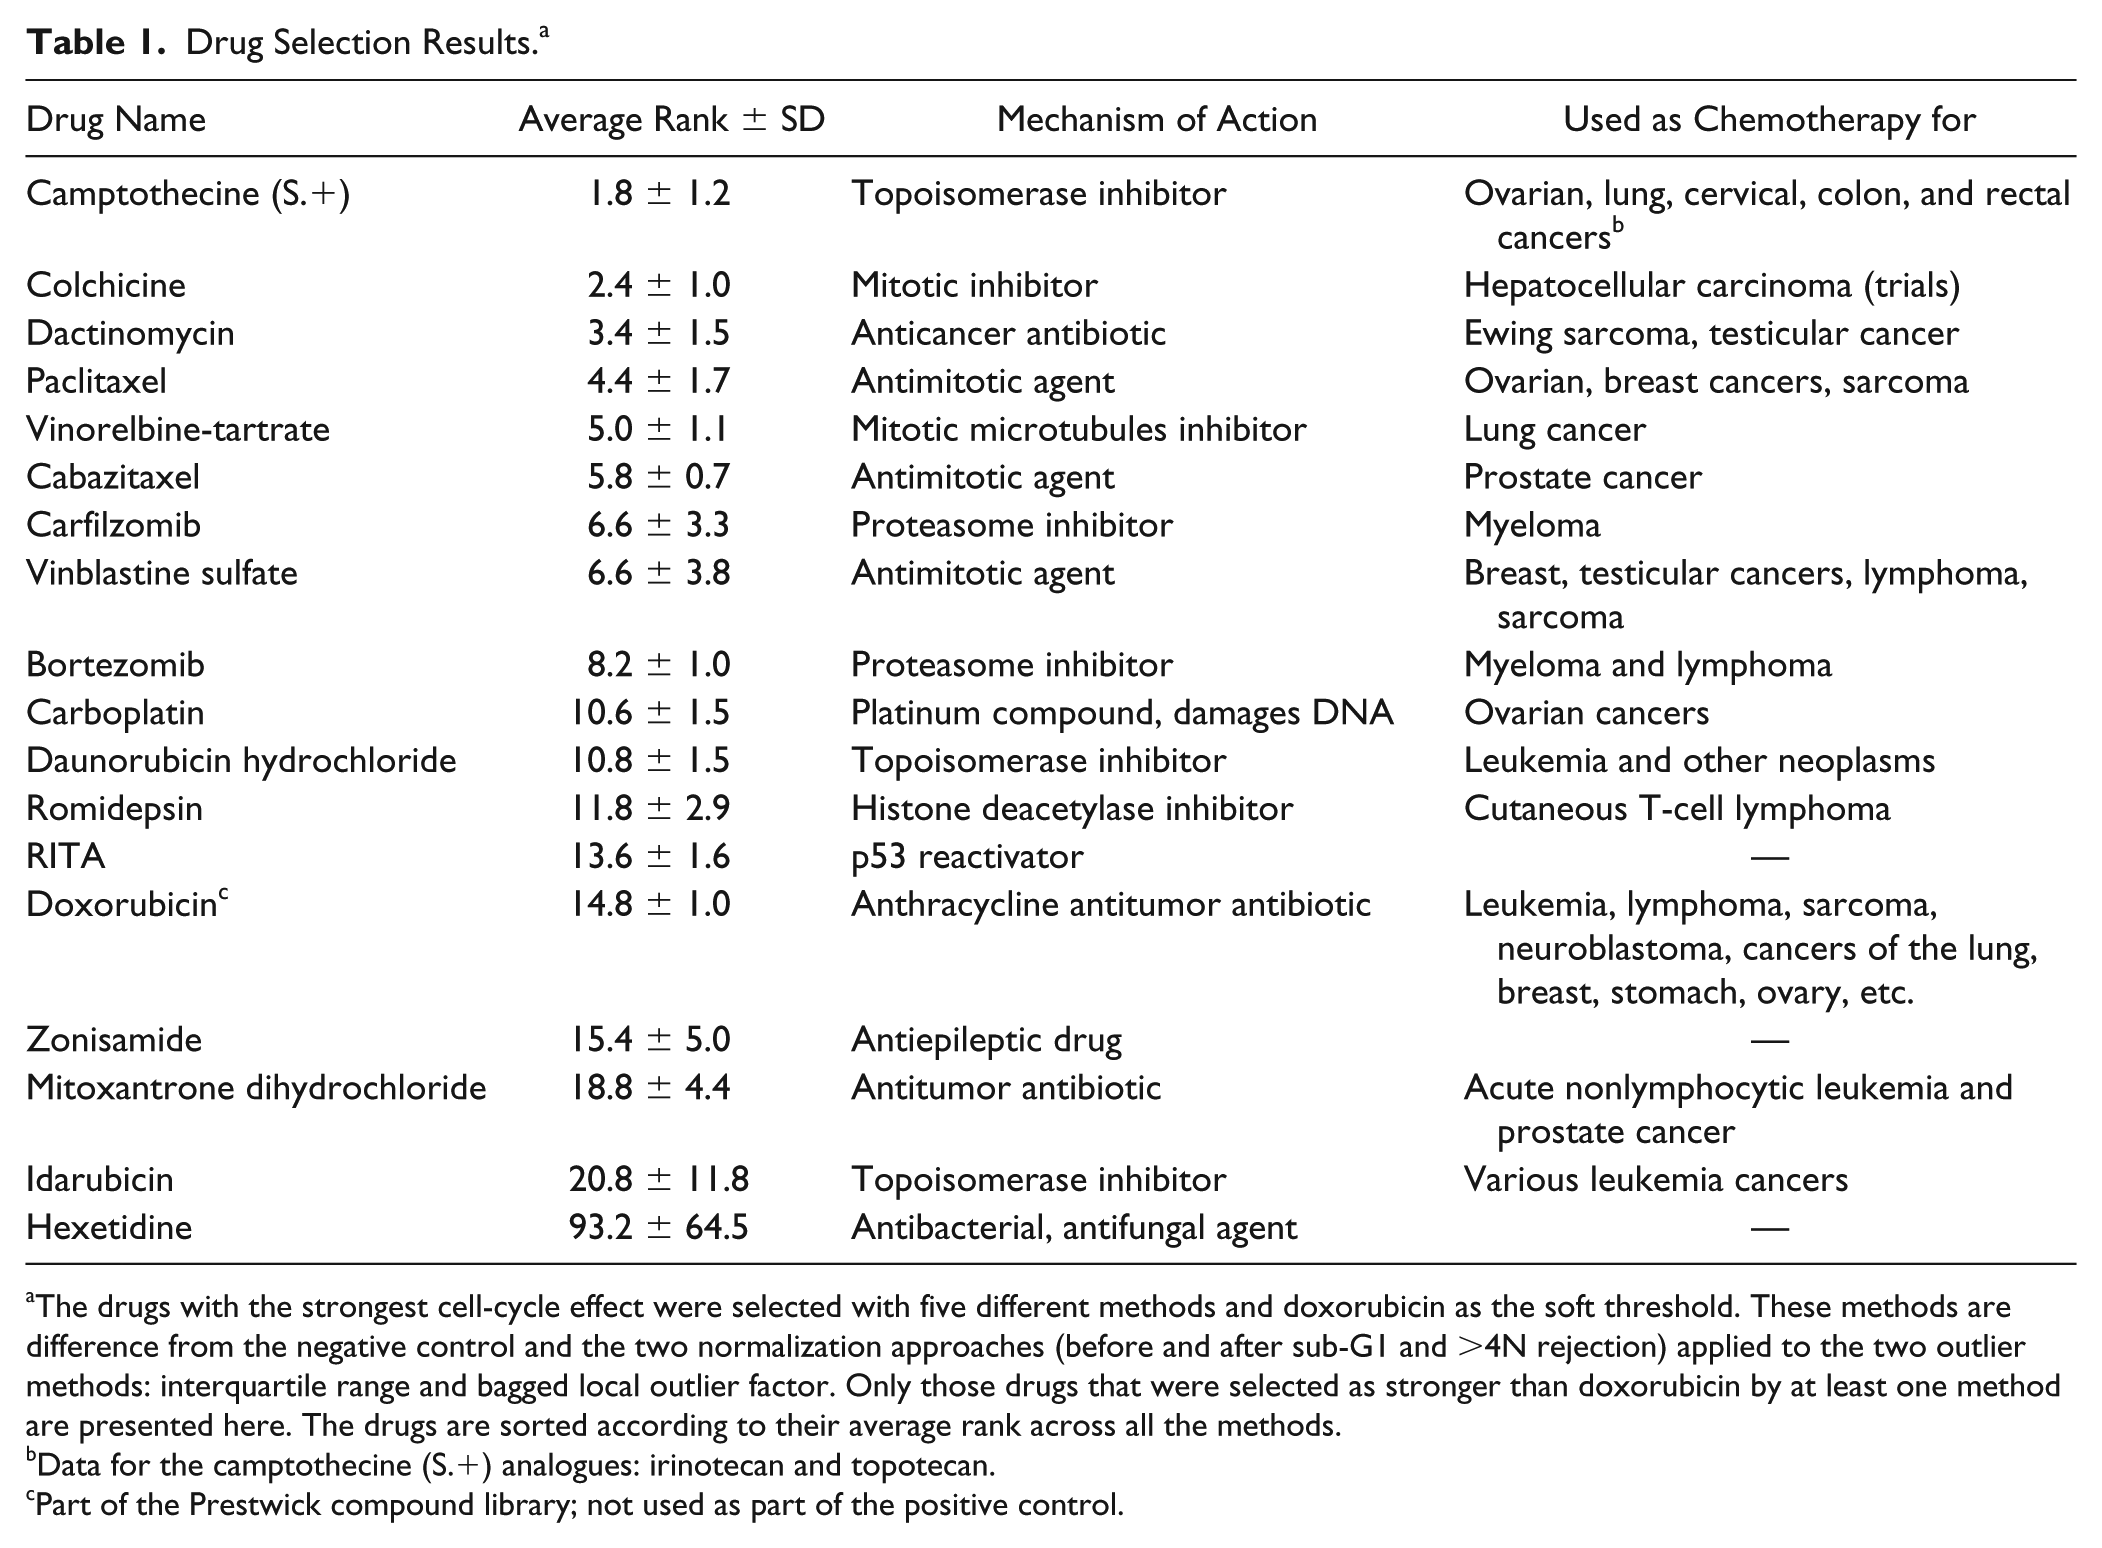
The drugs with the strongest cell-cycle effect were selected with five different methods and doxorubicin as the soft threshold. These methods are difference from the negative control and the two normalization approaches (before and after sub-G1 and
Data for the camptothecine (S.+) analogues: irinotecan and topotecan.
Part of the Prestwick compound library; not used as part of the positive control.
The DNA content histograms of the selected dose of interest for cabazitaxel and six different cell cultures are presented in Figure 2B . Cabazitaxel is a cell-cycle–specific drug used in chemotherapy for castrate-resistant metastatic prostate cancer. As in the case of vinorelbine-tartrate and paclitaxel, it binds to and stabilizes tubulin, resulting in the inhibition of microtubule depolymerization and cell division, mitotic arrest, and the inhibition of tumor cell proliferation. Because it penetrates the blood-brain barrier, it may be potentially useful for treating multidrug-resistant tumors. Results from a phase II clinical trial for cabazitaxel in glioblastoma patients are pending (NCT01866449). 27 A strong cell-cycle effect is noticeable in all cell cultures except U3004. This cell culture was characterized by a resistance to the majority of the selected drugs (see Suppl. Table S2 ). Cell cultures U3033 and U3035 showed an induced accumulation of cells with the 4N DNA content, whereas the other three cell cultures (U3029, U3086, and U3118) also showed an increase of cells in S phase, indicating a possible S-phase arrest effect.
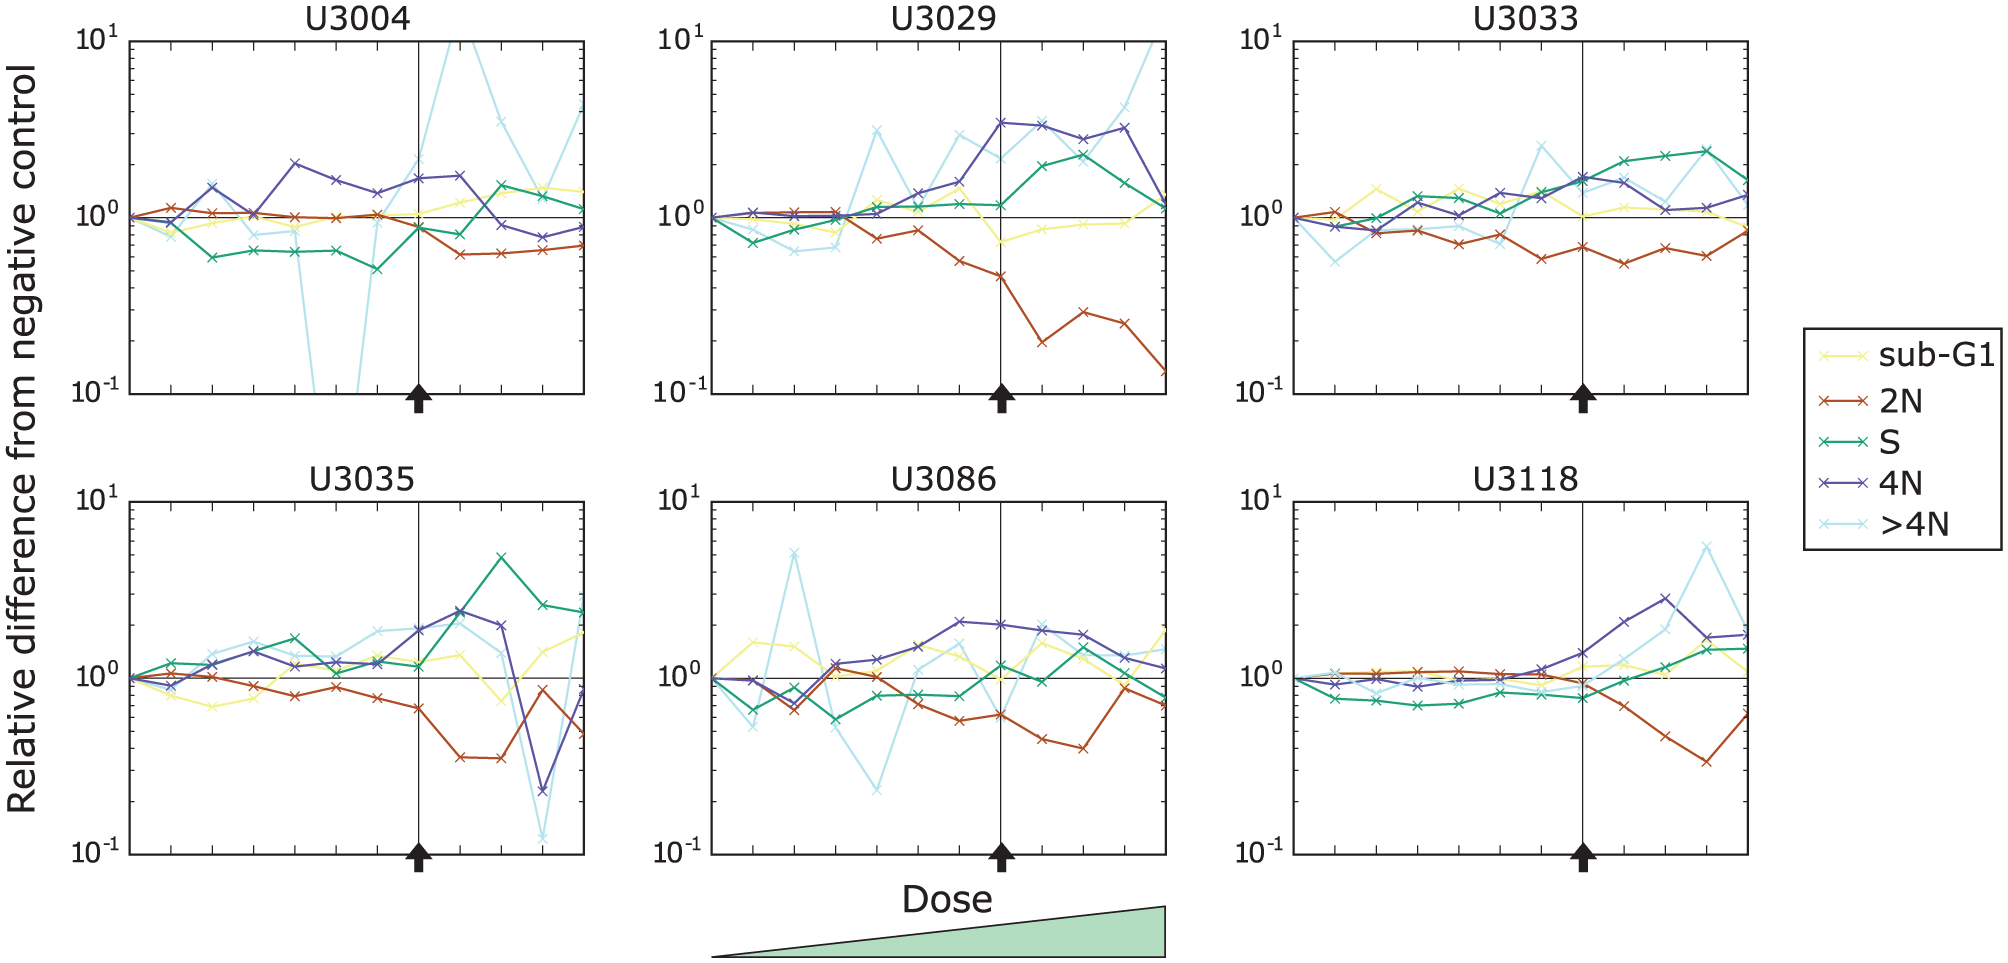
In Figure 3 , we present the effect of cabazitaxel on the cell-cycle distribution of the same six cell cultures as in Figure 2B as a function of the dose. We can observe that the main effect (an increase of 4N cells) in the five cell cultures by the drug is stable and increases only slightly with the drug dose (dark blue lines). The indicated effect of an increase of cells in S phase for U3029, U3086, and U3118 is not as stable over the doses except for U3035 (green lines).
Drug response of the six cell cultures (U3004, U3029, U3033, U3035, U3086, and U3118) to the increasing doses of cabazitaxel. Each curve represents a relative change to a particular cell-cycle subpopulation contribution with respect to the corresponding negative control. The vertical axis was scaled logarithmically. The black horizontal line indicates no change, and the black arrow indicates the selected dose of interest.
Carboplatin is a cell-cycle–nonspecific drug used in chemotherapy for a wide range of cancer types including ovarian, lung, head and neck, endometrial, esophageal, bladder, breast, and cervical cancers. It is classified as an antineoplastic in the class of alkylating agents that stop tumor growth by cross-linking guanine bases in DNA double-helix strands, directly attacking DNA. This makes the strands unable to uncoil and separate. As this is necessary for DNA replication, the cells can no longer divide. Carboplatin is in clinical trials for patients with glioma. 27 We observed a strong cell-cycle effect (arrest in S and 4N) in cell cultures U3029 and U3086 (see Fig. 4B ). Cell cultures U3033 and U3035 showed a moderate effect, and the cell cultures U3004 and U3118 showed a negligible or very gentle change.
Identification of the cell-cycle subpopulations based on DNA content histograms. The blue and red lines show data before and after smoothing (Gaussian, σ = 1.5), respectively. The black vertical lines indicate the bins of the automatically identified cell-cycle subpopulations. (
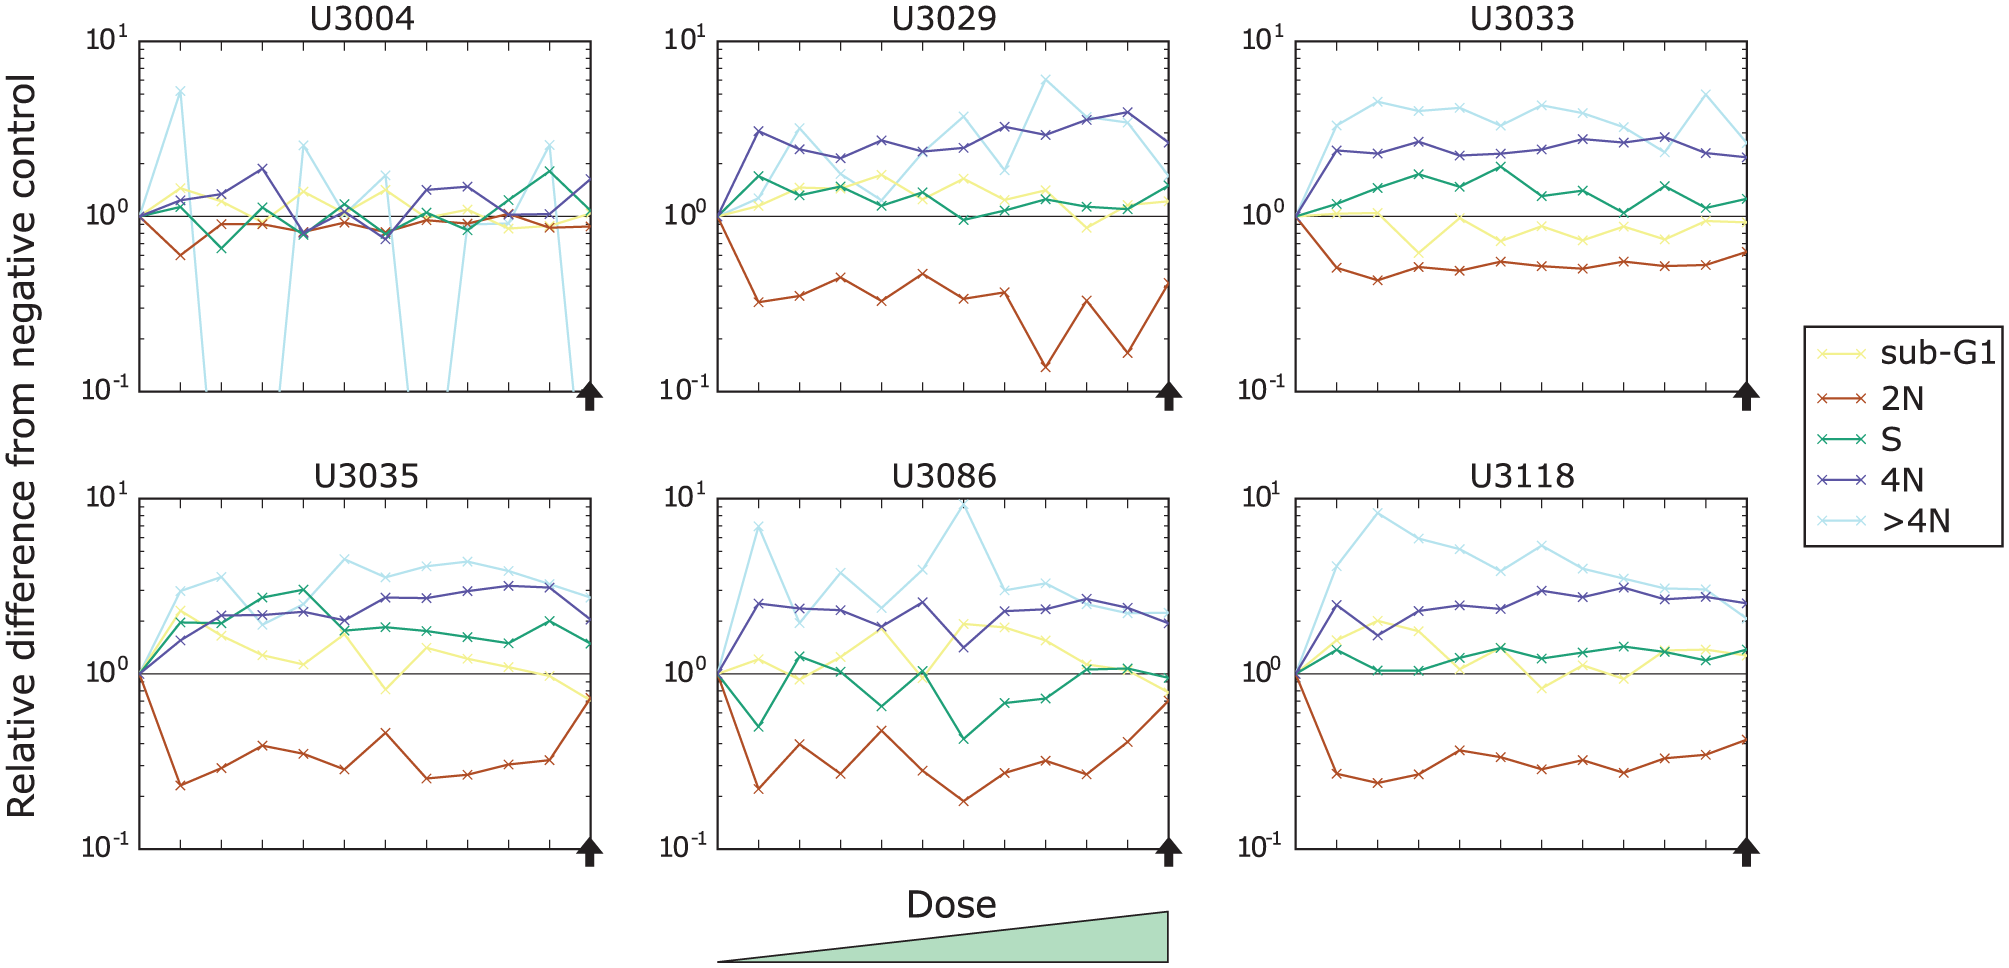
We present plots corresponding to Figure 3 but for carboplatin in Figure 5 . Here, we can observe that the drug causes a decrease of the 2N subpopulation and an increase of the S and 4N subpopulations. Contrary to cabazitaxel, the effect of carboplatin increases with the dose (compare Fig. 5 [carboplatin] and Fig. 3 [cabazitaxel]).
Drug response of the six cell cultures (U3004, U3029, U3033, U3035, U3086, and U3118) to the increasing doses of carboplatin. Each curve represents a relative change to a particular cell-cycle subpopulation contribution with respect to the corresponding negative control. The vertical axis was scaled logarithmically. The black horizontal line indicates no change, and the vertical line and black arrow indicate the selected dose of interest.
The remaining DNA content histograms and dose-response plots (i.e., for all other cell cultures and the selected compounds) can be found in the Supplemental Material.
Discussion
Image-based screening allows analysis of multiple phenotypic parameters from a single experiment, as discussed in the introduction. Although this wealth of information certainly can lead to interesting observations and discoveries, in this article, we have focused on investigating only one of them. We have described an analysis pipeline that allowed us to numerically compare various drugs and concentrations and to identify those that have a general and/or patient-specific cell-cycle effect on patient-derived primary glioblastoma cancer stem cells. Our results provide new information about (1) which drugs have activity in glioma cancer stem cells and (2) the extent to which drugs vary across patient cases. Lo et al. 28 also suggest image-based cell-cycle phenotyping for investigating drug repurposing but only on standard cancer cell lines. Even more detailed information on cell-cycle behavior may be obtained via time-lapse studies using genetically encoded fluorescent probes such as the FUCCI system.29,30 Such an investigation would, however, require genetic modification of each of the 15 primary cell cultures and was out of the scope for this study.
In our study, there are of course a number of choices that ought to be discussed. When setting up the screen, special care was taken to place the same number of cells in each well. However, the cell count in the segmented images varies substantially between different wells. This is caused by many factors such as cell death resulting from the applied drug, different rates of cell division before fixation, cell detachment during fixation and staining, limited depth of focus, segmentation errors, and finally the fact that despite capturing multiple images per well, only a part of its total bottom area is covered. In many cases, the selected drug doses were too high (even the lowest doses) for more sensitive cell cultures, which caused cell death and further reduced the number of samples useful for drug selection.
On a similar note, the difference in sensitivity between cell cultures is not taken into consideration in the first step of the screen when averaging over all cell cultures to find the dose of interest for a drug. The histograms at different doses should hence be analyzed for detected hits.
The proposed cell-cycle histogram peak adjustment for each well based on its corresponding negative control is stable for small to moderate shifts but fails when the histogram shift is too large. If the 2N peak appears at a position close to the 4N peak in the corresponding control, there is a risk that it will be mistaken for the 4N peak, and a small local maximum (probably noise) in the sub-G1 subpopulation will be considered as the 2N peak. More importantly, histogram shifting might represent a relevant drug effect. An alternative approach would hence be to use fixed intensities for the 2N and 4N subpopulation centers found in the negative controls (i.e., no adjustment). However, in this case, a histogram shift caused by the drug might be easily confused with illumination variation or nonhomogeneous staining and, as a consequence, incorrectly interpreted. The current implementation uses the 2N and 4N peak intensities found for the negative controls only when no local maxima can be found for a particular well.
We performed the validation of the proposed analysis as a blind experiment (i.e., used a code name for each drug rather than its actual name). This way, we have avoided biasing the analysis and potential drug selection to catch the positive controls directly. Nevertheless, using the presented analysis method, we were able to automatically identify many drugs that are well known for causing changes to the cell-cycle distribution and are currently in clinical trials for glioma patients and/or are commonly used for treating other types of tumors. The only exception is hexetidine, which is, however, a low-ranked hit only detected as having a stronger effect than doxorubicin with one of the proposed methods, and a visual analysis of the DNA histograms do not indicate any clear cell-cycle effect.
All compared drug selection methods converged to a very similar list of drugs differing only in their ordering. Therefore, any of the proposed methods could be used, and the final choice in other applications depends on the subtle drug selection and sorting differences desired in the particular application. The proposed analysis pipeline can be easily modified to allow different drug selection criteria. Instead of the rigid threshold for determining positive and negative samples, a fuzzy classification can be used to not only measure the drug success rate but also to estimate the strength of its effect on the cell cycle. In the case of the difference from the negative controls, considering only a subset of, or individual, cell-cycle subpopulations generates a different drug sorting.
Cancer cell-cycle disruption is typically a dynamic process. However, we analyze and draw conclusions on cell populations captured in static images. Furthermore, working with images captured at only one fixed time point (and not a time series) makes this analysis even more challenging. Many treatments induced a heterogeneous phenotypic response across the cell population in each sample. In practice, individual cells, even from the same subtype, may respond differently to the same treatment. 31 This is especially typical for cancer stem cell cultures in which the heterogeneity constitutes one of the major analysis challenges. 32 Moreover, because of the single acquisition, the differentiation between a final developed phenotype and a transition cell state is very challenging and adds to the intrasample heterogeneity. On the other hand, even though including time information might reveal more, it simultaneously increases the complexity of both data analysis and interpretation of results. Finally, all these inter- and intrasample variations are expected in vivo, and therefore, image-based screening that is able to capture them is advantageous over other types of screens. Despite all of these challenges, our proposed cell-cycle analysis approach proves to be successful in identifying drugs with general as well as cell culture heterogenic effects.
The drug detection approaches (difference from negative controls, interquartile range and BLOF) suggested here were designed to find compounds with a strong cell-cycle effect across multiple cell cultures. If the targets were drugs with a strong effect but not necessarily affecting many cell cultures, the outlier detection could be focused differently. One possibility would be to use the strongest outlier score (for BLOF and the difference to negative controls) instead of the average as used here.
Supplemental Material
Supplementary_Material_for_Image-Based_Drug_Detection_by_Matuszewski_et_al – Supplemental material for Image-Based Detection of Patient-Specific Drug-Induced Cell-Cycle Effects in Glioblastoma
Supplemental material, Supplementary_Material_for_Image-Based_Drug_Detection_by_Matuszewski_et_al for Image-Based Detection of Patient-Specific Drug-Induced Cell-Cycle Effects in Glioblastoma by Damian J. Matuszewski, Carolina Wählby, Cecilia Krona, Sven Nelander and Ida-Maria Sintorn in SLAS Discovery
Footnotes
Acknowledgements
The computations were performed on resources provided by the Swedish National Infrastructure for Computing (SNIC) at Uppsala Multidisciplinary Center for Advanced Computational Science (UPPMAX). The biological samples were processed and imaged at the SciLifeLab cell-screening facility.
Supplemental material is available online with this article.
Declaration of Conflicting Interests
The authors declared no potential conflicts of interest with respect to the research, authorship, and/or publication of this article.
Funding
The authors disclosed receipt of the following financial support for the research, authorship, and/or publication of this article: The project was funded through the AstraZeneca-Science for Life Laboratories joint research program, the Swedish research council (grants 2012-4968 to C.W. and 2014-6075 to I.-M.S.), and the Swedish strategic research program eSSENCE.
References
Supplementary Material
Please find the following supplemental material available below.
For Open Access articles published under a Creative Commons License, all supplemental material carries the same license as the article it is associated with.
For non-Open Access articles published, all supplemental material carries a non-exclusive license, and permission requests for re-use of supplemental material or any part of supplemental material shall be sent directly to the copyright owner as specified in the copyright notice associated with the article.