
Abstract
Advances in automated imaging microscopy allow fast acquisitions of multidimensional biological samples. Those microscopes open new possibilities for analyzing subcellular structures and spatial cellular arrangements. In this article, the authors describe a 3D image analysis framework adapted to medium-throughput screening. Upon adaptive and regularized segmentation, followed by precise 3D reconstruction, they achieve automatic quantification of numerous relevant 3D descriptors related to the shape, texture, and fluorescence intensity of multiple stained subcellular structures. A global analysis of the 3D reconstructed scene shows additional possibilities to quantify the relative position of organelles. Implementing this methodology, the authors analyzed the subcellular reorganization of the nucleus, the Golgi apparatus, and the centrioles occurring during the cell cycle. In addition, they quantified the effect of a genetic mutation associated with the early onset primary dystonia on the redistribution of torsinA from the bulk endoplasmic reticulum to the perinuclear space of the nuclear envelope. They show that their method enables the classification of various translocation levels of torsinA and opens the possibility for compound-based screening campaigns restoring the normal torsinA phenotype.
Introduction
T
High-resolution microscopes, combined with the specificity of fluorescent probes for labeling targets of interest, provide accurate determination of protein localization and valuable information for understanding the molecular mechanisms that underlie the cell functions. However, an accurate spatial localization of fluorescent signals can be challenging as biological samples are 3D. Moreover, most of automated confocal systems along with the image analysis software are dedicated to 2D image mining.
Nowadays, a large number of techniques for 3D biological fluorescence microscopy acquisition are available, such as wild-field fluorescent microscopy (coupled with deconvolution), as well as point or line scanning and spinning disk confocal microscopy. Several automated imaging platforms are designed to extract precise 2D planes from a 3D volume, with a limited out-of-focus signal corruption. This confocal specificity is usually coupled with an automated Z plane scan, making possible the setup of a fully automatic 3D image-based screening. Although 3D object detection and analysis has been widely studied in the image-processing community, the screening specificities and constraints make these processes even more challenging. Indeed, the large amount of images generated requires developing new approaches applied specifically to this paradigm.
Regarding the need for 3D phenotypic cellular analysis adapted to high-content screening, we developed a fast and automatic imaging complete scheme (
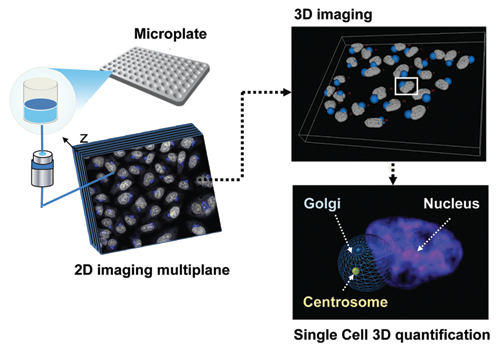
Steps in 3D high-content acquisition and analysis. Z stack of images from fluorescent-stained cells in 96-well optical bottom plates acquired using automated microscopy. The images stack undergoes automated 3D processing, including objects detection and interobject mapping for each single cell. As seen in this example, the relative position of the centrosome, Golgi apparatus, and nucleus can be quantified within the 3D cellular context.
Material and Methods
Cellular assay in 96-well plates
HeLa cells (American Type Culture Collection, Manassas, VA) were cultivated in high-glucose glutamax Dulbecco’s modified Eagle’s Medium (Invitrogen, Carlsbad, CA) supplemented with 110 mg/mL sodium pyruvate, 10% fetal calf serum (GIBCO, Carlsbad, CA), and 1% penicillin streptomycin (Invitrogen). In total, 3500 cells/well were dispensed into 96-well optical bottom plates (Greiner Bio One, Monroe, NC) and cultivated for 24 h. We have developed HeLa cell stable cell lines expressing yellow fluorescence protein (YFP)–tagged fibrillarin known to target to the nucleoli. 1 We also developed 2 independent HeLa cell stable lines expressing torsinA grafted with the green fluorescent protein (GFP) naturally expressed in the endoplasmic reticulum (ER), for the wild-type form, but translocated to the nuclear membrane (NM) upon introduction of a mutation (WB(EQ)) that typically stabilizes torsinA proteins in a substrate-bound state. 2 Nuclei were labeled using DNA-specific DRAQ5™ (Biostatus, Leicestershire, UK) fluorescent dye following the instructions of the manufacturer.
Golgi apparatus and centrosome were labeled with antigiantin and antipericentrin antibodies (Abcam, Cambridge, UK) followed by secondary goat antirabbit antibodies Alexa 488 and 532 (nm) fluorescently labeled (Molecular Probes, Eugene, OR). HeLa cell lines attached to plastic optical bottom plates were rinsed twice with phosphate-buffered saline (PBS) and then fixed in 4% paraformaldehyde solution for 10 min. After several washes, the permeabilization was performed with 0.1% Triton for 10 min. Cells were rinsed in PBS and then incubated with a 1:1000 dilution of rabbit antigiantin and/or mouse antipericentrin in PBS overnight at 4°C. After washing with PBS (3 × 10 min), cells were incubated with Alexa 488 goat antirabbit and Alexa 532 goat antimouse secondary antibody (1:1000) solution for 60 min at room temperature. In a final step, the cells were washed 3 times for 10 min with PBS before the addition of 5 µM of DRAQ5™ in PBS for 10 min at room temperature.
FACS analysis
To quantify DNA, we stained HeLa cells with 5 µM of DRAQ5™ for 15 min and harvested them. Samples of 2000 cells were analyzed by flow cytometry (FACSAria flow cytometer, Becton Dickinson, Franklin Lakes, NJ), and nucleus staining distribution was analyzed with FACSDiva software. For each sample, the cell population was analyzed after excluding dead cells and cell doublets.
3D image acquisition
The Z stacks were obtained with an automated Nipkow disk confocal microscope (Opera, Evotec, Hamburg, Germany) equipped with 2 water-immersed plan apochromat 20× and 40× lenses of NA 0.7 and 0.9, respectively (Olympus, Tokyo, Japan). We acquired in each well 2 to 3 Z stacks of spatial dimension 225 × 170 × 20 µm3 and 450 × 340 × 30 µm3 for 40× and 20×, respectively. The 3D alignment and intensity normalization were performed from Z stacks acquired from 10-µm fluorescent beads (96-Whatman without skirt; Evotec). Fluorescent-stained organelles such Golgi-Alexa-488 staining, nucleoli (fibrillarin-YFP), and ER or NM (GFP-torsin) were acquired using a 488-nm laser coupled with a 535/50-nm band-pass filter. Centrioles-Alexa-532 and Nucleus-DRAQ5 were detected using, respectively, a 532-nm and 633-nm excitation laser source coupled with 585/50-nm band-pass and 650-nm long-pass filters.
Software development
A regular image-processing framework can be decomposed in 3 main stages: (1) image enhancement, (2) object detection, and (3) information extraction (
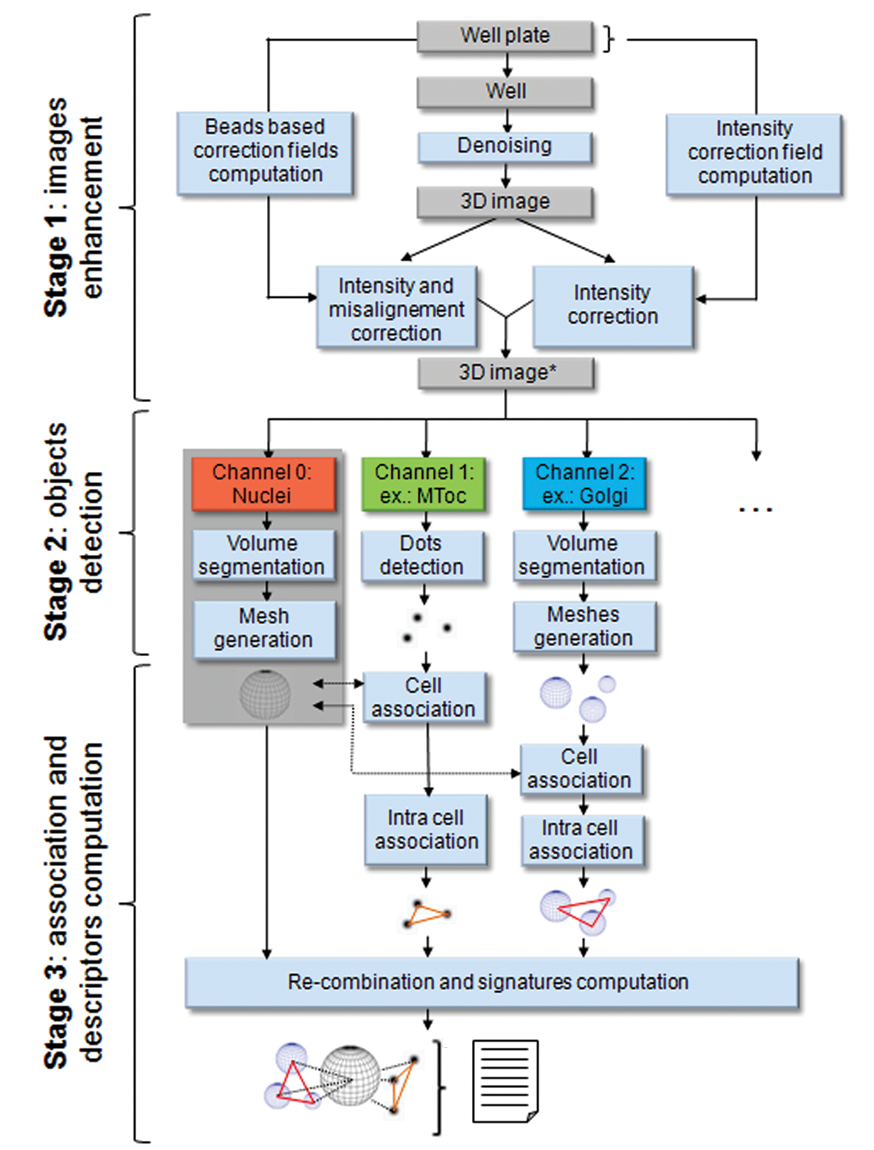
3D image analysis workflow divided in 3 main stages. Stage 1: the automated imaging platform provides Z stack images, and a series of optical image enhancement are operated. Stage 2: the resulting image is separated according to each channel. Depending on each organelle’s nature, different detection algorithms are applied and objects are reconstructed in 3D. Stage 3: the organelles are associated and the descriptors are then computed, providing information, including organelle arrangement description.
In the following sections we describe the major specificities and issues of 3D image based screening scheme and proposed solutions related to accuracy and optimization.
Stage 1: optical image enhancement
The denoising preprocessing is of primary importance, especially in confocal microscopy imaging when the photon number is low. Indeed, due to the corpuscle property of light, the signal is corrupted by a multiplicative noise known also as Poisson noise. Attention has to be paid to the use of appropriate denoising operators, preserving photometry. For example, classical and nonlinear median filtering does not obey this rule. If a denoising is required, it is then more relevant to perform a Gaussian-based filtering. This convolution operator preserves the local photometry and can be easily optimized due to its separability property and is perfectly adapted for graphics processing unit (GPU) optimization. Moreover, the result from such convolution can be used later for features detection based on the Laplacian of Gaussian operator, reducing the complexity of the process. Finally, in the denoising step, the resolution anisotropy of the 3D acquisition has to be taken into account. In confocal microscopy, due to technical considerations mainly related to the laser scanning process, the XY resolution is higher than Z-axis resolution. Consequently, the Gaussian kernel parameters have to be tuned to embed the anisotropy.
In high-content screening (HCS), another major issue is known as the position-dependent response effects artifact, 4 known also as background or shadowing effect. 5 Basically, the voxels display an intrinsic heterogeneity in their intensity responses depending on their spatial positions. Many methods to correct these artifacts have been proposed in the literature. 6,7 Moreover, in 3D confocal microscopy, the light attenuation in-depth phenomenon 8,9 also increases the spatial heterogeneity of the signal and corrupts further analysis. The intensity bias correction methods can be classified in 2 main categories: local and global.
In the local approach, one estimates locally the background considered as composed of the lowest frequencies of the signal. Gaussian and median local filtering are well suited for such kinds of estimation. These methods are fast and efficient and can be applied systematically to each acquired image. The drawback comes from the main assumption on which these methods are based: locally, the image should display the same average intensity. The correction adjusts all the object intensities to the same average value and thus corrupts also any further absolute intensity computation. Nevertheless, these methods increase the efficiency of any global thresholding-based segmentation.
The global approach is more realistic: the intensity bias presents a smooth spatial variation over the image. The estimation of this background consists then of fitting it with a smooth function, usually a low polynomial order. 10 The drawback of this approach is related to the poor background statistical information provided by a single image. Fortunately, HCS offers a huge amount of data generated during a short period of time. Thus, under the weak assumption that the bias is a recurrent artifact over each image, it is possible to average the signal over a high number of images. The averaging of independent and identically distributed (i.i.d.) noisy signals tends to its low frequencies while preserving the trend. It thus provides, usually after a last step of regularization, a map used for correcting each image. This method takes advantage of the high-content imaging properties and is perfectly well suited for 3D acquisitions but requires a prescan of the image database subset to generate this correction image.
Finally, another way to globally correct the background effect is to autocalibrate the images using controlled objects such as focal beads (
Randomly place beads in 1 specific well (assuming that the misalignment and the intensity heterogeneity are similar over a complete plate but vary from one plate to another). These beads should emit at the same wavelengths as the staining probes used in the biological assay.
Before analyzing 1 plate, run a simple global segmentation (the signal-to-noise ratio is considered important) on the beads. Compute the mean intensity of each bead, and estimate the bead center localization on each channel. Associate beads among the channels and compute the 3D positioning difference vectors.
Interpolate the intensities and the vector components over the complete 3D image. This operation generates scalar and vector fields that will be used later to compensate misalignment and intensity variation as a preprocess for each image (
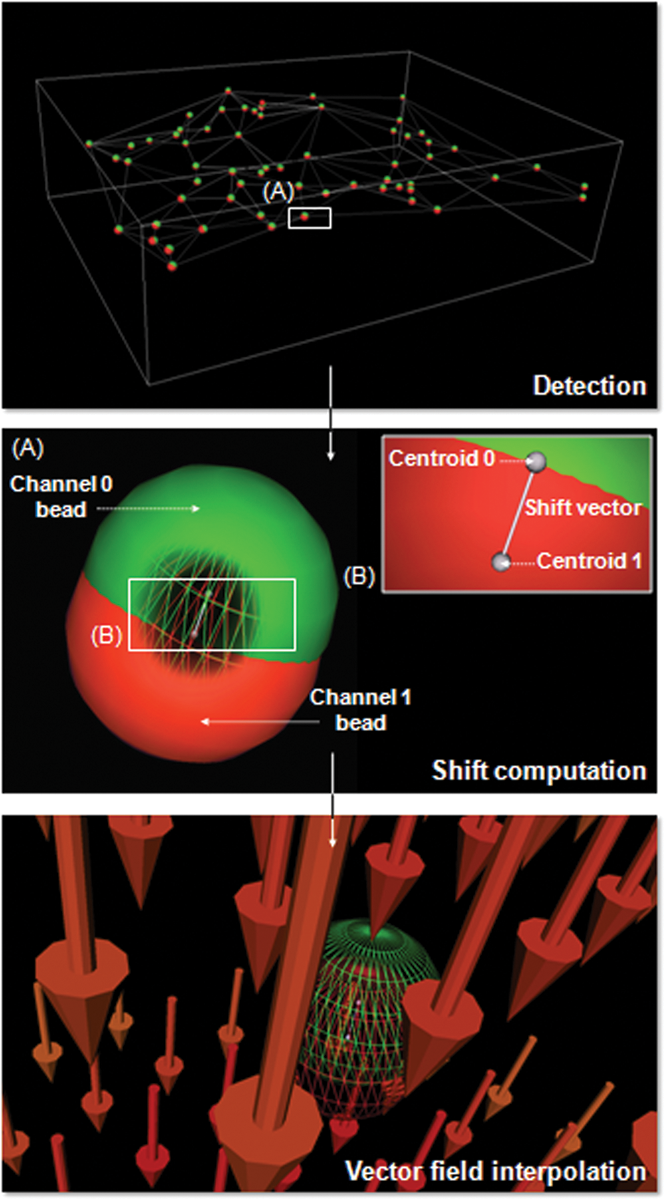
A typical example of an interchannel misalignment correction process using multispectral fluorescent beads. The spheres detection is operated on each channel separately. Vectors representing the interchannel difference of position between the associated centroids are then computed. Finally, these vectors are interpolated, generating a 3D vector field. The same procedure can be applied to compensate spatial intensity variation.
It is important to notice that no strong assumptions concerning the shift nature between the channels have been done so far. Thus, we do not constrain ourselves to affine registrations, and we also can take into account elastic ones. The smoothness of the biases is defined only by the interpolation function. Moreover, if it is demonstrated that the 3D images are also corrupted by an interslides motion (i.e., a motion in depth), one can apply a bead-to-bead Kalman filtering and interpolate the resulting vector field over the complete image. 12
Finally, the user has to pay attention to the strong effect of the correction process on the signal-to-noise ratio. This ratio can be strongly decreased in the low-intensity areas considering the Poisson noise properties. To prevent this, one should perform a denoising of the image as described before.
Stage 2: object detection
Once the preprocesses are performed, each channel is treated separately for the detection step. In our framework, we decided to compose with 2 kinds of 3D objects: spots and volumes, depending on the cellular organelles studied. Consequently, 2 specifically distinct classes of algorithm should be therefore applied.
Spots detection is essential when considering biological objects. 13 In a screening context, the priority should be given to calculation efficiency. We applied a method based on the local maximum of Gaussian curvature, 14 and to avoid time-consuming operation, we avoided the 3D local maxima detection, and instead the maxima was detected on a 2D maximum projection along the Z-axis. Upon 2D spot localization, the Z position was estimated by fitting Gaussian curves around the maxima of intensity, providing a subpixel estimation of the spot position.
In many situations, the biological objects cannot be accurately represented by dots. For these cases, a volume segmentation is then performed. This operation tends to gather pixels or voxels sharing the same characteristics (intensity, texture, entropy, etc.) usually under a constraint of connectivity. In 3D fluorescence microscopy images, operating intensity-based segmentation is usually relevant enough. The segmentation is probably the most studied field in image processing, but once again, in a screening context, memory management and algorithm complexity are crucial issues. A regular approach to operate a regularized segmentation is to use the level sets method. 15 In a screening context, this method does not fit the requirements because it is not appropriate for a large number of objects with a simple topology. Considering that the intensity variation was corrected during the stage 1 preprocess, a simple automatic Otsu’s global thresholding was performed. 16 This coarse binary segmentation has to be regularized regarding biological priors. As an example, the nucleus segmentation is described as follows. To regularize the previous segmentation, we operated a connected components-based labeling of the binary images. During this process, we rejected aberrant objects (too large or too small) and objects overlapping the image borders. The nuclei were then individually and locally resegmented using the histogram-based Otsu’s algorithm. The purpose of this secondary segmentation was to adapt the threshold value to the biological context such as the cell cycle stage. Attention was paid to the staining relevance regarding the desired organelle delineation and the regularization strength. For the nucleus, the object requires a strong regularization. Here we propose to extract meshes from the isovolumes generated by the second segmentation using the fast and efficient Marching cubes method. 17 The regularization was done by smoothing the mesh via a Laplacian filtering, which is a good trade-off between speed and accuracy, especially with biological objects where the edges are not sharp. 18 The complete process yields an accurate, fast, adaptive, and automated extraction of the stained organelles.
Stage 3: objects association and descriptors computation
The spatial information extracted from subcellular organelle location can provide important information about the cellular state or the cytoskeleton reorganization occurring upon genetic mutation or drug or pathogen stimulation. Indeed, 3D image analysis provides a unique opportunity for phenotypic quantification, allowing the measurement of the spatial relationship between objects. We therefore developed descriptors related to organelle shape and to their relative localizations. Two levels of information were therefore extracted from the previous detection: the intercell organization and the interorganelle distribution within each cell.
The first information is straightforward under the assumption that in most of the situations, a cell contains a single nucleus. The nuclei are located by their centroids, generating a set of points. The vicinity is computed using a Delaunay triangulation constructed relative to this points cloud. At the single cell level, the description of the relative positioning requires another process. Indeed, each organelle is detected within the complete 3D image and should be associated with the basic object (i.e., a nucleus). In our application, we propose associating each organelle with the closest nucleus within the Euclidian metric, but depending of the application, this can be adapted to other staining organelles (e.g., cell membrane) with a more appropriated metric (e.g., Malahanobis or Danielsson distance). Errors can arise, especially when nuclei have been removed from the 3D space because of their image border overlapping. To overcome this drawback, we include a threshold filter that will reject the isolated organelles based on a minimum distance. The choice of this minimum distance should be adapted to each organelle specificity and imaging conditions. Once the association has been performed, several cellular descriptors can be extracted without increasing drastically the computation time (
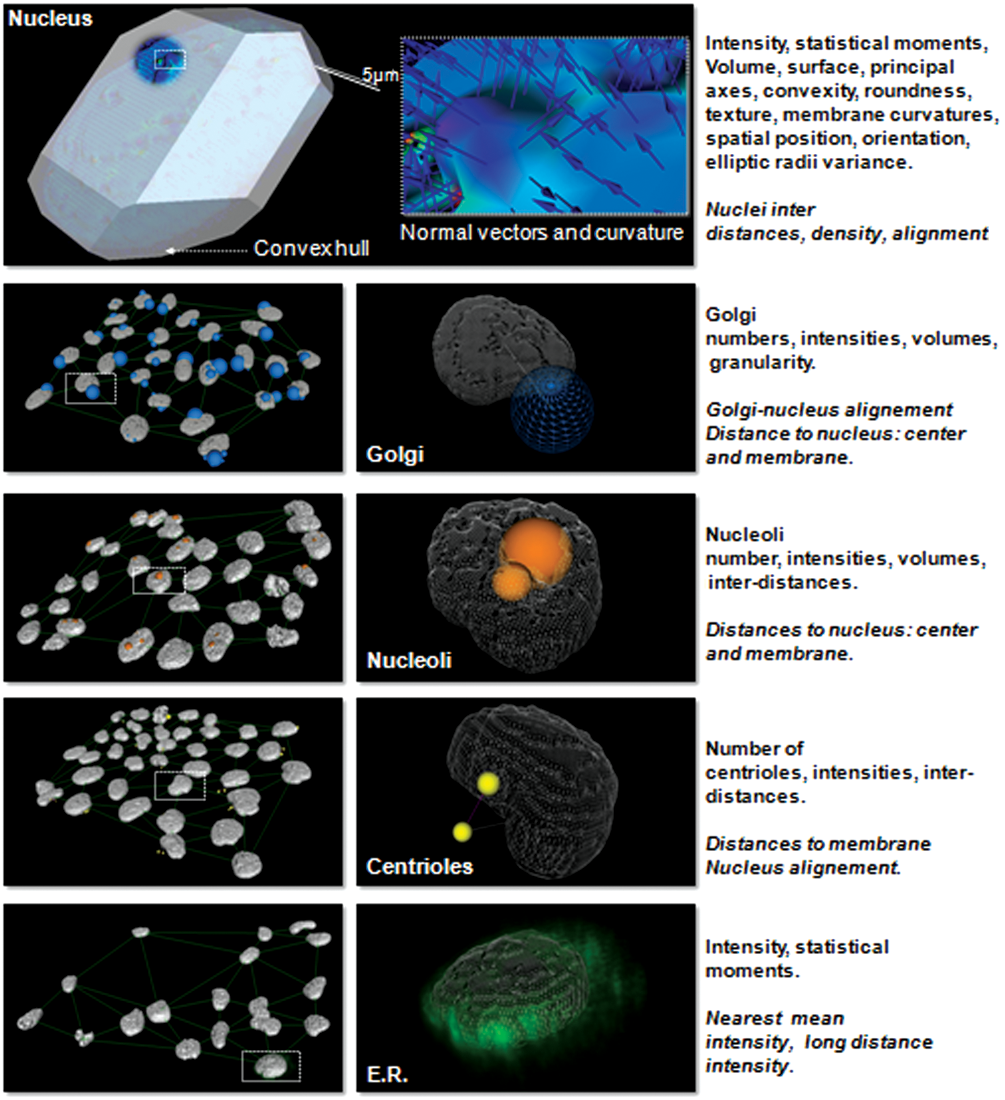
Example of 4 organelles detection combined with nuclei detection. From the top to the bottom: nucleus, Golgi apparatus, nucleoli, centrioles, and endoplasmic reticulum. The nucleus is represented with its convex hull, and the color is related to the Gaussian curvature local intensity. Next, the 3 rows represent organelles displayed using schematic spheres where the radius is proportional to the volume (Golgi apparatus and nucleoli) or intensity (centriole). For the endoplasmic reticulum, as we are focusing on the intensity distribution around the nucleus, we choose a ray-tracing-based volume rendering, which is more adapted. As described on the right side, we have labeled all computed descriptors (italic font specifies the contextual descriptors).
To illustrate potential application, we first review a list of possible 3D descriptors adapted to cellular biological approaches. Then we describe concrete cases specific to 4 organelles. Upon 3D analysis of those organelles, we will study the possibility of analyzing the cell cycle as well as characterizing torsinA mislocation occurring upon genetic defect.
Results
List of descriptors
As described previously, each single object embedded basic information such as Z position and fluorescence intensity. Nonpunctual objects are described by their volume, surface, compactness, and intensity-based statistical moment first orders known as expectation, standard deviation, skewness, and kurtosis. Every volume shape is characterized by the radii variance, the compactness, the convex hull, the average value of the Gaussian, and mean curvatures associated with the vertices of the mesh. As many biological volumes can be assimilated to ellipsoid, we also implemented ellipsoid radii variance, which basically uses the covariance matrix of the mesh vertices position to renormalize the global shape based on its eigenvalues and eigenvectors. Thus, it provides a radii variance not corrupted by the ellipsoid shape. The principal axes ratios are also computed, giving information about the object orientation.
Nuclear contextual localization of organelles
We took advantage of the nucleus as a central structure to coordinate several studied organelles within the cell. The accurate calculation of the exact 3D positioning of any marker of the cell was performed in reference to the centroid of the nucleus or to the proximal nuclear membrane. We present a detailed analysis of the subcellular location of organelles that fall into 3 different categories of subcellular structures: (1) compact structures such as the Golgi apparatus and nucleoli (2), discrete structures such as the centrioles, and (3) diffuse structures such as the endoplasmic reticulum.
Cell cycle
The cell cycle is a ubiquitous, complex process that underlines morphological changes allowing a classification. Qualitative morphological analysis coupled with the quantitative DNA fluorescent staining was used to determine the cycle stage of cellular populations. To illustrate the possibilities provided by a contextual 3D description of the organelles, we propose studying the cellular cycle using 3 organelles: the nucleus, the Golgi apparatus, and the centrioles.
The first application concerns the analysis of the cell cycle on a cell population based on 2 relevant descriptors: the nucleus stained with DNA markers, providing a relative quantification of cellular DNA amount, and the Golgi apparatus granularity. To characterize the cell cycle, we induced a cycle arrest with a compound that exerts its effect by interfering with the polymerization of microtubules. As nocodazole affects the cytoskeleton, cells arrest with a G2- or M-phase. Interestingly, it is known that nocodazole induces the Golgi apparatus ministacks formation and thus creates a specific spatial repartition of the fluorescence signal. Quantitative analysis of nocodazole’s effect on the nucleus and Golgi apparatus is displayed in
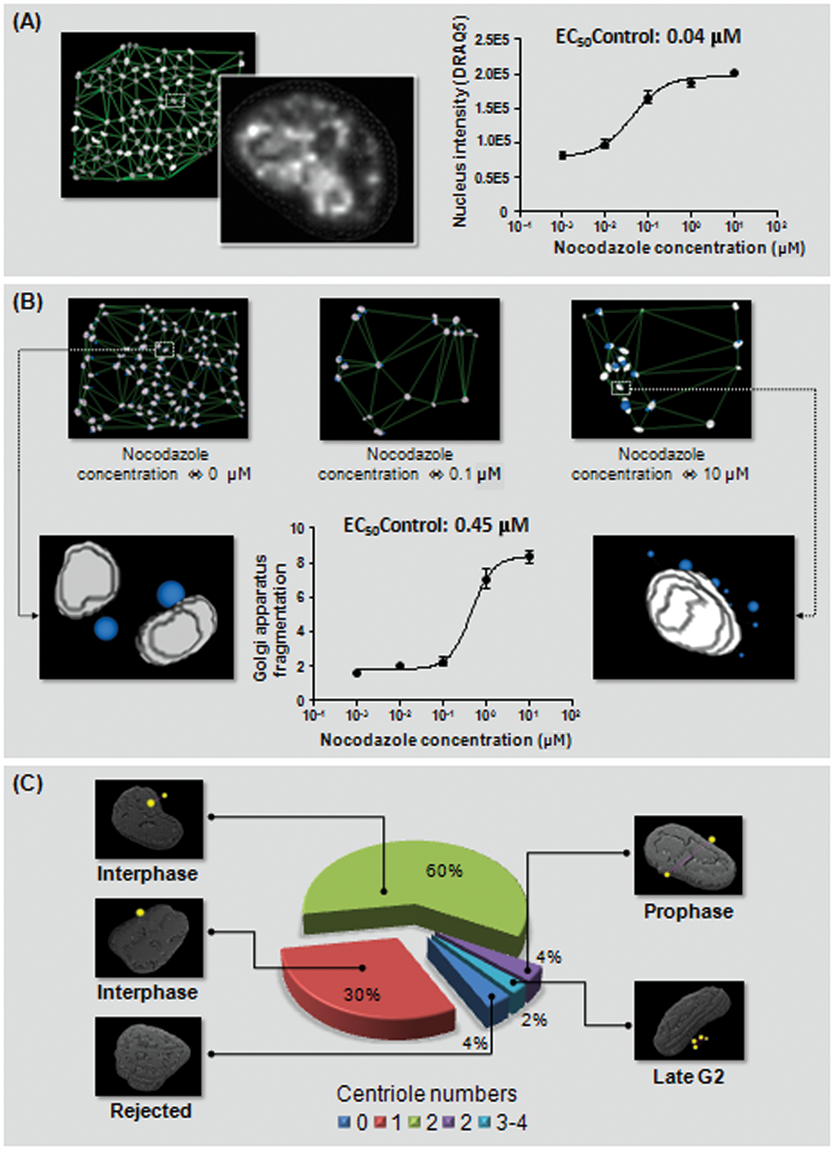
Cell cycle morphometric analysis upon increasing nocodazole concentration: quantitative analysis of (
In the second experiment, we studied the cellular organization of the centrioles, known to be an essential factor to the cellular cycle. The centrioles can be described as punctual objects; on the other hand, their relative intensity does not provide any accurate information. The real source of information is provided by the relative spatial position of these spots to each other or to the nucleus membrane. The 2D approach for such detection is obviously ill posed for 2 main reasons: (1) the confocal imaging focus plan can miss spots located at slightly different Z positions, and (2) the distance to the membrane (or to the closest centrioles) cannot be accurately evaluated in 2D because the centrioles can be located over the top or below the bottom of the nucleus. We performed an analysis of a nonconfluent population of 650 HeLa cells to estimate the cellular cycle position of each based on the centrioles. The detection and association steps were performed as described in the previous sections (stage 2 and stage 3). The number of centrioles associated with each nucleus was used as a first classification step. If no spots were associated, the cell was rejected (4% of the cells). If only 1 spot was associated, we considered that the distance between the centrioles was below the optical resolution (30%). If 2 centrioles were associated with the nucleus, we then computed the interdistance, normalized by the nucleus volume. This provides an accurate descriptor to discriminate the interphase from the prophase. It is interesting hat no nucleus-based descriptors allow such precise classification, as the DNA arrangement looks similar in our experiment. Interestingly, with our approach, it is also possible to detect late G2-phase characterized by the presence of 3 or 4 centrioles per cell. A visual description of the results is displayed in
Dystonia screening model
Several observations support the hypothesis that torsinA loss of function is involved in the pathogenesis of DYT1 dystonia. Mouse genetic studies are consistent with this notion because neurodegenerative alteration found in Tor1A null mice is well described in knock-in mice expressing ΔE-TorA mouse and in ΔE-TorA Dystonia patients. 19 Interestingly, whereas WT torsinA is predominantly localized to the bulk ER, inhibiting the ATPase of torsinA with the E/Q mutation causes it to mislocalize to the perinuclear space of the nuclear envelope. 2 Similarly, ΔE-TorA mutated form found in DYT1 dystonia patients mislocalizes to the NE, 2 indicating that it too exhibits reduced ATPase function.
One approach to identify torsinA-activating molecules would be to directly access the ATPase activity of recombinant protein in an in vitro assay. However, because of the technological and biological limitation of this approach, we propose quantifying the predominant distribution of the TorA variant within NM or ER localization. The assay will exploit the link between subcellular localization of torsinA and loss of function of localized torsinA variants in the NE. To quantify the subcellular localization of torsinA wild-type and E/Q, we developed a method to quantify the contextual localization of GFP-torsinA fusion proteins. In our method, we use the nucleus membrane as a reference to measure the relative spatial position of the GFP-torsinA fusions. We found that the results could be corrupted by several factors. For example, nonexpressing cells and mitotic cells can lead to misclassification. The first step of the process then consists of evaluating the GFP intensity surrounding the nucleus. A 3D distance map
20
was computed, and the intensity was integrated if the distance to the nucleus membrane was found below a certain value d0, which is typically 4 µm. The integrated intensity I0 was then thresholded for the entire analysis, leading to the rejection of the nonexpressing cells. The nucleus shapes of the remaining cells were then classified based on the elliptic radii variance descriptor. Nuclei displaying highly irregular membranes were also rejected. At this point, it is interesting to notice that the number of rejected cells during the border-kill preprocess was extremely low due to the nuclei Z position shift. Finally, the previously computed distance map was used again to sum the intensities located between the isodistance surfaces defined by d0 and the furthest one defined by d1 (typically 10 µm in our application). This second integrated intensity is called I1. These 2 intensity values, I0 and I1, were normalized by the volume providing cell-by-cell comparable values Ī0 and Ī1. The ratio between those 2 values was used as a descriptor for classifying the torsinA E/Q and WT because it reveals the spatial variation between the GFP emitted close to the nucleus membrane and the GFP intensity emitted in a farther volume. The approach was tested over an initial cell population composed of approximately 20,000 cells expressing GFP-torsinA E/Q and WT. The methodology, as well as the results, is displayed in
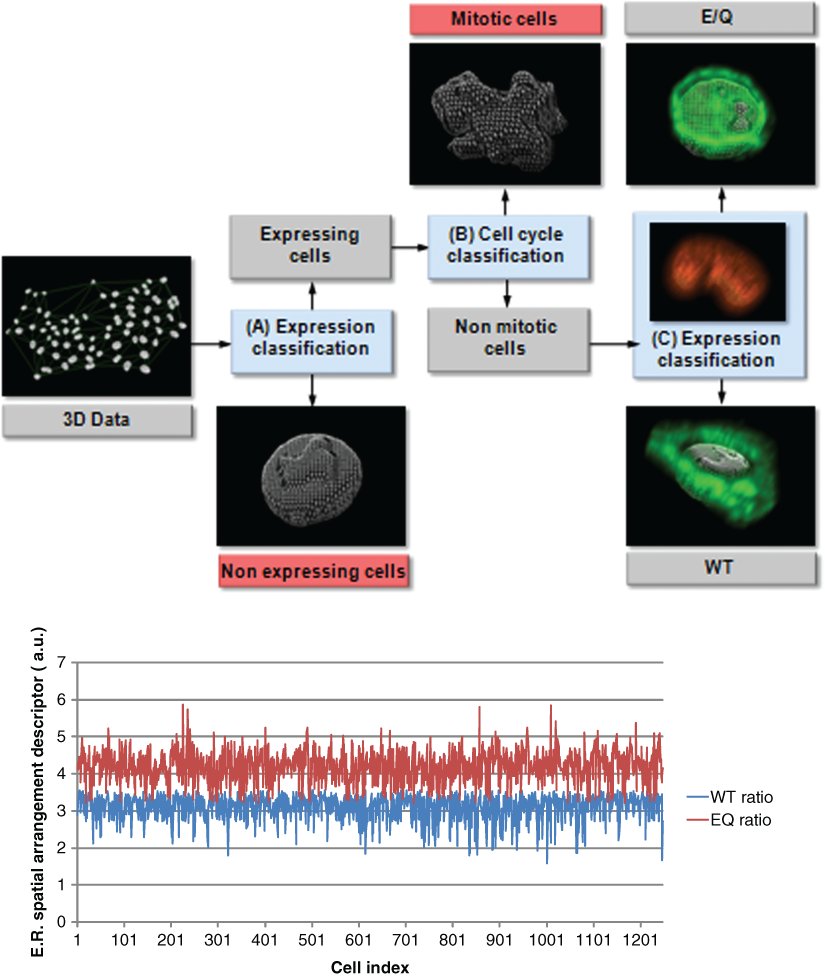
The top of the figure displays a schematic representation of the torsinA translocation model. The detected cells are successively classified based on spatial consideration. First, nonexpressing cells are rejected depending of the intensity values located around the nucleus. Then the nucleus morphology is analyzed using the elliptic radii variance shape descriptor. The irregular nuclei, which are considered to be under in mitosis, are rejected from the final classification. Finally, the cell population is divided into E/Q versus WT relative to the spatial arrangement of the intensity surrounding the nuclei. At the bottom, a graph displays the descriptor values over cell population.
Conclusion
Our aim was to develop an automatic 3D imaging approach capable of quantifying the subcellular spatial organization. Given the advantages of commercial inverted automated confocal microscopes, we developed an automatic framework for the detection and association for various types of organelles. In this context, we proposed a complete scheme of 3D image processing, including a preprocessing step to correct heterogeneity of intensity and multichannel shift. Our main goal was to maximize the speed and accuracy. As a result, we found that the time required for the analysis was within the acquisition time range.
To analyze the contextual location of given organelles, we have determined their 3D positions relative to the nuclear periphery and the nuclear center. Such spatial distribution analysis can be extended to the intercell positioning and thus can support quantification of the 3D cell particularly adapted to tissue cytoarchitecture. Importantly, our framework is generic enough to be applied to a large array of biological applications. It is worth noticing that quantitative phenotypic analysis of subcellular organization has to be classified upon the cell cycle stage. It is therefore recommended to include in the analysis organelles such as the nucleus, Golgi apparatus, or centrosomes, providing an accurate and precise measurement of the cell cycle.
Our applied approach to analyze the distinctive expression patterns of torsinA-related protein to the neurodegenerative disease dystonia DYT1 can be adapted for 2 different purposes. First, comparative analysis of healthy versus pathologic cells or tissues originating from patients can be used to track subcellular irregularities and support a diagnostic. Second, this approach can be the core of target-free drug discovery for compounds restoring the proper organelle distribution or shape, such as restoring the normal nuclear shape disrupted in laminopathies.
To conclude, we have shown that it is possible to integrate contextual 3D analysis with a high-content screening assay. Such an approach opens new opportunities for a therapeutic agent screening campaign.
Footnotes
Acknowledgements
We gratefully acknowledge MEST Korea, Gyonggido, KISTI, and the Bachmann-Strauss Dystonia & Parkinson Foundation for funding support. We acknowledge the excellent technical assistance of Honggun Lee.