
Abstract
With advances in molecular engineering and humanization, monoclonal antibodies are one of the fastest-growing classes of biopharmaceuticals. During antibody discovery, antibody from hybridoma or primary B-cell supernatants is screened for the desired binding characteristics, and secondary screens measure antibody function and concentration, identify immunoglobulin G (IgG) isotype, and assess cell health. In order to expedite the antibody discovery process, we developed a high-throughput, multiplexed cell and bead-based competition assay that identifies and quantitates mouse IgG isotypes and assesses cell health. No differences in assay performance were observed between single and multiplex formats. The linear range of the assay was from 0.5 to 50 µg/mL, and washing was not required, decreasing assay time and variability. Slight modifications to the protocol allowed quantification of dilute antibody supernatants (0.1–5 µg/mL). Using hybridoma cultures, we showed that cell viability measurements in the assay did not interfere with the bead-based IgG measurements. The assay described here is a simple mix-and-read, no-dilution screen that can reduce the time to antibody cloning and production. The high-content data can differentiate monoclonal and polyclonal wells, determine IgG quantity for downstream functional assays, provide isotype information, and monitor cell proliferation and viability.
Keywords
Introduction
With breakthroughs in molecular engineering and antibody humanization, monoclonal antibodies (Mabs) are one of the fastest-growing classes of biopharmaceuticals for multiple clinical indications. In 2017, 10 therapeutic Mabs were approved in the European Union or United States, with nine additional candidates under regulatory review. 1 The success of therapeutic Mabs is due to many outstanding characteristics, such as high specificity and affinity and exceptional pharmacokinetics. Mabs can be engineered to alter or enhance their mechanism of action, to increase bioavailability, and to boost production. Mabs are the backbone of many treatment modalities, including unconjugated therapeutic antibodies, antibody drug conjugates, bispecific antibodies, and CAR-T cell therapy. In the cancer field alone, the development of antibody-based immune modulators is a multi-billion-dollar industry. 2
There are two main procedures for the generation of Mabs: antibody display methods and animal immunization. Antibody discovery using phage, yeast, or mammalian display technology has some advantages over traditional immunization by overcoming in vivo immune tolerance and epitope dominance, especially in the generation of functional antibodies.3,4 Fully human antibody libraries can be constructed and used for affinity selection on display platforms. However, it is often difficult to directly identify high-affinity antibodies, and synthetic antibodies increase the risk of isolating self-reactive Mabs. 5 Due to some of the technical difficulties associated with display technology, the majority of antibody discovery is done using animal immunization.
Hybridoma technology, first developed by Kohler and Milstein in 1975, is the most prevalent method for antibody discovery. 6 Hybridoma production is an established platform that often produces high-affinity antibodies due to secondary immune reactions (i.e., affinity maturation in germinal centers). Recent advances in transgenic mouse technology have led to the creation of humanized mouse strains, which can directly produce fully human antibodies. 7
Hybridoma cells are produced from the fusion of a B cell from an immunized animal to a myeloma cell. This fusion necessitates large screening campaigns to identify antibodies with the desired characteristics because fusion can generate non-antibody-secreting cells or produce nonspecific as well as target-specific secreting cells. It is important to rapidly sequence and clone antibody fragments from hybridoma cultures in the discovery process. That is because hybridoma cultures produce low concentrations of antibodies and are prone to microbial contamination and genetic instability, and therefore cannot be used for large-scale antibody production. 8 In addition, the use of murine Mabs for human disease is limited due to the strong immune response elicited by mouse antibodies when administered to humans. In order to minimize the risk to humans while maintaining the antibody specificity and affinity, human/mouse chimeric antibodies (~65% human) and humanized Mabs (~95% human) are produced using recombinant cloning techniques. 9 Finally, the requirement for a specific Fc-mediated function for therapeutic antibodies requires the cloning of variable regions into specific immunoglobulin G (IgG) isotypes. 10
PCR-based strategies are the most widely used technique to identify the variable region sequences and to clone the fragments into the appropriate antibody expression vectors, although other techniques have been developed. 8 In the absence of IgG isotype information, degenerate PCR primers are used to amplify the variable regions for cloning or sequencing. However, this can often result in mismatches in the primer binding site, leading to degradation of PCR products by proofreading DNA polymerases. 11 Additional mutations due to degenerate primer use can negatively impact antibody binding or affinity. 12 The identification of the specific IgG isotype from hybridoma supernatants can negate many of the PCR artifacts by allowing the use of specific, rather than degenerate, primers to facilitate the cloning process.
Flow cytometry is a well-established technology designed for analyzing particles in liquid suspension. In a typical flow cytometry experiment, particles are drawn from a sample vesicle and introduced to sample stream one at a time. Each particle in the stream moves through a focused laser beam, and optical detectors measure particle characteristics. Depending on the laser configurations of the cytometer, 20 or more discrete optical parameters can be assessed from a single particle. Combined with the ability to investigate thousands of particles each second, flow cytometry is a powerful high-content analysis method for investigating cellular and population phenotypes.
The multiparametric data generated by flow cytometry make it an ideal tool for the drug discovery process, including for target identification and validation, hit identification, lead and candidate selection and safety studies. Traditional flow cytometers are designed to draw samples from individual tubes, which is not amenable to high-throughput analysis. The advent of high-throughput, multiwell plate sampling attachments developed for Becton Dickinson’s LSRII (San Jose, CA, USA) or Fortessa and for Miltenyi Biotech’s MACSQuant (Bergisch Gladbach, Germany) allowed drug and antibody screening laboratories to incorporate flow cytometry into their workflow. An additional advancement in the use of flow cytometry as a screening tool came with the invention of a novel sampling technology known as HyperCyt that allowed for the transfer of small amounts of samples from 96-well plates.13,14 This plate-centric technology delivers samples surrounded by air gaps to the flow cytometer in a single segmented stream, and the data from each plate are captured as a single file. Since each sample is measured in its entirety, minimal dead volume allows for assay miniaturization with aspirated sample volumes as little as 1 µL.15,16 Using 1536-well plates, total sample volumes as low as 6 µL are possible, and routine assays using 384-well plates vastly increase the utility of flow cytometry as a screening tool. The HyperCyt technology was commercialized by IntelliCyt Corporation (iQue Screener and iQue Screener PLUS; Albuquerque, NM) and has been used in many applications, including (reviewed in Edwards and Sklar 15 ) ligand binding screens, 17 toxicity and apoptosis screens,18–20 cell signaling screens, 21 phenotypic screens,18,22 functional antibody screens and antibody binding,23,24 and epitope mapping screens.25,26 In addition to cell-based screening, bead and multiplex cell and bead immunoassays have been done.18,27–29
In this report, we describe the development of a high-throughput flow cytometry (HTFC)-based, multiplex assay for mouse antibody discovery. This assay measures five separate parameters in a single well (IgG isotype, IgG isotype concentration, total IgG concentration, cell viability and cell count), in a no-wash, mix-and-read format. The assay can be performed in 96- or 384-well plate formats. The adoption of this mouse isotype and titer assay can simplify and expedite the antibody discovery workflow and facilitate downstream processes, such as cloning of antibody sequences into expression vectors for cell line generation.
Materials and Methods
Cell Lines and Reagents
Mouse hybridoma clone HFN36.3 (ATCC, cat. CRL-1605) secreting mouse IgG1 human anti-fibronectin Mab was cultured in Dulbecco’s modified Eagle’s medium (DMEM) with 10% fetal bovine serum. Purified mouse total IgG protein isolated from sera (Jackson ImmunoResearch, cat. 015-000-003) was used as a sample source for biological validation studies. IgG isotype capture beads, IgG fluorescein isothiocyanate (FITC) competition antibody, and FL4 cell viability dye were purchased from IntelliCyt (Mouse IgG Type and Titer kit cat. 91168). Ninety-six-well v-bottom polystyrene microtiter plates (IntelliCyt, cat. 90151) were used in assay development. All experiments were sampled using the iQue Screener PLUS, and data were analyzed using ForeCyt software (IntelliCyt).
Assay Development
The standard assay protocol followed the Mouse IgG Type and Titer kit manual with some modifications. Briefly, 5 µL per well of the premixed detection reagent, which includes the competing FITC-conjugated mouse IgG and FL4 membrane integrity dye, was added to each well of a 96-well microtiter plate. Twenty microliters of sample (protein standards, purified IgG, or hybridoma supernatant) was added into each well. Each sample was done in duplicate. All studies used a twofold IgG(x) dilution series with a zero control as a blank, and a top concentration of 50 µg/mL (unless indicated in the Results section). The microtiter plate was briefly centrifuged (500g, 5 s), and the samples were mixed on the shaker of iQue Screener PLUS (2000 rpm for 20 s). Then, 5 µL per well of prediluted capture bead mixture (containing mouse IgG1, IgG2a, IgG2b, and IgG3 capture beads) was added into the assay plate. The microtiter plate was briefly spun (500g, 5 s), and the samples were mixed on the shaker of iQue Screener PLUS (2000 rpm, 20 s). The assay plate was incubated at room temperature, in the dark for 60 min, prior to sample acquisition using iQue Screener PLUS with 2 s sip times per assay well. ForeCyt software was used to create graphs plotting median fluorescence intensity (MFI) against sample concentration.
In the singleplex versus multiplex comparison study, samples were either a single IgG isotype protein standard or a 1:1:1:1 molar mixture of the four mouse IgG isotypes. For the binding specificity study, a single IgG isotype protein was used as a sample.
For studies investigating the impact of sample washes, 100 µL per well of sample reaction buffer with bovine serum albumin was used to wash sample (after the 1 h incubation with detection reagents) and the plate was centrifuged for 5 min at 500g. The supernatant was aspirated with a Biotek microplate washer (model Elx405) following the manufacturer’s protocol. Resuspension of samples in the residue liquid (~5 µL) was performed on the shaker of iQue Screener PLUS (3000 rpm, 60 s). Thirty microliters per well of sample reaction buffer with bovine serum albumin was added into the assay plate. Samples were acquired and analyzed following the standard assay protocol.
The standard assay protocol was modified to increase the sensitivity of the competition assay by adding 5 µL of prediluted capture bead mixture (four beads) into each well, followed by the addition of 20 µL per well of the mouse IgG isotype mixture (1:1:1:1 molar ratio). After a quick spin (500g, 5 s) and brief mixing (2000 rpm, 20 s), the assay plate was incubated at room temperature for 120 min in the dark. Five microliters per well of the premixed detection reagents was added into the plate. After a quick spin and brief mixing, the assay plate was incubated at room temperature for an additional 60 min. Samples were acquired and analyzed using the standard protocol.
Biological Validation
These studies used the standard no-wash assay format; data acquisition and analysis was the same as the standard assay protocol. The initial study used mouse IgG purified from sera (Jackson ImmunoResearch) as the sample. An 11-point, twofold concentration series was generated with a top concentration of 50 µg/mL. Samples were diluted in DMEM media with 10% fetal bovine serum before being added into the assay plate. Samples were acquired and analyzed using the standard assay protocol.
In the mouse fibronectin hybridoma study, mouse hybridoma cells secreting mouse IgG1 Mab against human fibronectin (clone HFN36.3) were grown in a T75 flask for 7 days. After the growth period, the mixed cell–supernatant sample or the supernatant-only samples (after centrifugation) were used in the assay. The samples were serially diluted in DMEM media with 10% fetal bovine serum with 11-point 1:2 serial titration. The blank DMEM media with 10% fetal bovine serum was used as a negative control. Samples were acquired and analyzed using the standard assay protocol.
Data Acquisition and Statistics
The standard design, sampling protocol, and analyses, including gates, heat maps, and metrics, were generated using the USB assay template provided with the Mouse IgG Type and Titer kit (IntelliCyt). Briefly, 2 s sips (~3.5 µL) from a total volume of 30 µL were used for data acquisition. The events populated in the preset gates in dot plots and the beads and the cells were easily segregated/gated based on size differences. Singlet beads were gated on a two-dimensional (2D) plot of FSC-height versus FSC-area. Bead populations (IgG1, IgG2a, IgG2b, and IgG3) were gated in a 2D plot RL1 (excitation 640 nm, detection 675 nm) versus FSC-height based on the intrinsic red fluorescence difference in the dyed beads, as well as the bead size difference between IgG2b capture beads and the other three capture beads. ForeCyt software generated the standard curves (IgG1, IgG2a, IgG2b, and IgG3) using a four-parameter curve fit with a 1/Y2 weighting factor. The linear range for each standard curve was generated using ForeCyt software with the following equations: YBend Lower = (a – d)/(1 + 1/k) + d, YBend Higher = (a – d)/(1 + k) + d, and Xbend = c((a – Ybend)/(Ybend – d))1/b, where Y is the response, X is the concentration, a is the lower asymptote, b is a slope factor, c is EC50, d is the upper asymptote, and k is a constant equal to 4.6805. Hybridoma concentration was calculated by interpolation from the isotype-specific standard curve in ForeCyt software.
Results
The goal of this study was to develop a multiplex assay that would allow easy normalization of antibody concentrations from 90 hybridoma and B-cell cultures for downstream functional assays and to facilitate cloning of antibody variable regions into expression vectors. To generate an assay that would streamline the antibody discovery workflow, we reduced the required volumes to run in a 96- or 384-well plate format and analyzed them using HTFC. The biochemical methodology for the assay is shown in Figure 1 . A competition approach was used by combining cultures secreting IgG with an FITC competing mouse IgG. To identify and quantitate the IgG subclass, four isotype-specific IgG capture beads were added to each sample. Each capture bead has an intrinsic fluorescence to allow easy identification of specific IgG subtypes. Cell health was assessed using a red fluorescent cell impermeant dye to discriminate between live and dead cells.
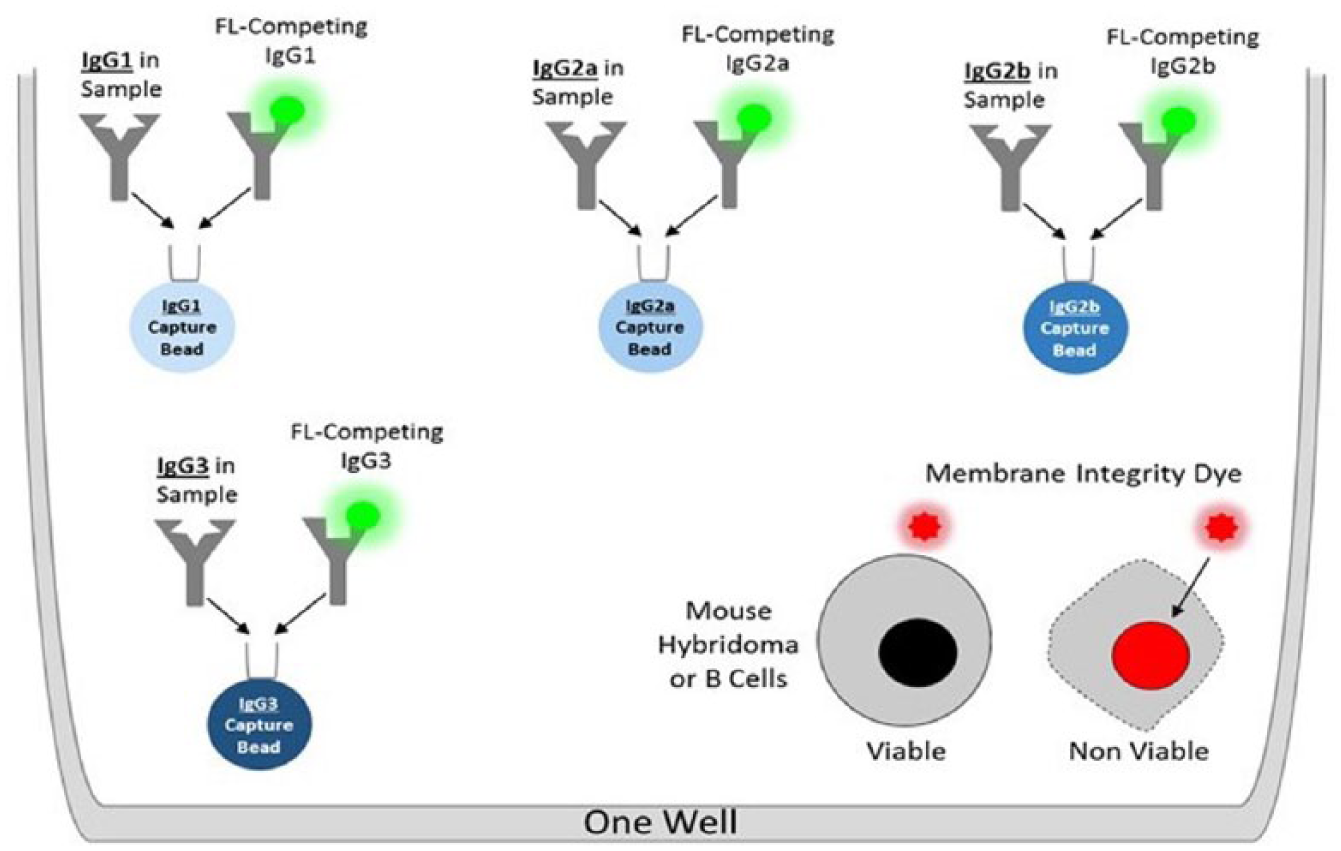
A novel design of multiplex competition assay biochemistry. Each assay well is seeded with four different types of capture beads, each with a specific affinity for a single IgG isotype. The IgG isotype in the sample will compete with the same FITC-labeled IgG isotype to bind to the capture bead. The IgG isotype quantity will be interpolated using one of four isotype-specific standard curves and is inversely proportional to the FITC fluorescence unit on the isotype-specific capture beads. If cells are included in the assay well, a membrane integrity dye added along with the detection reagent will stain the membrane-compromised dead cells by DNA intercalation.
The first step in assay development was to test the accuracy and specificity of IgG isotype detection in a multiplex format. We first measured the MFI of each IgG isotype alone or in a mixture. An 11-point, twofold dilution series was generated using a single purified IgG standard or a 1:1:1:1 mixture of all the IgG isotypes. Samples were plated in duplicate wells containing the competing FITC-labeled antibody and detection beads. As seen in Figure 2A , there was little difference in the binding curves for each IgG subtype in samples containing a single protein species or a mixture of the IgG isotypes.
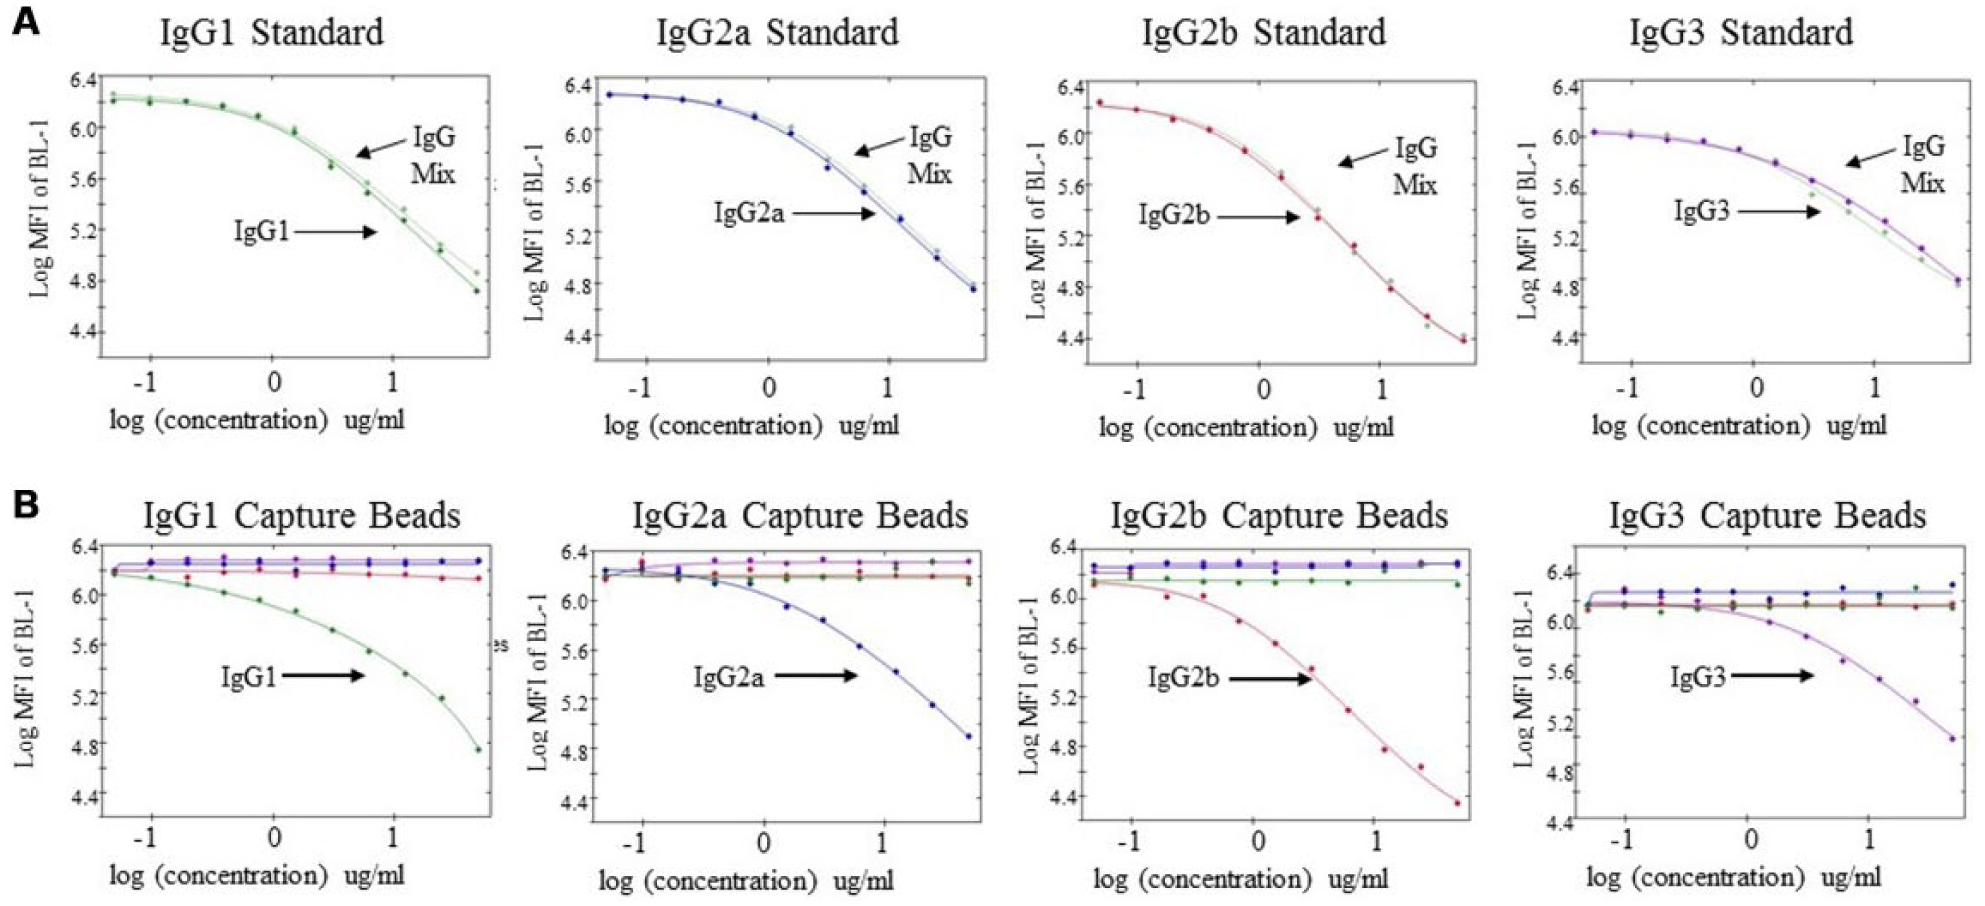
Multiplexing of different IgG isotypes does not impact assay specificity or concentration measurements. (
We next assessed the specificity of the assay by measuring the MFI of each individual isotype to the different detection beads. Curves were generated as described above with an individual IgG isotype. The decrease of MFI with increasing concentration of unlabeled IgG ( Fig. 2B ) shows that the various IgG isotypes compete with the detection antibody for binding on the isotype-specific bead (i.e., IgG1 sample competed for binding on IgG1 bead). However, no nonspecific competition was observed on the other beads in the sample. These data show with purified IgG isotype standards that the assay specifically identified the correct isotype and that the assay could be multiplexed without interference from other IgG species.
IgG concentrations are typically done with sandwich ELISA. However, the narrow dynamic range of ELISA often requires estimating a dilution factor and diluting hybridoma cultures prior to performing the experiment. We first determined the dynamic range of the assay using a mixture of IgG1, IgG2a, IgG2b, and IgG3 proteins and generated a dilution series as described above. Standards were sampled without washing using an iQue Screener PLUS, curves were generated, and the linear range was determined using ForeCyt software. The linear dynamic range of the assay was 0.6–50 µg/mL for IgG1, IgG2a, and IgG3 ( Fig. 3 ), which is within typical IgG concentrations for hybridoma cultures. IgG2b had a slightly narrower and lower dynamic range than the other isotypes.
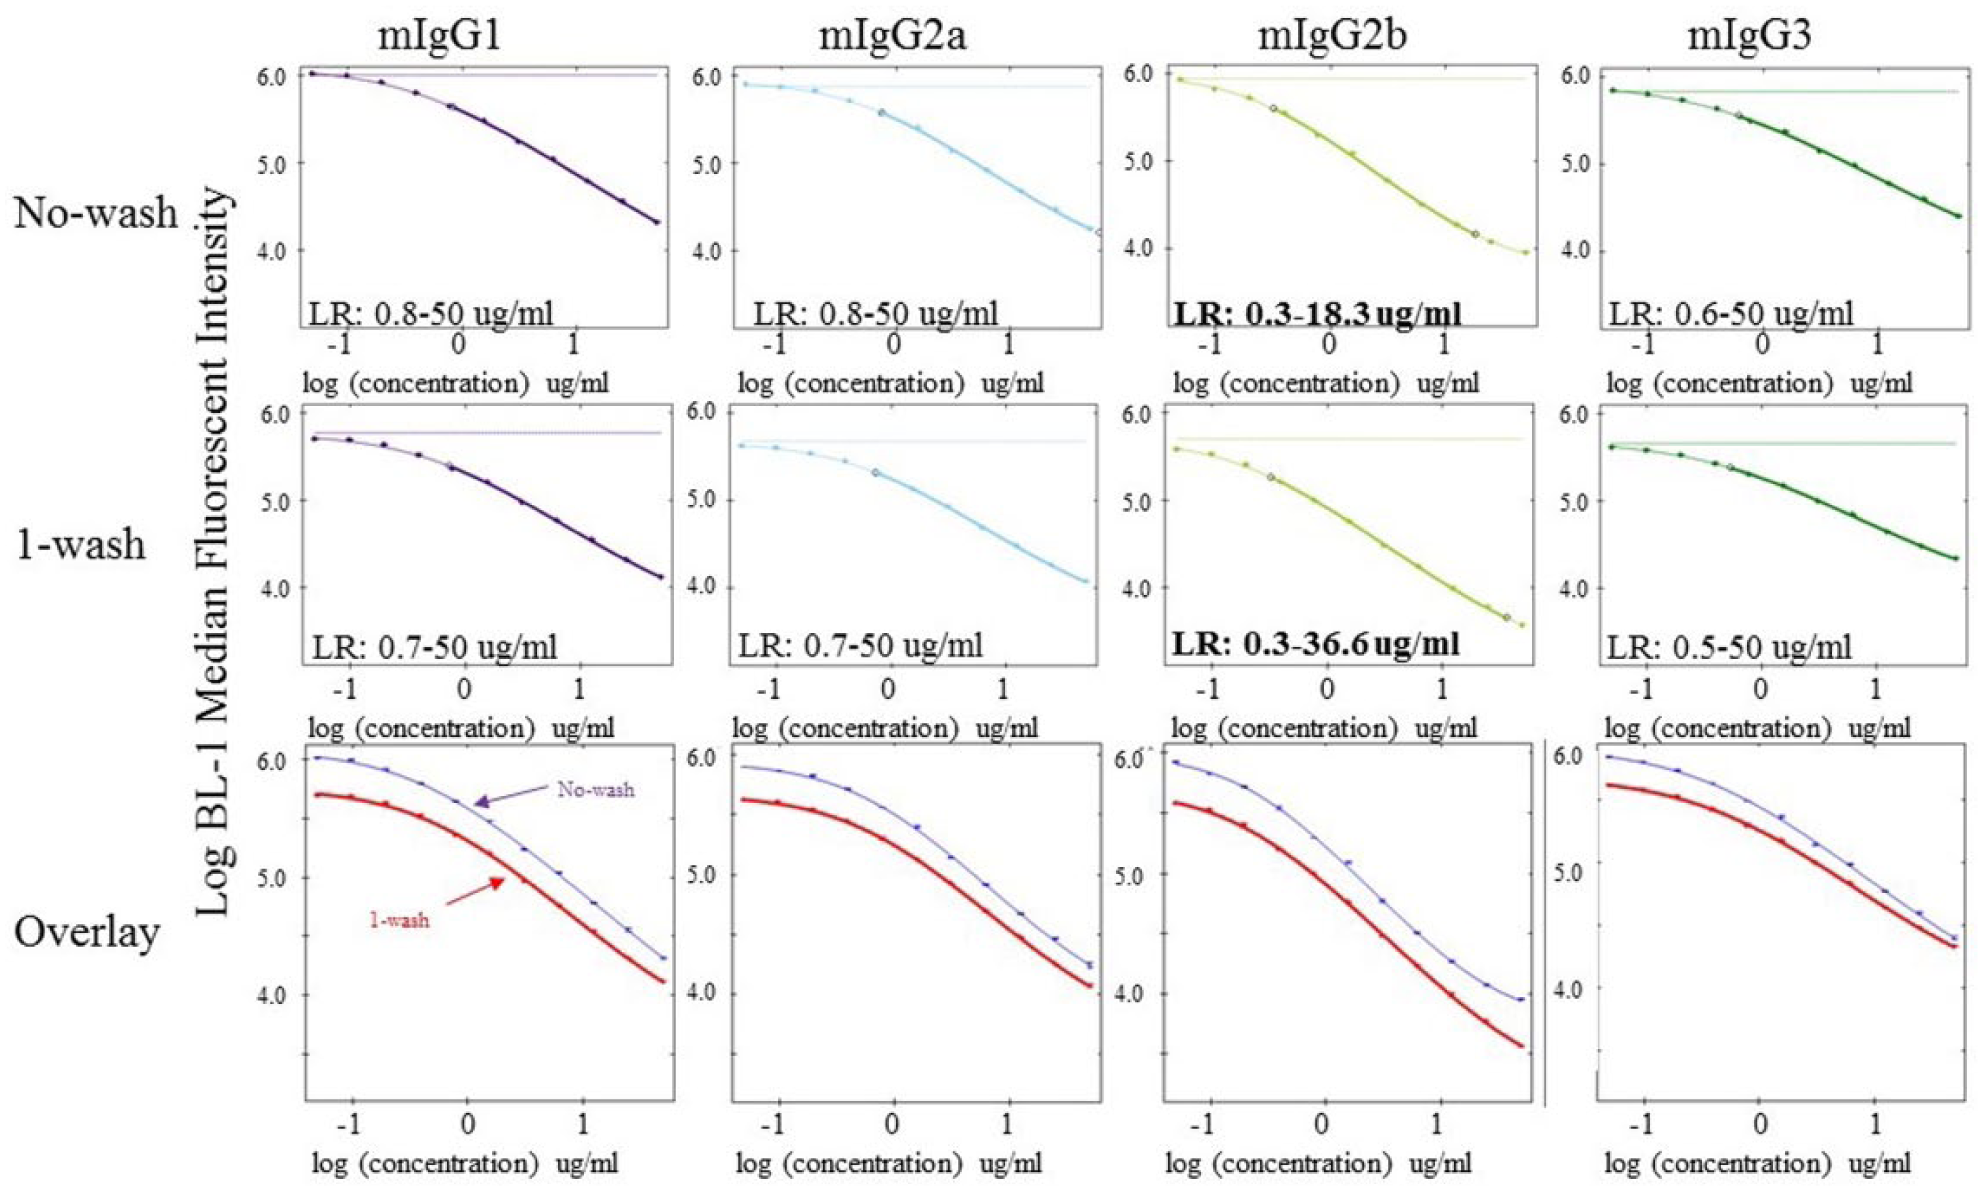
Isotype-specific IgG standard curves using wash and no-wash protocols. IgG protein standards containing all four mouse IgG isotypes were diluted (top concentration of 50 µg/mL for each isotype) using an 11-point, twofold dilution series (0 concentration was used as assay background control), and each curve was plated in duplicate. After mixing with detection FITC antibody, an equal mixture of all four capture beads was added to each sample well incubated for 1 h. For the wash assay, 100 µL of phosphate-buffered saline containing bovine serum albumin was added to each well and the plates were centrifuged and samples aspirated. Beads were resuspended in 30 µL of buffer, data were acquired on iQue Screener PLUS, and statistical analysis and curve fits were generated using ForeCyt software. The linear range for each curve is shown in the insert of each graph.
Most flow cytometers use hydrodynamic focusing to reduce the sample stream to the diameter approximating a single cell. This greatly reduces the background from unbound fluorophores and may eliminate the need for wash steps. To see the effect of washing on the dynamic range of the assay, sample dilution series were generated and analyzed as above. The inclusion of a washing step did not impact the linear range of the assay for IgG1, IgG2a, or IgG3 ( Fig. 3 ); however, the top end of the IgG2b isotype linear range increased about twofold (18.2–36.5 µg/mL). These data show that the assay can be performed as a mix-and-read format, reducing assay time and minimizing the variability associated with multiple washing steps.
The above data show that our assay is in the linear range of typical hybridoma cultures, but murine B-cell cultures typically generate lower antibody concentrations (0.1–2 µg/mL). To see if we could increase the sensitivity of our assay, we altered our competition protocol. A 22-point, twofold dilution series, with a top-end concentration of 100 µg/mL, was generated using a mixture of the various IgG isotype standards. Using the same volumes as above, IgG standards were first incubated with detection beads for 2 h at room temperature to equilibrate binding of sample antibodies onto capture beads. The FITC-labeled competing antibody was then added and incubated an additional hour prior to analysis. As seen in Figure 4 , the preincubation protocol dramatically lowered the limit of detection for the assay (~9-, 4-, and 6-fold for IgG1, IgG2a, and IgG2b, respectively). The detection limit for IgG3 was reduced less than that for the other IgG subtypes.
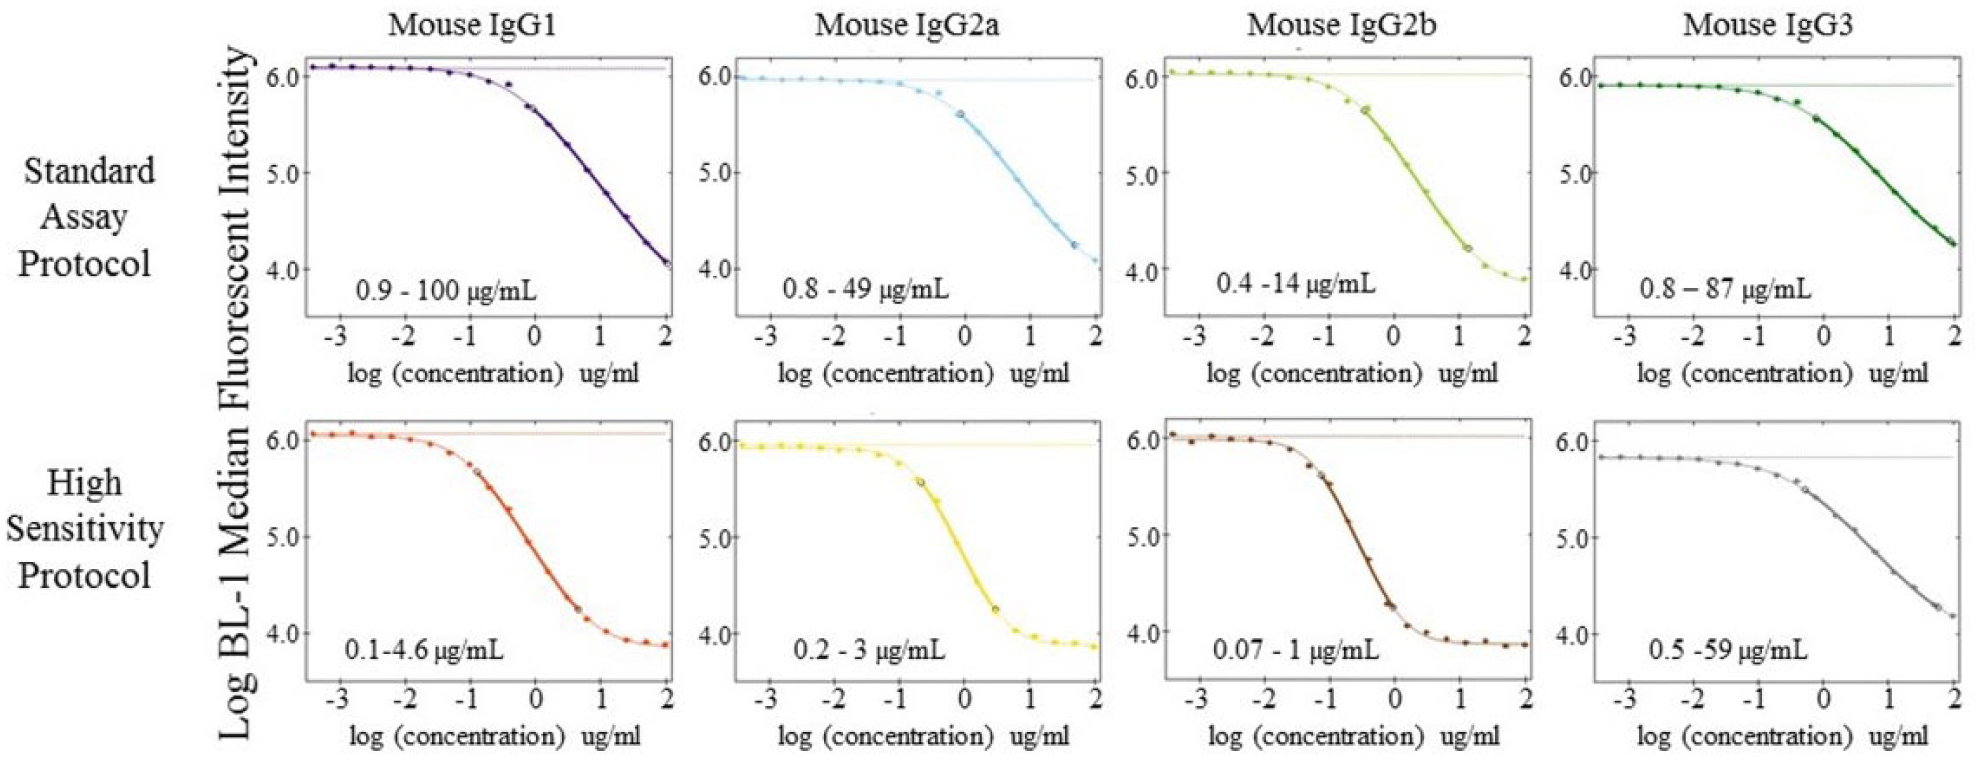
Increased detection limits using alternative competition protocol. IgG protein standards containing all four mouse IgG isotypes were diluted (top concentration of 100 µg/mL for each isotype) using an 11-point, twofold dilution series (0 concentration was used as assay background control), and each curve was plated in duplicate. The standard assay protocol was performed as described in Figure 2. For the preincubation protocol, samples were first incubated with detection beads for 2 h, followed by an additional hour with the competing detection antibody. Data were acquired on iQue Screener PLUS, and statistical analysis and curve fits were generated using ForeCyt software. The linear range for each curve is shown in the insert of each graph.
The next steps in development were to validate our assay using biological samples. To more closely simulate hybridoma cultures, we measured BL1-H MFI (excitation 488 nm, detection 530 nm) of the various isotypes from total IgG protein isolated from mouse sera. The protein was diluted in serum containing media, and an 11-point, twofold dilution series was generated. The assay was performed as described above. We measured relatively high levels of IgG1, IgG2a, and IgG2b and little IgG3 (loss of MFI correlates with increased antibody concentration), which mirrors the relative concentration levels of the various IgG isotype found in mouse sera (
We next tested our assay by using a known hybridoma cell line secreting mouse IgG1 antifibronectin. The cell culture was grown for 7 days and samples containing cells and supernatant or only supernatant were removed, and an 11-point, twofold dilution series (in hybridoma media) was prepared for each sample type. A standard curve with a mixture of purified IgG isotypes was generated as above. Figure 5A shows the gating strategy. Beads and cells are easily distinguished based on size and scatter characteristics, and individual gates were drawn around each population. Single beads were identified and RL1-H (red fluorescence channel) and forward scatter resolved the bead population into the individual isotype-specific beads. Individual gates were drawn around each IgG isotype-specific capture bead, and BL1-H MFI for the bead population in each sample was determined. The data from the wells containing the standard curve were transformed into isotype-specific concentration curves using ForeCyt software. A histogram on the RL-1 channel was created from the cell gate, and live cells were distinguished from apoptotic and necrotic cells.
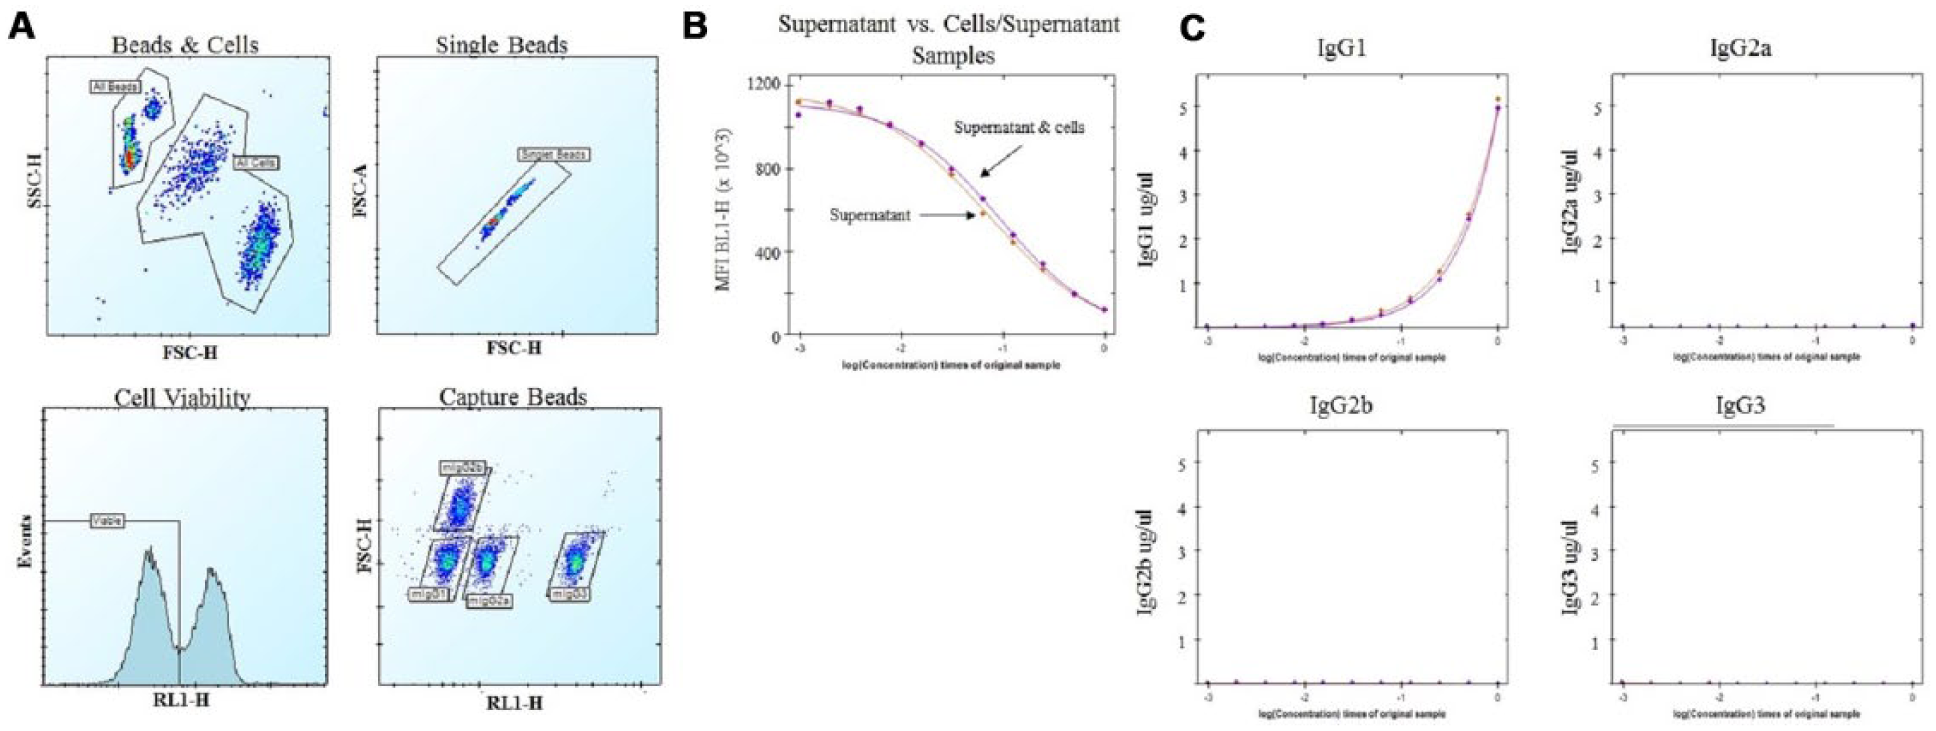
Multiplexing hybridoma cells does not impact assay antibody identification or concentration measurements. A hybridoma culture secreting IgG1 antifibronectin was grown for 7 days and an aliquot of supernatant (after centrifugation to remove cells) or a mixture of cells and beads was diluted using an 11-point, twofold dilution series (0 concentration was used as assay background control), and each curve was plated in duplicate. A standard no-wash assay protocol was performed. (
We analyzed the BL1-H MFI in the sample dilution series containing both cells and supernatant or supernatant alone. There was no difference in the MFI between the sample types. The reverse sigmoidal curve shape is representative of a competition assay ( Fig. 5B ). This shows that multiplexing with cells does not interfere with the IgG specificity or the concentration measurements of the assay. The concentration of each IgG isotype in the sample was determined by the isotype-specific standard curve and plotted in Figure 5C . Similar to the MFI parameter, there was no difference observed in the antibody concentration of the two sample types. Furthermore, there was no IgG2 or IgG3 detected in the sample (IgG1 hybridoma), confirming the specificity of the assay.
Discussion
In this article, we show the development of an HTFC, multiplex assay to streamline and improve the antibody discovery workflow by identifying critical antibody and cell characteristics needed for downstream processes. Using a simple mix-and-read format, the assay had a wide dynamic range and the protocol can be altered slightly to increase the sensitivity when assaying samples with low IgG concentrations. For an IgG concentration above 50 µg/mL, diluting the supernatant fourfold (5 µL plus 15 µL hybridoma culture media) increases the top-end IgG concentration linear range to 200 µg/mL (data not shown). While we did not perform a full hybridoma screen in-house, validation of this assay by collaborators in multiplate screening campaigns using both hybridoma and B-cell cultures has been performed (data not shown).
Figure 6 shows a typical antibody discovery workflow. Single-cell hybridoma or primary B-cell cultures are generated and a primary screen is performed for the desired antigen binding characteristics. Secondary screens measuring mouse antibody concentration from cell culture supernatant are traditionally assessed using ELISA and require normalizing antibody levels for functional assays. IgG isotype identification is performed to facilitate PCR-mediated gene cloning into expression vectors. Separate cell health and counting assays in the original cell cloning plates are important to facilitate RNA extraction for subsequent cloning steps. The assay described here can replace the three separate secondary screens into a single assay, dramatically reducing the time to antibody cloning and production. The high-content data from our mouse IgG assay enables quick differentiation between monoclonal and polyclonal wells, determines IgG quantity for qualifying stable clones and for downstream functional assays, provides isotype information, and monitors cell proliferation and health in the original cell cloning plate.
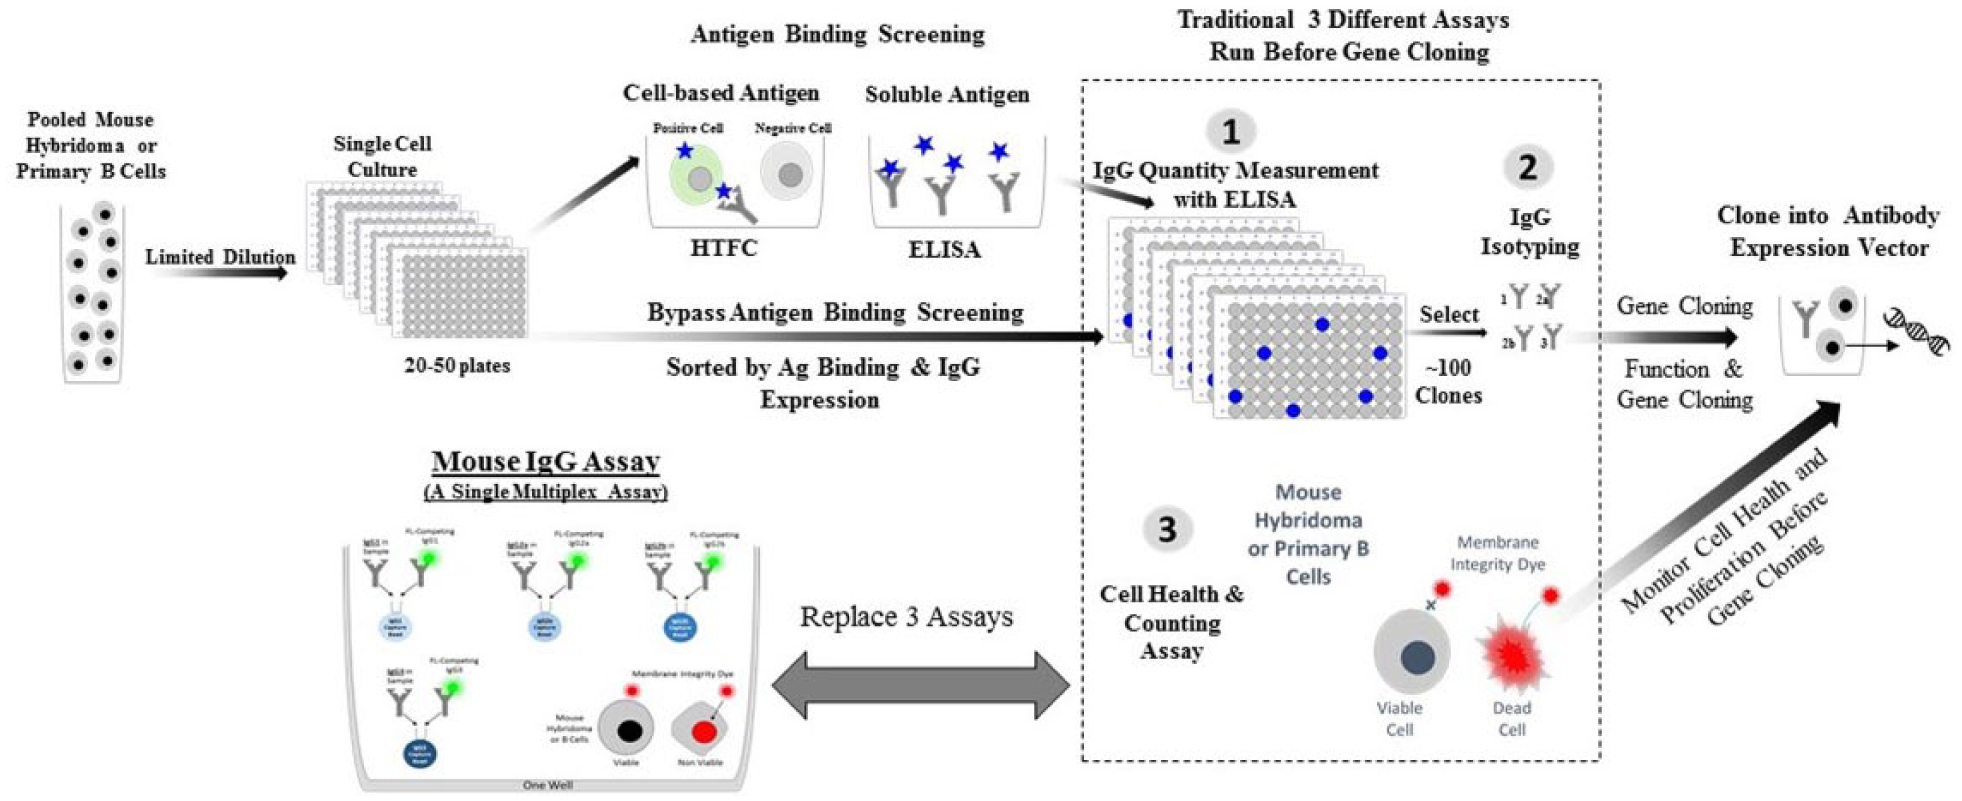
The position of mouse IgG quantitation and isotyping in a traditional lead candidate antibody discovery workflow. After antigen immunization, pooled mouse hybridoma cells (after fusion) or primary mouse B cells are cloned in microtiter plates using limited dilution or single-cell sorting. Primary screening of the cell clones is performed to identify clones with the desired antigen binding characteristics. Positive clones are verified for mouse IgG secretion. Using antigen binding cell-sorting methods, single-cell clones go directly to the IgG quantification step. Typically, the 100 top positive clones are characterized by IgG isotyping. These samples will be used directly for gene cloning or sequencing. Alternatively, the positive clones are tested in functional assays after normalization of IgG content. After downselection by functionality, the selected cell clones will be used to construct antibody expression vectors.
Other techniques are amenable to assay miniaturization and have high-throughput capacity to precisely quantitate IgG from various sample types. For example, ELISAs are used for IgG quantification, but this singleplex assay requires many labor-intensive steps. Newer technologies, such as biolayer interferometry (BLI) used by the Octet BLI (Pall), is a label-free system that detects changes in biomolecular interactions in 384-well plates with volumes as low as 40 µL. Since this technology uses biosensors, little sample is used for analysis. However, in order to multiplex the assay, each parameter measured from a sample well needs to be analyzed with a different biosensor set. Bead technology based on energy transfer such as AlphaLISA (PerkinElmer) and TR-FRET (CISBIO) is used in high-throughput, no-wash, low-sample-volume IgG quantitation (~40 µL). Similar to the Octet BLI, these bead technologies are generally performed as singleplex assays and require multiple kits or runs to analyze the full spectrum of IgG isotypes. In contrast to the above platforms, the mouse antibody screening assay described in this article accurately identifies and quantitates mouse IgG subtype, total IgG, and cell health in a single sample well containing 5 µL of hybridoma supernatant (30 µL total volume). Furthermore, all pertinent parameters are measured in a single plate run in as little as 20 min for a 384-well plate.
This assay contains beads and cells in the same sample and only uses a single fluorescent channel for both bead and cell analysis, providing the flexibility to multiplex with antigen binding or functional studies. For example, antigens of different species or off-target controls can be conjugated to beads that have different fluorescent fingerprints than the detection beads. Antigen-expressing cells that are barcoded with different encoding dyes may yield information on target binding along with the mouse IgG subtype data. Other functional screening assays may be multiplexed, including antibody-dependent cell-killing mechanisms or antibody internalization. Assay development and optimization will be a critical factor in any additional multiplexed analysis.
In conclusion, we developed a novel assay platform for mouse antibody discovery that significantly reduces the traditional time-consuming workflow by combining three separate assays into a single multiplex assay. The competition format enables a wide dynamic range for IgG detection, which means no sample dilution and no wash in the assay workflow. The multiplex assay biochemistry provides data-rich information to fully analyze the antibody cell clones from different angles. Taken together, this assay quickly identifies critical mouse antibody clone attributes, expediting the antibody discovery workflow and shortening the time to antibody production.
Supplemental Material
Supplemental_Figure_for_Expediting_Antibody_Discovery_with_a_Cell_and_Bead_Multiplexed_Competition_Assay_Liu_et_al – Supplemental material for Expediting Antibody Discovery with a Cell and Bead Multiplexed Competition Assay
Supplemental material, Supplemental_Figure_for_Expediting_Antibody_Discovery_with_a_Cell_and_Bead_Multiplexed_Competition_Assay_Liu_et_al for Expediting Antibody Discovery with a Cell and Bead Multiplexed Competition Assay by Zhaoping Liu and John O’Rourke in SLAS Discovery
Footnotes
Acknowledgements
We thank the other members of IntelliCyt’s biology team, Mark Carter, Lisa Keenan, and Caroline Weldon, for their work and contributions. We would also like to thank Susan Blumenthal for her help in reviewing and editing the manuscript.
Supplemental material is available online with this article.
Declaration of Conflicting Interests
The authors declared no potential conflicts of interest with respect to the research, authorship, and/or publication of this article.
Funding
The authors received no financial support for the research, authorship, and/or publication of this article.
References
Supplementary Material
Please find the following supplemental material available below.
For Open Access articles published under a Creative Commons License, all supplemental material carries the same license as the article it is associated with.
For non-Open Access articles published, all supplemental material carries a non-exclusive license, and permission requests for re-use of supplemental material or any part of supplemental material shall be sent directly to the copyright owner as specified in the copyright notice associated with the article.