
Abstract
Cell migration is a key phenotype for a number of therapeutically important biological responses, including angiogenesis. A commonly used method to assess cell migration is the scratch assay, which measures the movement of cells into a wound made by physically scoring a confluent cell monolayer to create an area devoid of cells. Although this method has been adequate for qualitative characterization of migration inhibitors, it does not provide the highly reproducible results required for quantitative compound structure-activity relationship evaluation because of the inconsistent size and placement of the wound area within the microplate well. The Oris™ Cell Migration Assay presents a superior alternative to the scratch assay, permitting formation of precisely placed and homogeneously sized cell-free areas into which migration can occur without releasing factors from wounded or dead cells or damaging the underlying extracellular matrix. Herein the authors compare results from the scratch and Oris™ cell migration assays using an endothelial progenitor cell line and the Src kinase inhibitor dasatinib. They find that using the Acumen™ Explorer laser microplate cytometer in combination with the Oris™ Cell Migration Assay plate provides a robust, efficient, and cost-effective cell migration assay exhibiting excellent signal to noise, plate uniformity, and statistical validation metrics.
Keywords
Introduction
C
We have been measuring cell migration as it relates to therapeutically important biological responses, including angiogenesis. We initially employed an image-based scratch migration assay read on the Acumen™ Explorer. In this method, a wound area that is devoid of cells is created within a confluent cell monolayer in 96-well plates. Cells are stained with a vital dye, imaged, treated with drug, and reimaged after 24 h to determine the extent of cellular migration and its inhibition by compounds. Although this method is useful for qualitative characterization of migration inhibitors, it does not provide the highly reproducible results required by the pharmaceutical industry for quantitative compound testing. The variability in this scratch assay format reflects the difficulty in creating a reproducible cell-free area with uniform dimensions and placement within a microplate well. 2 An additional caveat of the scratch assay is that the dead and dying cells resulting from the wounding process may release apoptotic factors and other cytokines that could potentially affect signal transduction pathways in the cells that close the wound. Finally, the process of creating a cellular scratch area could also physically damage the underlying extracellular matrix and/or plate surface, thereby causing an adverse effect on cell migration. 3
Recently, the Oris™ Cell Migration Assay was developed to overcome these shortcomings associated with the scratch assay. The Oris™ assays use silicone stoppers as barriers that contact the bottom of an optically clear 96-well black skirted fluorescence microplate to form precisely positioned 2-mm central cell-free zones. Cells are seeded and allowed to attach and spread in the presence of the stoppers. Subsequent removal of the stoppers reveals the central cell-free zones surrounded by a monolayer of cells into which migration can occur. This assay format allows an unobstructed view of cell motility throughout the duration of the experiment without physically damaging cells or underlying extracellular matrices. It also provides decreased variability and increased robustness over wound-healing/scratch assays and is compatible with high-content imaging (HCI) techniques. Unlike Boyden chamber-based assays that use membrane filters or motility assays that track cells via displacement of fluorescent beads, Oris™ Cell Migration Assays allow for direct visualization of the cells at any point during the assay with the ability to use multiplexed staining to discern phenotypic features of migrating cells.
HCI assays have recently begun to provide information-rich, multiparameter readouts with fixed or live-cell assays amendable for medium- to high-throughput compound testing. 4,5 In addition, HCI assays allow the investigator to define specific regions within the microplate well for analysis with minimal additional cost per assay data point. The Acumen™ cytometer sequentially scans a microplate with up to 3 lasers and can thus provide basic cell migration information in addition to information on various cellular processes such as changes in signal transduction or cellular differentiation states. The application of laser scanning over the entire microplate surface means that analysis is not performed by a well basis, which allows for the Acumen™ instrument to perform and analyze single-color scans of 96-, 384-, or 1536-well plates in less than 10 min.
Herein we compare the scratch assay to the Oris™ Cell Migration Assay to measure migration of endothelial colony-forming cells (ECFCs) and its inhibition by dasatinib, a Src kinase inhibitor. 6 Our results using the Acumen™ Explorer demonstrate that the Oris™ Cell Migration Assay yields better plate uniformity, more reproducible concentration-response curves, and more robust Z′ factors than the scratch assay. In addition, the Oris™ Cell Migration Assay requires fewer handling steps and eliminates the need for collecting pre- and postmigration images from the test wells, making it a more cost-effective and superior alternative to the scratch assay. Enablement of a robust and statistically rigorous cell migration assay allows quantitative evaluation of complex cell biological processes to support target-directed lead optimization 7 and phenotypic drug discovery. 8
Materials and Methods
Materials
Chemicals and materials were purchased from the following vendors and used without modification: dasatinib (US Biological, Swampscott, MA), ECFC (human endothelial colony-forming cells; EndGenitor Technologies, Inc., Indianapolis, IN), EGM®-2MV Microvascular Endothelial Cell Growth Medium-2 (Lonza, Walkersville, MD), Angiokit Optimised Growth Medium Pack (TCS CellWorks, Buckingham, UK), CellTracker Green CMFDA and fetal bovine serum (Invitrogen, Carlsbad, CA), 96-well poly-D-lysine-coated cell culture plates (BD, Franklin Lakes, NJ), Prefer (Anatech Limited, Battle Creek, MI), propidium iodide (Molecular Probes, Eugene, OR), and Oris™ Cell Migration—Collagen I Coated plates (Platypus Technologies, LLC, Madison WI).
Scratch assay
ECFCs (40,000/well) were plated in EGM®-2MV media containing 10% fetal bovine serum (FBS) on poly-D-lysine-coated 96-well plates. Following an overnight incubation, the media were removed from the cells and replaced with serum-free media containing 3.6 µM CellTracker Green CMFDA. The CellTracker Green CMFDA solution was removed after a 30-min incubation at 37 °C and replaced with complete media containing FBS. The cells were allowed to recover for at least 30 min, and scratches were made in the monolayers using a pin tool attachment on a Beckman Coulter Multimek instrument (Beckman Coulter, Brea, CA). The cells were rinsed with 200 µL phosphate-buffered saline (PBS) and premigration images collected on the Acumen™ Explorer. PBS was then removed, and cells were treated with various concentrations of dasatinib in Angiokit Optimised Growth Medium containing 10% FBS, 0.4% DMSO. After a 24-h incubation with the compound, the media was removed and replaced with 200 µL PBS for postmigration image acquisition. The Acumen™ Explorer setup includes 488-nm laser excitation, a 500- to 530-nm emission filter, and a software-defined rectangle surrounding the cell-free scratch area (the migration area). Mean intensity measurements were used to gate out cells with dim signals from debris, and total fluorescent area (µm2) within the migration area was used for analysis.
Oris™ Cell Migration Assay
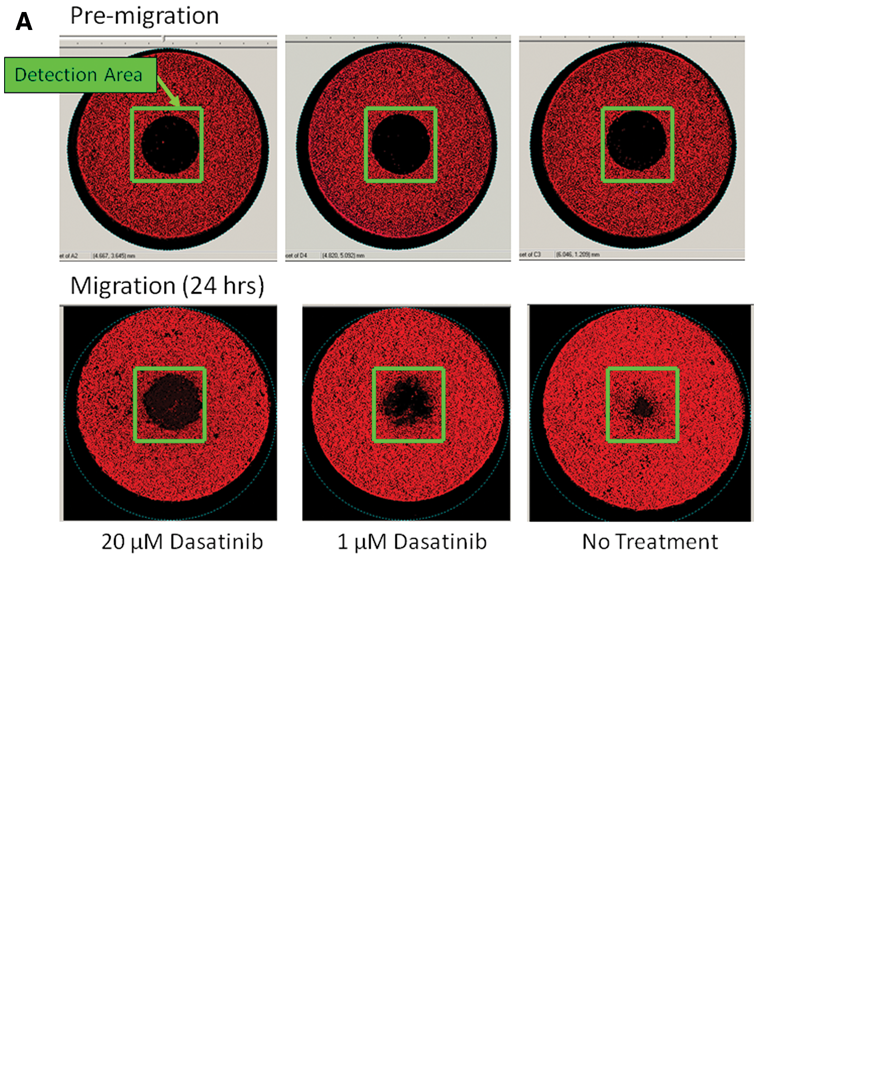
ECFCs (30,000/well) were plated in EGM®-2MV media containing 10% FBS on Oris™ Cell Migration—Collagen I Coated plates containing cell seeding stoppers. The cells were allowed to attach and spread for 16 to 20 h prior to manual removal of the stoppers. The cells were washed and media replaced with Angiokit Optimised Growth Medium containing 10% FBS, 0.4% DMSO, and the indicated concentrations of dasatinib. After a 24-h incubation with the compound, the media were removed and the cells were incubated in 100 µL of Prefer fixative. After 30 min, the cells were permeabilized by treating with PBS containing 0.1% Triton X-100 for 15 min. Following TX-100 treatment, the cells were washed twice with PBS, and 50 µL of 15 µM propidium iodide in RNase-free PBS was added to the cells. Images were captured on the Acumen™ Explorer using a 488-nm laser and >655-nm filter. A square around the cell-free zone, the migration area, was defined. In the operational version of the assay, a rectangle encompassing the confluent cell monolayer from the same well defined the cytotoxicity region. Mean intensity measurements were used to gate out cells with dim signals from debris. Total fluorescent cellular area (µm2) in the migration and cytotoxicity areas were used to calculate percent inhibition of migration (equation 1) and percent cell death (equation 2) where AreaDMSO, Areacompound treated, and Areamax dasatinib are the total cellular areas within the assay’s analysis region in the presence of 0.4% DMSO (solvent control), test compound, and a maximum inhibitory dose of dasatinib (40 µM), respectively.
Data analysis
Plate uniformity plots and concentration-response curves were generated for the data obtained using the scratch and Oris™ Cell Migration Assays using a plate uniformity calculator 9 and GraphPad Prism (GraphPad Software, La Jolla, Ca). Three-day plate uniformity and replication of potency studies were used to statistically validate the results of the Oris™ Cell Migration Assay using the Eli Lilly and National Institutes of Health (NIH) Chemical Genomics Center (NCGC) quantitative biology guidelines. 9
Results and Discussion
Evaluation of a scratch assay for cell migration
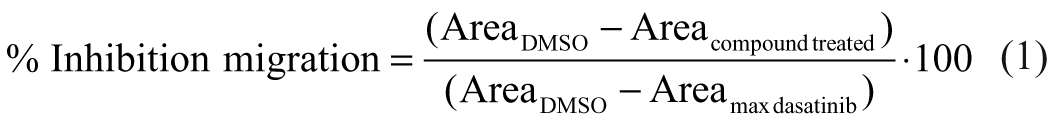
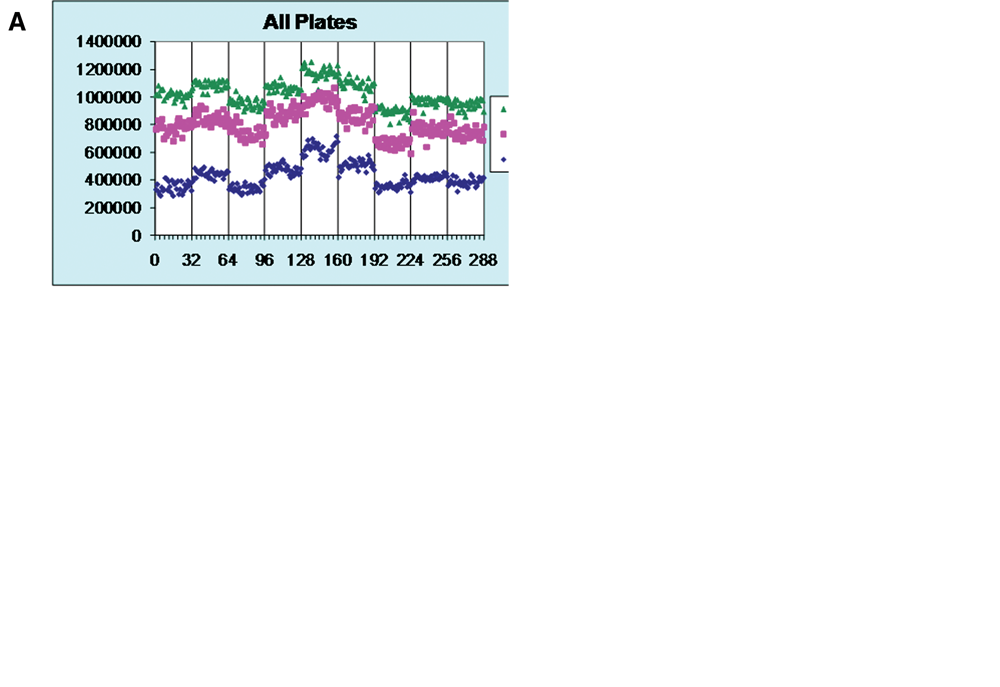
We evaluated the effect of dasatinib dose on ECFC migration in a traditional scratch assay. Premigration images of labeled cells were captured following wound formation within the ECFC monolayer ( Fig. 1a ). Red rectangles in the images define a specific analysis region that is identically placed within each well. Variation in the size and placement of the scratch in the premigration reference images illustrates the nonuniform nature and inconsistent dimensions of the scratch wound area ( Fig. 1a ). Following 24 h of incubation, ECFCs fill in and close the wound in control samples, whereas dasatinib inhibits wound closure. Data analysis from a plate uniformity experiment using high, medium, and low dasatinib concentrations results in a Z′ factor of 0.20 ( Fig. 1b ) without obvious edge effects. These results indicate poor assay performance. 9 A dasatinib dose-response experiment using this assay format shows a qualitative decrease in wound closure with increasing inhibitor concentrations, but extensive replicates are required to resolve a dose-response curve ( Fig. 1b ). Analysis of the dose-response curve using 8 replicates per data point results in an IC50 of 1.5 µM in agreement with previous findings. 6 Taken together, these results illustrate the issues related to the statistical robustness and efficient operation of the traditional scratch assay and indicate the unsuitability of this assay format for efficient quantitative compound evaluation.
Scratch assay: effect of dasatinib on endothelial colony-forming cell (ECFC) migration. (
It is important to note that the statistical robustness of the scratch assay is highly dependent on the method and automation used to initiate the monolayer wound. In contrast with our results, Simpson et al. 10 have shown that the scratch assay was effective in the assessment of siRNA molecules that acted as inhibitors and activators of wound healing. These investigators observed different Z′ factors for accelerators and inhibitors of cell migration such as RHOA siRNA (0.41) and RAC1 siRNA (0.29), respectively. 10
Evaluation of the Oris™ Cell Migration Assay
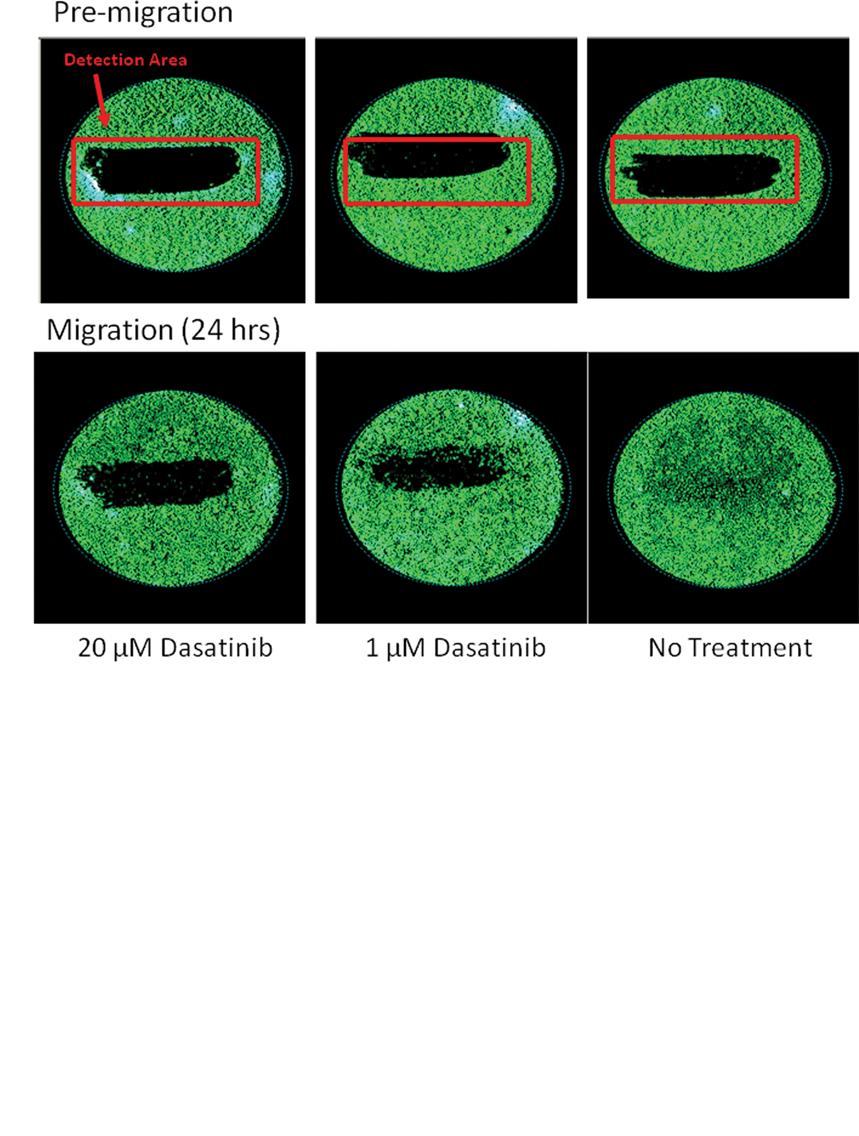
The Oris™ Cell Migration Assay differs from a scratch assay by use of silicone stoppers to act as nondamaging barriers during the cell seeding process. Following cell adhesion and stopper removal, the monolayer exhibits circular cell-free regions of uniform size. Superposition of the migration region boundaries onto the cell-free regions in the cell monolayer illustrates the reproducible placement and size of this region within each microplate well ( Fig. 2a , top row).
Oris™ Cell Migration Assay: effect of dasatinib on endothelial colony-forming cell (ECFC) migration. (
During assay operations, compounds are added to test plates immediately following the stopper removal and washing steps and then incubated for an additional 24 h. Dasatinib inhibits the closure of the cell-free zone in a dose-dependent manner. Data analysis from a plate uniformity experiment using high, medium, and low dasatinib concentrations results in a Z′ factor of 0.70 without obvious edge effects ( Fig. 2b ), a significant improvement over the scratch assay performance (signal window of 1.52 and a Z′ factor of 0.20; Fig. 1b ). Preliminary dose-response data indicate a significantly smaller standard deviation using 4 replicates per data point in the Oris™ assay ( Fig. 2b ) compared to results obtained with the scratch assay using 8 replicates per data point ( Fig. 1b ). Taken together, the Oris™ assay provides high-quality data by making cell-free regions of reproducible size and uniform well placement.
Validation of the Oris™ Cell Migration Assay for high-throughput screening
To investigate whether the Oris™ Cell Migration Assay was suitable for high-throughput screening (HTS), we followed the 3-day plate uniformity and replication of potency validation protocols established by the Eli Lilly and NIH Chemical Genomics Center. 9 The plate uniformity assessment tests 3 plates with interleaved high, mid, and low dasatinib concentrations per day for 3 days. Row or column view from a typical plate is shown in Figure 2b ; no evidence of systematic variation or edge effects is observed. Aggregation of the high, mid, and low results and corresponding Z′ scores for the validation experiment (9 plates over 3 days) are shown Fig 3a . Z′ scores ranged from 0.54 to 0.77 well above the Z′ score of 0.4 suggested for cell-based screening. 9 This analysis indicates that Oris™ migration assay passes Eli Lilly–NCGC screening guidelines and has sufficient reproducibility and plate uniformity to test compounds using single-point determinations.
Oris™ Cell Migration Assay: statistical validation of plate uniformity and reproducibility of compound potency. (
In addition to plate uniformity, assays supporting quantitative analysis of compound structure-activity relationships must provide reliable and reproducible measures of compound potency. The reproducibility of potency measurements was evaluated by comparing the IC50 values of 29 migration inhibitors of varying potency in 2 independent experiments ( Fig. 3b ) and by calculation of the minimum significant ratio (MSR). 11 The pass criteria for potency measurements require an MSR value of <3, indicating that 2 compounds that have an efficacy ratio greater than the MSR are statistically significant. 11 Graphical comparison of IC50 value variation in the Oris™ migration assay indicates very good day-to-day reproducibility. The calculated within-run MSR value of 1.97 indicates that compounds with IC50 values that differ more than a factor of 2 (in the same experiment) are statistically significant. 11 Taken together, the plate uniformity and compound potency data ( Fig. 3 ) indicate that the Oris™-Acumen™ Explorer migration assay is a robust and statistically validated assay capable of supporting quantitative compound evaluation using a single determination per data point. Although statistically validated, this stopper-based migration assay is limited for HTS operations by the need for manual stopper removal. Preliminary results using a stopper-free version of the Oris™ Cell Migration Assay resulted in Z′ scores above 0.5 (unpublished data). The stopper-free Oris™ Pro Cell Migration Assay employs a self-dissolving biocompatible gel to form the exclusion zone, which does not require manual intervention and may be useful for HTS operations with further optimization.
Phenotypic multiplexing with the Oris™ Cell Migration Assay
In addition to compound screening and structure-activity relationship support, quantitative biologists frequently need to devise testing paradigms to investigate compound mechanism of action or differentiate test compounds from standard of care compounds. In the case of a putative cell migration inhibitor, a trivial and unwanted mechanism of action is compound-mediated cytotoxicity. To address this issue, the operational version of the assay defines 2 regions of interest within each migration plate well ( Fig. 4 ). The first analysis area encompasses the circular space, which is created after stopper removal and is devoid of cells. Closure of this region by surrounding cells is a measure of cell migration and has been statistically validated ( Fig. 3A , B ). The second analysis region, a portion of the same microplate well seeded with cells, provides a means to determine changes in cellular area, a nonvalidated, relative measure of compound-mediated monolayer toxicity ( Fig. 4 ). The use of multiplexed assay readouts simultaneously provides information on compound potency in ECFC migration and cytotoxicity, which differentiates the phenotype of a true migration inhibitor (dasatinib; Fig. 4 ) from a “false positive” (compound A; Fig. 4 ).
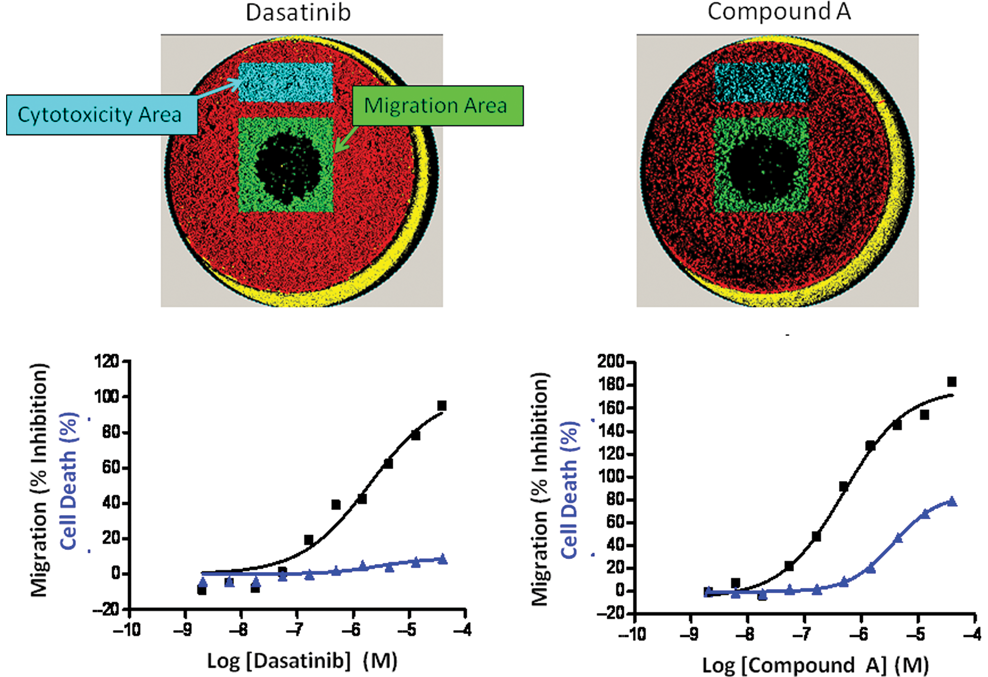
Multiplexed assay simultaneously monitors endothelial colony-forming cell (ECFC) migration and cytotoxicity, which defines phenotypic mechanism. The cell-covered areas of 2 regions of interest are monitored after 24 h of drug exposure. Increase in cell-covered area within the green area monitors cell migration; decrease in cell-covered area of the blue area monitors cytotoxicity. Cell-covered area (red) and area outside of well (yellow) are excluded from analysis. Concentration-response curves of cell migration inhibition (black line) and cell death (blue line) for a true migration inhibitor, dasatinib, and a “false positive,” compound A, using a single measurement per data point.
The Oris™ Cell Migration Assay has previously been used to examine the promigratory effects of anthocyanins on fibro-blasts and keratinocytes, 2 models of wound healing, where statistically significant dose- and time-dependent stimulation of migration was observed for both cell types. 12 In agreement with our results, a recent preliminary communication demonstrated the ability to achieve robust Z′ factors and signal windows using the Oris™ Cell Migration Assay in conjunction with an Acumen™ eX3 microplate cytometer to analyze HT-1080 and MDA-231 cells labeled with nuclear, whole-cell, or actin-specific dyes. 13 The current study extends the observations of Wylie et al. 13 by incorporation of (1) an alternative measure of cell count (area rather than cell number), (2) rigorous statistical assay validation procedures, (3) a direct comparison of the Oris™ Cell Migration Assay with the traditional scratch assay, and (4) a multiplexed phenotypic readout that identifies true migration actives ( Fig 4 ).
The Oris™ Cell Migration Assay differs from other migration assay formats in regard to the overall biology that is potentially interrogated. In addition to cell migration, the scratch assay may be sensitive to factors related to cell damage or wound healing. Similarly, Boyden chamber-based assays may be more sensitive with biological systems where compound gradients are important.
The Oris™ migration assay measures the biology directly relevant to cell motility independent of the various chemosensing functions that are components of other cell migration assays. Direct comparison of 17 compounds that modulate tubulin polymerization or inhibit SRC, RAC1, ROCK1, and myosin II resulted in 12 compounds with IC50 values with less than a 3-fold difference between the Oris™ and scratch assays. Significantly, both the ROCK1 inhibitors, Y-27632 and fasudil, and the myosin II inhibitor blebbistatin were inactive in both formats, consistent with the observation that Rho-kinase and myosin II inhibitors decrease endothelial cell migration in 3D but not 2D cell culture 14 (data not shown). Log IC50 (scratch) versus log IC50 (Oris™) plots of the remaining 14 compounds resulted in R 2 = 0.6, which increased to 0.8 after elimination of 1 outlier ( Fig. 5 ). Although it is difficult to compare results between validated and nonvalidated assays, the data indicate an overall correspondence between the 2 assay formats for the compounds tested.
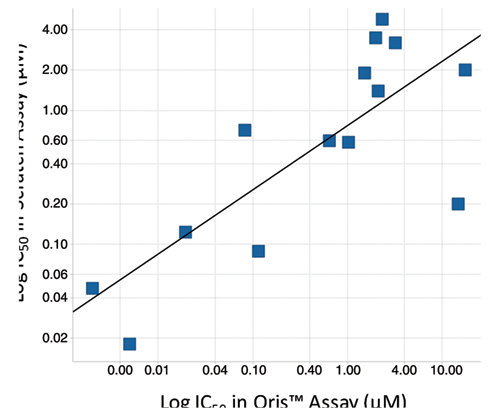
Comparison of scratch and Oris™ Cell Migration Assays: compounds that modulate tubulin polymerization or inhibit SRC, RAC1, ROCK1, and myosin II activity were tested in the endothelial colony-forming cell (ECFC) assay in both formats. Inhibitors of ROCK1 and myosin II were inactive in both formats. A plot of log IC50 (scratch), a nonvalidated assay, versus log IC50 (Oris™), a validated assay, of the remaining compounds results in R 2 = 0.6, which increased to 0.8 after elimination of 1 outlier.
The development of a reliable and quantitative assay to measure cellular migration has greatly facilitated our ability to classify compounds by biological phenotype in early drug discovery. The Oris™ Cell Migration Assay, when optimized for use with fixed-cell imaging, is more stable, has fewer steps, and yields results that are more reproducible than the scratch assay. Many of the time-consuming and error-prone steps of the live-cell scratch assay were eliminated by using the Oris™ Cell Migration Assay with fixed cells. These modifications, along with the uniform migration areas and the versatility of the Acumen™ Explorer, have allowed us to obtain results that exceed the required signal-to-noise, plate uniformity, and compound potency reproducibility criteria established by Eli Lilly and NCGC for assay validation. 9 In addition, incorporation of phenotypic multiplexing in the assay provides an effective means to readily identify and eliminate migration inhibitors working through cytotoxic mechanisms. Given the analyte multiplexing potential of the Acumen™ Explorer eX3, 13 additional cellular parameters such as biomarkers of specific signal transduction pathway activities or cellular differentiation states can be easily added to future assays. Use of the Oris™ Cell Migration Assay will allow us to make sure and rapid progress in target-directed lead optimization 7 or phenotypic drug discovery 8 efforts.