
Abstract
Glioblastoma (GBM) is the most aggressive primary brain cancer with an average survival time after diagnosis of only 12–14 months, with few (<5%) long-term survivors. A growing body of work suggests that GBMs contain a small population of glioma stem cells (GSCs) that are thought to be major contributors to treatment resistance and disease relapse. Identifying compounds that modulate GSC proliferation would provide highly valuable molecular probes of GSC-directed signaling. However, targeting GSCs pharmacologically has been challenging. Patient-derived GSCs can be cultured as neurospheres, and in vivo these cells functionally recapitulate the heterogeneity of the original tumor. Using patient-derived GSC-enriched cultures, we have developed a 1536-well spheroid-based proliferation assay and completed a pilot screen, testing ~3300 compounds comprising approved drugs. This cytotoxic and automation-friendly assay yielded a signal-to-background (S/B) ratio of 161.3 ± 7.5 and Z′ of 0.77 ± 0.02, demonstrating its robustness. Importantly, compounds were identified with anti-GSC activity, demonstrating the applicability of this assay for large-scale high-throughput screening (HTS).
Introduction
Glioblastoma (GBM) is the most aggressive primary brain cancer, characterized with high recurrence rates and exceptionally poor prognosis.1,2 Even after multimodal therapy such as tumor resection, radiation, and chemotherapy (temozolomide), median survival is only 12–14 months, with less than 30% of patients achieving 2-year survival. 3 Improved treatments that target the source of chemotherapy resistance and tumor recurrence are desperately needed.
Our inability to effectively treat GBM is due in part to the propensity of GBM cells to infiltrate and colonize normal brain tissue, preventing complete surgical removal of malignant cells. 4 Moreover, for GBMs to establish at secondary sites within the brain, these motile cells must be able to self-renew, generate differentiated daughter cells, and spawn a heterogeneous tumor. GBMs, like hematopoietic malignancies and other solid tumors, have been shown to comprise a small population of cancer stem cells known as glioma stem cells (GSCs), which have the capacity to reconstitute the heterogeneity of the parental tumor after serial dilution and intracranial implantation into immune-compromised mice.5,6 Moreover, GSCs demonstrate infiltrative properties that have increased resistance to current therapies and are thought to be primary contributors to chemotherapy resistance and tumor recurrence.7–10 Accordingly, selectively targeting GSC proliferation in combination with current therapies is an attractive strategy to improve treatment outcome in GBM.
Increased understanding of the master regulators and epigenetic ancillary factors that control the tumor-propagating potential in GBM is beginning to be realized. 11 Furthermore, proof-of-principle genetic studies have shown that blocking self-renewal of GSCs leads to prolonged survival in GSC patient-derived mouse efficacy studies. 12 Nevertheless, the optimal GSC-drug targets for clinical translation remain ill-defined. 13 Establishing cancer models for evaluating new chemotherapeutics is of high priority. Cancer cells cultured in conditions to mimic 3D tumor growth reflect tumor cell contact within the in vivo tumor environment, which is not recapitulated in a traditional monolayer cell culture context. 14 Additionally, 3D cultures will mimic some of the physical barriers that anticancer drugs encounter when delivered in vivo that are not present in typical 2D cultures. 15
Recent studies have enabled drug screening using adherent patient-derived GSC cultures.16–18 Here we describe development of a patient-derived GSC, 3D-spheroid, ultra-high-throughput proliferation assay. We have optimized and validated the assay in 1536-well format, testing our approved drug collection comprising the National Cancer Institute (NCI) oncology drug set of 114 compounds and ~3300 clinically approved drugs. This automation-friendly assay yielded a signal-to-background (S/B) ratio of 161.3 ± 7.5 and Z′ of 0.77 ± 0.02, demonstrating the applicability of this assay for large-scale high-throughput screening (HTS).
Material and Methods
Cell Lines
GSCs were a gift from Jan N. Sarkaria. 19 For this study, the GBM6 primary GBM cell line was used. The histopathological and molecular features of the primary GBM tumor were maintained by serial transplantation in flanks of nude mice. 20 GSCs were grown for the short term (less than 10 passages) in StemPro NSC Serum-Free-Medium (Part A1050901, Thermo Fisher Scientific, Waltham, MA) supplemented with GlutaMAX (Part 35050061, Thermo Fisher Scientific) and penicillin-streptomycin (Part 15140122, Thermo Fisher Scientific) in a tissue culture incubator at 37 °C and 5% CO2 following a culture method described previously. 21 In order to grow GBM6 GSCs attached, GSCs were seeded in plates coated with laminin (Part L2020, Sigma-Aldrich, St. Louis, MO) in the same medium as before, and to generate GBM6 bulk tumor cells, the cells were grown on Dulbecco’s modified Eagle’s medium (DMEM; Part 11965118, Thermo Fisher Scientific) supplemented with 10% fetal calf serum (FCS; Part 16140071, Thermo Fisher Scientific). The U87 cell line was grown in DMEM–10% FCS.
3D-Spheroid Analysis
For staining nuclei, 3D spheres were incubated with 2 µg/mL dilution of Hoechst for 20 min. Images were captured every 1 micron using an Olympus FluoView 1000 confocal microscope (Olympus, Shinjuku, Tokyo, Japan). Image analysis and Z stacking were carried out using ImageJ software.
Compound Library
A collection of 3291 clinically approved drugs obtained from multiple vendors were assembled at the Scripps Research Institute Molecular Screening Center (SRIMSC) and reformatted into 1536-well source plates for automated robotic screening. These compounds have been approved by either the Food and Drug Administration (FDA), the European Medicines Agency (EMA), or the Japanese Pharmaceuticals and Medical Devices Agency (PMDA). The NCI-approved oncology drug set of 114 compounds was obtained directly from the NCI and included in this effort.
Cell Proliferation Assay
A cell proliferation assay was developed in a 1536-well format. GSC cells were grown in StemPro NSC Serum-Free-Medium and trypsinized (Part 25300120, Thermo Fisher Scientific) for 1 min at 37 °C. Trypsin was inactivated using 5 volumes of DMEM–10% FCS, and cells were centrifuged at 320g for 3 min. Dissociated cells were resuspended in StemPro NSC Serum-Free-Medium and filtered through a cell strainer 70 µm (Part 352350, Corning, Corning, NY). One thousand cells in 5 µL of culture media were seeded per well in 1536-well, clear-bottom, tissue-culture-treated microtiter plates (Part 789072, Greiner Bio-One, Monroe, NC). After incubation of the GSC cells for 2 days, to allow the spheroid formation, cells were treated with compounds and vehicle (0.15% DMSO). Cell proliferation was assessed after another 72 h of incubation using CellTiter-Glo reagent (Part G7572, Promega, Madison, WI) according to the manufacturer’s instruction. CellTiter-Glo reagent generates a luminescent signal proportional to the amount of ATP present. The amount of ATP is directly proportional to the number of cells present in the culture. The ViewLux microplate reader (PerkinElmer, Waltham, MA) was used to quantitate luminescence signal. EC50 values of our reference compound, SR-3029, were determined by fitting the concentration–response curve (CRC) data with a four-parameter variable slope method in GraphPad Prism (GraphPad Software, San Diego, CA).
HTS Campaign and Data Processing
The 1536-well HTS campaign was screened at 2 µM final drug concentration. All data files were uploaded into the Scripps database for individual plate quality control determination and hit identification. Assay plates were determined acceptable only if their Z′ was >0.5.
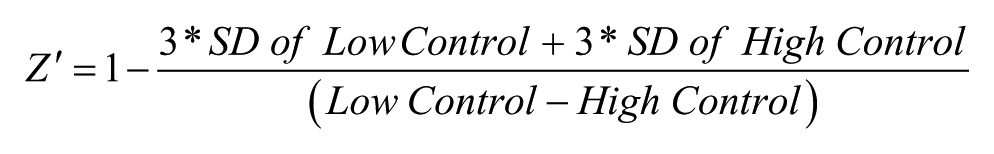
The Z′ was calculated using the following expression:
Compound activity was normalized on a per-plate basis using the following equation:
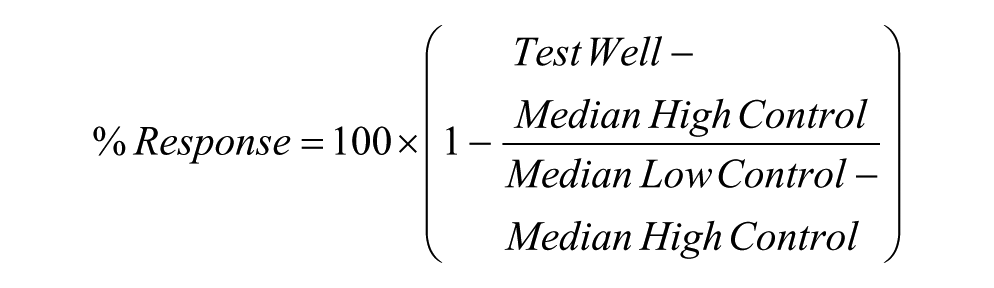
Test Well refers to those wells with cells treated with test compounds. High Control is defined as wells containing medium treated with DMSO (100% response), and Low Control wells contain cells treated with DMSO (0% response).
In addition, the EC50 of our pharmacological control compound, SR-3029, a casein kinase inhibitor, was used for quality control in the HTS campaign, which we required to be within threefold of the historic EC50 on an experimental basis. A hit cutoff was used to define active compounds in this pilot screen, calculated as the average percent response of all dataset values plus three times their standard deviation, of all the tested compounds. Any compound that exhibited a percent response greater than the hit cutoff was declared active.
Active hits were chosen and prepared as 10-point, threefold serial dilutions and tested against GSC spheroids in triplicate starting from a 5 µM nominal concentration. For each test compound, a percent response was plotted against the compound concentration. A four-parameter equation describing a sigmoidal dose–response curve was then fitted using Assay Explorer software (Symyx Technologies, Santa Clara, CA). The reported EC50 values were generated from fitted curves by solving for the X-intercept value at the 50% response level of the Y-intercept value. In cases where the highest concentration tested (i.e., 5 µM) did not result in greater than a 50% response, the EC50 was deemed as greater than 5 µM.
Results and Discussion
Characterization of Glioma Stem Cell Spheroid Formation
Prior to optimization of the assay conditions we confirmed that spheroid cultures derived from patient explants were enriched with GSCs. We first analyzed the spheroid cultures for the GSC markers, Nestin, SOX2, and SOX9, as detected by immunofluorescent microscopy ( Suppl. Fig. S1A–C ).22–24 Next, the presence of GSCs was confirmed by functional assays, including self-renewal of neurosphere formation and the generation of intracranial heterogeneous tumors in immunocompromised mice (data not shown). 20
Development and Optimization of a 1536-Well GSC Spheroid Proliferation Assay
To test uniformity of GSC sphere number and volume per well, GSCs were dissociated to single cells and seeded at increasing cell number (500, 1000, 1500, and 2000 cells per well) in 1536-well, clear-bottom plates. The formation of spheroids was monitored by bright-field, and also by confocal fluorescence microscopy using Hoechst staining. As anticipated, seeding concentration did not affect spheroid size and the number of spheroids increased proportionally to the original seeding density. Note that GSC spheroids do not aggregate in these wells as one contiguous aggregate, but instead grow as multiple homogenous spheres (average of ~25 microns). Representative micrographs of GSC spheroid formation as a function of time are shown in Figure 1A . A 3D depiction of the mean volume and maximum intensity projection of the Z-stack analysis of a representative GSC spheroid is shown ( Fig. 1B , C ). Replicate wells demonstrated a consistent spheroid size with a Gaussian distribution at 48 h after seeding ( Fig. 1D ).
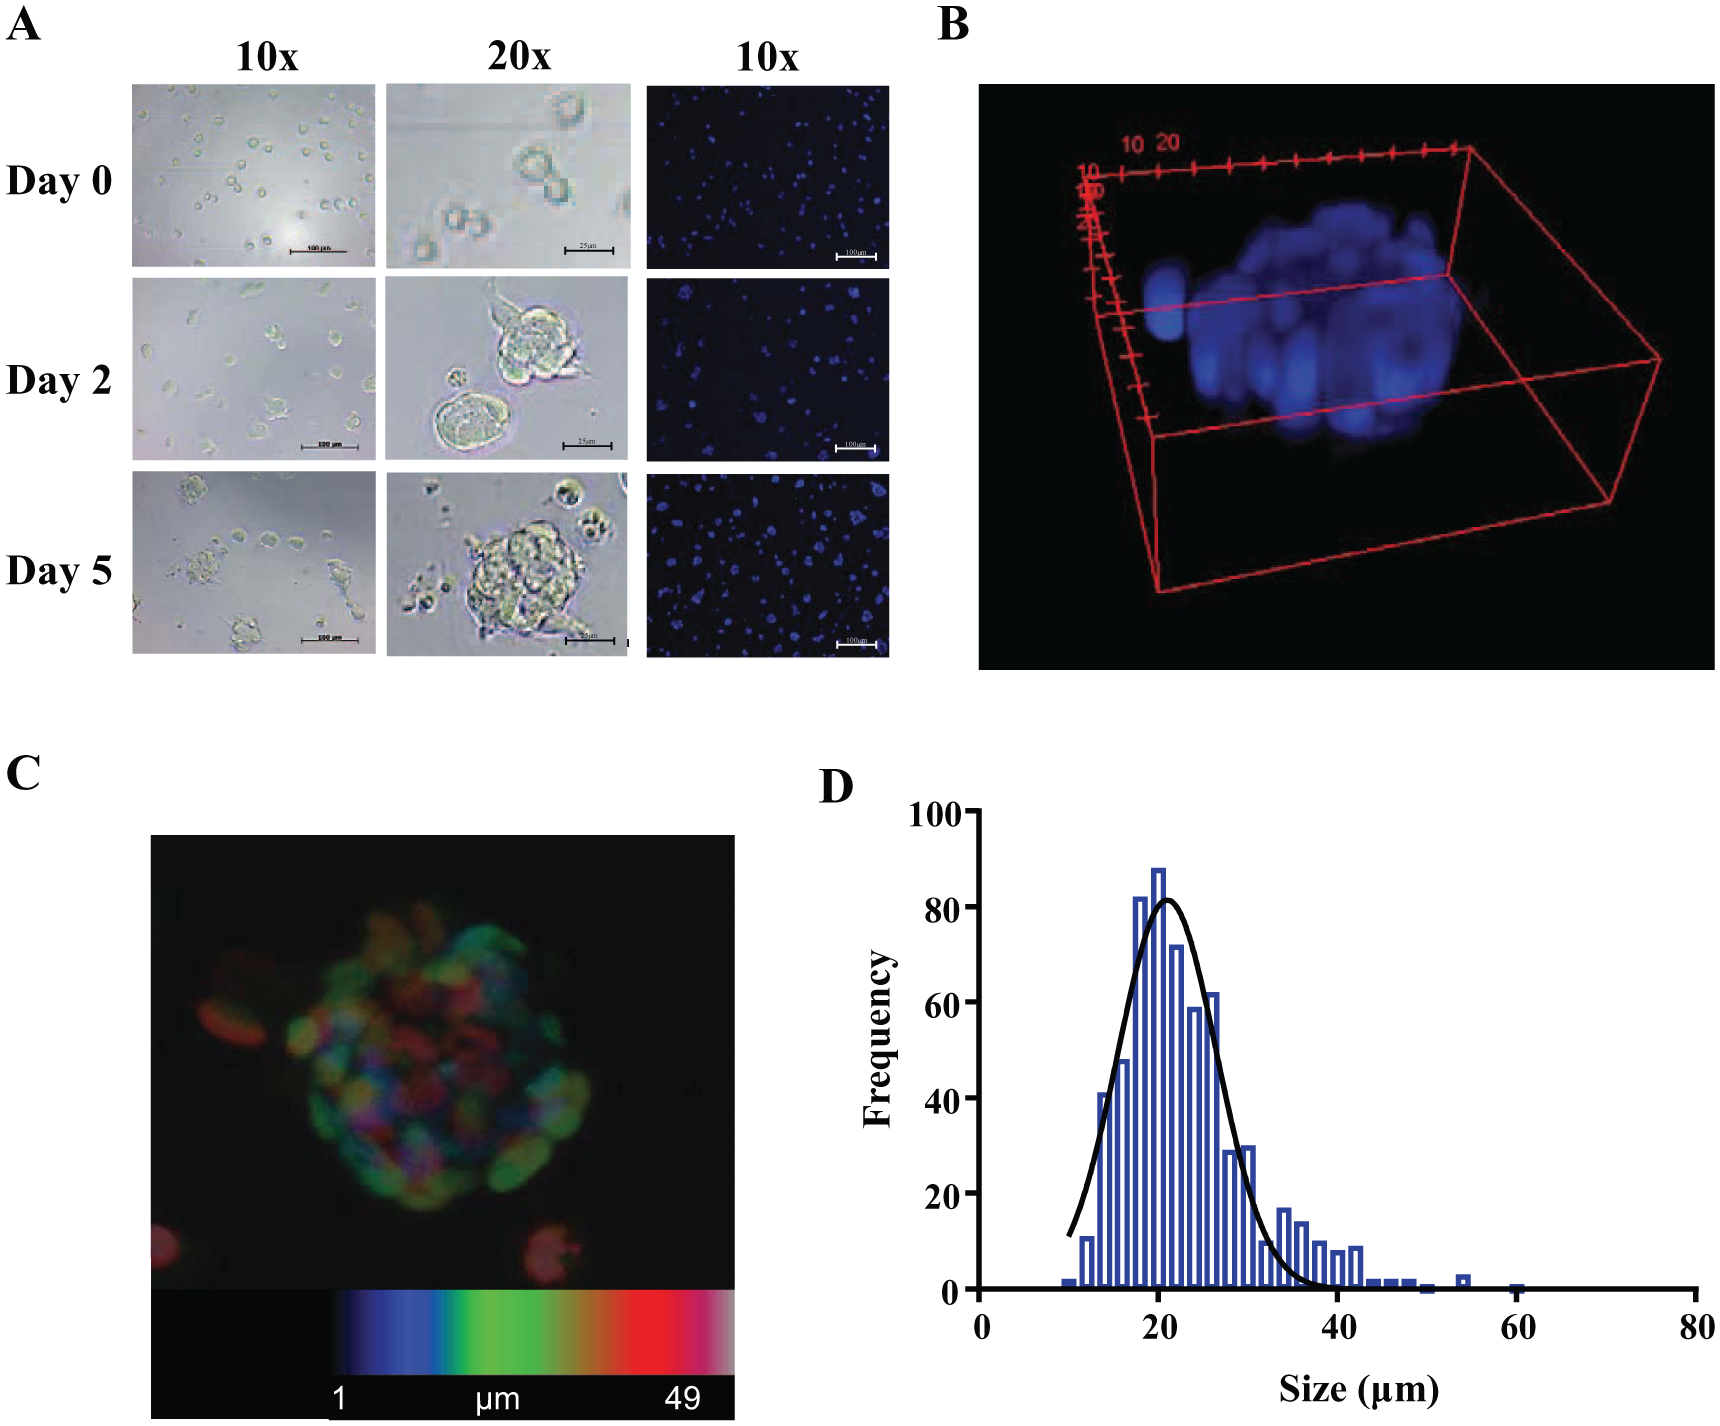
Characterization of GSC spheroids in 1536-well format. (
CellTiter-Glo 3D (Promega) has recently been developed to increase the lytic capacity in organoids and large 3D-spheroid cultures with the goal of improving penetration of aggregated cell cultures, providing more uniform signal. To test whether CellTiter-Glo 3D was required for uniform lysis of the GBM spheroids, we compared the overall signal using standard CellTiter-Glo and CellTiter-Glo 3D. In this case, no significant differences were observed ( Suppl. Fig. S2 ), and hence CellTiter-Glo was chosen for further use.
Next, we confirmed the linearity of the luminescence signal as a function of time (37 °C) upon seeding GSCs at increasing cell densities in clear-bottom, 1536-well plates. The luminescence signal was linear, consistent with maintenance of a proliferative state under the seeding conditions tested ( Fig. 2A ). We also assessed if cell number or spheroid density altered the EC50 of SR-3029, 25 our pharmacologic control. Using different seeding densities of GSCs and a 10-point CRC and 1:3-fold serial dilution, we determined the EC50 of SR-3029. The calculated EC50 values were similar with acceptable S/B ratios and Z′ values for each cell density tested ( Fig. 2B ). We observed that 1000 or 1500 cells per well consistently produced higher Z′ values over other seeding densities. The final conditions for the assay are described in Table 1 .
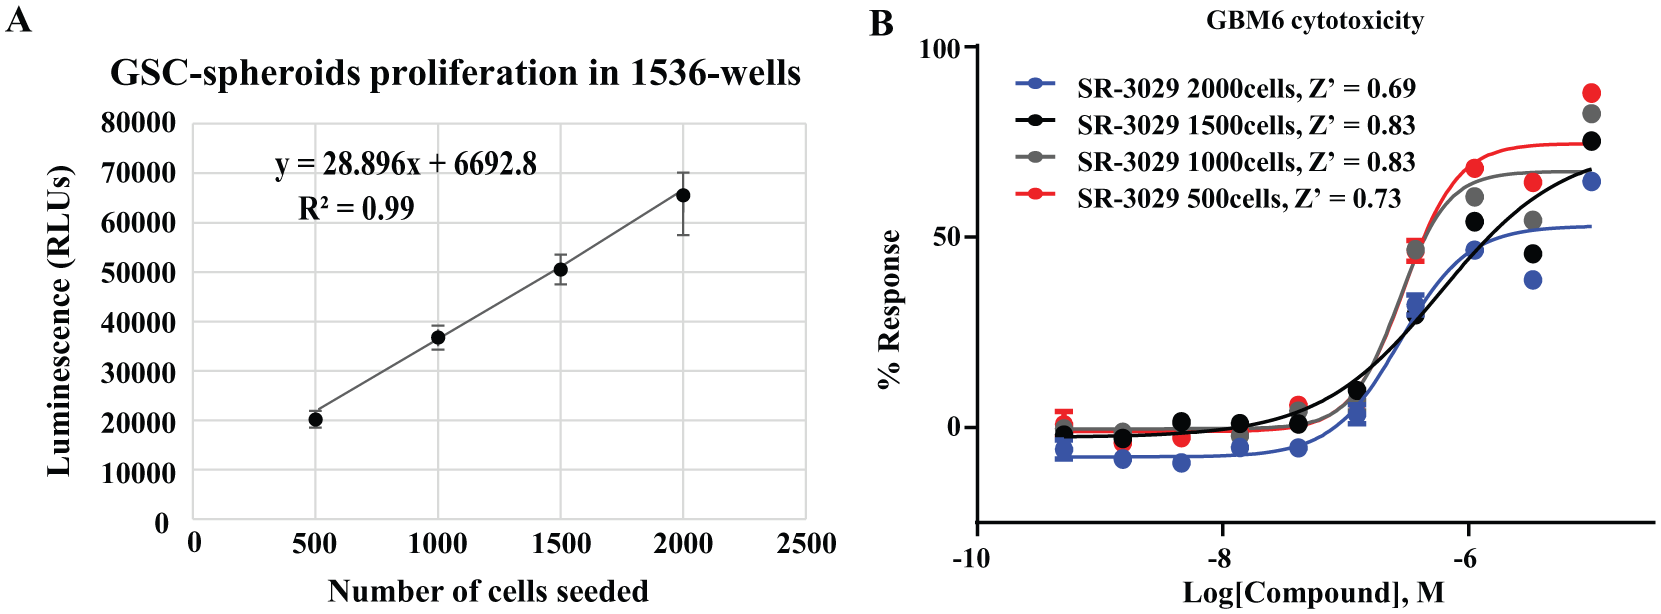
Optimization of a GSC spheroid proliferation assay in ultra-high-throughput format. (
Stepwise Protocol for the 1536-Well Plate 3D-GBM-Spheroid Cytotoxicity Assay.
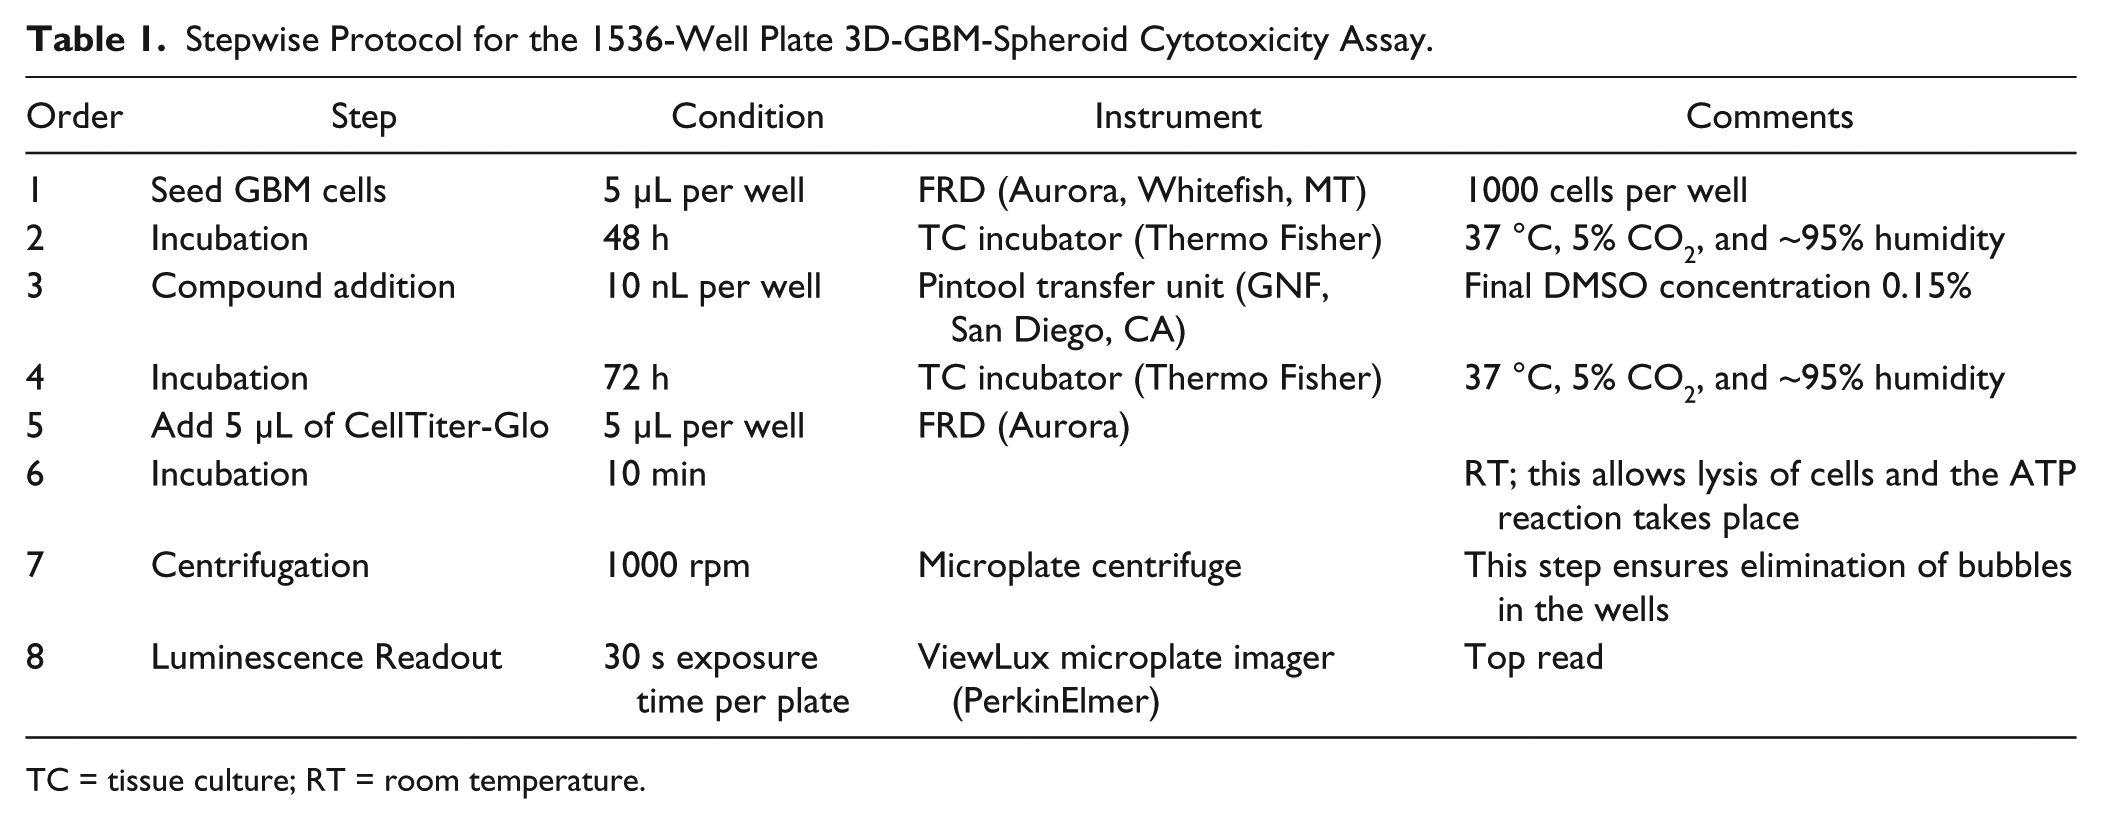
TC = tissue culture; RT = room temperature.
Pilot Screen of the NCI and FDA Compound Collections
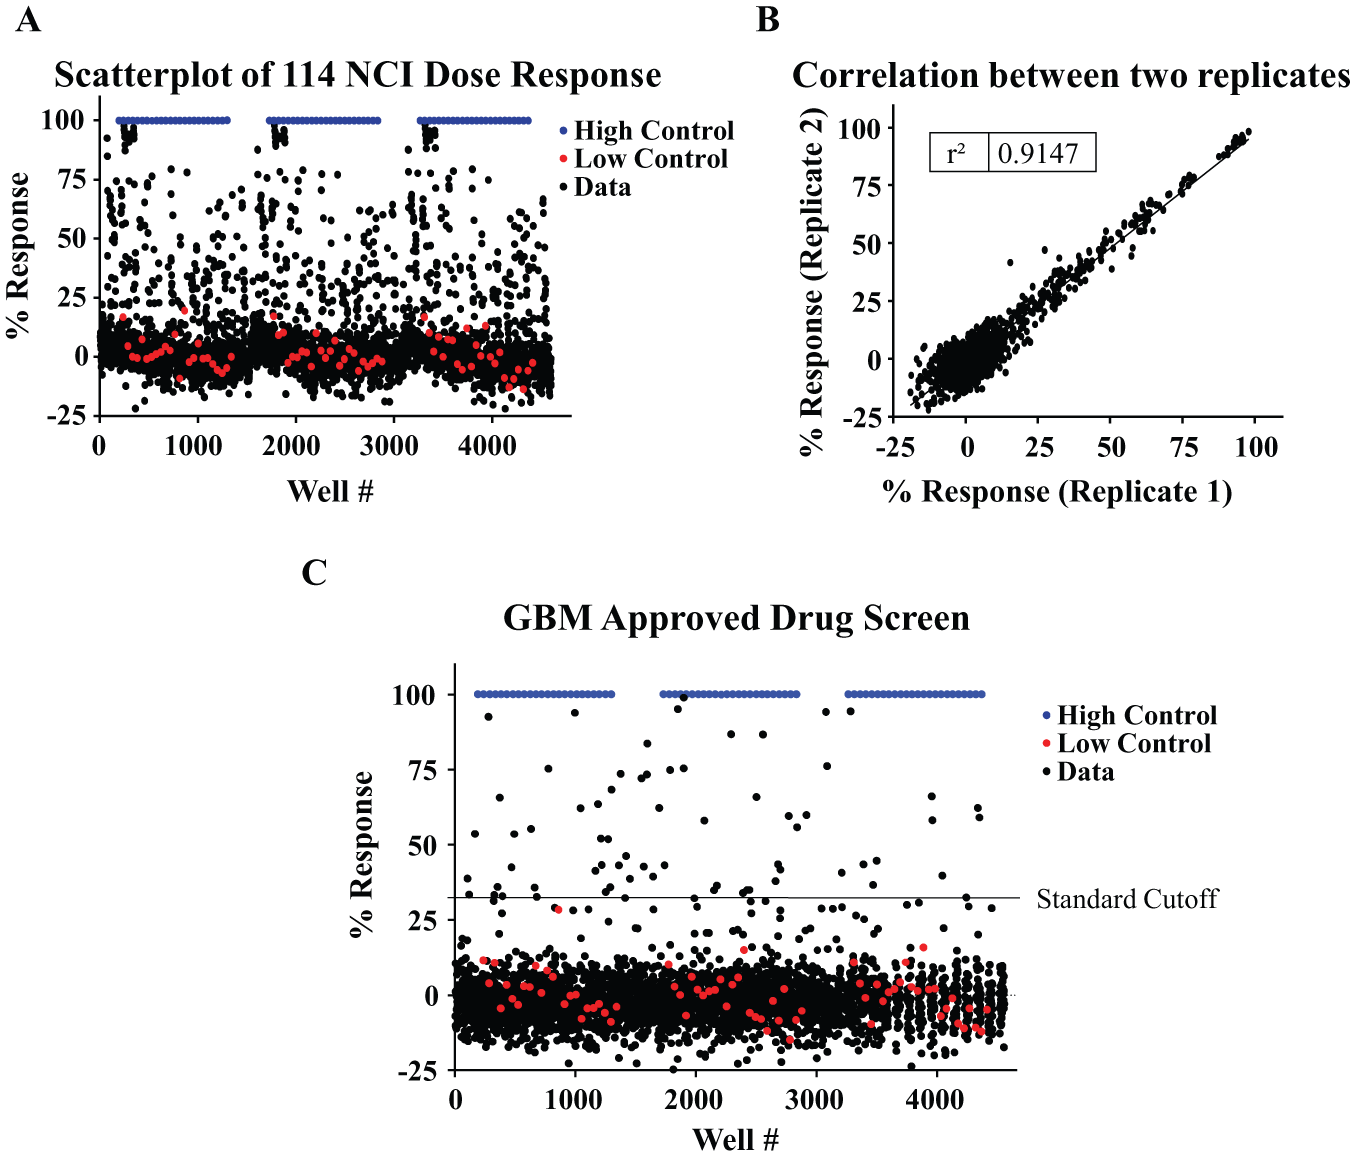
To determine the performance of the optimized assay under automated conditions and to identify interesting drugs that affect this cytotoxic assay, we screened the NCI (n = 114) and FDA-approved drug (n = 3177) compound collections. The NCI collection includes 114 drugs that were assessed as 10-point (1:3 serial) dilutions starting at a 5 µM concentration (
Fig. 3A
). This collection was assayed in triplicate and exhibited a Z′ = 0.79 ± 0.04 and S/B ratio = 181.3 ± 1.8, confirming assay robustness. In addition, the scatterplot of measurements from replicates yielded a correlation coefficient of r2 = 0.91, indicating high reproducibility between replicates (
Fig. 3B
). We analyzed the CRC for each compound and calculated the EC50. Fifteen compounds were identified with EC50 values below 1 µM. A detailed table with all hits is included in
Pilot screening of the NCI and FDA collections. (
The FDA collection was tested at a single dose (2 µM). The average Z′ of the assay was 0.77 ± 0.02, and the average S/B ratio was 163.5 ± 7.5. The hit cutoff (assay average value +3 SD) was calculated as 32.41% response, identifying 66 compounds as hits for the assay (hit rate of the 2%,
Fig. 3C
). Of these, 11 were compounds that overlapped with the NCI collection. Of the 55 remaining compounds, 48 were available commercially. EC50 values of the compounds are included in
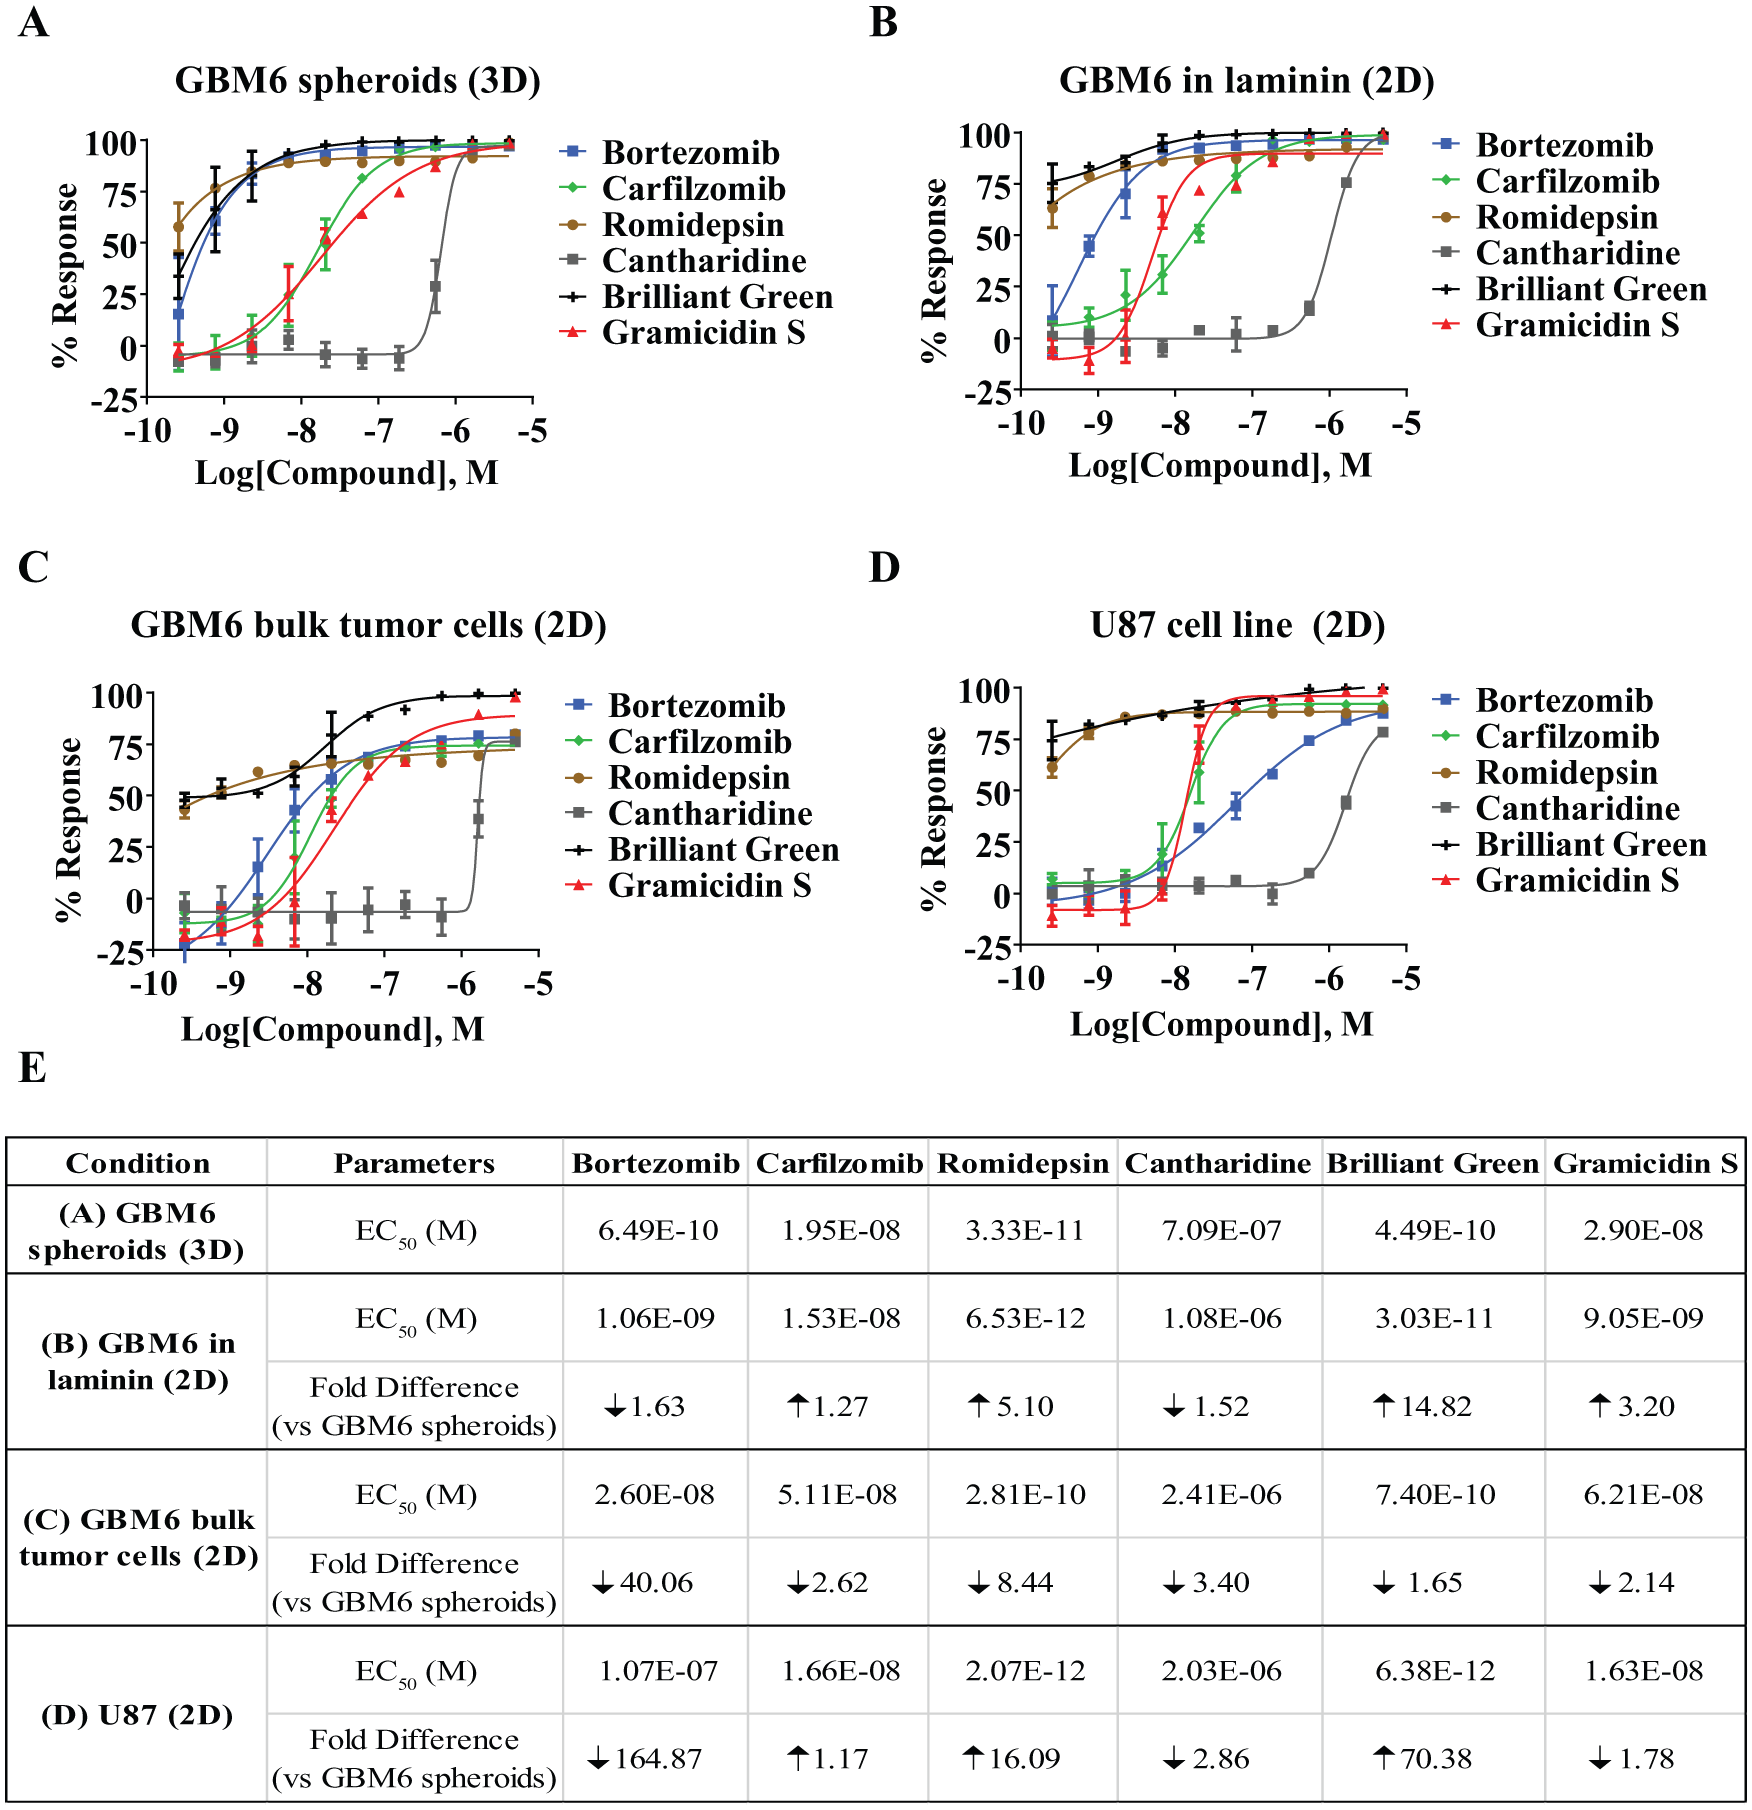
Analysis of selected compounds from 1536-well pilot screening of the NCI and FDA collections on GBM6 and U87 cells under different culture conditions. Concentrations of selected compounds were used to treat GBM6 spheroids grown on 3D (
In summary, the inability of current therapies to effectively treat GBM emphasizes the need for additional approaches to identify new vulnerabilities in GBM. Inhibiting self-renewal of GSCs is a promising therapeutic strategy, although targeting GSCs pharmacologically has proven challenging. We report here the development of a patient-derived GSC, 3D-spheroid, ultra-high-throughput, and automation friendly proliferation assay that is amenable for large-scale HTS. We anticipate that an HTS campaign using this assay combined with downstream selectivity assays, for example, a neural progenitor cell proliferation assay, would provide an unbiased approach to identify small-molecule compounds that selectively inhibit the proliferation of GSCs. Identifying compounds that selectively block GSC proliferation would provide highly valuable tools to facilitate chemical biology approaches to identify and validate targets essential for GSC maintenance.
Supplemental Material
DS_775055 – Supplemental material for A Cytotoxic Three-Dimensional-Spheroid, High-Throughput Assay Using Patient-Derived Glioma Stem Cells
Supplemental material, DS_775055 for A Cytotoxic Three-Dimensional-Spheroid, High-Throughput Assay Using Patient-Derived Glioma Stem Cells by Victor Quereda, Shurong Hou, Franck Madoux, Louis Scampavia, Timothy P. Spicer and Derek Duckett in SLAS Discovery
Footnotes
Acknowledgements
We thank Pierre Baillargeon and Lina Deluca at Scripps for their help with compound management.
Supplemental material is available online with this article.
Declaration of Conflicting Interests
The authors declared no potential conflicts of interest with respect to the research, authorship, and/or publication of this article.
Funding
The authors disclosed receipt of the following financial support for the research, authorship, and/or publication of this article: Research reported in this publication was supported by the National Cancer Institute of the National Institutes of Health under award number R33CA206949, and support for V.Q. was provided by a fellowship from FCBTR/ABC² Brain Tumor Grants Program.
References
Supplementary Material
Please find the following supplemental material available below.
For Open Access articles published under a Creative Commons License, all supplemental material carries the same license as the article it is associated with.
For non-Open Access articles published, all supplemental material carries a non-exclusive license, and permission requests for re-use of supplemental material or any part of supplemental material shall be sent directly to the copyright owner as specified in the copyright notice associated with the article.