
Abstract
Glioblastoma multiforme (GBM) is the most common and most aggressive type of primary brain tumor. Identification of new therapeutic regimens is urgently needed. A major challenge remains the development of a relevant in vitro model system with the necessary capacity and flexibility to profile compounds. The authors have developed and characterized a 3D culture system of brain cells (brain Hi-Spot) where GBM-derived cells can be incorporated (GBM/brain Hi-Spot). Immuno-fluorescence and electrophysiological recordings demonstrate that brain Hi-Spots recapitulate many features of brain tissue. Within this tissue, GBM-derived cell growth is monitored using a fluorescence assay. GBM-derived cells growing in Hi-Spots form tumor nodules that display properties of GBM such as 5-Ala positive staining, an acidic environment, and tumor-surrounding astrocyte activation. Temozolomide inhibits GBM growth in brain Hi-Spots, but it is not effective in 2D cultures. Other chemotherapeutics that have proven to be inefficient in GBM treatment display low activity against GBM-derived cells growing in brain Hi-Spots in comparison to their activity against GBM 2D cultures. These findings suggest that GBM/brain Hi-Spots represent a simple system to culture cells derived from brain tumors in an orthotopic environment in vitro and that the system is reliable to test GBM targeting compounds.
Introduction
G
Initial screening of compounds of potential relevance in anticancer chemotherapy is often based on their ability to kill or inhibit the proliferation of established cell lines, including a “certified” National Cancer Institute (NCI) panel. 3 This framework has well served the scientific community by providing a common, standardized set of widely available cellular reagents, amenable to high-throughput studies and to the analysis of cytotoxic drugs and signal transduction requirements underlying the effects of specific targeted drugs. 4 More recently, several studies have indicated that cancer cells maintained in vitro in 2D and on plastic under standard tissue culture conditions have adapted to these special environment by changing gene expression patterns and signaling networks. 5 Depending on the drug targets studied and the mechanism of action of the compounds analyzed, cells grown under such conditions do not represent the in vivo situation and therefore do not offer a reliable system to test and preselect certain anticancer drugs before testing them in more elaborate in vivo models or in clinical trials. Hence, it is increasingly being recognized that the third dimension and the interaction of different cell types (the environment) are important in maintaining the gene expression patterns and signaling networks operational in vivo and in generating reliable in vitro systems to predict the pharmacological response of therapeutic candidate compounds. 6 Indeed, the proliferation of tumor cells cultured in 3D is typically slower than that of monolayer cultures. 7 This dynamic fits the Gompertz equation, an algorithm used to quantitatively evaluate in vivo neoplastic growth. Furthermore, it has been shown that tumor cells cultured in 3D display different metabolic characteristics as compared to monolayer cultures. Notably, tumor cells of epithelial origin cultured in 3D have been shown to change shape and lose polarity, a feature typically associated with tumor progression in vivo. 8 Taken together, these findings call for the refinement of the conventional 2D screening procedures for potential antitumor compounds and urge the development and characterization of novel 3D approaches with high throughput combined with useful readout technologies.
Several 3D culture methods have been exploited in the past to culture cancer cells and tumor tissue from patients. 9 For example, multicellular tumor spheroids represent small tumor nodules with nutrient, pH, and oxygen gradients as well as cells at different physiological states depending on their location in the 3D organoid (for review, see Friedrich et al. 10 ). Organotypic cultures have also been characterized in terms of tissue integrity, cell viability, and gene as well as signaling pathway expression. The feasibility of using such organotypic explants for pharmacodynamic profiling of drugs has been demonstrated in lung and colon tumors. 11 However, brain tumors are more difficult to grow in organotypic cultures because of their friability. Furthermore, this method requires access to tumor tissue samples immediately after surgery, precluding systematic compound profiling. Therefore, to grow GBM-derived tumor cells in a physiological environment that would allow compound testing, we wished to establish an easy to access organotypic culture of brain tissue. Recently, a method that allows brain embryonic stem cell expansion has been described using an air–liquid interface-based method. 12 We show here that the use of such an air–liquid interface system to co-cultivate brain cells together with glioblastoma cells recapitulates features of clinical GBM and offers a unique simple tool to assess the pharmacodynamic properties of potential anticancer drugs.
Materials and Methods
Cell lines
LN18, GL15, U87, and A172 cells (ATCC, Manassas, VA) were cultured in Dulbecco’s medium supplemented with 2 mM glutamine and 10% fetal calf serum (FCS). To generate enhanced green fluorescent protein (eGFP) stably expressing cells, each cell line was transfected with pEGFP-N3 (BD Biosciences, Franklin Lakes, NJ) using Gene Juice (Novagen, Madison, WI) as per the manufacturer’s protocols. Twenty-four hours after transfection, the transfected cells were selected with 400 µg/mL Geneticin (GIBCO, Carlsbad, CA).
Reagents
5-Aminolevulinic acid hydrochloride (ALA; Sigma, St. Louis, MO) was used at a final concentration of 100 µg/mL and added to the medium 24 h before imaging the Hi-Spots. Taxol (Sigma) was solubilized in DMSO to 1 mM. Temozolomide (Sigma) was solubilized in DMSO to 100 mM. Cytosine β-D-arabinofuranoside (Ara-C; Sigma) was solubilized in water to 100 mM.
Hi-Spots generation
P0 Wistar rats were sacrificed and the brains removed. Cortices were dissected into a Petri dish, chopped into small pieces, and put into cold Earle’s balanced salt solution (EBSS; GIBCO). Tissue pieces were then triturated very gently. The resulting cell suspension was filtered through a 100-µm mesh filter and centrifuged at 1000 rpm/3 min at 20 °C. Viable cells were counted using Trypan blue exclusion and the cell pellet resuspended to 50 000 cells/µL. Then, 5 µL of the cell suspension was added to the top of a 0.4-micron Millipore culture insert (Millipore, Temecula, CA) and placed in 1 mL cortical media (10% Ham’s F12, 20% FCS, 5% horse serum, 10 mM HEPES, 2 mM glutamine in Dulbecco’s modified Eagle’s medium [DMEM]) in a 6-well plate (NUNC, Roskilde, Denmark). The plate was then incubated at 37 °C with 5% CO2.
Preparation of GBM Hi-Spots
The tumor cell suspension was prepared by culturing the tumor cell lines in tissue culture flasks. Cells were trypsinized, washed with the cortical media, counted, and compacted by centrifugation. The resulting pellet of cells was resuspended in cortical media if possible to the same concentration as the nontumor cells to allow simple calculation of the cell ratios. The tumor cells were mixed with the brain cells at the ratio 5%:95% tumor cells to brain cells to 50 000 cells/µL. Then, 5 µL of the resultant cell suspension was added to the top of a 0.4-micron Millipore culture insert as for the brain Hi-Spots and placed in 1 mL cortical media in a 6-well plate. The plate was then incubated at 37 °C with 5% CO2. For ease of handling, cultures for electrophysiological readings and immunohistochemistry were grown on small pieces of sterile PTFE membrane (confetti) placed on top of the Millipore inserts.
Electrophysiological measurement
Hi-Spots on confetti were recorded on sterilized and disposable cartridges that included a multielectrode array (MEA) consisting of 40 gold electrodes (30 µm thick; Biocell Interface SA, Geneva, Switzerland). The MEA was built on a porous membrane between two chambers—the upper chamber allowed gas perfusion, and the lower perfusion chamber held standard artificial cerebrospinal fluid (ACSF; NaCl 124 mM, KCl 1.6 mM, NaHCO3 24 mM, KH2PO4 1.2 mM, glucose 10 mM, MgCl2 1.5 mM, CaCl2 2.5 mM). The chambers were inserted into a console unit, which allowed the temperature to be maintained at 33 °C. Of the 40 electrodes, any 8 could be selected for recording, and 2 electrodes were chosen for bipolar stimulation (200-µs bipolar stimulation). To characterize the synaptic response of neurons in the Hi-Spot, both evoked and spontaneous responses were obtained. Spontaneous recordings were obtained, using WINWCP software (downloaded from http://spider.science.strath.ac.uk/sipbs/page.php? Show=software_ses) for periods of not more than 5 min. Paired-pulse evoked field potentials were also recorded in response to stimulation of typically 2 to 3000 mV every 30 s, with a paired pulse interval of 20 ms.
Immunofluorescence and analysis of proliferation
Samples were collected either on glass cover slips for monolayer cultures or on confetti for 3D cultures, fixed in 4% paraformaldehyde, and washed 3 × 5 min with Tris-buffered saline (TBS)–Tween (0.001%). The Hi-Spots/cover slips were blocked for 30 min in 5% normal donkey serum followed by 3 × 5-min washes in TBS-Tween. The primary antibody was diluted in TBS-T, added to the Hi-Spot/cover slip, and incubated overnight at 4 °C. After 3 × 5-min washes in TBS-Tween, the relevant secondary antibody was added for 1 h at room temperature. The Hi-Spots/cover slips were washed 3 × 5 min in TBS-Tween and placed on slides with mounting fluid (Sigma). The slides were kept in the dark at 4 °C until imaged. The prepared slides were imaged on an Olympus 1 × 70 microscope (Olympus, Melville, NY) with a CARV confocal cell imaging system attached using the BD IPLab imaging software (BD Biosciences). Antibodies used were anti–glial fibrillary acidic protein (GFAP; Sigma), anti-β-tubulin isotype 111 (β-tubulin; Sigma), and anti–choline acetyltransferase (ChAT; Chemicon, Temecula, CA). 4′,6-Diamidino-2-phenylindole dihydrochloride was added to the second wash (DAPI; Sigma). Secondary antibodies were Alexa Fluor 488 or 568 conjugated secondary (Invitrogen, Carlsbad, CA) corresponding to the primary host animal.
For image analysis, fluorescent images were taken on a Leica DM1L microscope (Leica, Wetzlar, Germany) using Leica application suite software, and the images collected were analyzed using the BD IPLAB imaging software (BD Biosciences). For cellular proliferation measurement, eGFP image data were analyzed using GraphPad Prism5 software (GraphPad Software, La Jolla, CA). The error bars are the standard error of the mean (SEM). Twenty-four replicates were used for each experiment. Total fluorescence was calculated as the number of pixels above a set threshold, and the relative fluorescence was calculated by dividing the total fluorescence by the total fluorescence of the control cells on day 1.
pH determination
Three-day cultured Hi-Spots containing LN18 cells (non-eGFP labeled) were removed from the culture media and placed into wells containing sterile Hank’s buffered salt solution (HBSS). After an initial wash of 15 min, the inserts were moved to wells containing HBSS and 1 µL of 10 mM 2′,7′-bis-(2-carboxyethyl)-5-(and-6)-carboxyfluorescein (BCECF acid) mixed isomers (Invitrogen). The cultures were incubated for 30 min at 37 °C and then washed twice in HBSS prior to imaging on an Olympus 1 × 70 microscope with a CARV confocal cell imaging system attached using the BD IPLab imaging software using 525-nm and 610-nm emission wavelengths.
Results
Establishment of brain Hi-Spots
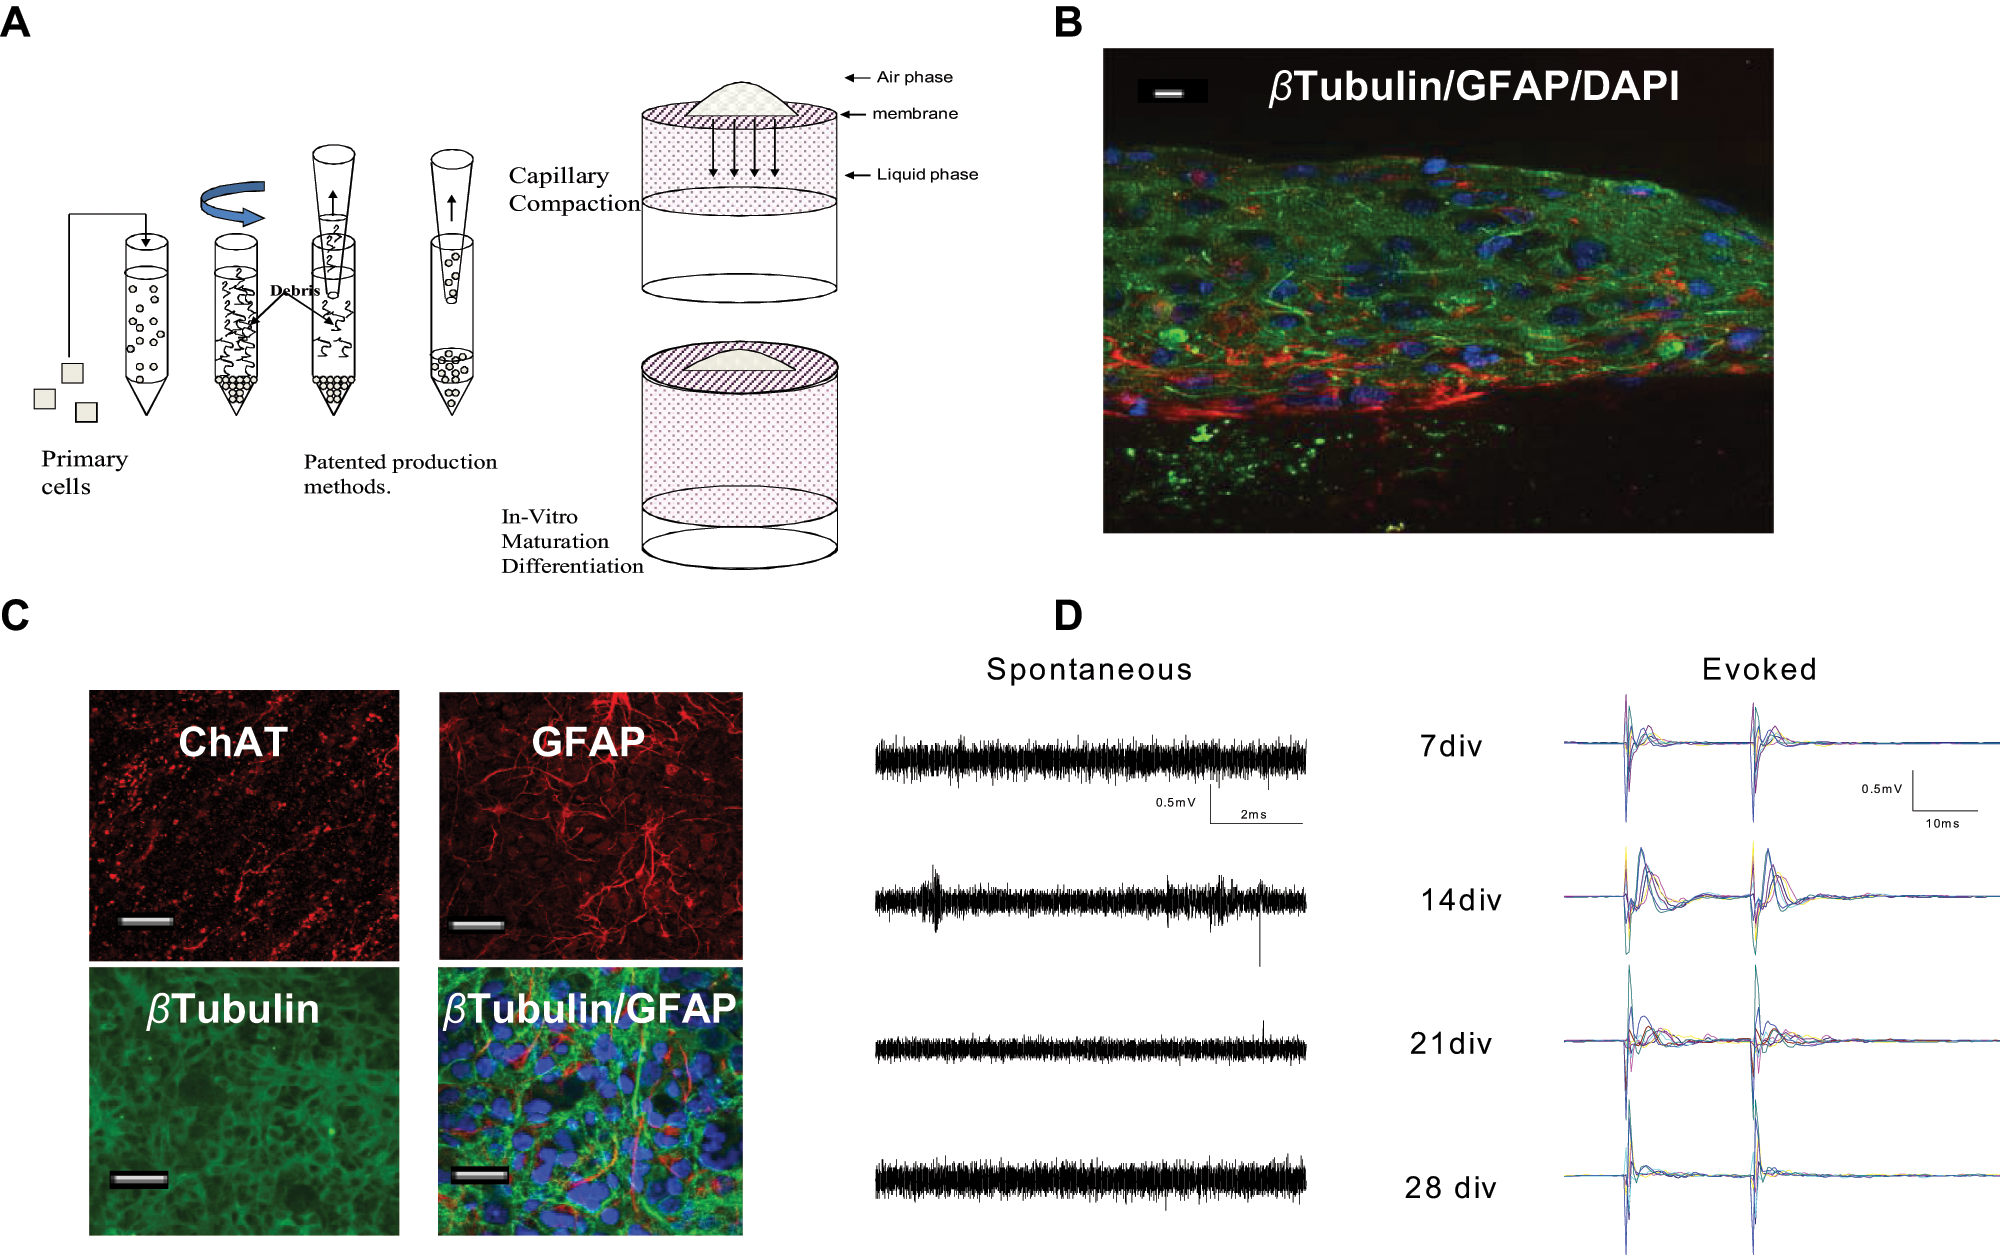
We have expanded the use of the air–liquid interphase-based method originally used with embryonic stem cells to easily accessible cells such as rat brain cells. In this system, dissociated rat brain cortices are allowed to reaggregate on a semiporous membrane at an air–liquid interface (brain Hi-Spot; Fig. 1A ). A detailed characterization and description of the method used to generate brain Hi-Spots have been published recently.12,13 Briefly, freshly dissociated brain cells from rat embryos were plated on hydrophilic PFTE membranes placed on media and allowed to mature for 20 days. A transverse section of the cell masses obtained was processed for immunofluorescence using markers for neurons (β-tubulin) and astrocytes (GFAP). As shown in Figure 1B , the staining revealed that both neurons and astrocytes were present in such 3D cultures and that their physiological architecture was preserved. Cholinergic neurons and nerve terminals were subsequently visualized using an antibody directed against ChAT ( Fig. 1C ). As expected, ChAT staining was distributed throughout the whole-brain Hi-Spot with specific enrichment in the nerve terminals. The presence of mature neurons establishing connection was further investigated by measurement of electrophysiological parameters. Up to 4 weeks after brain Hi-Spot seeding, spontaneous and evoked electrical activity could be observed with an optimal activity 14 days after the start of the experiment ( Fig. 1D ). The propagation of such electrical signals is typical of a group of interconnected neurons.
Characterization of Hi-Spots. (
Glioblastoma/brain Hi-Spots
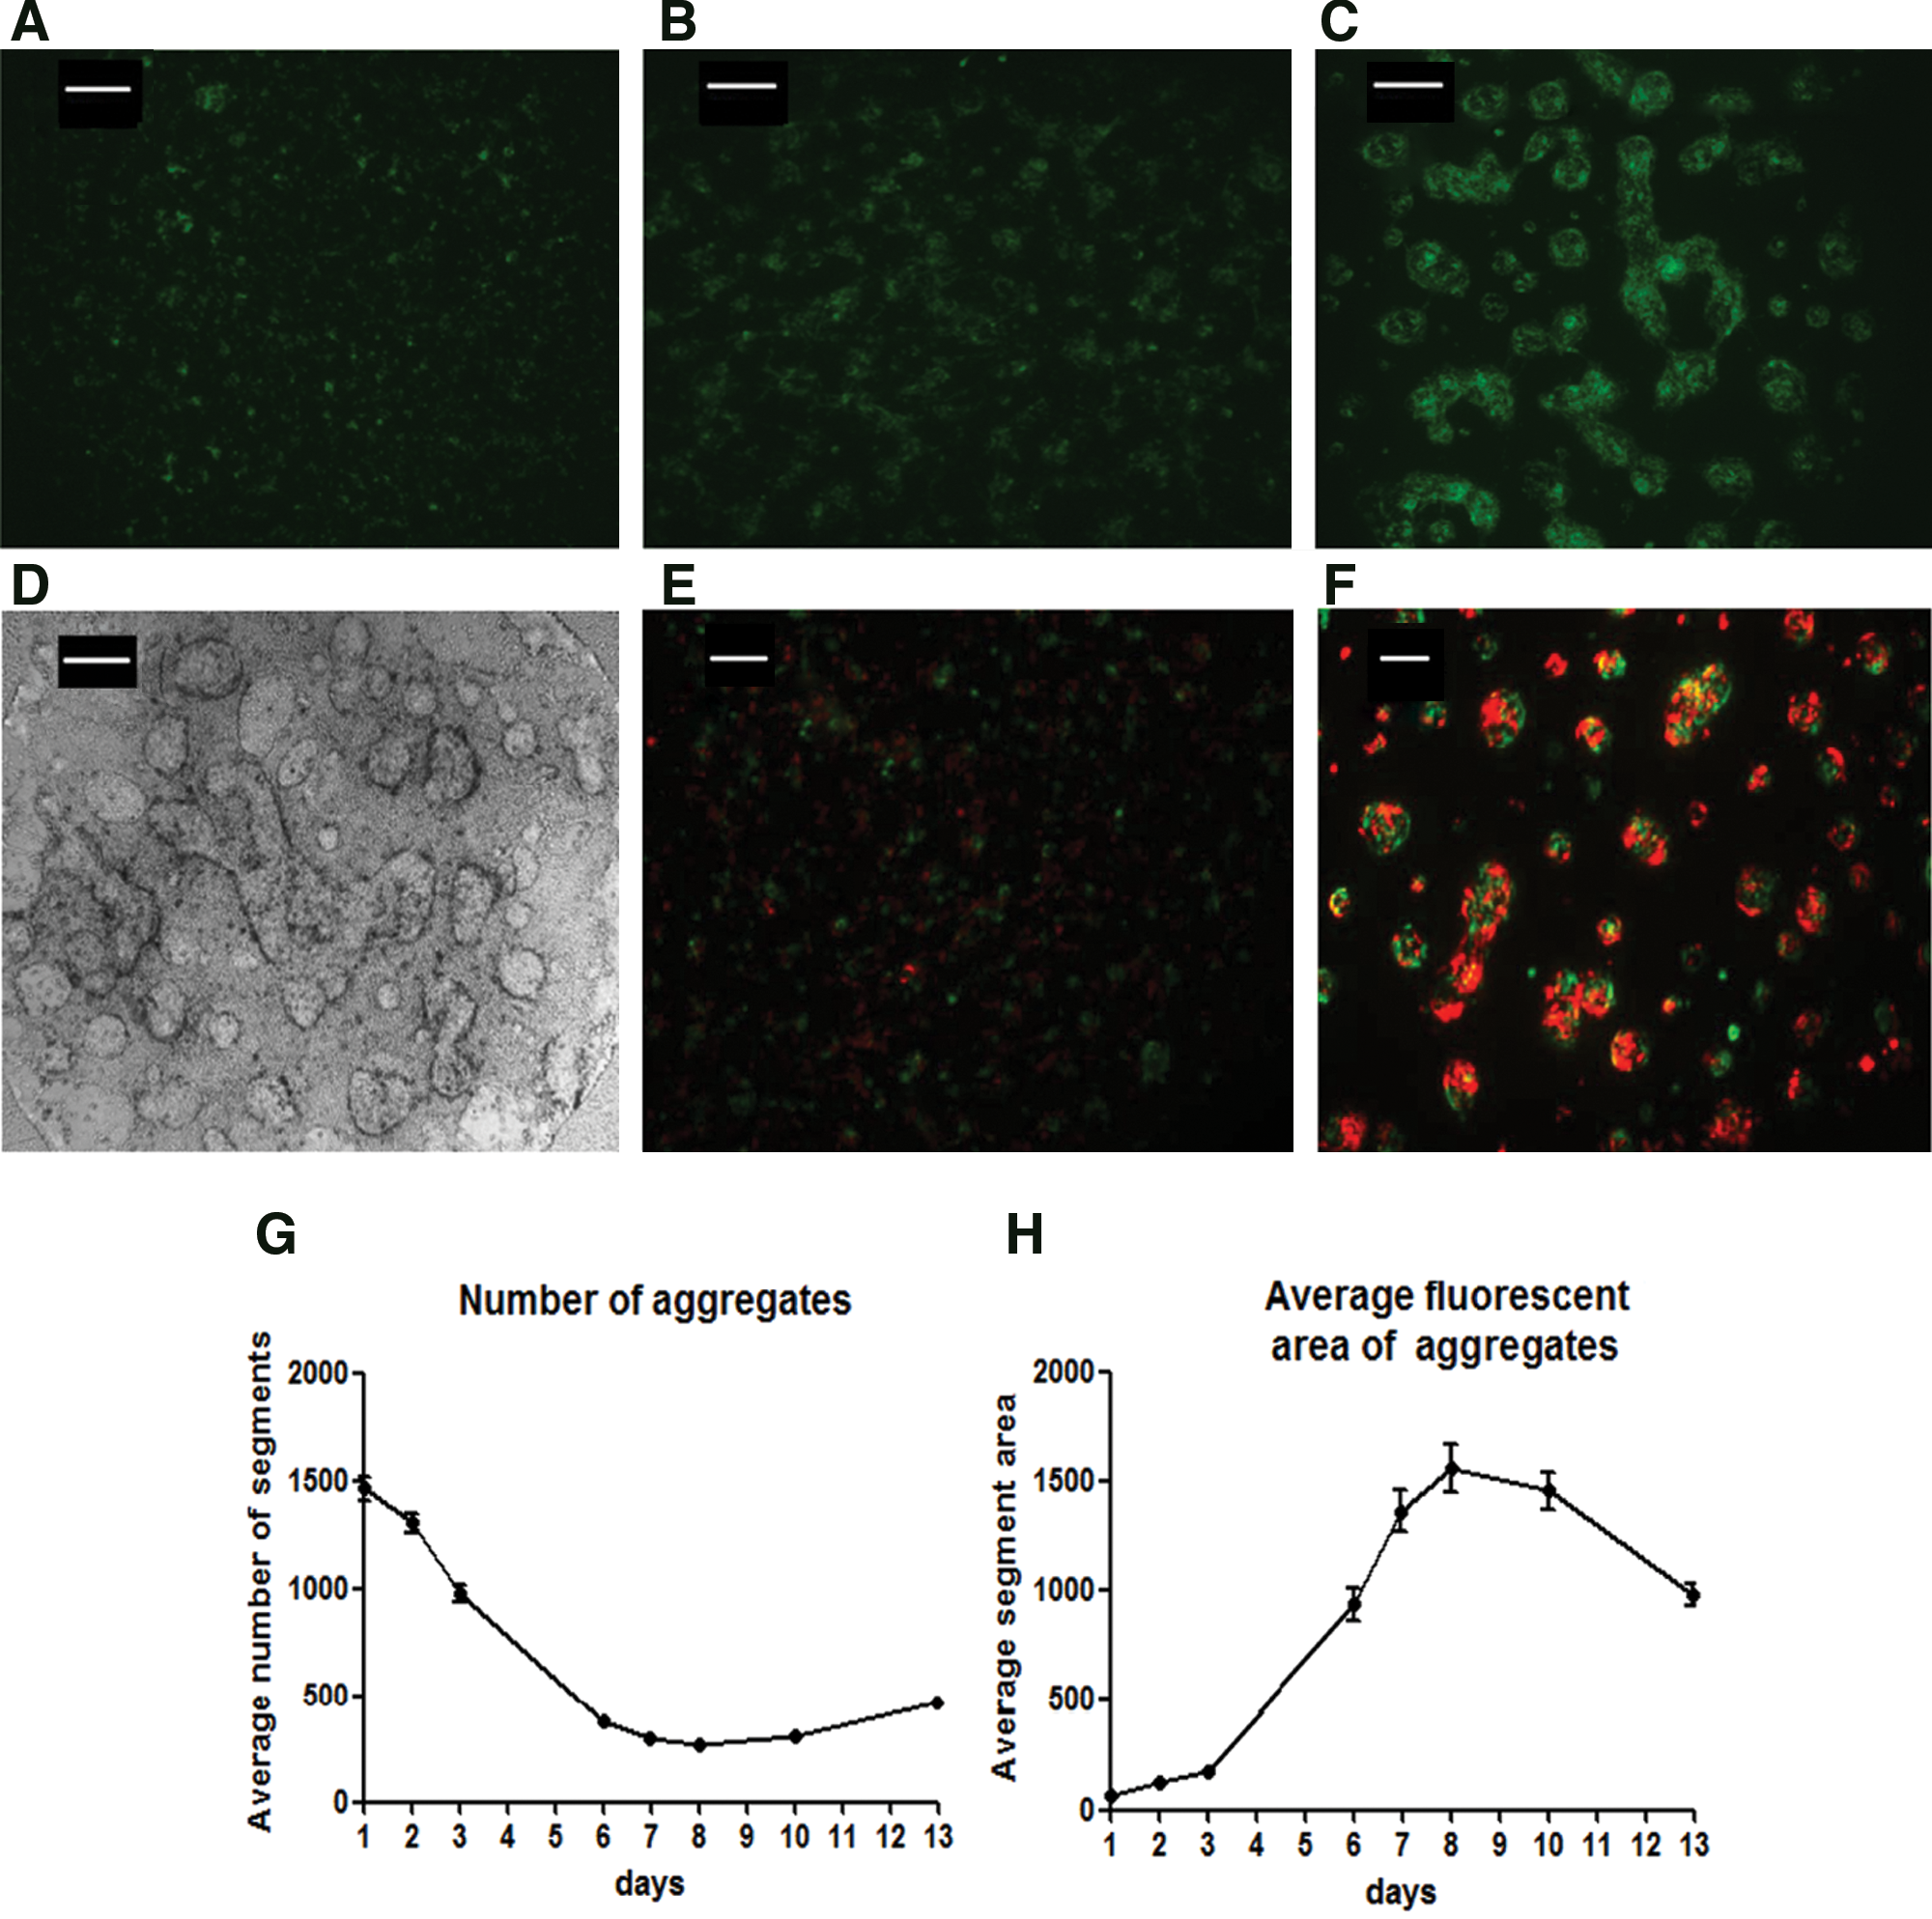
Having established that brain Hi-Spots retain characteristics of brain tissues (see Hirschhaeuser et al. 13 and this article), we investigated the behavior of a glioblastoma-derived cell line in this environment. LN18 cells stably transfected with a vector encoding the eGFP protein were allowed to grow within the rat brain Hi-Spot for 14 days (GBM/brain Hi-Spot). One day after seeding, individual LN18–eGFP cells could be observed spread throughout the Hi-Spot ( Fig. 2A ). Three days later, the number of eGFP-positive foci decreased, whereas the size of the foci (“cell aggregates”) increased ( Fig. 2B ). At day 7 after seeding, the number of eGFP-positive foci only slightly diminished, whereas foci still expanded in size ( Fig. 2C and phase contrast picture, Fig. 2D ). The foci size reached a maximum at day 8. Fourteen days after incorporation, the cells were still aggregated. This group of tumor cells did not appear to grow further but rather remained stable for an additional week. The aggregates have been observed to be present at least 25 days after seeding (data not shown).
Glioblastoma-derived cells in Hi-Spots (GBM/brain Hi-Spots). (
To address whether the increased size of eGFP-positive cell foci reflects clustering of tumor cells or clonal expansion of single cells, we mixed LN18 red fluorescent protein (RFP)–expressing cells together with LN18-eGFP-expressing cells in Hi-Spots. Twenty-four hours after being incorporated into the Hi-Spots, the cells appear as a homogeneous mixture of green and red cells ( Fig. 2E ). As early as 48 h after incorporation, some cell clusters started to be formed (not shown). Four days after incorporation, cells clearly formed aggregates of mixed red and green cells ( Fig. 2F ). The fact that the red and green cells co-localize demonstrates an active clustering of tumor cells rather than just a clonal expansion of single tumor cells.
Cell aggregates could be quantified by measuring their number ( Fig. 2G ) and their area ( Fig. 2H ). Number of aggregates gradually decreased during the first 7 days and then remained stable, reflecting the self-aggregation of the tumor cells in the first week. Inversely, the size of the aggregates slightly increased during the first 3 days and then strongly increased up to day 8, suggesting an initial stage where mainly self-aggregation occurred followed by a cell proliferation and aggregation stage.
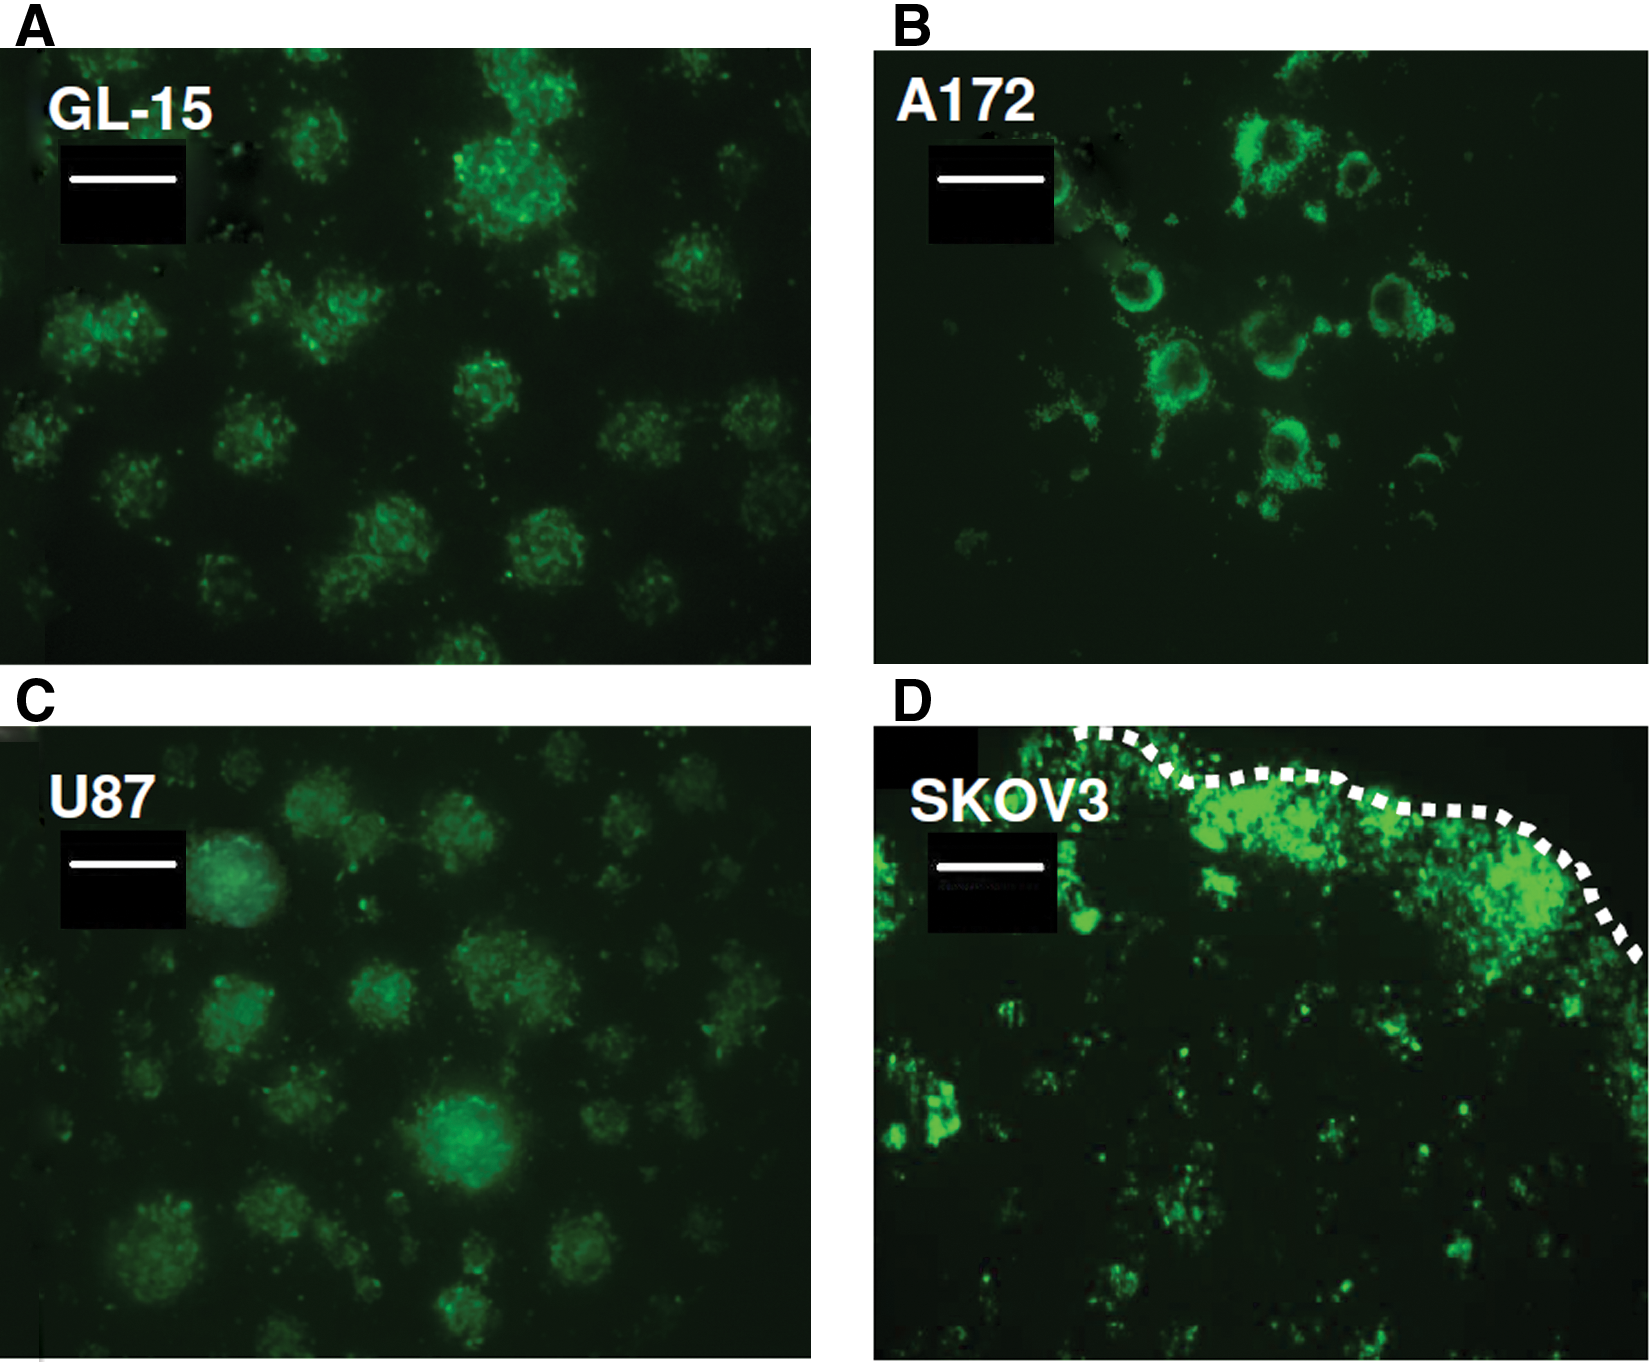
We also determined whether other glioblastoma-derived cell lines could be used to generate GBM/brain Hi-Spots. Three glioblastoma-derived cell lines—GL15, A172, and U87—were eGFP labeled and mixed with brain Hi-Spot for 7 days. As indicated by the eGFP signal, all brain-derived tumor cell lines grew and formed clusters of tumor cells within the brain Hi-Spots ( Fig. 3A – C ) in a very similar way as LN18 cells. In contrast, when an ovarian tumor–derived cell line (SKOV3) was mixed with the rat brain cells, the ovarian tumor cells migrated toward the edge of the Hi-Spot and grew but formed only small and not well-aggregated clusters ( Fig. 3D and data not shown).
Glioblastoma (GBM)–derived cell lines grow in brain Hi-Spots, whereas an ovarian tumor–derived cell line does not. Enhanced green fluorescent protein (eGFP)–labeled GL-15 (
Features of GBM/brain Hi-Spots
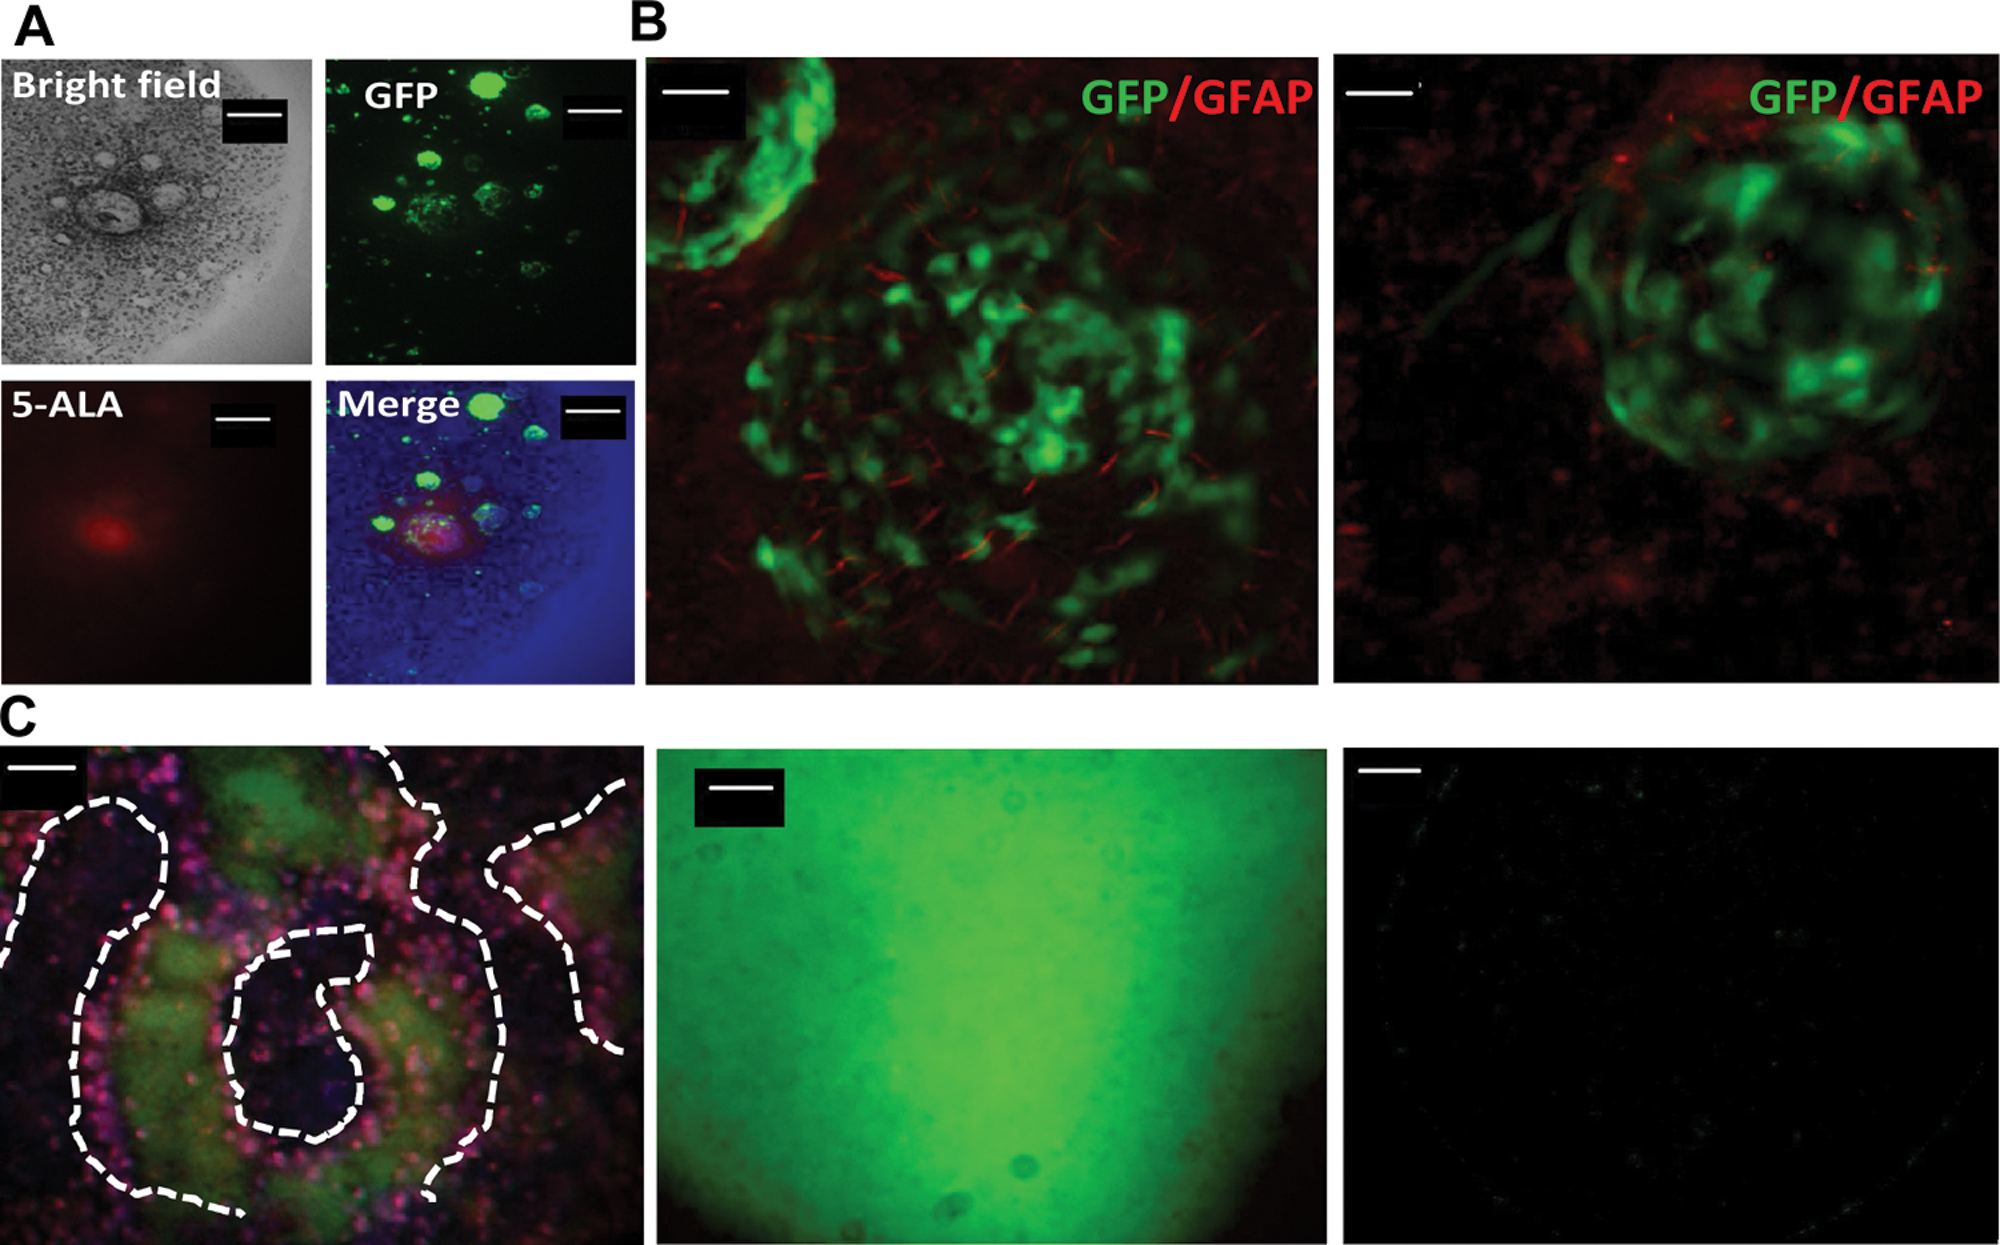
We wished to further characterize the glioblastoma cells growing in the brain Hi-Spots. 5-Aminolevulinic acid (5-ALA), a precursor of synthesis of fluorescent porphyrins in epithelia and neoplastic tissues, can be used to visualize tumorous tissue during neurosurgical procedures. 14 Studies have shown that the intraoperative use of this guiding method may reduce the tumor residual volume and prolong progression-free survival in patients suffering from brain tumors. 14 We have incubated GBM/brain Hi-Spots with 5-ALA to see whether, as in human tumors, it could specifically be converted to fluorescent porphyrins in the tumor cells. As shown in Figure 4A , a strong specific fluorescent staining (in red) could be observed in LN18–eGFP clusters of more than 100 µm in diameter. These big clusters contain both tumors cells and stroma cells and therefore have a slightly weaker GFP intensity than compact small clusters. The small tumor cell clusters (<100 µm) were only weakly stained in red, and sparse cells remained negative. Another distinctive feature of GBM is the presence of reactive astrogliosis surrounding brain tumors.15–17 To determine whether GBM/brain Hi-Spots could recapitulate this feature of human tumors, expression of GFAP, a marker of activated astrocytes, was assessed in the GBM/brain Hi-Spots. An increased GFAP staining could be observed specifically around and within the tumor cell mass ( Fig. 4B , red staining), suggesting that astrocytes in close contact to tumor cells are activated.
Characterization of glioblastoma (GBM)/brain Hi-Spots. (
The tissue at the margin of malignant glioma tissue is metabolically extremely active and produces high levels of lactate, 18 which results in acidification of the extracellular space of normal tissue around the tumor edge. 19 To check whether this trait is conserved in GBM/brain Hi-Spots, non-eGFP-expressing LN18 cells were used to generate GBM/brain Hi-Spots. Three days later, they were loaded with BCECF acid, a dye whose fluorescence emission is pH sensitive. When excited at 514 nm, its emission maximum is at 630 nm in a basic environment (green staining) and at 570 nm when the environment is acidic (red staining). As shown in Figure 4C , a strong acidic pH (red staining) could be detected around the nonlabeled tumor cells, whereas the totality of the brain Hi-Spot was basic (green staining). In the absence of LN18 cells, no acidic pH could be detected in the brain Hi-Spots ( Fig. 4C , middle panel), which stained entirely green. LN18 plated alone only weakly stained green ( Fig. 4C , right panel). Thus, LN18 cells acidify their close environment when grown in brain Hi-Spots. Altogether, these data suggest that the GBM/brain Hi-Spot recapitulates important features of glioblastoma.
GBM/brain Hi-Spot for compound testing
We determined whether GBM/brain Hi-Spots could be used to profile compounds. The standard of care for glioblastoma consists of temozolomide (TMZ) chemotherapy during and after radiotherapy. We thus decided to test this compound and to compare its effect on LN18 cells growing in standard 2D culture. Growth of tumor cells was monitored over 14 treatment days by quantifying the average fluorescence per Hi-Spot. As shown in Figure 5A , the increasing fluorescence signal of nontreated LN18–eGFP/brain Hi-Spots (green line) was linear during their first 3 days postseeding and reached a plateau at day 8. Treatment with increasing doses of TMZ resulted in a dose-dependent inhibition of cell proliferation. Six days of treatment with 5 or 10 µM TMZ resulted in a decrease of the fluorescence intensity, suggesting tumor cell death, and 1 µM TMZ was ineffective for LN18–eGFP/brain Hi-Spots. When a similar treatment regimen was applied on 2D cultures of LN18–eGFP cells, no or only minor inhibition cell proliferation or tumor cell death could be observed ( Fig. 5B ). We next tested two compounds that are known to inhibit proliferation of glioblastoma cell lines in 2D cultures but have failed in clinical trials in this indication: cytosine arabinoside (Ara-C) and taxol.20–22 As shown in Figure 5D , F , both compounds showed antiproliferative activity in 2D cultures (growth inhibition and cell killing around 20 nM for taxol and 200 nM for Ara-C). When used on GBM/brain Hi-Spots, 1 µM of Ara-C was required to reduce tumor cell proliferation, a dose 10 times higher than the dose necessary in 2D cultures. Cell killing was seen at a dose of 10 µM compared to 200 nM at 2D ( Fig. 5C ). Taxol was also less effective in GBM/brain Hi-Spots in comparison to 2D cultures: 25 nM of taxol only reduced proliferation in Hi-Spots, but it led to tumor cell death in conventional 2D cultures ( Fig. 5E ).
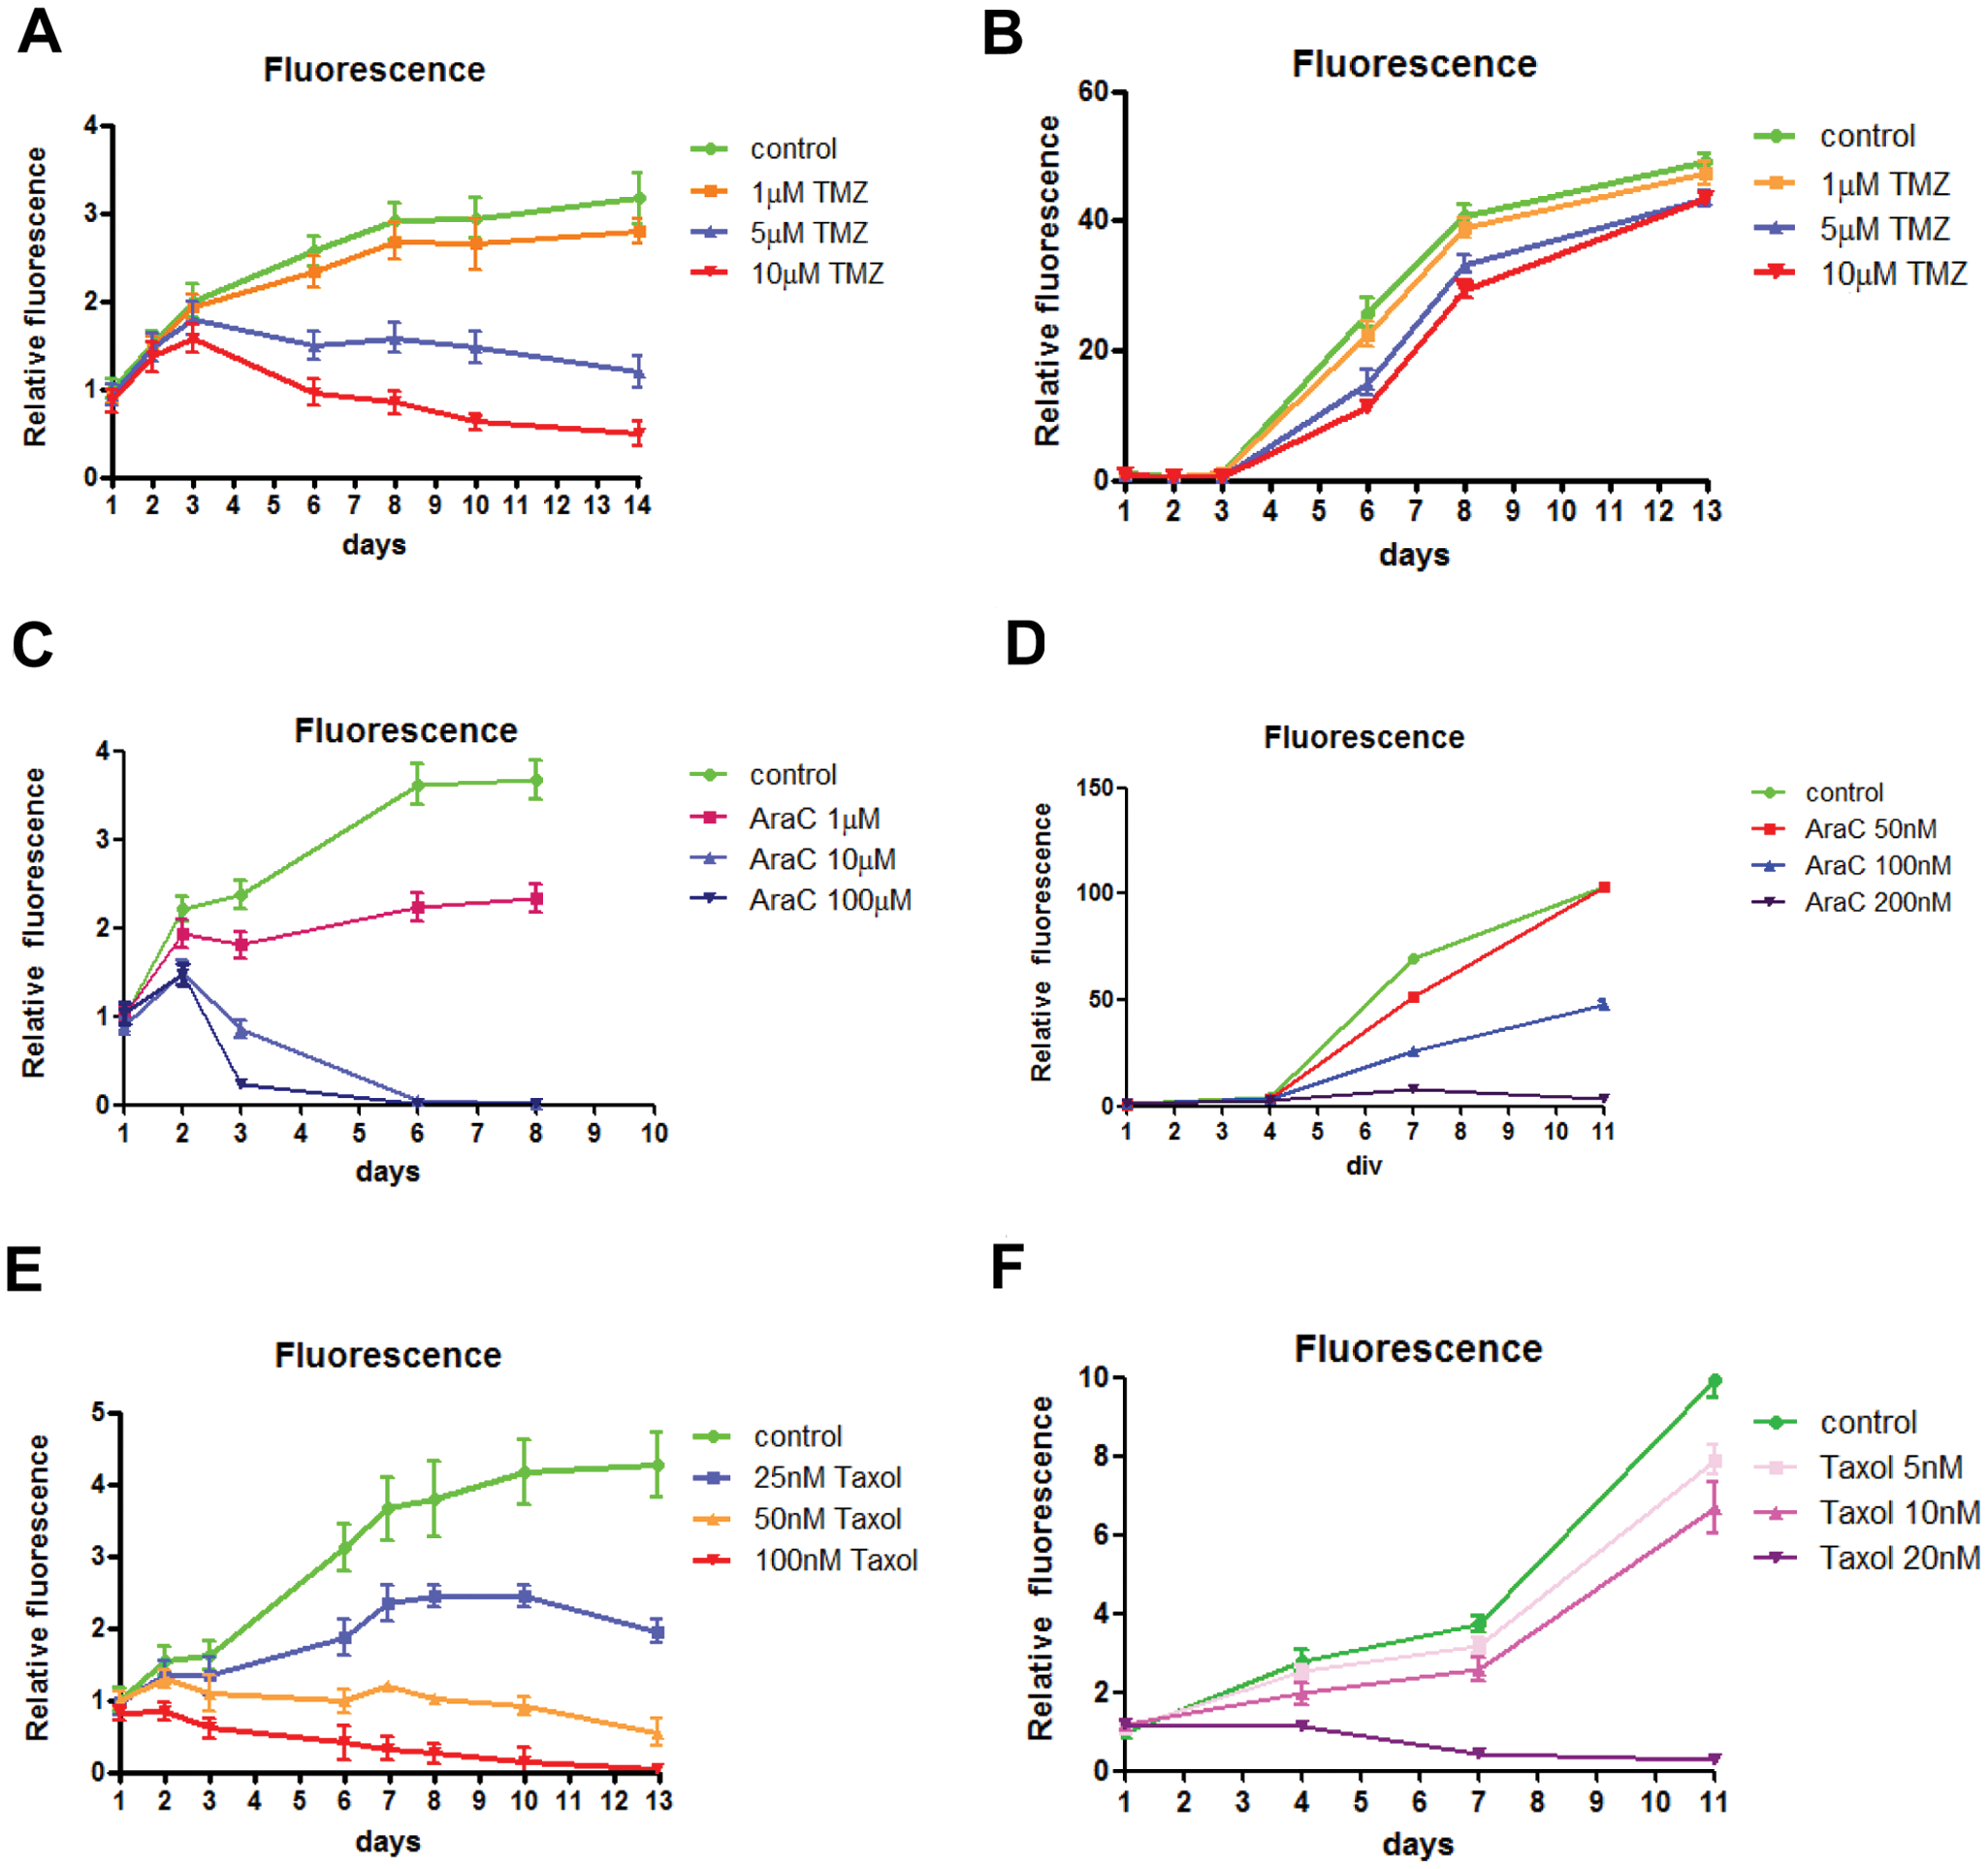
Activity of antiproliferative compounds on LN18 cells growing in brain Hi-Spots or in conventional 2D culture. LN18 cells cultured in Hi-Spots show a dose-responsive decrease in growth when treated with 1, 5, and 10 µM temozolomide (TMZ) from day 1 (
Similar measurements were then performed with three other glioblastoma cell lines (A172, U87, and GL15) growing in 2D or in brain Hi-Spots and treated with taxol or TMZ ( Fig. 6 ; GL15 not shown). Again, although taxol was highly potent against the glioblastoma cell lines growing in 2D cultures (growth inhibition and cell killing at 20 nM; Fig. 6B , F ), similar doses of taxol only inhibited cell proliferation of GBM in brain Hi-Spots, and concentrations of 100 nM were required to kill cells ( Fig. 6A , E ). Identical results were obtained for taxol with GL15 cells (data not shown). TMZ treatment led to growth inhibition of A172 and U87 glioblastoma cell lines in brain Hi-Spots already at 1 µM, and cell killing was achieved at doses of 10 µM ( Fig. 6C , G ). In contrast, 12 µM TMZ only inhibited proliferation in 2D cultures. The GL15 cell line was resistant to TMZ (highest dose tested 50 µM) in 2D cultures and in 3D cultures (highest dose tested 10 µM). In conclusion, a decrease of activity of taxol and Ara-C and an increased activity of TMZ, with the exception of TMZ-resistant GL15 cells, are observed in glioblastoma cell lines tested in Hi-Spots as compared to 2D conventional cultures.
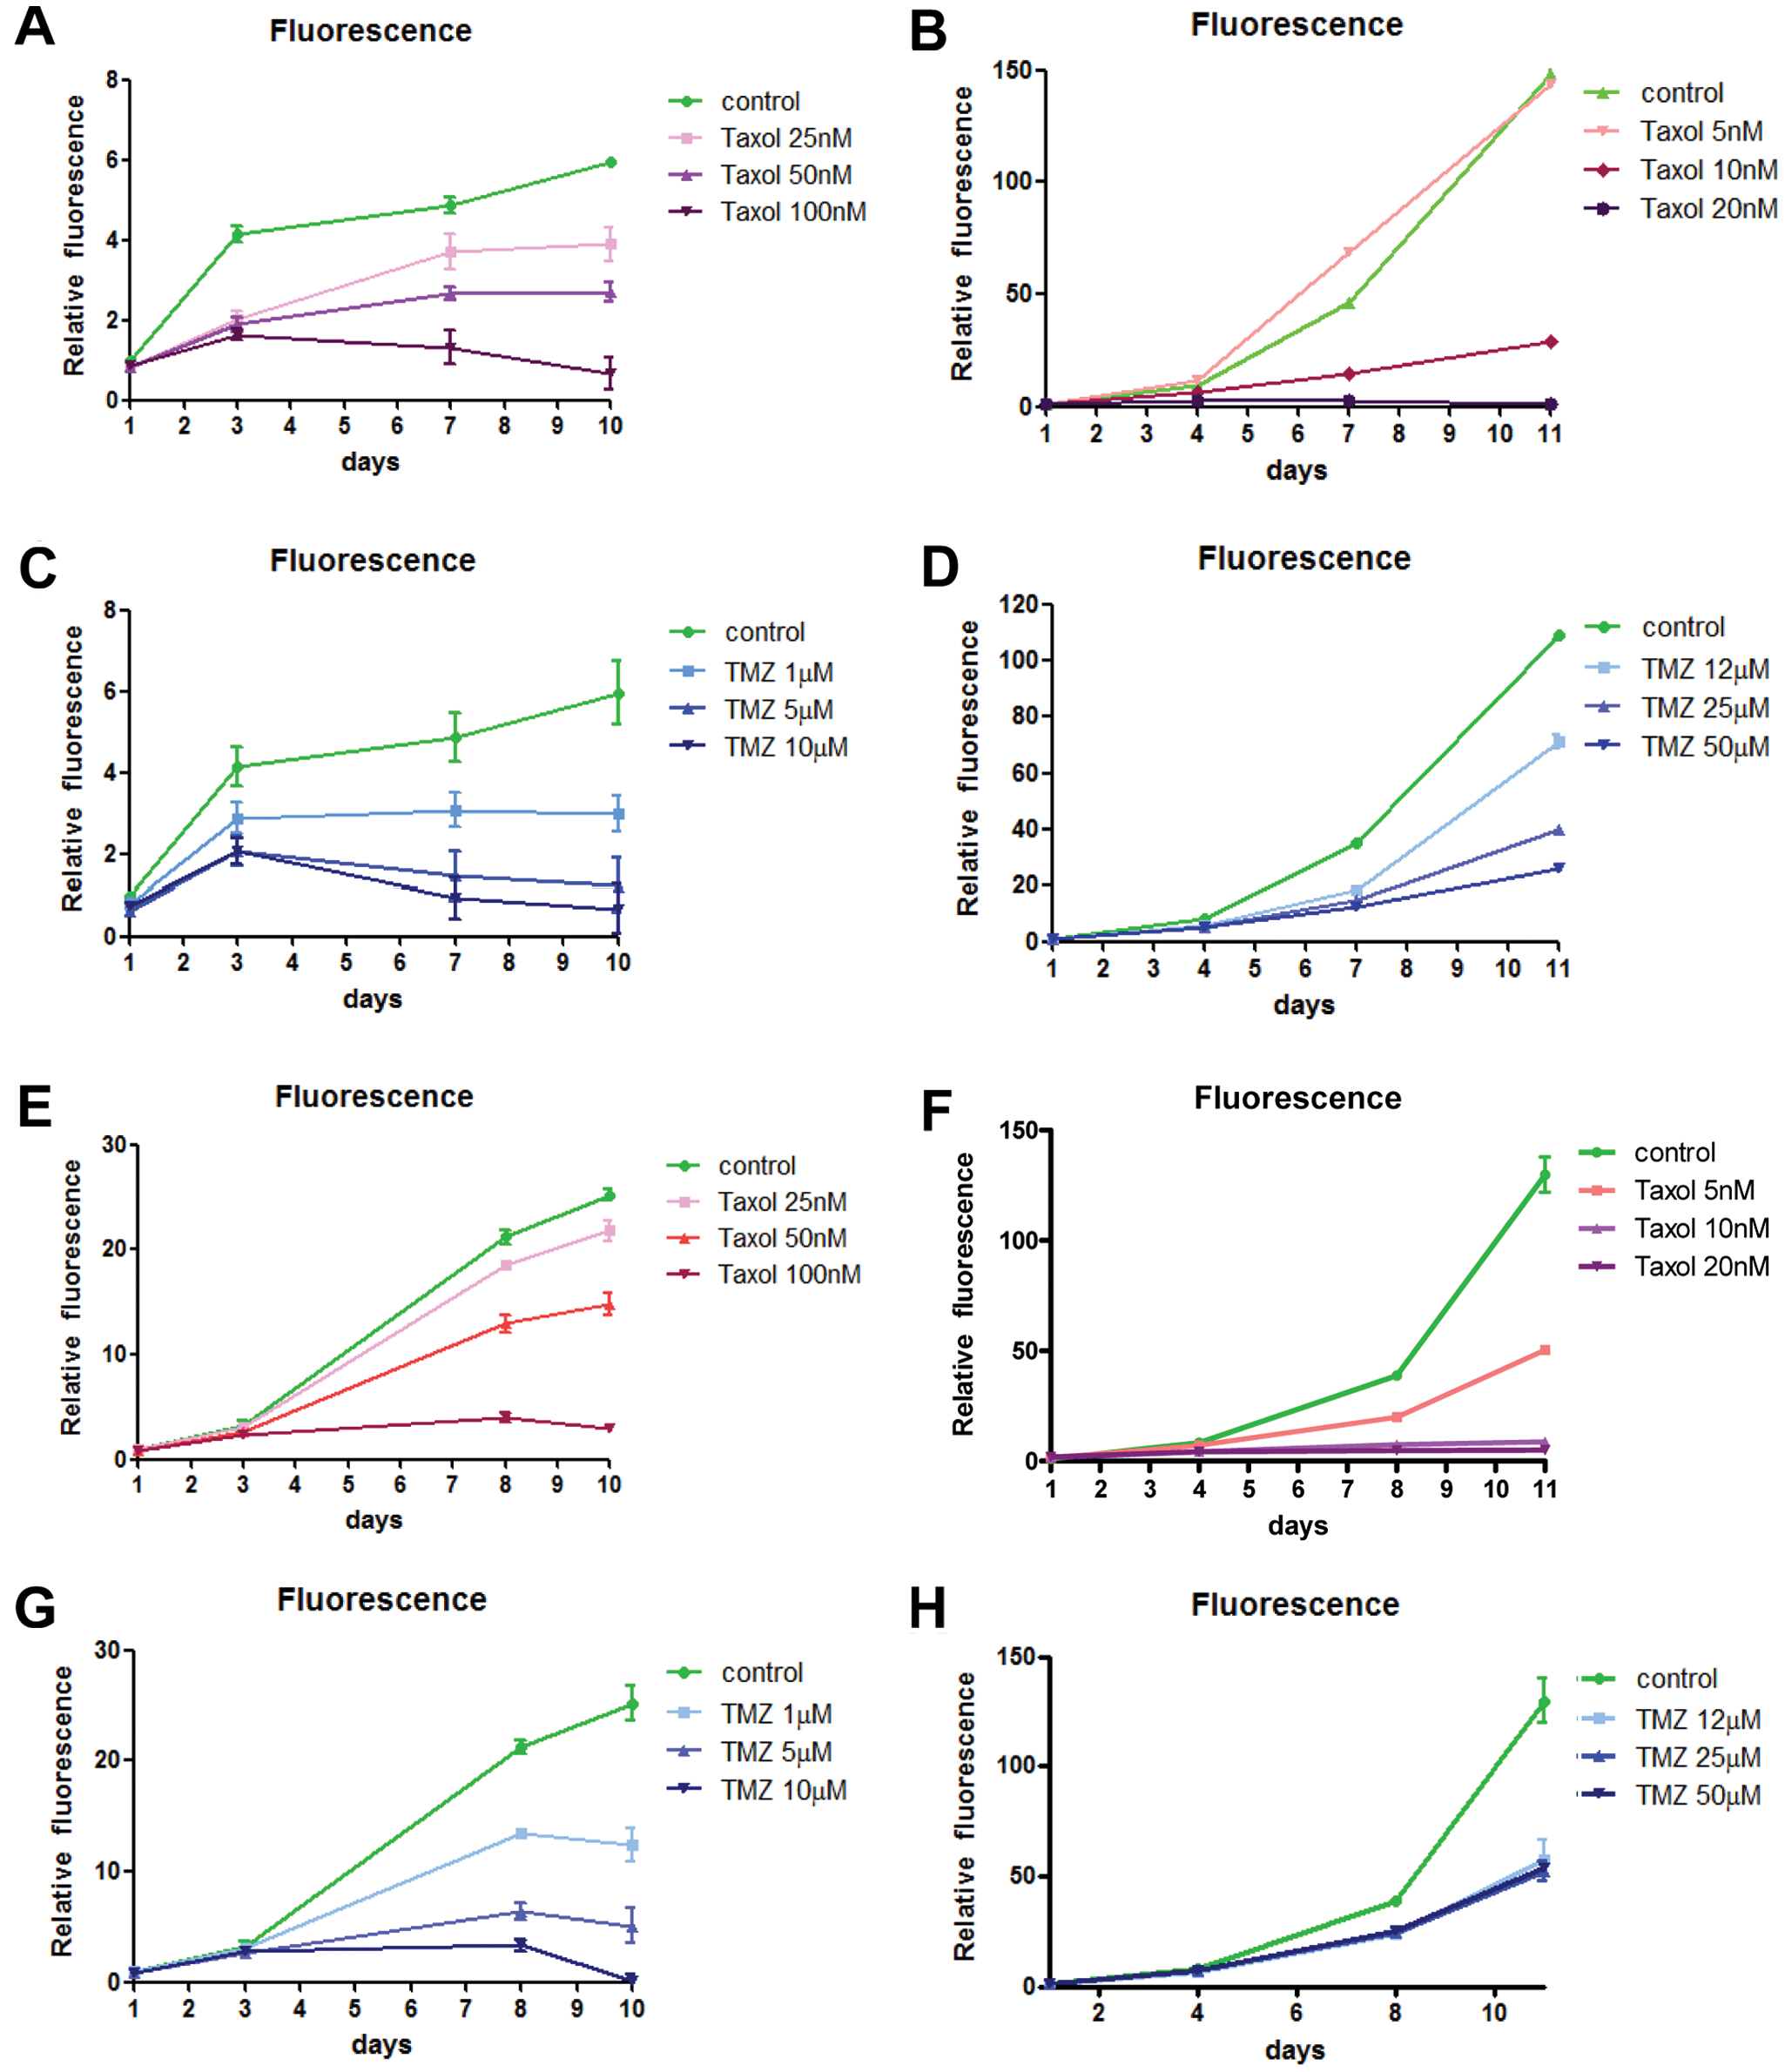
Activity of taxol and temozolomide (TMZ) on A172 or U87 cells growing in brain Hi-Spots or in conventional 2D cultures. A172 cells (
GBM regression in brain Hi-Spots
Chemotherapies are given to patients with established tumors.20–22 To investigate whether taxol and TMZ can cause tumor regression on established glioblastoma growing in brain Hi-Spots, we started treatments either at the time of GBM/brain Hi-Spot seeding (as above) or 3 days later, when tumor cell clusters are already present ( Fig. 7 ). As observed previously, when taxol or TMZ treatment was started at the beginning of the experiment, growth rate of the tumor cells was reduced with 25 nM taxol or 5 µM TMZ ( Fig. 7A , B ). However, when taxol or TMZ treatment was started 3 days after GBM/brain Hi-Spot seeding, when large tumor cell clusters are already formed, 25 nM taxol or up to 10 µM TMZ had only a minor effect on the fluorescence intensity ( Fig. 7C , D ). At higher concentrations of taxol (50 nM and 100 nM), a decreased fluorescence was observed (compare the relative fluorescence at days 3 and 13 in Fig. 7C ).
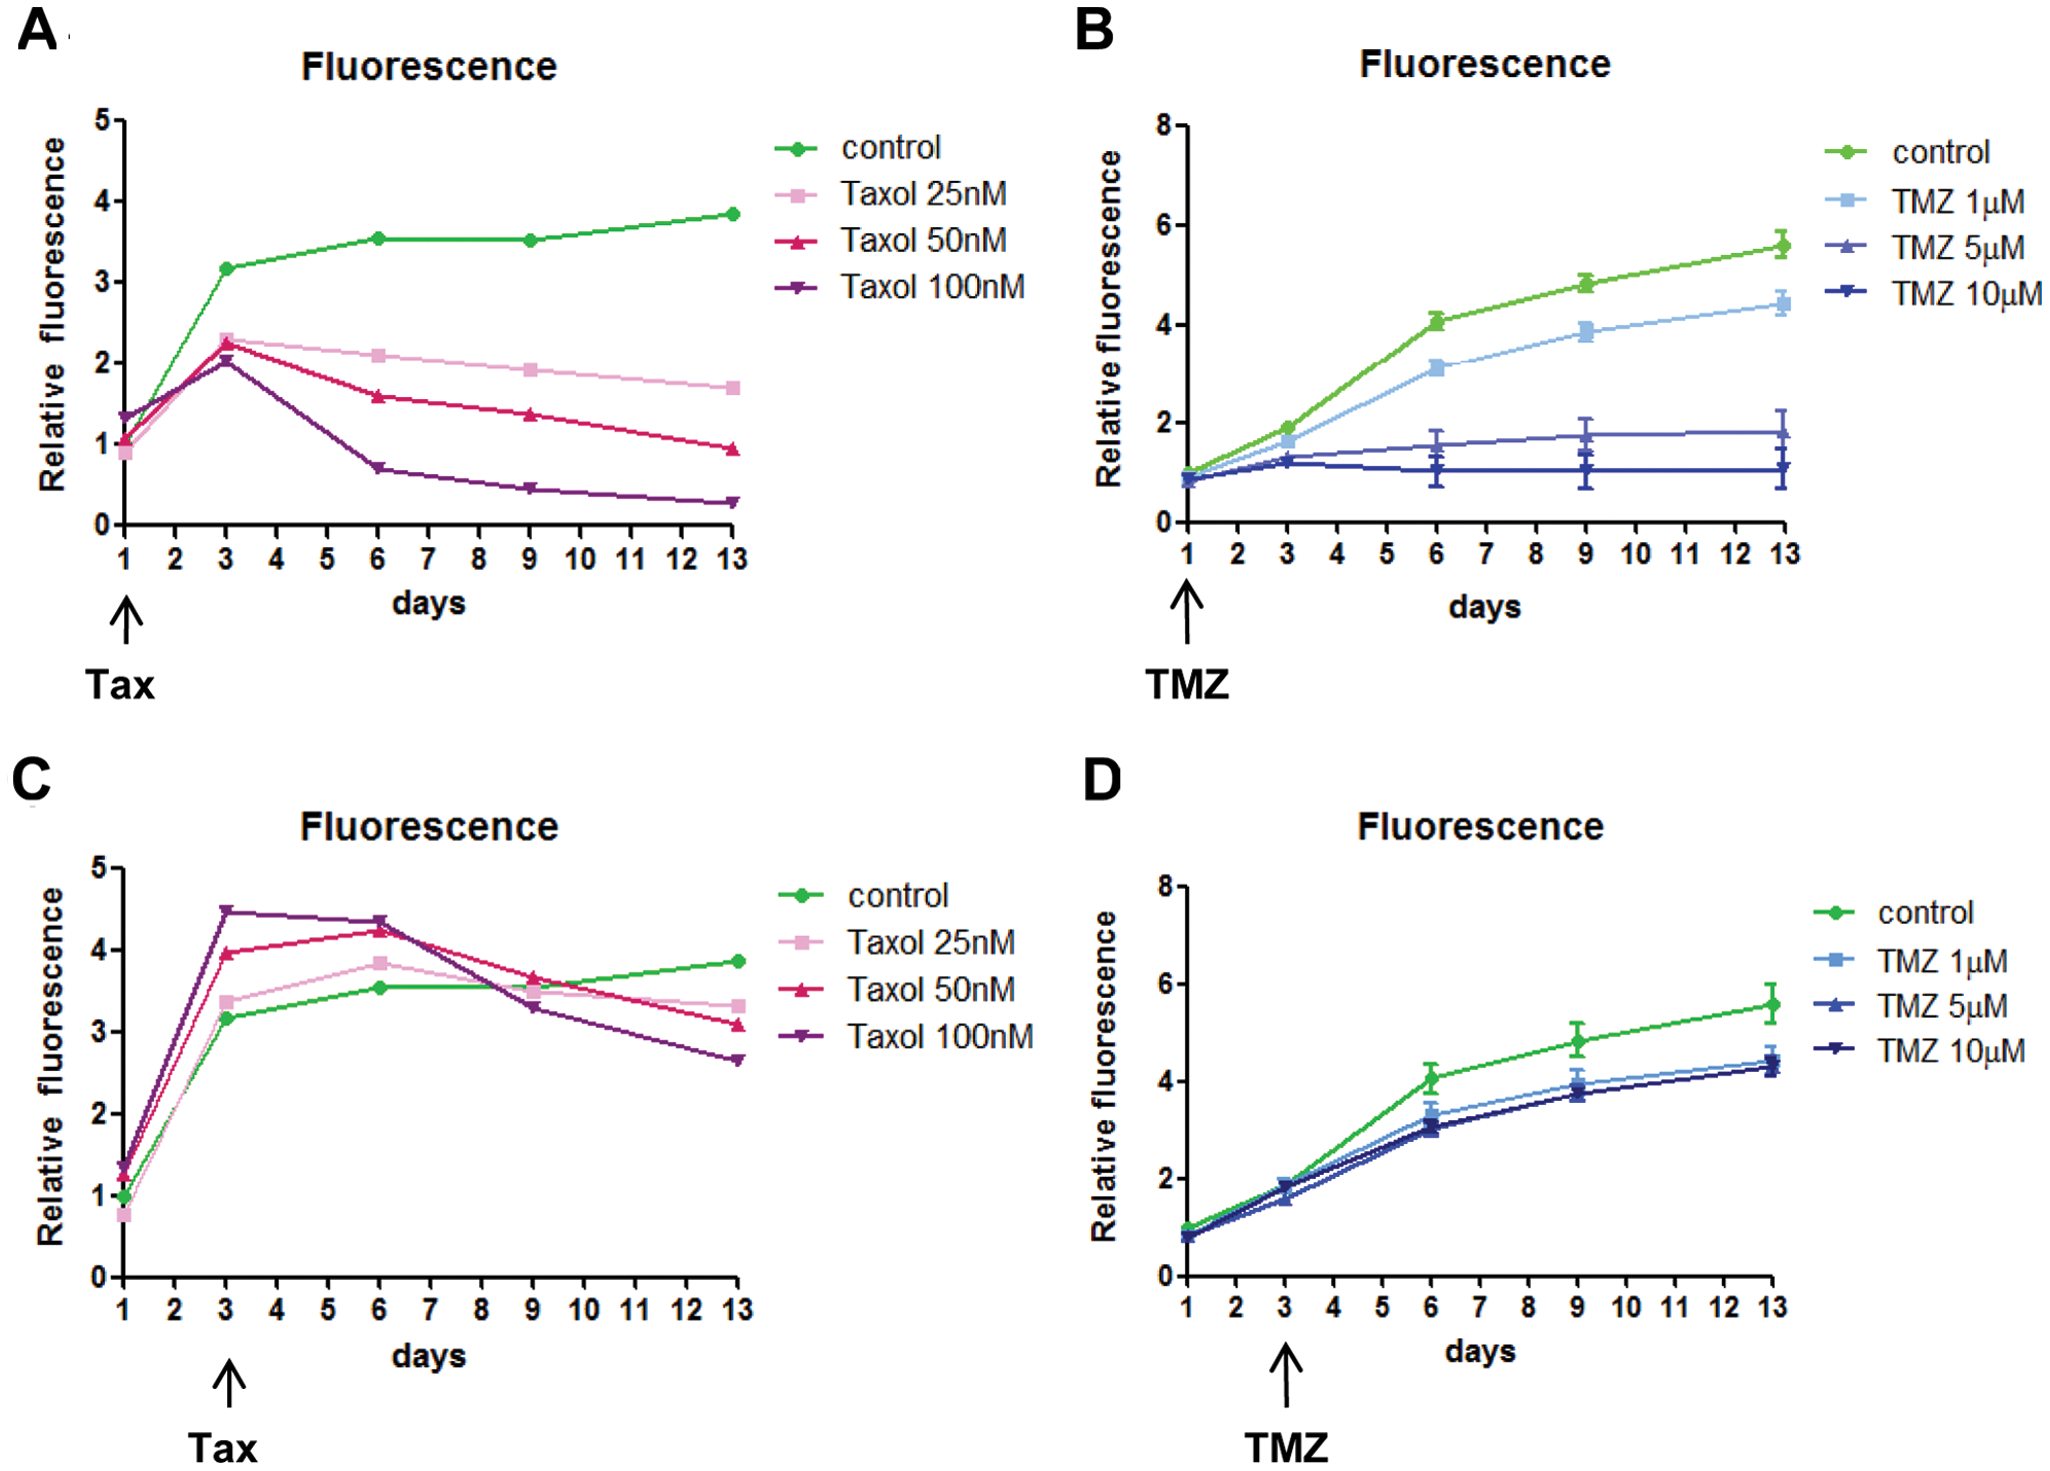
Activity of taxol and temozolomide (TMZ) on established glioblastoma (GBM) (LN18)/brain Hi-Spots. Taxol (Tax) and TMZ treatments were done either at cell seeding (
Discussion
In this study, we describe ex vivo organotypic cultures of brain tissue and their use for glioblastoma cultures and compound profiling. Brain Hi-Spots were obtained using an air–liquid interface culture originally developed for organotypic cultures of brain slices and of embryonic stem cell–derived neural progenitor cells.12,23 Many features of brain slice cultures such as presence of activated astrocytes, a dense network of neurons, cholinergic neurons, and the ability to propagate signals were retained in brain Hi-Spots. We have used these Hi-Spots to grow glioblastoma-derived tumor cells to conserve the glioblastoma–brain interaction.
Glioblastoma cells self-aggregate in brain Hi-Spots during the first 3 days in culture before starting to proliferate. This behavior has already been described in another 3D co-culture system where prostate cancer cells were mixed with fibroblasts. 24 The mechanisms underlying the self-aggregation of the tumor cells remain to be investigated. All glioblastoma cell lines growing in brain Hi-Spots displayed features of clinical glioblastomas: Tumor cells were surrounded by activated astrocytes, generated an acidic environment, and exerted 5-Ala uptake and conversion into fluorescent porphyrins, indicating an active metabolism. Of note, only clusters of tumor cells exceeding 100-µm diameters were clearly fluorescent after labeling with 5-Ala, suggesting that the use of this guiding method for intraoperative detection of gliomas might not allow detection of small aggregates of tumor cells. Interestingly, a tumor cell line derived from an ovarian cancer did not form tumor-like aggregates in brain Hi-Spots. Whether tumor cells derived from other organs display the same incapability to aggregate in brain Hi-Spots remains to be tested.
Most 3D co-culturing techniques performed so far have involved mixing tumor cells with fibroblasts in spheroids (reviewed in Hirschhaeuser et al. 13 ). In contrast to the GBM/brain Hi-Spots, in these systems, the complexity of the tumor microenvironment is poorly preserved, and most tumor cell–stroma interactions are missing. Therefore, these models are not systematically used to profile chemotherapeutic agents. A more promising approach is the culture of ex vivo tissue slices. The main advantage of this approach is the ability to maintain organ and tumor architecture, thus preserving the integrity of the tumor–stroma interaction. However, this method requires access to tumor tissue samples immediately after surgery, precluding large-scale profiling of chemotherapeutics. 11
Organotypic brain slice assays have also been used to culture brain tumor–derived tissue or cells.25,26 This assay is particularly useful to study the invasiveness of tumor tissue but lacks the necessary throughput for drug screening. We show the utility of our technology in predicting glioblastoma sensitivity to drugs before pharmacological in vivo tests: We could demonstrate that GBM-derived cells grown in brain Hi-Spots are much less sensitive to taxol and Ara-C than when grown in conventional 2D cultures. The weak growth inhibitory effect of taxol observed in GBM/brain Hi-Spots could be explained by the higher tumor cell density and the spatial arrangement of tumor and stromal tissues.27,28 Accordingly, no objective response in patients suffering from malignant gliomas treated with taxol has been observed in a clinical trial. 20 A similar lack of efficacy in GBM/brain Hi-Spots is found with Ara-C, another chemotherapeutic that did not show any efficacy in clinical trials.21,22 Thus, although glioblastoma-derived cell lines growing in 2D culture are very sensitive to taxol and Ara-C, they become resistant when grown in brain Hi-Spots. These observations show that interactions of tumor cells with their environment condition their growth and their resistance to chemotherapeutics. In contrast, an increased sensitivity to TMZ is observed in GBM/brain Hi-Spots compared to 2D cultures. TMZ is a prodrug that spontaneously hydrolyzes to the active compound MTIC (monomethyl triazeno imidazole carboxamide) above pH 7.29,30 Hi-Spots staining with a pH indicator show an acidic pH around tumor cells, whereas the rest of the brain Hi-Spots display a basic pH. The basic pH might cause activation of TMZ in GBM/brain Hi-Spots, highlighting the importance of a tumor microenvironment in compound testing in vitro. Interestingly, TMZ activity in 3D monocultures of glioblastoma cells (U87 spheroids) has been show to be around 25 µM, 31 five times less effective than in GBM/brain Hi-Spots, indicating that the activation of TMZ and the effectiveness on GBM cells not only are due to the 3D growth environment but also depend on the cellular microenvironment.
Resistance to TMZ is observed in patients with high expression of the DNA repair enzyme O(6)-methylguanine-DNA-methyltransferase (MGMT). From the four glioblastoma cell lines used in this study, two (U87 and A172) turned out be more sensitive to TMZ than the other two lines (LN18 and GL15). Accordingly, LN18 cells express intermediate levels of MGMT, whereas the TMZ-sensitive lines U87 and A172 show low MGMT activity. 32 The MGMT activity in GL15 cells is not known, but the TMZ-resistant phenotype determined in this study would suggest a high level of MGMT activity. The Hi-Spot system is therefore able to reflect subtle differences in MGMT activity in the context of TMZ resistance. Because TMZ sensitivity follows MGMT expression, GBM/brain Hi-Spots offer the possibility to profile MGMT inhibitors in combination to TMZ.
Another drug, dichloroacetate, targeting tumor metabolism has been recently proposed for GBM treatment.33,34 This and related drugs should also be tested in GBM/brain Hi-Spots. Furthermore, the mechanism of action of these potential therapeutics and their combination with standard of care could be studied using GBM/brain Hi-Spots.
We also show that GBM/brain Hi-Spots can be used to profile compounds on established tumors in a regression assay. In this experimental setup, TMZ is not effective at doses up to 10 µM in LN18 cells, as expected for a cell line that expresses intermediate levels of MGMT. Similarly, the taxol concentrations required to achieve effective tumor shrinkage in established LN18–eGFP/brain Hi-Spots (>50 nM) are very high in comparison to the concentrations that can be reached in human brain tumors. 35 This tumor regression assay offers a unique tool to characterize compound effects on established tumors that are strongly resistant to current therapies.
We have successfully implemented GBM/brain Hi-Spots in a 48-well system (data not shown). However, high-throughput handling of semiporous membranes in 96- or 384-well plates will be difficult to automate and might remain a challenge. Alternatively, GBM/brain Hi-Spots may be adapted to other 3D culture systems such as spheroids, which are more amenable to drug screening. 36 Hence, tumor cell spheroids were successfully used in a high-throughput screen.37–39 There, agarose was used as a nonadherent surface to coat multiwell plates, facilitating tumor cell aggregation. Coating aggregated cells with Matrigel induced spheroid formation 39 and allowed compound screening. Microencapsulation using alginate/poly-L-lysine/alginate (APA) capsules also has been used to generate spheroids from tumor cells in a 96-well format, allowing anticancer drug screening. 40 Another promising approach to generate GBM/brain cell microtissues to monitor brain tumor cell growth might be the newest development in the hanging drop technology where 96 microtissues can be easily generated and handled. 41 With any of these systems, the fluorescence signal from the eGFP-expressing tumor cells can be measured using a standard fluorescence reader.
Altogether, our findings imply that data obtained for novel therapeutic agents in established cell lines grown adherently in 2D on plastic should be interpreted with great caution. In contrast, our GBM/brain Hi-Spots provide a valuable tool to profile compounds in a 3D model system that is closer, and thus is expected to be more predictive, to the clinical situation. Because compound testing in mouse models of glioblastoma is tedious, GBM/brain Hi-Spots offer a unique simple system to test and select the best drugs and drug combination therapies prior to performing animal experiments.
Footnotes
Acknowledgements
We thank Lorenza Wyder for critical editorial comments. This work was supported in part by Actelion Pharmaceuticals, Ltd.