
Abstract
We describe the main characteristics of the Novartis Helios data analysis software system (Novartis, Basel, Switzerland) for plate-based screening and profiling assays, which was designed and built about 11 years ago. It has been in productive use for more than 10 years and is one of the important standard software applications running for a large user community at all Novartis Institutes for BioMedical Research sites globally. A high degree of automation is reached by embedding the data analysis capabilities into a software ecosystem that deals with the management of samples, plates, and result data files, including automated data loading. The application provides a series of analytical procedures, ranging from very simple to advanced, which can easily be assembled by users in very flexible ways. This also includes the automatic derivation of a large set of quality control (QC) characteristics at every step. Any of the raw, intermediate, and final results and QC-relevant quantities can be easily explored through linked visualizations. Links to global assay metadata management, data warehouses, and an electronic lab notebook system are in place. Automated transfer of relevant data to data warehouses and electronic lab notebook systems are also implemented.
Keywords
Introduction
The beginnings of the high-throughput screening (HTS) operations in the Novartis (Basel, Switzerland) predecessor companies (Sandoz Pharmaceuticals, Ciba-Geigy Pharmaceuticals; see https://pharmaphorum.com/articles/a-history-of-novartis), similar to many other bigger pharmaceutical companies, go back to the early 1990s when more and more compounds from various sources needed to be screened on an almost simultaneously increasing number of biomolecular targets. Growing in-house compound collections, additions from external sources, natural products extracts, and combinatorial libraries demanded an increase in automation, data handling, and data analysis capabilities. Initially, simple laboratory information management systems (LIMS), which were not specifically geared toward the needs of plate-based HTS, were used to store the raw data readouts and externally calculated normalized data and IC50 values from dose-response experiments. This still required a lot of the scientists’ time for interactive data analysis and hit identification. In 1995, an informatics initiative was started in the Sandoz Pharmaceuticals HTS department to more highly automate the complete “assay plate-to-final result” HTS data-handling aspect, and corresponding data management and data analysis software projects were started. Because the aim was to work toward a system for highly integrated data processing, covering the steps from compound and plate management, configuration of assays for automated management of instrument data files, data analysis (including data quality assessment), and upload of consolidated data to global result databases, an in-house solution was envisaged and then implemented by the internal informatics group in the lead discovery unit. The organization saw clear advantages in establishing built-for-purpose software elements in the HTS area and integration with other informatics system components in the research department. This included the possibility to implement “advanced” plate data analytics, which were internally developed and already in pilot use at the time. For example, plate data correction methods using robust local regression and median-polish procedures, methods later described by Gubler, 1 and automated outlier-resistant dose-response curve-fitting procedures as well as nonparametric approaches for the characterization of bell-shaped dose-response curves were already made productively available to the Sandoz HTS scientists in the 1996 release of the in-house software (unpublished). The basic concept for a high degree of automation of the whole process and the data flow was already foreshadowing some of the main characteristics of the future global software system, which is described further below and is the main topic of this article.
Around the same time (1994), a first version of a specialized commercial software application for the management of biological discovery data (ActivityBase; IDBS, Guildford, UK) was coming to market, and during the subsequent years, this software was licensed for use in several therapeutic research departments and in several smaller sites of the globally distributed research organization, mainly for low- to mid-throughput compound profiling applications. It was also used in the Ciba Pharmaceuticals high-throughput screening labs, at one of the several future (postmerger) global Novartis discovery site locations. Due to the given different histories of the local implementations of these software packages and details of data management processes, they were “almost naturally” configured slightly differently. Overall, the global screening and profiling data management software situation was quite heterogeneous across departments and sites at the end of 1996, when Novartis was founded, and this was true even past the creation of the Novartis Institutes for BioMedical Research (NIBR) in 2002. The first step for the HTS software consolidation and standardization—after founding of Novartis and merging of the various screening sites into a single organization—consisted of making the existing in-house HTS software with its already strong capabilities for plate analytics globally available.
Over time, this first internal generation of HTS data management software was found to become too limiting, both because of lacking ability for detailed interactive user-driven visualizations and result displays, as well as because of continually increasing growth of screening data volumes, increased numbers of assays, and readout technologies used. After several years of operation of the internal system and parallel commercial software components, the need for simplification, efficient interactive data visualizations, effective possibilities for ad hoc data review, flexible exploration of calculation results, and more scalable ways of dealing with the exponential increase in the screening throughput became more pressing and needed to be addressed.
In 2005, the NIBR informatics department and associated business units made the decision to work toward a full consolidation, standardization, and simplification of the global NIBR high-throughput screening software suite, with the mid- to longer-term goal to also include necessary capabilities for compound profiling activities and to introduce the software globally also for low- and mid-throughput use, with the associated goal to further reduce the licensing and support fees for different commercial biological assay and screening data analysis software packages, which were still in use in various groups and sites around the world.
Thus, the Helios software project was born: the principal aim of the project was to enable efficient ultra-HTS data management 2 (uHTS, >100,000 samples/d) for several parallel campaigns in a highly automated fashion using similar core principles for process automation as already embodied in the predecessor system, while providing high performance and responsiveness for interactive use, as well as the ability to efficiently cope with the high-screening data volumes. Naturally, it would also need to scale toward even further throughput and volume increases and have the ability for simultaneous use by screening groups and scientists at all global NIBR sites on three continents. At the same time, the new system should provide easy to use advanced screening data analytics and efficient tools for the necessary flexible interactive data visualization. From the screening scientist’s point of view, the configuration of the data capture steps and the assay-specific calculations should be intuitive, be quick to set up, and adapt. We have chosen to implement the latter through tools for graphical assembly of the principal calculation steps from a catalog of building blocks into one or several parallel calculation pipelines. See the section “High-Level Visual Calculation Configuration” in the Materials and Methods for more details.
The detailed application design by an interdisciplinary team was started at the end of 2005 and then continued to run in parallel to the agile software development phase up until the productive release of the first version of the software to the users in 2007. Planning, piloting, and development were done jointly by a team of scientists and informatics engineers from within NIBR and an external scientific software development company, a collaboration that has proven to be very fruitful also for many later projects.
The actual software implementation work was started in mid-2006 and a first productive application version was made available to the HTS groups (around 150 users in two sites) in the spring of 2007. Phased development of additional features continued for another 3.5 years after that, and smaller extensions are still made today if they are important to incorporate for a sufficient number of labs. By 2011, all of the commercial screening and profiling software components in NIBR high- and mid-throughput screening and profiling labs were no longer used, and the roughly 300 additional users were all migrated to use the Helios system, most of them already by 2009. In the past several years, the Helios application has had a rather stable global total NIBR user base of around 850 scientists in various departments and sites, supporting various highly automated HTS and uHTS groups, as well as numerous mid- to low-throughput compound profiling labs in all therapeutic and translational research departments.
The initial screening capacity of around 50,000 well-level readout values per month being processed in the Sandoz Pharmaceutical screening labs in 1992 grew to about 1 million per month in 2002 when the NIBR was founded. Throughput increased to about 5 million per month in 2007 when the Helios software system was introduced and to around 10 million per month in 2011. In recent years, the sustained average global inflow of well-level readout data into the Helios system stabilized around 17 million values per month (nowadays often from multiple parallel readouts from a given single physical well, with the average multiplicity across all types of assays and experiments being around 3). The readout “multiplicity” from one assay plate ranges from 1 or 2 for readouts from “classical” assay technologies (e.g., fluorescence intensity, fluorescence resonance energy transfer [FRET]) to typically around 10 for image-based high-content screens, when using a limited number of selected well-averaged cellular image feature values, but could occasionally go as high as 64 or 128 (de-multiplexed) reads (e.g., for Panomics gene expression assays). 3 A typical full-deck primary screen is today being run with 1.5 to 2 million samples, although in the past several years, the use of focused screens with a smaller number of samples (10,000–50,000) has become much more frequent,4,5 and inclusion of newer techniques to measure the effect of extremely large numbers of chemical entities with a much smaller number of experiments (e.g., use of DNA encoded libraries 6 ) is making inroads into the set of available drug discovery methods and might over time further limit the number of large complete full-deck screening runs.
The Helios data structures, data-loading procedures, and calculation modules are best suited for assays and assay technologies with a “few” parallel readouts per plate-well, which were the rule about a decade ago. These well-established assay readout technologies (fluorescence intensity, fluorescence polarization, luminescence, absorbance, FRET, time-resolved [TR]–FRET, and AlphaScreen, among several others) are still very widely used today. Very high-dimensional data, which are now generated more and more frequently from image-based high-content (HCI) assays, for example, cannot be handled by the Helios system because the internal data structures do not allow handling such data in an efficient way, nor is the system equipped with the related necessary multivariate data analysis methods. Some HCI assays run within NIBR and elsewhere 7 have already produced data sets with >1500 feature values (“readout data types”) per well, clearly not something a standard HTS data analysis system can easily digest. A scalable cloud-based software system that is capable of loading and analyzing these and similar types of data in efficient ways was internally built in 2016 and is presently being further extended to support single-cell data processing and analysis. 8
Materials and Methods
The following sections describe the most important aspects of the Novartis Helios in vitro screening and profiling data analysis software system, which has been running productively for more than 10 years and is now used by 850 scientists at all NIBR locations on three continents. The system processes most of all plate-based in vitro assay data generated in our organization in a highly standardized way.
Application Infrastructure Aspects
The Helios system is set up as two geographically separated application server environments located in the NIBR Basel and Cambridge data centers. They are configured in such a way as to provide load sharing between different user communities. The high-volume user data are kept separate (not replicated) on these servers, while core data items (controlled vocabularies and important shared configuration information) are replicated in a master-slave manner. All-important data and information (initial raw data, final derived data, assay and calculation configuration, etc.) are stored in relational databases (Oracle Corp., Redwood Shores, CA), whereas all intermediate results generated by each individual calculation step are held in a HDF5 file format (HDF Group, Champaign, IL) on file systems attached to the application servers. This hybrid storage choice was made based on performance, data usage, and long-term data persistence considerations. Iterative interactive data analysis with many parameter changes, repeated creations, and deletions of computed intermediate result data sets is much better supported by a relatively simply structured file repository than a highly normalized relational database system. On the other hand, the latter is a perfect environment to support long-term data storage, controlled data access, and well-established data integrity, backup, and archiving mechanisms for the key data needed at the enterprise level. A simplified schematic view of the Helios Oracle database object structure is shown in Supplementary Figures S1 and S2 . Further components of the classical three-tiered application architecture are the Linux- and Java-based application and calculation servers and a Microsoft .Net C#-based (thick) client application. Client applications can connect to either of the two server environments, and communication between the two is based on an efficient binary web service protocol (Hessian; Caucho Technology, Inc., San Diego, CA), allowing data transfer at high rates, which is necessary when displaying large sets of heatmaps, for example. The client application allows free arrangement of UI elements (spreadsheet tables, heatmaps, histograms, etc.) to best suit the actual analysis questions at hand. Examples of this graphical user interface (GUI) characteristic can be seen further below.
NIBR Software Environment and Embedding of HTS Data Management System
Plate-based high-throughput experimentation is naturally tied to efficient sample and plate management, both in terms of physical processes and information handling. As we will see below, we can reap great benefits if instrument data capture and data analysis systems are well integrated with plate management systems.
All processes from retrieval of compound vials or master plates from the organization’s compound stores for creation of screening plates, handling of plates on robotic equipment, automated capture of instrument readout files, and upload of the latter to the analysis software, together with subsequent identification and matching of the “correct” readouts for a given calculation step, need to fully rely on machine-readable identification (unique barcodes). In Figure 1 , we show a schematic and somewhat abstracted overview of the main data management system components of the NIBR informatics software environment. Separate specialized components deal with registration and management of specific scientific “entities” and are sometimes linked in a hierarchical and sometimes in a network fashion, providing relevant information to dependent core system components and applications. For example, the plate management system has links to sample and assay management components to handle plate content information and to have a possibility of preassigning assay plates for use in particular screening or profiling runs. The plate management system also takes care of managing plate hierarchies (parent-child relationships, dilution factors, etc.), as well as plate reformatting operations (e.g., creation of 1536-well assay plates from 384-well plates in various ways).
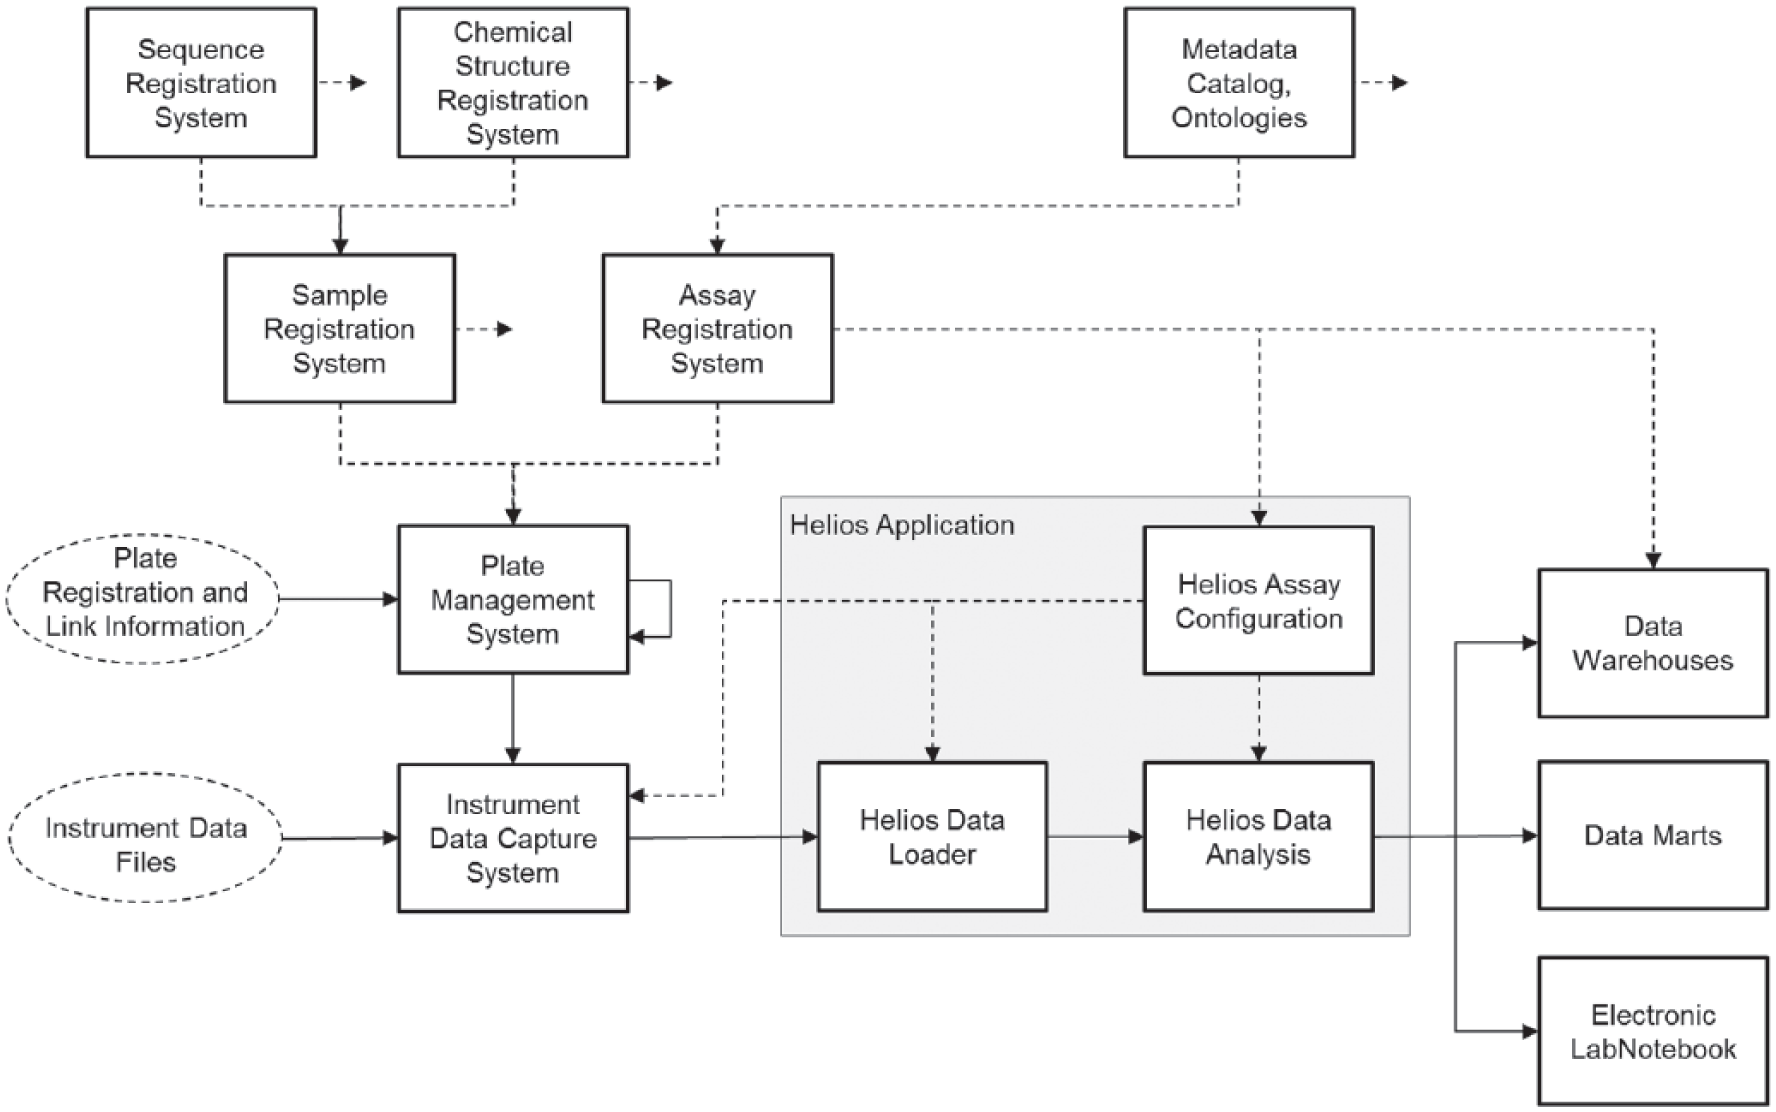
Simplified NIBR software environment related to in vitro screening and profiling experimentation. The Helios software has its main integration points with sample management, plate management, assay registration, and automated data capture systems on the “upstream” side, and on the “downstream” side with result data warehouses and electronic lab notebook systems, as well as with specialized data marts and Spotfire visualization software (TIBCO Software, Inc., Palo Alto, CA) for the ad hoc use of detailed screening assay results. Note that clients of analyzed Helios data have their own connections to the core data systems for sample and assay metadata, which are not depicted here. The full lines indicate the data flow of the plate registration and instrument data-processing steps for the individual experiments, whereas the dashed lines indicate the meta-data and auxiliary configuration information flow, which serve to control the analysis (e.g., experiment structure and calculation definitions) and/or augment the result data (e.g., addition of detailed sample characteristic, chemical structure information).
The sample registration and assay information management systems further depend on small-molecule structure and biological sequence repositories, as well as standardized metadata catalogs and ontologies. Generally speaking, these systems provide a hierarchy of specialized entity descriptions, going from the more abstract levels down to the very concrete, the latter describing the liquid volumes, concentrations, sample identifiers, and type of sample (test or control samples, etc.) for each of the wells in a particular assay plate. Information about parent-child assay-plate relationships can also be generated during the actual assay execution (e.g., when supernatant needs to be transferred to second assay plate and when such plate relationships are important for the proper identification of the readouts). An example of such an assay and how this plate link information needs to be used during data analysis is described further below.
Data files generated by plate reader instruments are submitted to the instrument data capture system and, based on interactively selected or preconfigured reader type and model information, converted into a standardized XML data format.
All instrument files generated during the measurement process need to contain the barcode identifier of the assay plate being processed. The conversion of all reader data files into a single standardized format is handled flexibly in another in-house software application (ICP5), which presently supports about 240 different file formats from 102 different types of instruments that are in practical use in the various global NIBR biology labs. Barcode information from the data file is used to retrieve the detailed plate content information from the plate management system and is merged together with the reader data in the standard format. The Helios assay configuration information is used to associate the incoming data set with the predefined assay and the correct type of readout (see example further below, e.g., data being the “acceptor wavelength” intensity signal in a FRET assay). The Helios assay configuration also defines the expected number of replicates. Based on this information, the Helios Data Loader is then able to identify the relationships of all uploaded readouts among each other and to also detect completeness of a particular plate experiment when all relevant data have arrived. This signals readiness to start a calculation on a plate’s data only when all relevant raw data sets have been successfully loaded. Facilities for replacement of erroneously loaded or wrongly assigned data by the “correct” data are in place. Besides the application’s ability to automatically flag or omit data from further consideration based on plate and curve quality control (QC) characteristics, the application’s “Experiment Management” facilities allow user-driven invalidation of whole experiments or of individual assay plates and loading of replacement data into the interactive analysis workspaces.
Most elements of the Helios assay configuration subsystem have a purely operational role, while the scientific aspects of the “assay” (i.e., method descriptions and associated descriptive metadata, which are controlled by curated ontologies) are registered and stored in the “higher level” NIBR assay registration system, which serves as an authoritative reference for data warehouses and other software systems. Helios assay configurations are of course linked to the enterprise assay definition entries.
More detailed descriptions of some of the Helios data analysis capabilities can be found in the next sections.
Once the original raw data are reduced to quality-controlled final derived screening or profiling results and stored in the Helios results database, the direct connections to downstream systems allow user-triggered automatic data transfer from within Helios to different data warehouses 9 and the electronic Biology LabNoteboook (eLN) system (Biobook; IDBS, Guildford, UK).
Structure of Plate-Based Biological Experiments, Experiment Configuration, and Automated Data Loading
To illustrate the overarching importance of tracking the key physical process steps for later use (i.e., for support of automated data management and full automated control of subsequent data analysis steps), we describe a few typical examples of plate-based in vitro assay experiment structures in Figure 2 . The term experiment in this context denotes the minimal but sufficient set of physical or logical entities, as well as their relationships and characteristics that must be known to allow executing the desired calculations with these data in a completely unambiguous way.
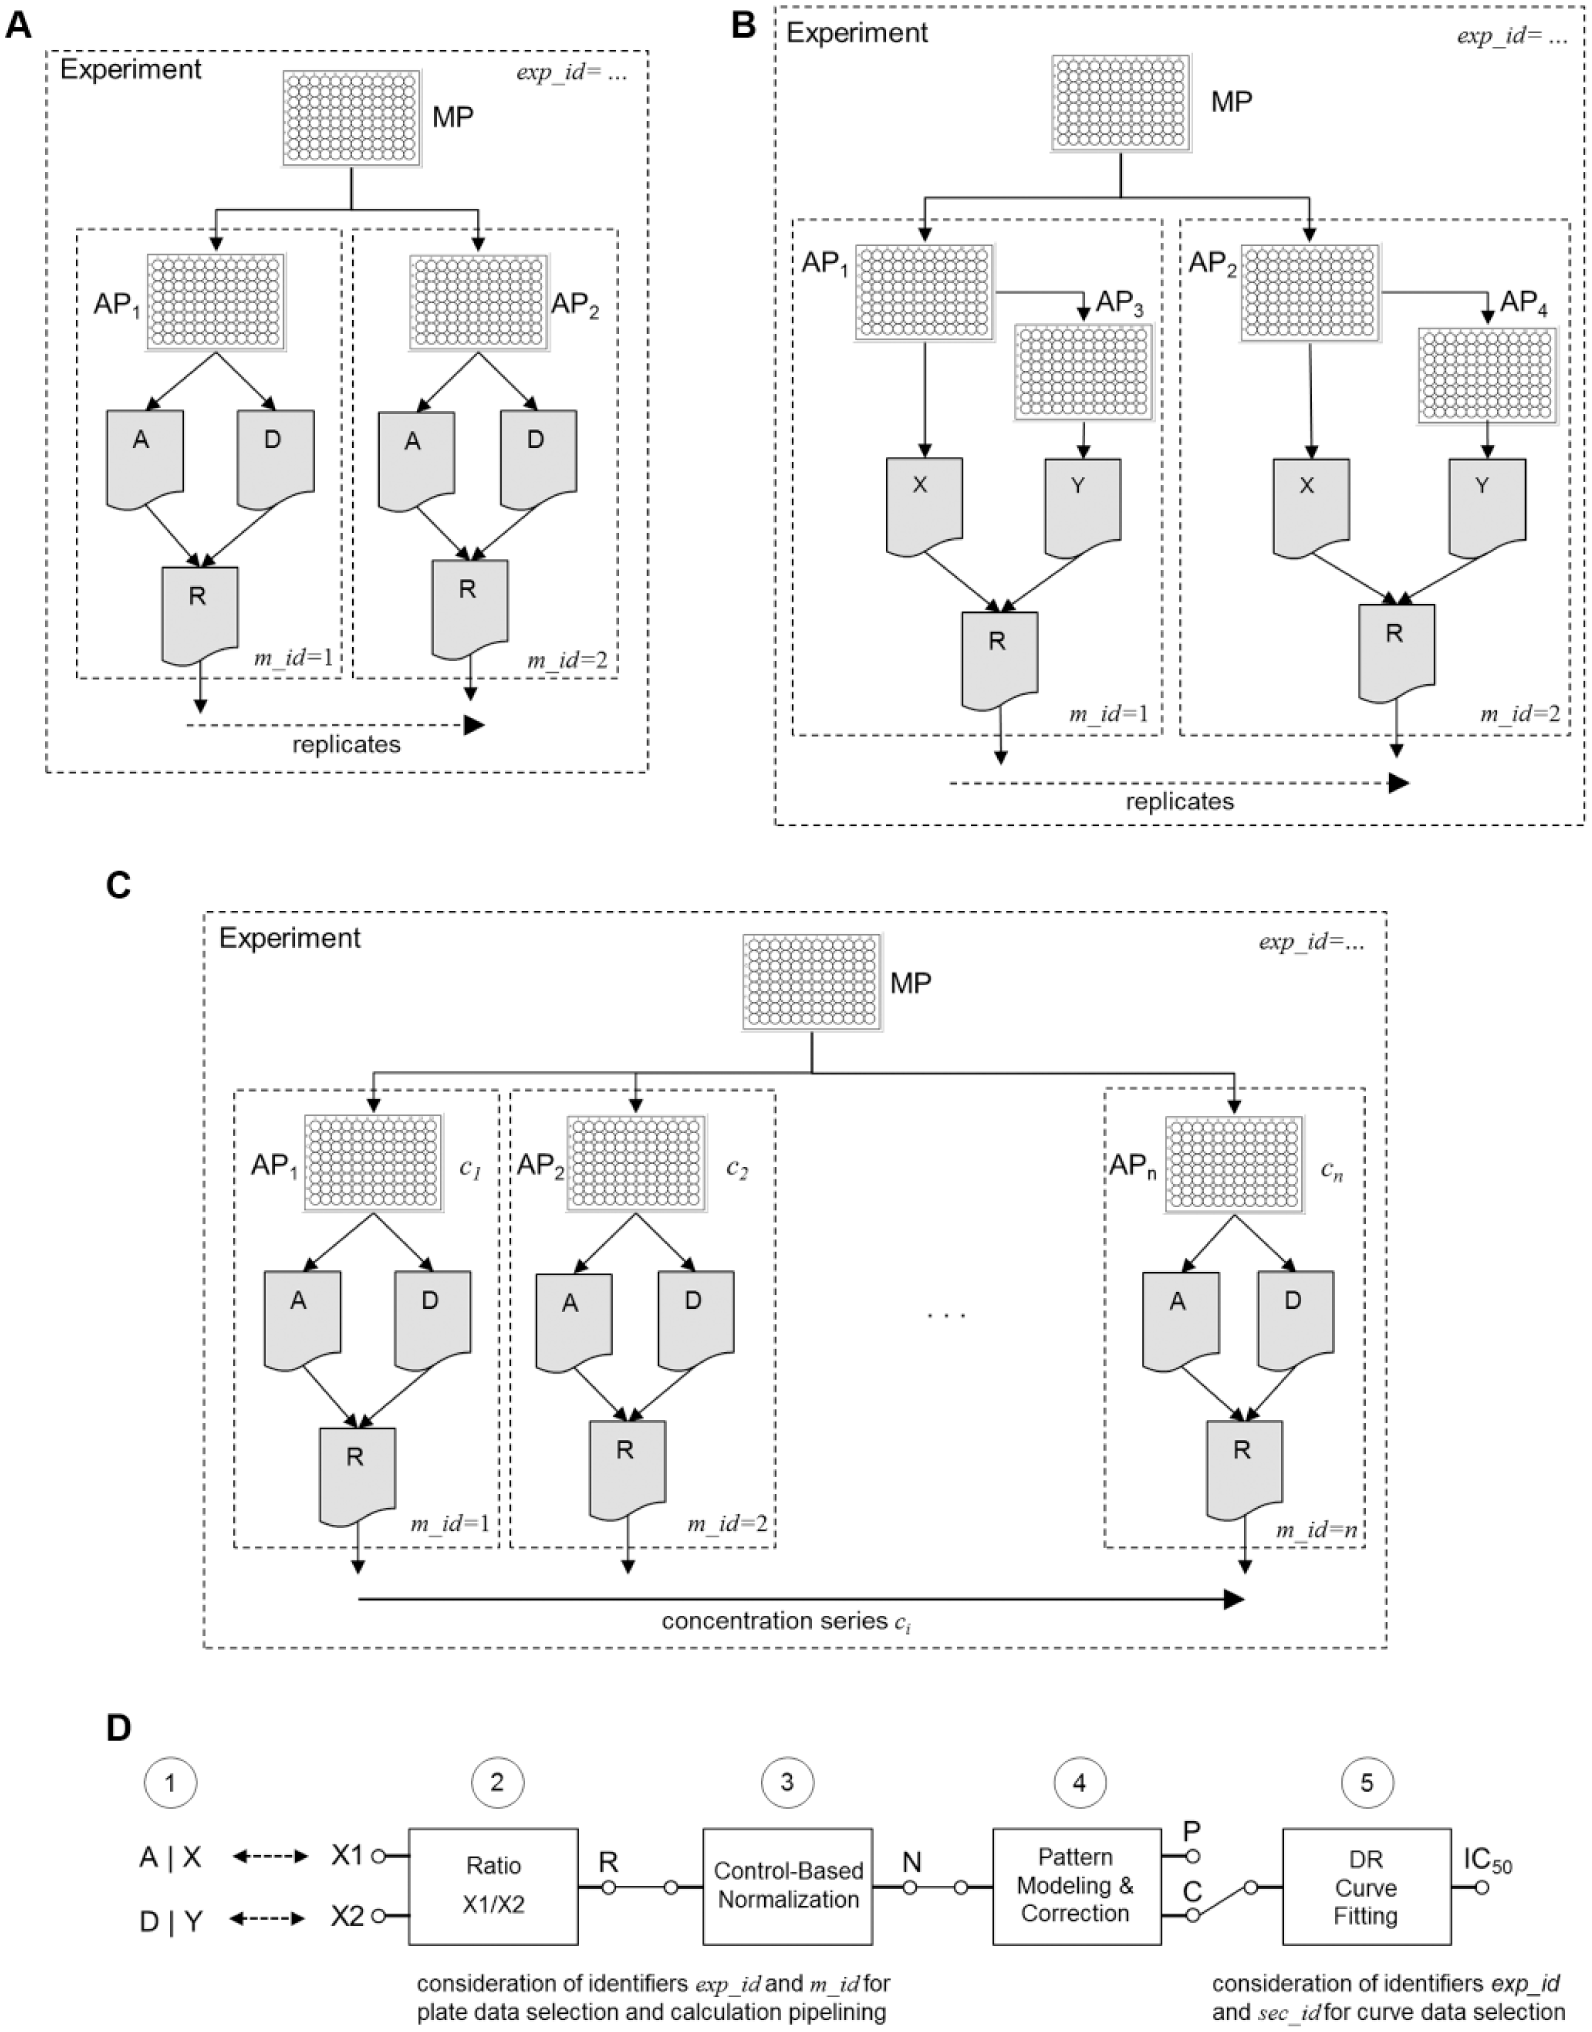
Simple examples of “experiment structures” as defined by master plate–assay plate–readout relationships and typical calculation pipeline. (
Data and assay plates (APs) for each separate experiment (with identifier exp_id assigned at data-loading time) have logical links to a top-level master plate (MP) entity, which can either correspond to a physical storage plate from compound management or a newly created “one-off use” compound plate that is freshly assembled for a particular assay in a targeted cherry-picking process. In other situations, this MP object can also be a purely virtual entity when one or several replicate assay plates are created in an ad hoc production process (e.g., by acoustic dispensing) from a set of samples originally distributed over multiple storage plates or vials. The MP object is the logical top-level “hook” to which the rest of the assay plate processing and measurement processes is attached. Registering of a master or assay plate minimally entails storing identifying information about the new object and each well (sample identifier, concentrations, well types, etc.), grouping of wells into plate sections for defining concentration series, and possibly other relevant meta-data if required for data analysis in the Helios application or any other downstream system. Well types, plate sections, and concentrations make up the “plate map” or “plate layout” information for use in calculations. Assay plates used in the measurement process are often simply just registered with a barcode, and they link to a master plate and a dilution factor from which all other necessary information can be derived (information inheritance).
In Figure 2A , we show the “experiment structure” of a FRET assay run with duplicate plates and two types of readouts (donor, acceptor signal intensities). In other experimental protocols, a second assay plate can come into play where a link to the first assay plate instead of the master plate needs to be made: the example shown in Figure 2B corresponds to an assay measuring the concentration of a secreted protein, where an aliquot of a supernatant needs to be transferred from the first plate to a separate second plate, and information (e.g., cell density) from the first plate needs to be available for normalization. In this case, only the link to the original first assay plate needs to be stored, and the “dilution factor” is irrelevant.
In Figure 2C , we show the general structure of a FRET quantitative HTS (qHTS) assay, 10 which is very similar to Figure 2A . This time, we simply register the n assay plates corresponding to the n different concentrations with varying dilution factors di (or end concentrations ci) and link them to the single master plate identifying the samples and original concentrations. Naturally, the identical scheme would even apply to a qHTS FRET experiment with r replicate plates at any of the given concentrations, now just linking a total of n × r assay plates to the master plate. The instrument data capture system described above will retrieve and interpret the registered plate links and add all necessary plate- and well-level information to the raw data from a given assay plate for loading to Helios.
The Helios application requires a relatively simple initial assay configuration to support automatic data loading and automatic assignment of internal data set and data set grouping identifiers. This high-level configuration for a given version of a Helios assay describes (a) the type of readout (e.g., in the FRET case, a “Donor” or “Acceptor” label) and (b) the number or expected readout replicates of each type. The two together allow the marking of a single plate experiment as complete when all corresponding data were successfully loaded. A third configuration element is concerned with the naming and definition of the result output quantities in a similar way. We will not address this further here.
The experiment structure is implicitly defined by the hierarchical plate-to-plate links (information in plate management database) and the reader data file-to-plate links (barcode lookups in plate management database) and is schematically outlined in the examples of Figure 2A–C . This information is necessary and sufficient for the correct grouping of individual plate readouts for follow-up calculation and result derivation steps.
The data loader checks each newly arriving data set (file) of a particular assay and readout type (as assigned by the instrument data capture software) from which master plate it is originating. Data associated with different master plates are automatically receiving different experiment identifiers exp_id for later data subset filtering for the analysis. All data sets originating from a particular assay plate will automatically receive a data set grouping or matching identifier m_id. Note that this identifier is selected to use the highest level assay plate in a hierarchically linked series of plates (as shown in Fig. 2B ) to ensure identification of data even if the relevant measurements were originating from different physical plates with their own separate unique barcodes.
By optionally considering the readout timestamp from a given assay plate, the relevant data can be automatically selected for kinetic time-course analyses. Further configuration options allow even finer control over the experiment identifier creation in the data-loading step, because it is sometimes desirable to assign separate experiment identifiers exp_id each time a given assay plate readout is repeated and sent separately to the analysis application, and sometimes the later measurement should simply replace the earlier one. In this case, there are multiple experiments originating from the same master plate available in the system. This behavior is transparent and under full user control.
Some of the plate map information is passed in from the plate registration system, notably all dilution series information, but the Helios application allows imposition of well-type information onto the plate readout data in a “late binding” step to inject missing information that may only become available at a later stage of the assay execution process into the analysis. This happens frequently when the exact placement of various types of control or reference samples outside of the predefined test sample area is not known by the compound management group preparing the screening plates but only by the labs running the actual plates through the specifically programmed liquid-handling equipment.
All raw data sets loaded to the Helios system are stored in a relational database system (see Suppl. Fig. S1 ), typed as “raw data,” and fully identified in the described manner. Data can be selected by various criteria (assay, master or assay plates, time ranges, etc.) and readily be retrieved as a working set into an interactive “plate group” data analysis environment. All the calculation modules that are graphically assembled into a calculation pipeline only need to be equipped with a few simple generic mechanisms for picking and grouping of readouts by unique combinations of matching and experiment identifiers m_id and exp_id or—depending on the operation—exp_id alone, as previously illustrated in Figure 2 . For assembly of well-level data values for dose-response analyses, the plate section information (sec_id) as delivered into Helios from the plate registration system is also needed. In the qHTS case, each well of a plate has a separate sec_id (but identical for all related plates of a given exp_id), thus allowing the collection of data for a single dose-response curve “across plates” of the particular experiment. Plate section information is only used by the various curve-fitting modules. The derived curve-level results, now associated with a unique curve_id, are stored in separate result tables (see Suppl. Fig. S2 ), thus associating a set of well-level values with curve-level results.
In the next section, we see that the high-level calculation structure and calculation definition for all these specific experiment variants are very simple and can actually be handled in a unified way for the particular example cases chosen for the illustration (see Fig. 2D ).
The described upfront tracking of the key plate-related assay preparation and assay execution steps, as well as full machine-readable identification of assay plates and related data files, allows defining the calculations in a very intuitive manner as seen from the end-user perspective. At the same time, this system design naturally also maintains full data integrity and full documentation of chosen calculation steps and parameters related to the raw data subset in a particular analysis.
Once derived data are stored in the Helios database and propagated to the data warehouse, it is not possible to delete the Helios plate-group working set and all associated calculation instances, unless these results are retracted from the warehouse first. Suitable synchronization and locking mechanisms between the two systems are in place.
High-Level Visual Calculation Configuration
As mentioned above, we have chosen a graphical pipeline paradigm for the definition of calculation steps to arrive at the desired final derived results. The principal modular analysis steps for these examples are listed below (see also Fig. 2D ). The series of numerical operations performed for the selected readouts for a particular m_id in a given experiment exp_id at each of substeps 1 to 4 are indicated in symbolical fashion:
Determine the ratio R based on raw acceptor and donor readouts A and D: R = A / D.
Normalize the R ratios to a percent scale using the neutral controls NC and active controls AC as defined in the plate map:
Apply a response data correction to eliminate systematic plate location–dependent errors using a suitable pattern-modeling method. This is often recommended to reduce bias and represent sample activities in a more faithful way: C = f(N, P), where C are the corrected data, P represents a suitable model of the systematic error component, and f is a corresponding correction function. See, for example, overviews by Gubler1,11 for details on many different possible error modeling and correction approaches.
For dose-response experiments: Perform curve data diagnostics and nonlinear regression analysis on intermediate N or C data (X) in a curve-fitting module: IC50 = DRCurveFitting(X), where the IC50 result output symbolically represents all curve analysis parameters and statistical characterizations, not just the IC50 potency parameter itself.
A second (QC) calculation could easily be set up that passes the sum S = A + D to follow-up modules, allowing to detect and potentially mask wells strongly deviating from the (robust, outlier resistant) plate average
So, a typical calculation pipeline often uses only two to four high-level modules. In the simplest two-module case, we obtain response data that are normalized on a plate-by-plate basis, whereas we obtain corrected normalized data that are largely devoid of systematic response errors with three modules, and a fourth module will deliver us detailed dose-response curve analysis results, if desired.
Types of Calculation Modules Available in the Helios System
When generalizing the data reduction steps for plate-based assay analysis as previously illustrated, we see that we can already analyze most of them when making available the following calculation modules: (1) data transformation, (2) data normalization, (3) plate response pattern data correction,1,11,12,13 and (4) dose-response curve fitting. We gain more flexibility and versatility by adding (5) calibration curve fitting, (6) user-defined custom transformations, (7) well-level masking modules, (8) automatic plate-level masking based on QC indicator thresholds, and (9) kinetic time-course fitting. Most screening and profiling experiments can be fully analyzed with this module set. Some more details on the characteristics of these modules are mentioned in the Supplementary Information .
Individual calculation modules are picked from a list in the GUI and strung together into a series of steps to form the pipeline. Pipelines can be copied as a whole, and individual modules can be easily replaced and/or their parameters can be changed. Several parallel pipelines operating on the same input data can coexist, allowing direct investigation of the effects of different analysis approaches.
Each module also automatically derives a large set of plate-by-plate QC summary information, which can be interrogated and displayed at the output of every calculation step (summary statistics for all types of wells, Z and Z′ values, strictly standardized mean difference [SSMD] values, etc.). 11 These values and also activity distribution histograms can be created and visualized for the whole plate set (plate group QC summaries) or for individual plates.
Advanced Plate Data Analytics
It is well known that systematic response errors due to nonoptimal liquid-handling equipment performance, environmental factors, and instrument readout characteristics appear frequently in plate-based experimentation.11–13 Elimination of these systematic error patterns from plate data will lead to more consistent identification of hits and to smaller false decision rates. 14 As mentioned in the Introduction, some plate pattern detection and correction algorithms were already integrated into the Helios predecessor system and were of course also made available in the new application generation but in a much more user-friendly and interactive fashion. The catalog of methods was also widened so that various types of patterns (smooth trends, striping due to liquid-handling problems, or combinations thereof) could be assessed and treated in the most suitable ways.
A variety of different platewise and plate-batchwise pattern modeling and correction methods can be used. 11 In practice, the robust local regression (platewise) and principal pattern (plate-batchwise) based modeling approaches are used most frequently because they usually provide the most faithful and at the same time the most robust (outlier resistant) representations of the systematic error patterns. Symbolically, the two most frequently used pattern models for describing responses at row and column coordinates r and c can be represented as
Given the model response values
Some additional comments about these pattern-modeling and data correction methods can be found in the Supplementary Information .
By virtue of making median polish and robust Z scoring available as building blocks, the B-score method 12 can easily be assembled from two basic steps, but Helios provides larger flexibility for combining any of the available pattern-modeling and correction steps with follow-up variance-based scoring (termed “generalized R score” method in Table 5.5 of Gubler 11 ). Patterns can also be derived from specifically designed and flagged QC plates by a method that is very similar to control plate regression 15 and then used for correcting the responses of the sample plates. This is especially important for dose-response experiments, for small-molecule screens with high hit rates, and very frequently also for RNA interference (RNAi) experiments.
Different correction methods can be applied in parallel to the data (see Fig. 3 ). Results can be interactively explored and compared to identify the most suitable way to correct the artifacts either through pure visual assessment or, better, also through quantification of the correction effect on various QC summaries (e.g., by calculating VEP or other indicators that can signal the “flattening” of the assay response values across individual plates, plate batches, or the whole experimental run) (see summary Table 5.4 of Gubler 11 ).
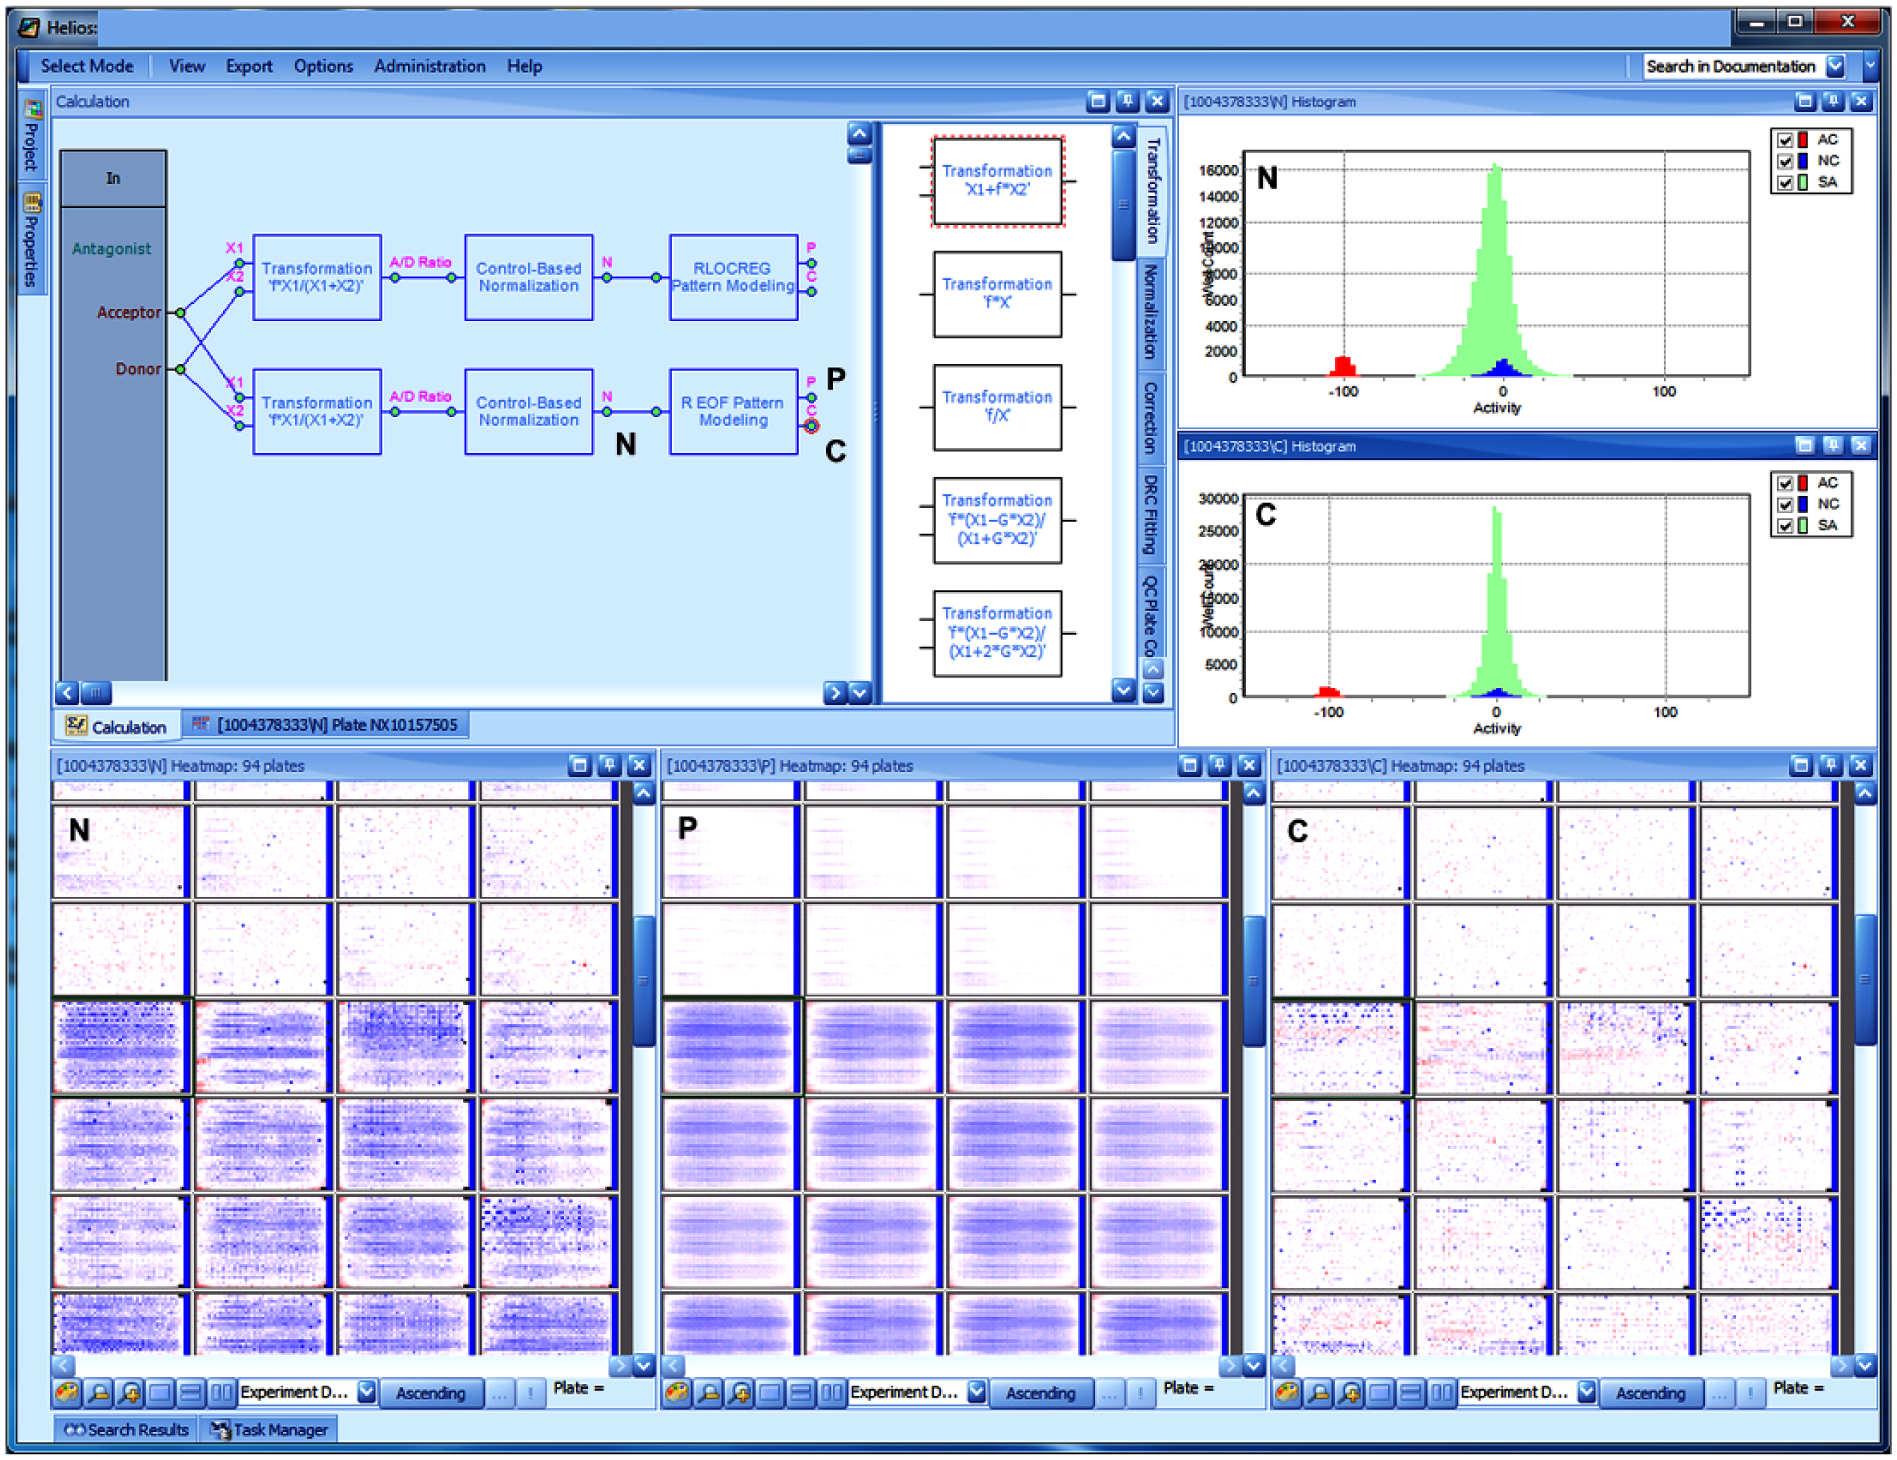
Helios application screen (example of a typical primary screening analysis session): The calculation pane in the upper left shows two parallel pipelines for ratio calculation, normalization, and correction (two different approaches for the last step). The module output connectors for normalized data, systematic pattern model, and corrected data are marked with N, P and C, respectively. The same tags are used for the simultaneously displayed plate heatmaps in the lower half of the screen and the histograms in the upper left. It is seen that the pattern P, which is present on some of the plates and here represented with a robust principal pattern model, 11 allows eliminating the systematic response errors to a good degree, resulting in the corrected data C, which are largely devoid of systematic errors. The corresponding summary histograms also clearly show the narrowing and centering of the sample activity distribution (light green/gray) after applying the correction. The C output of the most appropriate calculation approach can easily be connected to an “Output” connector bar to the right (not shown, similar to the “In” connections on the left), and results can then be saved to the database.
Primary screening hit lists can be generated from a set of different correction methods, and the respective agreement of results from multiple pattern-modeling and correction approaches can then be assessed in separate analyses outside of the Helios application, if desired. This will usually be done with support from a cheminformatics toolset and identification of structurally or biologically similar compounds. 16
Advanced Dose-Response Curve Analytics
Dose-response curve-fitting procedures for high-throughput assays, in which many thousands of curves (or even tens of thousands of curves in confirmation experiments with only a small number of concentration points) are analyzed, must be able to cope efficiently and flexibly with all kinds of “real-world” situations. Confirmation experiments are often used to reduce the number of compounds from large primary hit lists by checking for the actual presence of concentration dependence, sometimes already considering the responses from parallel selectivity experiments. Thus, the curve-fitting procedure and algorithms must be able to adapt themselves to the particular highly variable situation at hand. Dose-response curve fitting of data from (a) completely inactive samples where an IC50 determination without consideration of the (small) effect size will lead to a random nonsense result, (b) automatic handling of outlier data points using robust regression algorithms, 17 (c) detection of nonsigmoidal (e.g., bell-shaped) curves, and (d) ability to deal with the mentioned “short” dose-response series using suitable model switching based on a series of preset but configurable diagnostic quantities must be possible in a robust and stable fashion.
Ill-conditioned fits and related large uncertainty on one or several regression parameters—frequently occurring for “incomplete” curves where the high-concentration plateau is not reached in the experiment—are signaled to the user via a “fit validity” flag and “diagnostic” (explanatory text) output in an easily sortable spreadsheet-like display. Hill curve parameters from such curves must be interpreted with suitable caution, and alternate potency characterizations can be chosen (qualified limit values, absolute AC50, etc.). 18
Each individual concentration-response curve is analyzed by going through several sequential steps:
A prior nonparametric fit
A four-parameter sigmoid Hill curve model fit
A median effect fit
If the parametric fit-quality indicators and the prior nonparametric fit characteristics indicate a likely nonsigmoidal response shape, then a final nonparametric fit
More details about the models and the decision criteria for fitting step progression are given in the Supplementary Information .
For all parametric fits, it is possible to apply constraints to the parameters (a) in an automatic fashion for all fits, (b) for automatically selected fits only if the first fitting round is found to lead to an ill-conditioned situation, or then (c) purely interactively by the user reviewing the curve results.
Especially for large dose-response screens where thousands of curves need to be reviewed to make sure that the analysis did not go wrong in some unexpected way for some of the data, it is of high importance to equip the users with powerful tools to do this review quickly and reliably. The simplest possibility is to use (result) spreadsheet column sorting according to one or several curves or statistical quality characteristics to identify possible problem cases.
Other curve data-reviewing approaches that we support are curve clustering to identify groups of curves with similar shapes (using a fuzzy c-means algorithm) 19 and (rule-based) automated curve classification. For the latter, any of the derived curve-fit parameters or quality characteristics generated during the regression analysis steps (see Suppl. Information for examples) can be used in a freely definable set of conditions that can be combined with Boolean logic rules and assigning a final classification label to each curve. As with any of the other analysis spreadsheet columns, data can be sorted, filtered, and used for grouping of curves with similar properties (see Fig. 4 ). For practical use, a series of predefined and ready to use rule-sets are made available. While identifying problem cases, the user can apply parameter constraints (if this is merited) or interactively mask individual outlier data points (if these were not already automatically eliminated) and have the curve automatically refitted, add text annotations to selected curves, or even prohibit publishing of some data to downstream warehouses if the result is deemed to be of really bad (statistical) quality or clearly influenced by experimental artifacts.
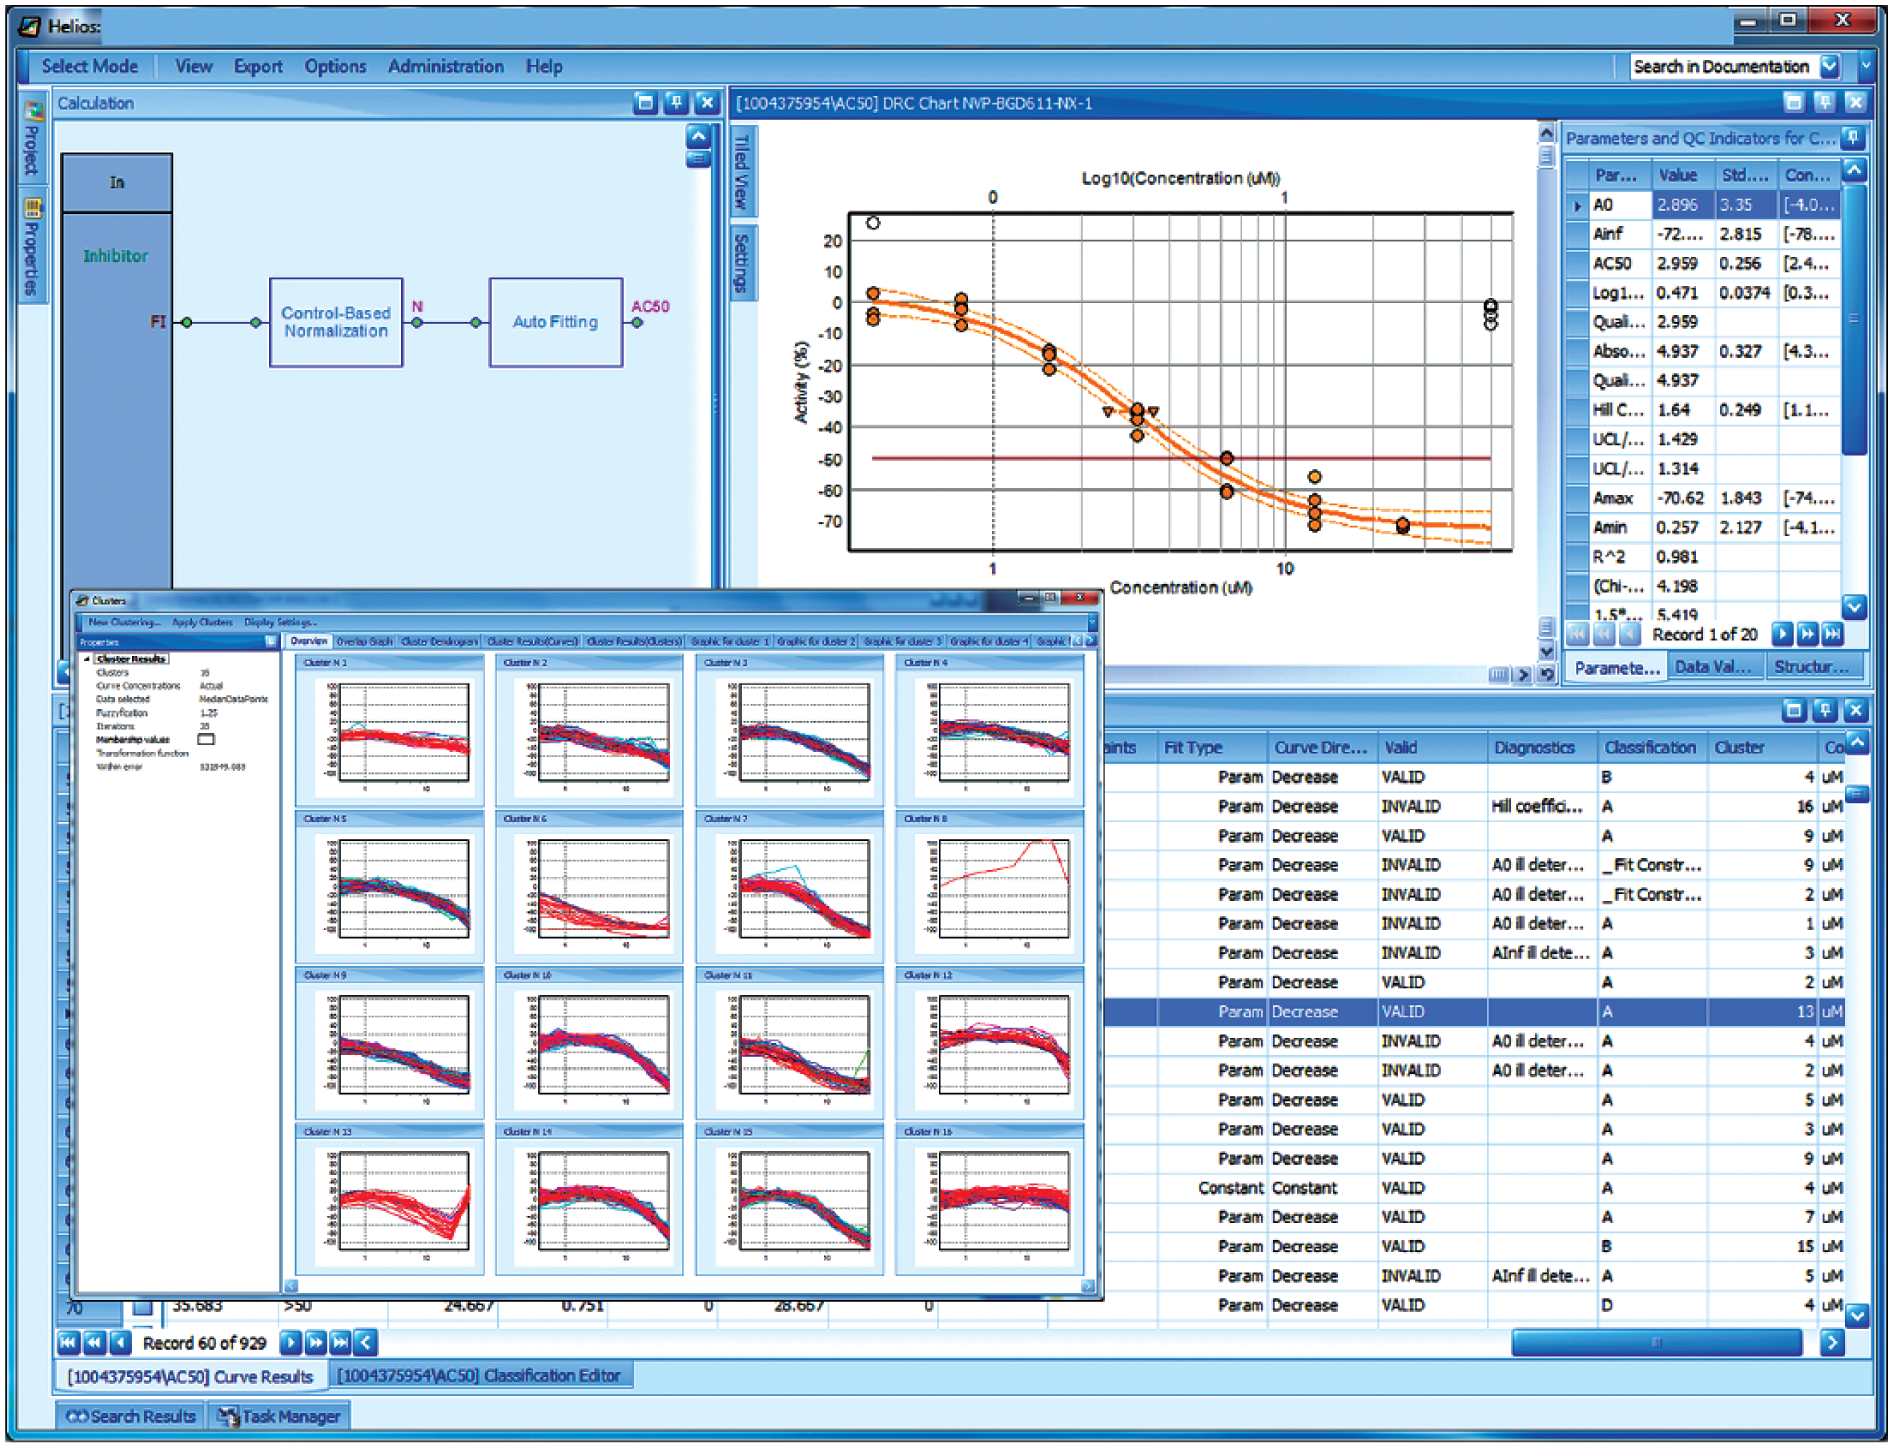
Helios application screen (example of a typical dose-response analysis session): The pane in the upper left just shows the calculation pipeline for a simple fluorescence intensity assay (just using a normalization module and a curve-fitting module). The curve-fitting results (AC50 connector of curve-fitting module) are assembled in a spreadsheet (lower half of the screen), and a graph of the particular selected curve, together with detailed numerical characterizations, is shown in the upper right. This specific curve has some outlier data that were automatically downweighted and essentially ignored by the robust fitting procedure (open plot symbols for data points denote a small or zero weight). This particular curve is a member of the cluster in the lower left of the pop-up/overlay window for curve clustering results. Besides the extensive numerical curve characterizations of the curve data and fit results, the rightmost spreadsheet columns contain several curve categorization and classification results: fit type, curve direction, validity of regression results (set to “invalid” when regression diagnostics detect irregularities, e.g., ill-conditioning of the fit where some parameters cannot be reliably determined), diagnostics (“explanations” of the regression or of other problems), and classification (results of rule-based curve categorization, here with a curve-fitting result quality ranking from A to D, occasional notes about some special situations, and a cluster result column indicating the cluster “number” as assigned by the clustering tool; in this example, cluster 13 contains all the curves having a similar outlier problem with the data at the highest concentration as the example curve).
Data Visualization and Exploration
Intermediate and final readout data, as wells as detailed QC information for every plate, can easily and quickly be visualized at each calculation step from any of the module output connectors. Heatmaps, scatterplots, line charts, and tabular representations of the particular derived readout values, platewise or plate-batchwise summary statistics, and QC indicators for any of original, intermediate, or final derived readout types can thus be readily created and viewed at all points of the calculation pipeline. In a similar fashion, it is also possible to interactively create and export ranked hit lists from any of the steps to be able to quickly compare lists from uncorrected and corrected data plate data. Raw data values can directly be visualized using the same type of displays from the analysis work environment’s “input connectors.”
Invoking the default visualizations from dose-response curve analysis modules brings up automatically a tabular representation of the fitting results, from which individual curve displays together with a details pane for parameters, data point details, and links to the respective plate-level data can be launched. Sets of curves can be visualized in a tiled display or directly as a curve overlay. For data quality assessment of high-content screening assays, it is possible to automatically retrieve and display the microscope images corresponding to particular wells or curve data points. High-content images are managed by a separate central application system that can be interrogated for relevant images of a given plate/well and allow for image retrieval requests from other systems and applications.
Various web services allow the retrieval of dynamically generated curve images and curve overlays by “downstream” systems, for example, internal data warehouses or Spotfire analysis sessions (TIBCO Software, Inc., Palo Alto, CA).
Results and Discussion
In the more than 10 years of operation, the Helios application has brought a great level of true “best practice” standardization and consistency to the management and analysis of essentially all plate-based in vitro assay data within NIBR, both in terms of the streamlining of process steps and in terms of the standardization of analysis tools and analytical methods applied to data, all the way from low-throughput profiling to the specialized uHTS labs.
The system and process architecture guarantees data integrity and traceability of results from the time of plate and plate content registration up to the publishing of the final derived results to the warehouses. All intermediate data reduction and calculation steps and related results are stored and fully tracked, which includes storage of all calculation parameters for each of the modules used. Once raw data are loaded to the system, there is no direct (i.e., untracked) interactive way for modification of numerical results by a user; all numerical data processing can only be achieved by invocation of a defined calculation module and execution of a traceable (i.e., implicitly documented) step, all in the full spirit of “reproducible research.” The system only ever stores the last version of a calculation and its results. Together with proper synchronization of the warehouse contents, there is never any ambiguity about which “version” of data and calculation was finally used for publication from the laboratory level and shared with the overall discovery organization. The advanced capabilities for plate- and dose-response curve analysis, coupled with easy interactive exploration and—if necessary—adaptation of the calculations, allows controlling and maintaining the high quality of the published data.
Restrictions on Readout Data Structures
Some types of readout signals (e.g., temperature scans from differential scanning fluorimetry [DSF] experiments 20 ) or kinetic measurements with a large number of measurements per well (say more than ~100) (e.g., from Functional Drug Screening System [FDSS] reader signals) (Hamamatsu Corp., Bridgewater, NJ) cannot be directly loaded and analyzed by the Helios system because some of the data structures and analysis components were not initially designed to accept them. In these cases, we preprocess the plate data, typically by using web applications running R scripts (R Language; Foundation for Statistical Computing, Vienna, Austria) on the server side, and then generate a “reduced” data set, always together with suitable QC information for loading to Helios. For example, we do this for the determination of melting temperature shifts from high-throughput DSF measurements or for statistical characterizations of FDSS or Fluorometric Imaging Plate Reader (FLIPR; Molecular Devices LLC, Sunnyvale, CA) signals, which are not provided by the instrument software. These data are then further analyzed in the Helios system using the available standard set of modules. Kinetic analysis of shorter time series (say up to 50 time points) is directly possible in the system with a restricted set of reaction models (zero- and first-order kinetics).
In this sense, the Helios application is not very well suited for the direct analysis of raw data from “multidimensional” experiments (i.e., when data simultaneously depend on multiple variable experimental design factors, e.g., temperature and concentration, substrate concentration and inhibitor concentration, etc.), but we can often easily work with the preprocessed data. Such a raw data preprocessing step can essentially be considered a customized software extension of the specific plate reader software.
A future Helios application replacement (starting to be internally discussed and considered for future implementation on the Amazon cloud platform) will certainly be set up to fully support such multifactorial experiments and data structures and has correspondingly equipped analysis components. The NIBR informatics department has already gained considerable practical experience in building and deploying a similar “next-generation” system for scalable multivariate high-content imaging analysis of high-dimensional feature data sets running on the Amazon AWS cloud platform together with a user-friendly web-frontend. 8 This new application is presently being extended with capabilities for single-cell analysis and phenotype classification.
Application Usage and Performance Characteristics
The Helios application has a global NIBR user community of around 850 people. There are typically 50 to 60 users working on each of the two servers on a given day. Support for the system is provided by local super users and informatics experts at all of the sites, together with the core system experts in the NIBR informatics group who are occasionally consulted when specialized questions arise. Cumulatively, in these 10 years, the system has processed data for 1.02 million plate experiments (i.e., number of master plates, as per description in previous sections), corresponding to the upload of 2.8 million raw plate readout files from different assay plates and/or different types of signals and readouts.
The databases of the two servers jointly store raw and final derived values of 4 billion well-level values from primary screening and from dose-response experiments. As mentioned earlier, the various stages and versions of intermediate calculation results are stored as files and are not accounted for in this number. In addition, the results for 23.3 million dose-response curves were generated over this time, and this translates into the database storage of another 1.3 billion underlying result items (IC50 values, other curve parameters, various data quality and curve-fitting characteristics, classification and annotation information, etc.). Typical application performance numbers for key operations are shown in the Supplementary Information .
Challenges Encountered/Key Learnings
The Helios project started with a restricted scope of an “HTS system replacement” and was only later extended for use in profiling labs. The addition of functionality to support “assay panels” and panel-level operations for the latter was a rather big addition but did not result in a need to rewrite core parts of the application, mainly because the initial data structure and application design were done in a rather generic way. To get to the generic design, it was important to strongly involve scientist users from different areas employing a wide variety of assay and measurement technologies from the very beginning and have them commit sufficient time to the project. This was mainly achieved by including these “nonresearch” tasks in the personal yearly performance goals. Also, from the core informatics group’s perspective, it was of critical importance to have sufficient people (five) who were essentially dedicated 100% to this project during the design and main development phases, with no other tasks allocated to them, to be able to focus completely on this project and not be distracted by other activities.
A small “in-house” development group (at a time when the NIBR informatics department was still relatively small) would have been easily overwhelmed developing an enterprise software system of that magnitude. So, the efficient collaboration of the internal guiding project core team with a capable external scientific software development partner and building a trusted and stable relationship was a key step. For successful project execution, it was really important to not just “contract out” the development based on some requirements documents and hope to get to a working system but rather treat the offshore team members as a natural extension of the internal team and work together in an agile fashion with daily meetings and frequent mutual workshops and site visits.
When looking at the complexity of the screening and profiling processes, as well as the overall undertaking—reaching from sample and plate logistics, data capture, data analysis, integration with downstream warehouses, and many related automation steps—it is clear that it is only possible to manage this high complexity by establishing modular components and separating plate management and data capture into separate elements, setting them up also in a generic fashion, and designing clear interfaces between them and the “pure” data analysis components. Overall, the modularity also allows more easily making changes and adding extensions in one of the subsystems without affecting other system components.
The introduction and acceptance of consistent and complete barcoding of all plates in the high-throughput labs were not a problem, but in some of the lower-throughput labs, we had to initially spend more time on educating the users and demonstrating the net benefits of this “additional” step. By now it is perfectly understood and accepted by the whole user community. Barcode uniqueness and range assignment are managed by the plate management system, both for prebarcoded plates from external suppliers as well as internally printed labels.
Supplemental Material
DISC752140_Supplemental_Information_revised – Supplemental material for Helios: History and Anatomy of a Successful In-House Enterprise High-Throughput Screening and Profiling Data Analysis System
Supplemental material, DISC752140_Supplemental_Information_revised for Helios: History and Anatomy of a Successful In-House Enterprise High-Throughput Screening and Profiling Data Analysis System by Hanspeter Gubler, Nicholas Clare, Laurent Galafassi, Uwe Geissler, Michel Girod and Guy Herr in SLAS Discovery
Footnotes
Acknowledgements
We acknowledge the many discussions and the important input we have gotten over many months from an interdisciplinary group of key NIBR screening community representatives and early adopters of the initial test releases of the software (Jutta Blank, Johannes Ottl, Christian Parker, Adam Hill, Ji-Hu Zhang, and many unnamed others) and also extend our thanks to the software engineering and numerical algorithms development teams at GGA Software Services LLC, now forming a part of EPAM Systems, Inc., which were led by Andrey Feoktistov and Vladimir Shwartz, respectively. They have built the application based on the definition of mathematical methods, processes, interfaces, GUI aspects, and key data structures designed by the internal NIBR informatics team but have strongly contributed to many of the technical implementation details. A big push for some extensions and placement of a second server on the Cambridge site in 2009 came from a newly established uHTS group for large-scale small interfering RNA and cell line profiling work under the principal leadership of Chris Wilson, with collaboration of many others, of course. For the more recent design and work on addition of the electronic lab notebook link, we extend our thanks to Wajahat Sheikh, Renato Truffer, and Ilya Sukhotin. Last but not least, we also thank Thomas Hein and Remy Evard, previous and present NIBR CIOs, for the support they have provided to bring our original first ideas on how to build an efficient screening data analysis system to fruition and who were convinced, together with us, that an in-house development of such a system provided great advantages in terms of overall quality and consistency of information and process integration, standardization of analytical approaches, and great flexibility to adapt and extend the technical interfaces whenever needed.
Supplementary material is available online with this article.
Declaration of Conflicting Interests
The authors declared no potential conflicts of interest with respect to the research, authorship, and/or publication of this article.
Funding
The authors received no financial support for the research, authorship, and/or publication of this article.
References
Supplementary Material
Please find the following supplemental material available below.
For Open Access articles published under a Creative Commons License, all supplemental material carries the same license as the article it is associated with.
For non-Open Access articles published, all supplemental material carries a non-exclusive license, and permission requests for re-use of supplemental material or any part of supplemental material shall be sent directly to the copyright owner as specified in the copyright notice associated with the article.