
Abstract
High-throughput screening (HTS) has historically been used by the pharmaceutical industry to rapidly test hundreds of thousands of compounds to identify potential drug candidates. More recently, academic groups have used HTS to identify new chemical probes or small interfering RNA (siRNA) that can serve as experimental tools to examine the biology or physiology of novel proteins, processes, or interactions. HTS presents a significant challenge with the vast and complex nature of data generated. This report describes MScreen, a Web-based, open-source cheminformatics application for chemical library and siRNA plate management, primary HTS and dose-response data handling, structure search, and administrative functions. Each project in MScreen can be secured with passwords or shared in an open-information environment that enables collaborators to easily compare data from many screens, providing a useful means to identify compounds with desired selectivity. Unique features include compound, substance, mixture, and siRNA plate creation and formatting; automated dose-response fitting and quality control (QC); and user, target, and assay method administration. MScreen provides an effective means to facilitate HTS information handling and analysis in the academic setting so that users can efficiently view their screening data and evaluate results for follow-up.
Introduction
High-throughput screening (HTS), by definition, is a brute-force approach to assessing large libraries of chemical compounds or gene knock-downs for their ability to inhibit or activate a target or pathway. Although this approach has traditionally been used by the pharmaceutical industry, it has also been adopted recently by many academic and nonprofit centers.1,2 This became possible because of the availability of commercial screening libraries and reduced costs of automation. One component of HTS that has remained challenging is the efficient handling and analysis of large data sets. Although there are some commercial solutions, to our knowledge, only a few open-source solutions 3 try to address these challenges within an academic HTS environment. A recent review 4 reports the significant impact of open-source software on areas such as bioinformatics but states that the impact on drug discovery has not been as successful.
There are a number of unique challenges in the informatics of academic HTS. Unlike a large commercial operation, there is often not a strong information technology (IT) infrastructure to back up the screening center, and costly annual site licenses for software may be prohibitive. Chemical libraries are often obtained somewhat helter-skelter so they may be studied in subsets rather than as a fully integrated institution-wide library. Screening equipment may be obtained from numerous sources with different file formats, which, combined with limited IT support, makes data transfers complex. Information access may also be done using different models. For internal users at the University of Michigan Center for Chemical Genomics (CCG), there is a policy of open sharing of data. But in other settings, individual screening data sets may be restricted to a particular investigator’s laboratory personnel. Finally, different types of materials may be used in screening, including simple-compound libraries, crude extracts (substances), mixtures of compounds, or even biological materials such as RNAi collections.
In this report, we describe MScreen, our solution to a number of these challenges. The basic structure of the system is a secure, Web-based, open-source data system built primarily using free or low-cost software tools. A user authentication system and administrative management tool provide access for both internal and external users as well as control at the level of laboratory groups. MScreen is available for free to the academic and nonprofit community, and commercial licenses are available as well.
The basic functionality includes a laboratory information management system for compound and small interfering RNA (siRNA) inventory, compound and assay plate management, and tracking of HTS results. MScreen provides statistical analysis of primary results with some data cleaning and flexible hit identification and hit-picking file outputs. Dose-response follow-up data are automatically analyzed by nonlinear least squares (NLLSQ) methods with an efficient quality control (QC) system to confirm the validity of fits. In addition, MScreen facilitates decision making by allowing researchers to
Cross-reference screening data from other members of the collaboration with integrated screening data views
Run chemical structure searches to mine biological data on related compounds
Generate and export comprehensive structure-activity relationship (SAR) tables
Materials and Methods
Database and Software
MScreen has been developed as an open-source package and can be deployed on any operating system that supports the installation of a Web server and a database server. Although most computing environments generally use dedicated machines for their Web server and database server for security and scalability, MScreen can run just as well with both servers installed on the same machine. The user interface for accessing MScreen is functional across all standard Web browsers that can securely connect to the Web server. Even though the primary development database for MScreen is Oracle, it offers support for MySQL. The application scripting language is PHP, which can communicate with both Oracle and MySQL databases using PHP’s built-in database objects (PDO) extension. The MScreen software package includes the schema for both Oracle and MySQL and the application scripts that render the user interface. MScreen relies on external applications for some functionality, and the list of software and terms of license are listed in the supplement.
Results and Discussion
System Architecture
MScreen runs on a multitier Web-based system where the front-end client is a standard Web browser and the back end is a relational database (RDBMS)—Oracle or MySQL—whereas the middleware application consists of server side scripting language—PHP—running on an Apache Web server with secure authentication system that uses Apache’s built-in authorization and authentication routines. The PHP application translates all user requests into SQL queries for the RDBMS server to process. The data retrieved are presented to the Web browser in Hypertext Markup Language (HTML) formatted output.
System Framework
To understand the operational functionality of MScreen, it is necessary to define the system entities and actions that form its framework. The system entities are either physical—mapped to database tables—or functional—defined by the application software. The system actions are functional processes imposed on the system entities since they are always performed at the level of the application software. All entities and actions are grouped into one of the three software systems: stock library management (SLM) system, the HTS results (HTSR) system, or the user administration (UA) system, as shown in Figure 1 . A “collection” is a functional entity that consists of pure compounds, substances, or siRNA that are the physical entities. The HTSR system stores raw and normalized data generated in a high-throughput screening (HTS) laboratory and connects them to the collection samples. “Screens” is a functional entity that represents one of three types of data—those from primary screening assays, dose-response assays, or follow-up assays. The system actions associated with screens are normalizing, searching, and exporting to external applications, which are all enabled by the application software. The HTSR system offers various tools to normalize results that are discussed below. The UA system is responsible for managing users and maintaining their access privileges. A user is a functional entity that consists of two physical entities—investigators and laboratory members—and every laboratory member is associated with an investigator. The UA system assigns an access group to every investigator; the laboratory members registered under an investigator automatically inherit his or her access group. There are three types of access groups: administrators, internal, and external. All internal users share their screening libraries and assay data with other internal users but cannot view compounds and screens from external users. External users can only examine data and other information for their registered compounds and assays but cannot view data from any other external or internal users. An administrator has administrative privileges in managing all users as well as the screening libraries and assay data. The UA system also tracks every user that logs in, and any changes to the compound management or to the screening data are captured in an audit trail.
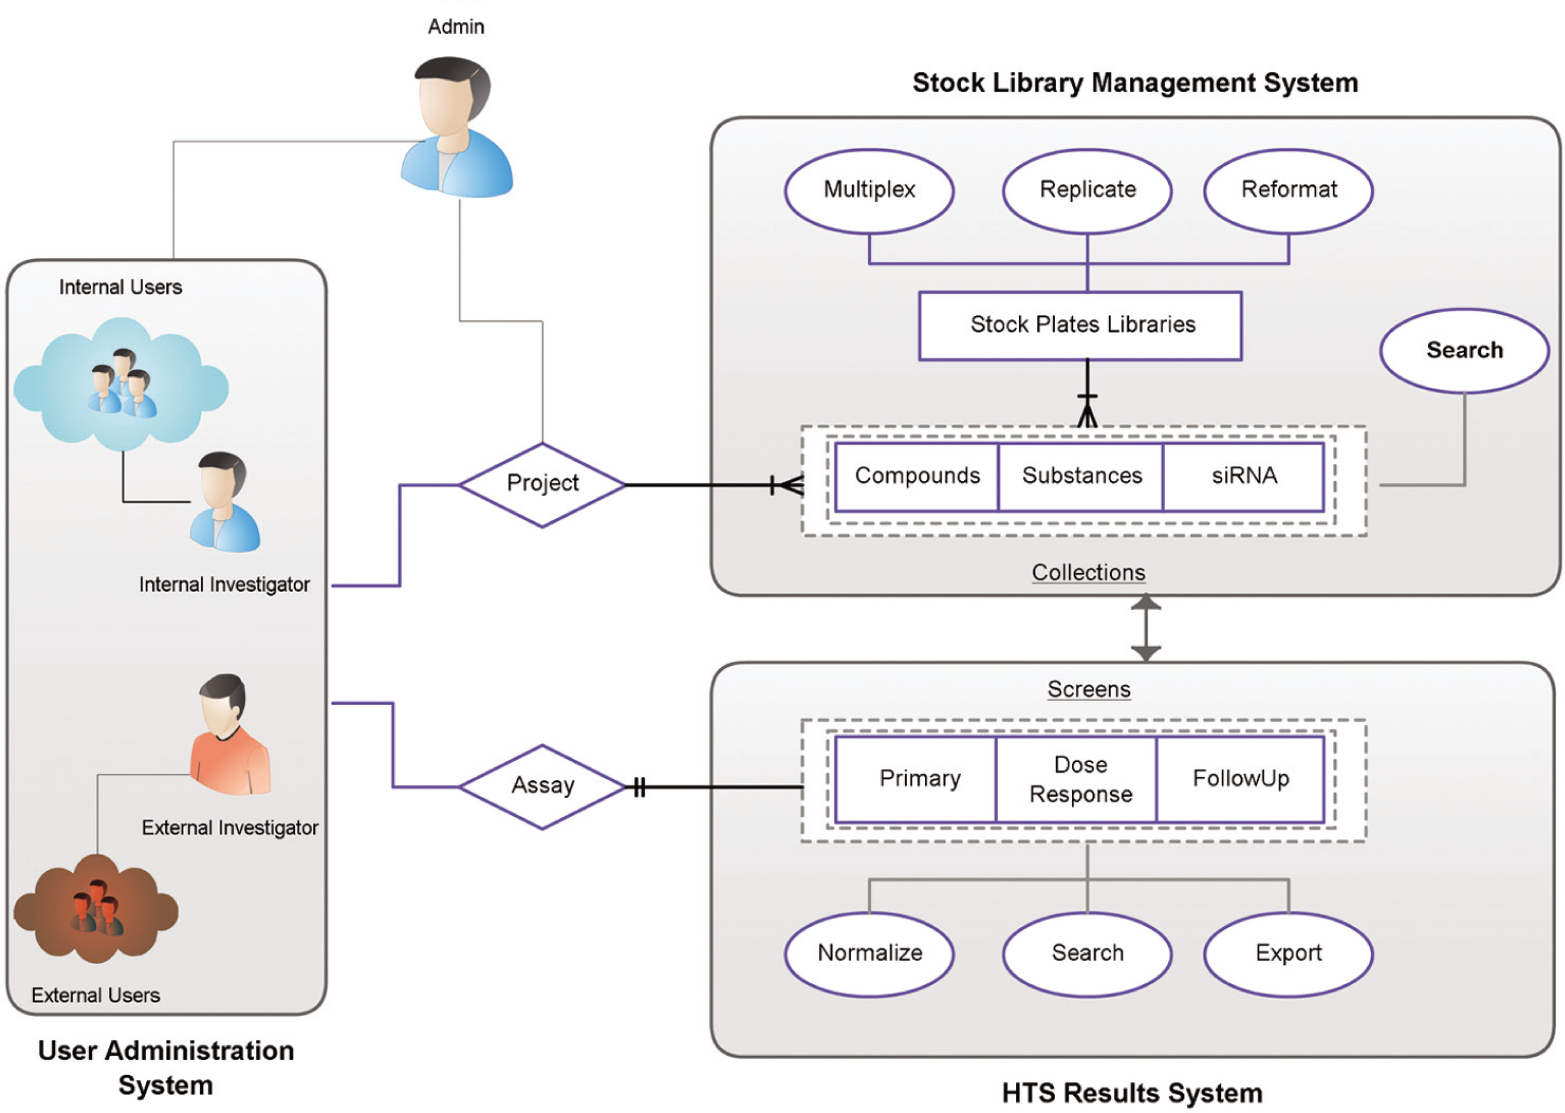
MScreen framework: systems, entities, and actions. As part of records management, the MScreen stock library management (SLM) system stores plate information from its original sources and assigns unique barcodes to the stock and assay plates as well as maintains records of vendor barcodes or identifiers. The high-throughput screening results (HTSR) system captures screen information (such as target ID, species, therapeutic area), as well as assay methods, detection protocols, and assay-specific annotations for every assay run. During the data import, the HTSR system validates the assay plate barcode and verifies the stock plates with the SLM system before mapping them together.
Library Registration
MScreen defines a library as one or more collections of pure compounds, siRNA, or substances. The substances could be natural product extracts, fractionated samples, or mixtures of compounds. For natural products, substances are mapped to their respective strains, whereas siRNA are mapped to gene identifiers. The documentation for MScreen offers instructions on importing physical and chemical data from compounds supplied by vendors of these collections. MScreen uses ChemAxon JChem software (ChemAxon, Budapest, Hungary) to generate and store chemically hashed structural fingerprints of every compound in the collection that are required to run structure searches. MScreen can run as a compound and data management system without the ChemAxon JChem software. The registration of libraries is a one-time process to be completed whenever a new collection is acquired. This process ensures that the samples in mother plates are registered. The SLM system can manage library stock replication of mother plates into daughter plates and reformat plates (96-well to 384-well and 384-well to 96-well or 1536-well) or create plates of compound mixtures (multiplexed compounds). MScreen can also be used to store plate information from other facilities (see Fig. 1 ).
The SLM system also provides cherry-picking tools for generating confirmation and dose-response plates and debits the volume of chosen daughter plate in silico. These cherry-picking tools are very flexible and offer screeners the option to run up to five replicates per sample in a variety of fold compound dilutions in either direction across the plate. The plate maps for the mother and reformatted daughter stocks as well as cherry-picked plates are stored within the SLM system. The stock plate library interface displays a graphical representation for every plate and each well, which, when selected, displays the structural image (if known) for the sample in that well, along with a link to view additional sample details.
Data Workflow
Figure 2
shows the overview of the data workflow. MScreen converts the data output from instrument generic formats (csv, dat, xls, txt) to an annotated comma-separated value (csv) format. Alternately, MScreen accepts annotated csv files that are manually or programmatically created from plate readers whose output formats are not currently supported. An example of such an annotated csv file is provided as supplemental information (

where x is the raw output for each sample, µ is the mean of the samples and/or negative controls, and σ is the standard deviation of the samples and/or negative controls.
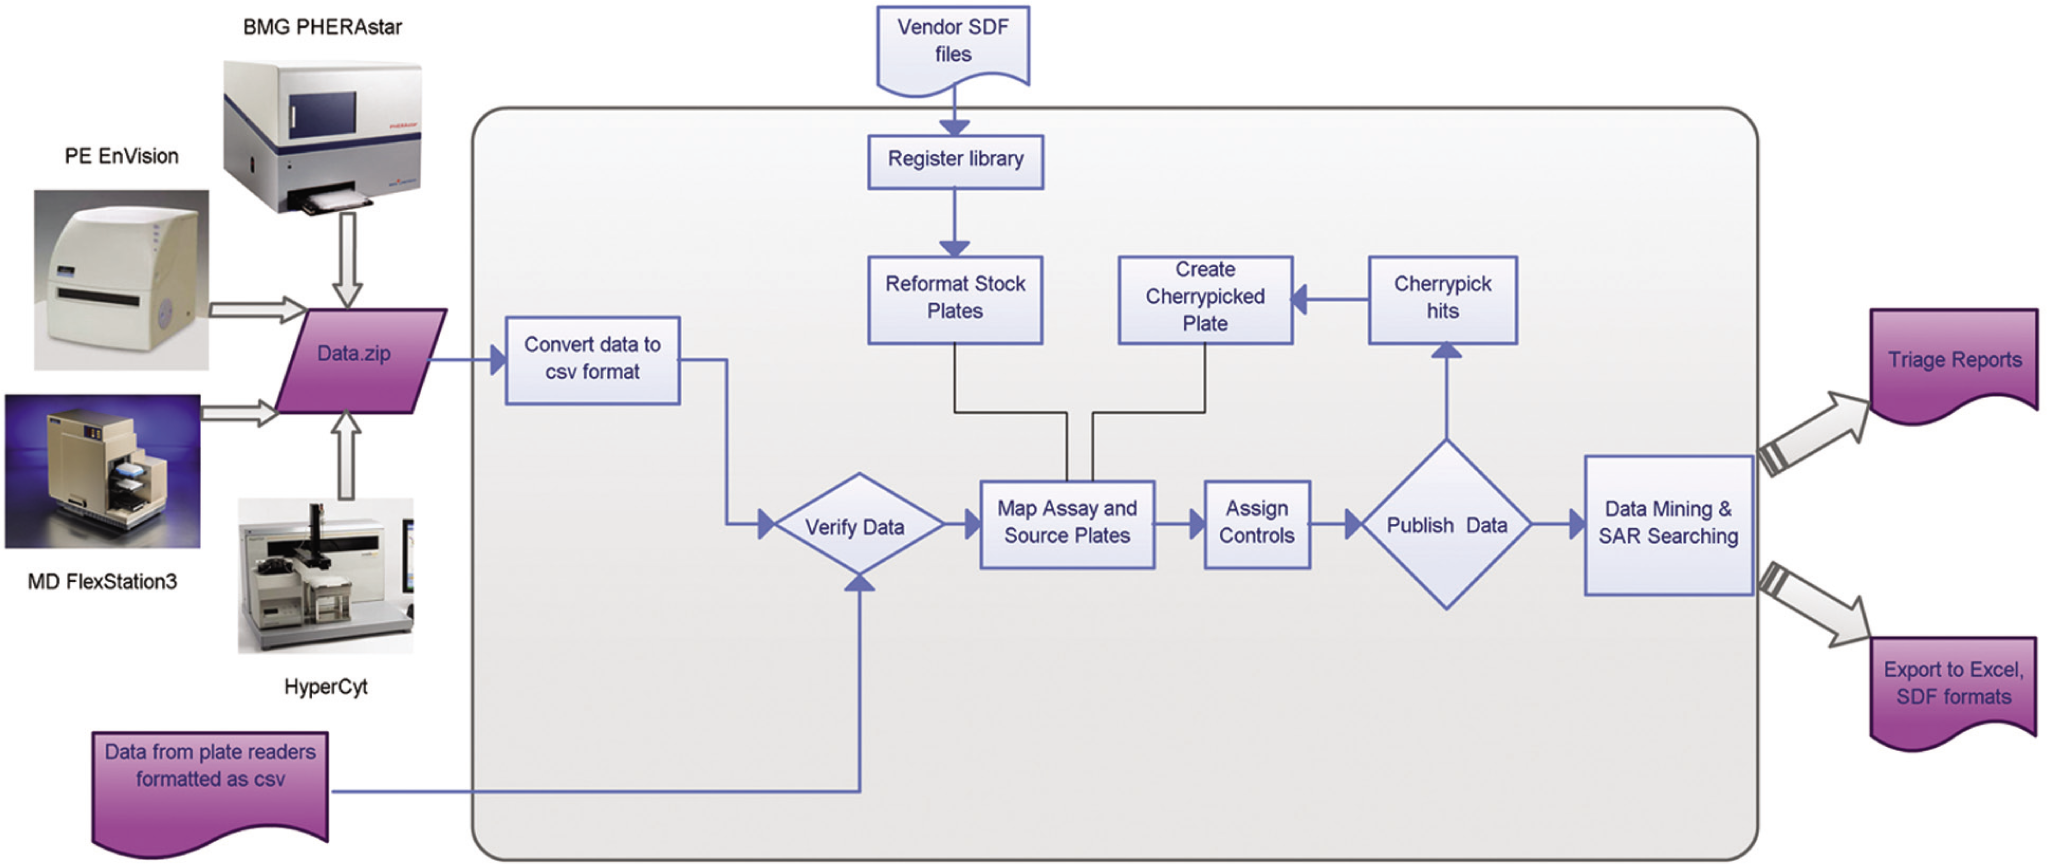
Workflow diagram showing high-throughput screening (HTS) data movement through MScreen. Data enter MScreen from several types of plate readers in Excel or csv format, and simple macros are used to link these to source plate barcodes. Raw data can be automatically loaded into MScreen as long as they output data in generic formats (csv, txt, xls, dat). If the plate reader does not have a generic output, then human intervention is required, and the MScreen package offers sample Visual Basic macros to run this conversion. These macros can be customized to run with the reader in the respective laboratories. When uploaded to MScreen, the data are mapped to source plates previously entered into the database from vendor sdf files. Data output from MScreen can be obtained in the form of reports in csv, Excel, or sdf formats.
The HTSR system also computes the median absolute deviation, which has been found to be more effective when identifying hits in siRNA screening projects. 5
Once results from an assay have been published by an administrator, MScreen offers users the option to browse and search the imported results. The system generates scatter plots for the entire assay ( Fig. 3 ), as well as for the screening campaign, and reports the Z′ 6 (Z factor) by assay and by plate. If an assay plate does not report a satisfactory Z factor or needs to be rerun because of systematic errors, it can be excluded from the assay (either before or after the assay is published).
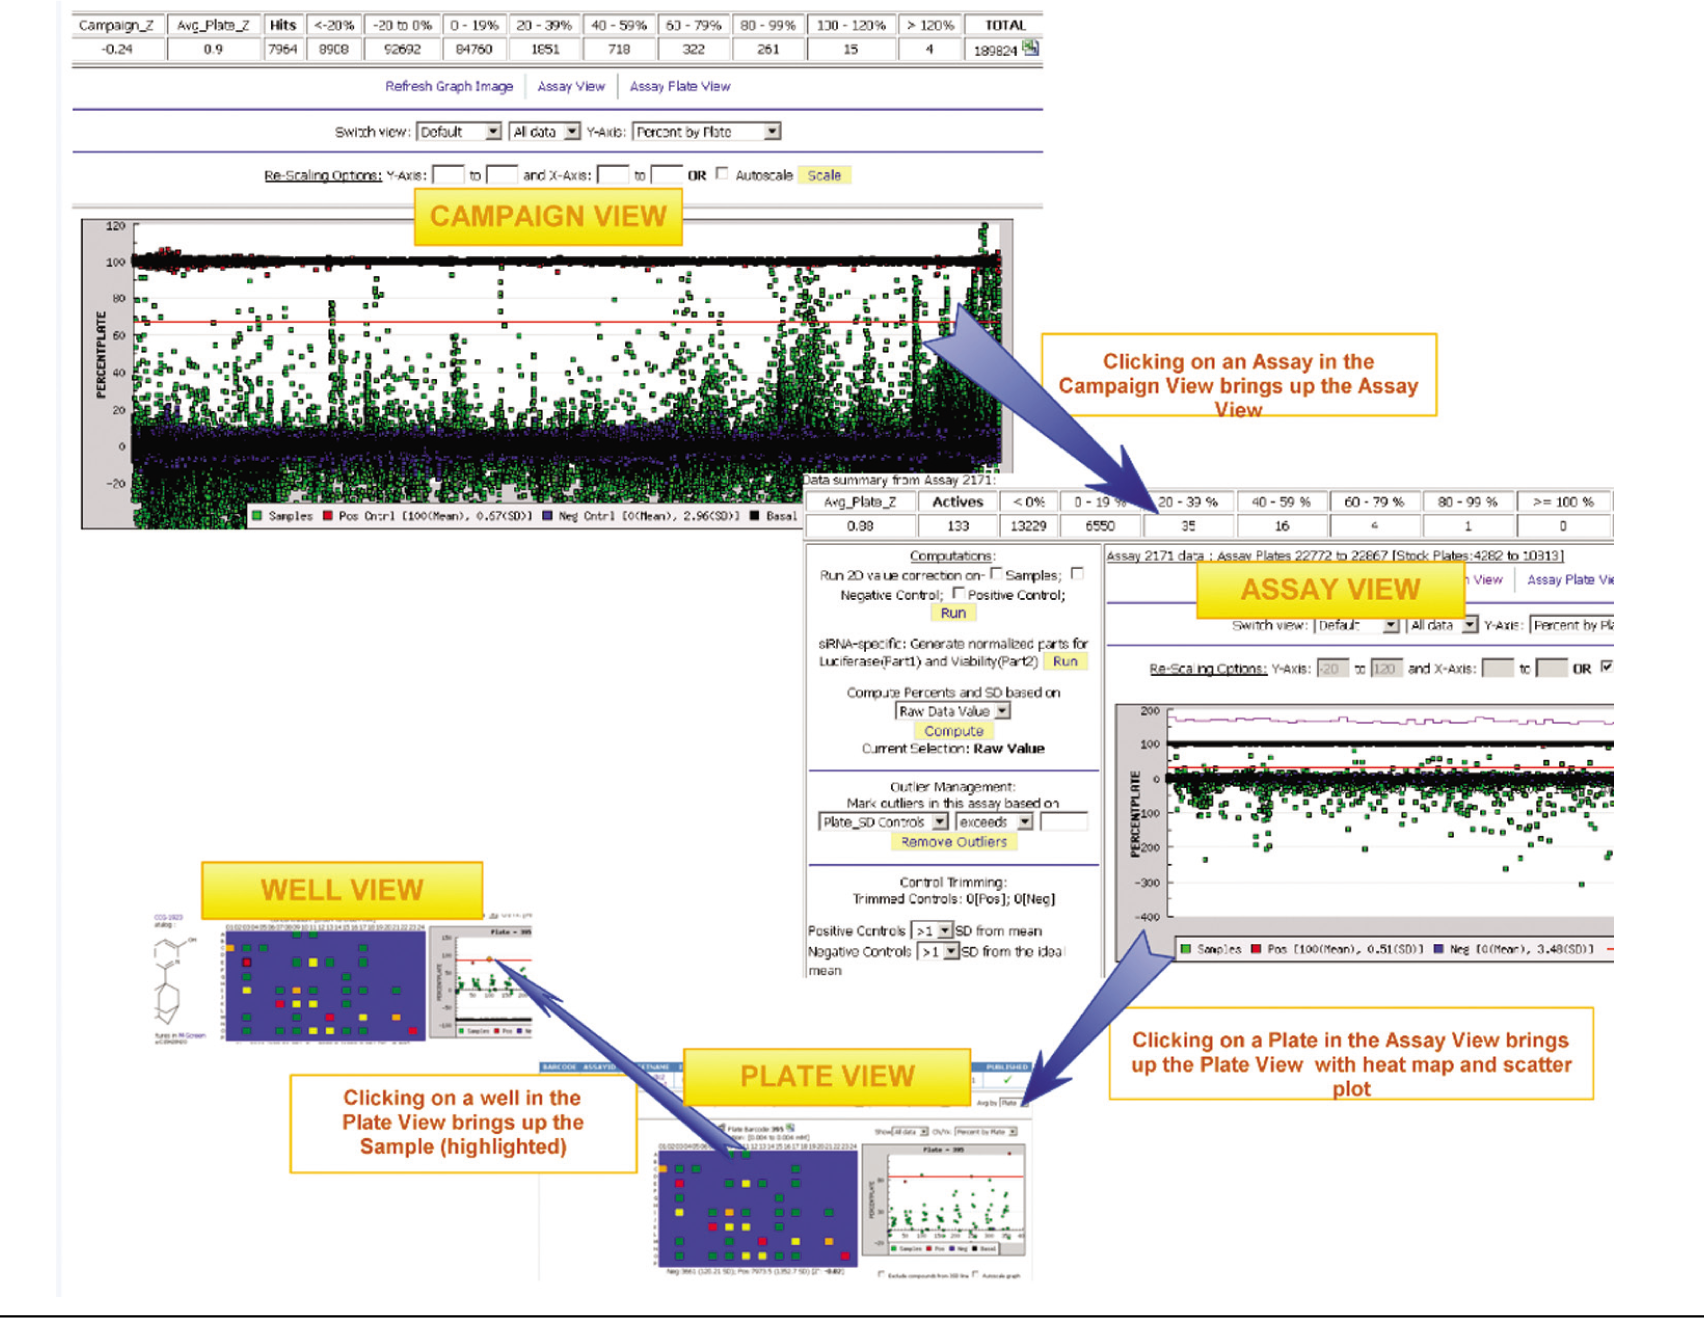
Campaign-assay-plate view. This figure shows the navigation between a screening campaign (on a collection of 175 14;000 samples) view, assay view, and plate/well view. The samples are in green, the positive controls are in red, and negative controls are in blue. The red line shows the 3 standard deviation (SD) criteria, and the purple line is the Z factor for each plate. The computations, outlier management, and control trimming are all administrator options for normalizing or smoothing data. It is possible to adjust scaling for either x- and y-axis to magnify sections of the assay for specific views. The user can also switch views for viewing only controls or samples as well as the values and percent by plate or assay (y-axis). Due to graph caching and query optimization, a 384-well assay plate view with heat maps take about 1.5 s to load, whereas a 200 14;000–sample campaign view takes 16 s (tested on Mozilla Firefox and Google Chrome).
The primary assay and campaign views give users the option to look for variability across rows, columns, and controls and thereby examine output variations such as signal decays or time correction from one assay or plate to the next. In addition to administrative review to identify pipetting errors, the assay view interface offers various tools for correcting and normalizing data.
A quadratic linear regression-based correction can be applied to data that show uniform signal variation across rows or columns or across the whole plate. MScreen uses row identifier (X) and column identifier (Y) and well identifier (W) for deriving the parameters (K, R, C, A, and B).

where CV is the corrected value, Z is the observed signal that needs to be corrected, and M is the mean observed signal value.
MScreen also offers options to automatically trim outliers from samples by selecting an outlier threshold using the raw and computed values for an assay. The option to trim controls using quartiles or SD is also an effective tool within MScreen when there are a large number of controls. The samples and controls can also be manually trimmed by deselecting the respective wells from the assay plates. MScreen offers the option to undo the manual and automatic trims at all times. The primary assay plate user interface (
Fig. 4
) displays the layout of the assay plates with the heat-map (blue to red in increments of 20% activity— inhibition or stimulation) and scatter plots with three standard deviations (3 SD) from the sample and/or control mean cutoff line. MScreen provides the ability to identify plate actives using an activity cutoff (e.g., percent inhibition >50%) or by distribution score (e.g., Z score >3) or by selecting the custom threshold set by the user. The default setting for “hit” activity in the HTSR system is a sample with a value 3 SD or above the mean value of the negative control. This setting can be modified when the results are entered, or an administrator can choose to override this criterion with a different threshold (e.g., 70% activity). When a sample has been tested more than once in a screening campaign, the HTSR considers the sample “active” against that target if it has been a “hit” in at least 50% of all assays within the campaign. This definition of an “active” sample is very useful to cherry-pick and retest the initial hits from primary screens run in duplicate or even triplicate at a single-point concentration. The activity search feature (
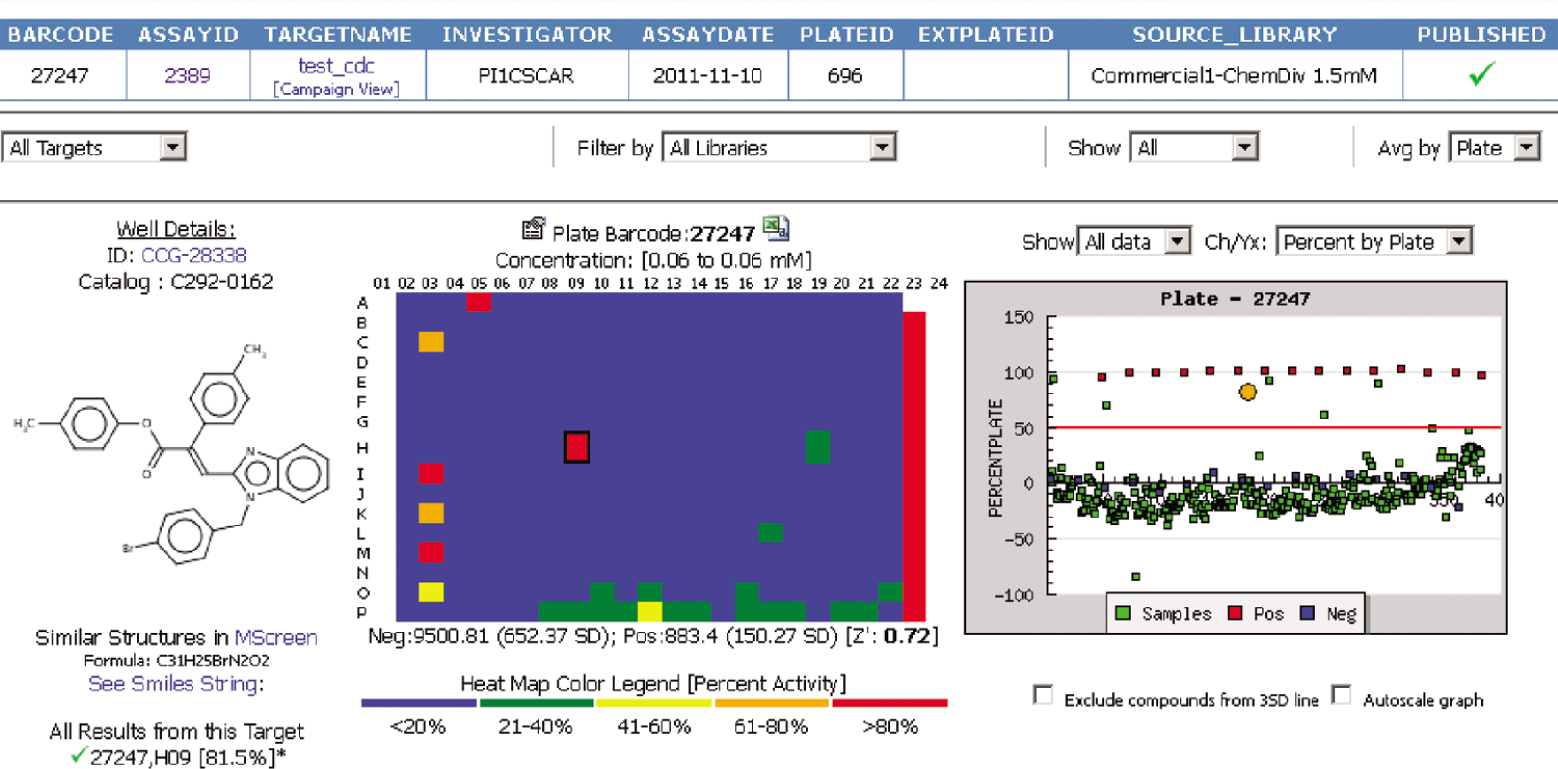
Assay plate view: heat map and scatter plot of samples and controls used in the assay plate. Selecting any well on either heat map or scatter plot links to the other. When the well on the heat map is selected, it shows the respective sample structure and highlights the well position on the plate map and scatter plot with a larger orange circle. Similarly, when a sample or control box is selected on the scatter plot, it is highlighted on the plate map with a black outline around the well. The “Well Details” portion of the view displays ID, brief catalog information, and a structure (if available). The “Search Similar Structures” link launches similarity search powered by ChemAxon, and the “All Results from this Target” displays the results for the selected sample as it has been retested on the selected target.
Often, the next step in a screening process is confirming the actives from a single-point concentration by testing in a concentration curve analysis (e.g., n-fold serial dilutions) generally using the same assay method used for the primary screen. The dose-response data from an instrument are imported into MScreen, which uses GRETL (http://gretl.sourceforge.net/)—an open-source econometric package—to run nonlinear least squares analysis for determining the concentration that gives 50% maximum effect (IC50)— inhibition or stimulation—and Hill slope. MScreen uses a variable slope sigmoidal equation to fit the measured values and determines dose-response parameters as follows:

where X is the logarithm of concentration and Y is the response. Y is the % value that starts at the Bottom and goes to the Top with a sigmoid shape.
An efficient QC method permits rapid viewing of the data and associated fitted curve. If the automated fitting provides a result that is not supported by the data, the investigator can introduce constraints (e.g., fixed lower value equal to mean negative control, fixed slope [e.g., Hill slope = 1], etc.). Every compound can be examined in an integrated data view that gives the entire screening history on the compound. In the example for LARG_Ga13 screen,
7
39 plate actives from the primary screen proceeded to a dose-response study. However, an examination of the integrated data views (
Medicinal Chemistry Follow-up
The utility of MScreen extends into early medicinal chemistry follow-up of HTS assays. The final selection of the best leads from a list of confirmed actives is usually dependent on the observation of “rational” SAR (i.e., a wide range of potencies induced by relatively small molecular changes). 8 The interface of MScreen with Excel facilitates this critical decision-making process by allowing the rapid generation of
Tables of commercially available analogs for SAR expansion using the vendor library source option
Global data tables from the original HTS data set that contain structures, activity, calculated physical properties, and overall hit rate in other HTS assays
Focused SAR tables based on specific substructure searches (e.g., variation of a single substituent on a lead template)
The ease with which MScreen assists in the expansion and compilation of SAR facilitates an informed selection of the most promising HTS actives for medicinal chemistry follow-up.
Case Discussion
MScreen enables triaging hits from a single target and also helps identify promiscuity. One of the instances is of Kex2 and Furin
9
that are homologous pro-protein processing proteases and have nearly identical 3D structures of their catalytic domains. The screening objective was to identify candidate small-molecule inhibitors for Kex2 and Furin, as well as finding probes that exhibit limited cross-inhibitory activity. These assays were run independently, but MScreen searching identified both compounds in common as well as those from each target (
Another example of MScreen’s utility in triaging screening hits is demonstrated in the FurinPC screen, which is a cell-based screen that measures secretion of soluble alkaline phosphatase as a reporter of processing and cleavage by Furin. 10 The plate active threshold (Z score >3) identified more than 1000 “hits” on a 30 14;000 diverse compound library. MScreen results from other screening targets eliminated toxic compounds and other nonspecific inhibitors of cellular processes. Using the search filter tool, the total number of hits specific to that target was reduced to 100 compounds. Yet another example of this useful feature is demonstrated in the recent publication of a complementary screening approach where the activity of two targets with a large collection of natural product extract samples could be assessed. 11 The CCG has used these triaging capabilities within MScreen using the activity or inactivity from other campaigns for almost 80 targets to date.
Poly-Plex: Multiplexing Compounds and Multiplexing Targets
With the increasing number of compounds that are available for screening, for some relatively lower throughput screens (e.g., high-content screens or flow cytometry screens), it may be necessary or cost-effective to perform assays using compound mixtures and/or on multiplexed targets. MScreen allows up to 10-fold multiplexing of compounds by registering them as “substances” and considers each of the multiplexed targets as an individual screen. An example of such a screen was the “poly-plex” RGS protein screen previously published.
12
The Boolean query capability allows users to query all plate actives from a multiplex RGS family screen that were selective for RGS4 and RGS7 but did not inhibit RGS9 or RGS16 (
Filter-Specific Triage
All target-based screening approaches suffer from bias in data sets due to compound interference or off-target effects. Since many targets use similar screening methodologies, an integrative approach to data analysis can be used to remove these nonspecific compounds and thereby conserve resources to pursue bona fide hits. Mammalian cell-based assays represent a specific challenge for screening campaigns as some compounds can affect cell viability. For cell-based assays using reporter detection, the potential compound interference with common methods such as luciferase has been reported. 13 These false positives will also increase the number of actives identified and burden many screening centers that have limited resources for retesting. As cell-based assays usually have higher hit rates than biochemical assays and follow-up screening can be more labor intensive, MScreen’s ability to use the results from previous screening campaigns to “filter” by removing actives from screens with similar assay methods reduces the number of compounds needing retest. One example of this MScreen utility is demonstrated by the WEEV (Western equine encephalitis virus) cell-based assay that used luciferase reporter gene expression. 14 The WEEV campaign used two selection criteria to generate 196 compound hits with >70% inhibition and then used comparative screens to remove 84 compounds that had shown activity on other luciferase reporter screens. The primary validation assay was performed on 114 selected compounds with 67.5% confirming in dose-response titration curves, and an active scaffold was identified in secondary and tertiary screens.
In another example of this MScreen utility, another cell-based screen with a firefly luciferase reporter was performed. 11 The primary screening triage was performed by selecting compounds that inhibited luciferase activity (Z score >3) relative to the negative controls on each plate. Out of a total of 53 14;872 compounds tested, 7412 compounds were identified (~13.7% “hit rate”) in this screen. Using the MScreen filters, these plate actives were prioritized using other, mammalian cell-based, loss-of-function, luminescent reporter detection assays as they represented compounds that were likely toxic to cells or could interfere with luminescent reagents; 2812 such compounds were identified as affecting multiple screening assays. Using a set of reactive structural filters developed at the CCG, MScreen identified 51 compounds with “B” (black) flags as these are compounds with structures the National Institutes of Health (NIH) does not allow in its screening collection because of reactivity or known toxic substituents. 15 MScreen also calculates the HTS “promiscuous index” developed by the CCG and for those compounds that were tested in multiple (>30) screens and active in >30%. Using this promiscuity filter, 136 compounds were filtered out for a total of 2999 compounds eliminated based on these criteria. Using MScreen filtering features, we were able to rationally prioritize to a list of 4413 compounds (8.2%) for the confirmation assay.
Incorporating results from counterscreens and control screens is also advantageous in early stages of screening. Using the above-mentioned campaign, the confirmation set of 4413 compounds from the primary screen was tested at the same concentration as the primary assay (10 µM), but with an additional step in the protocol to determine target specificity (counterscreen). These compounds were tested in a comparative assay, and the MScreen search activity feature was then used to filter the confirmation results to eliminate nonspecific compounds. In total, 916 compounds were identified as specific inhibitors for further dose-response studies, reflecting a 20.7% hit rate from the confirmation compound set and a 1.7% hit rate from the primary screen.
MScreen is a comprehensive drug discovery information management system designed for scientists and laboratory personnel that suits both novice and expert users. Although MScreen provides basic tools to upload and analyze the vast amount of screening data, its greatest strength lies in the ability to assimilate data from different screens and generate meaning from the possible serendipity created in HTS. MScreen helps researchers to capitalize on another’s knowledge and integrates all elements of the discovery process to be performed in a single environment, thereby reducing support burden and improving experimental workflow.
Footnotes
Acknowledgements
The authors thank David Miller, Andrew Fribley, and Robert Fuller for allowing us to cite their assay data as examples in highlighting the various features within MScreen.
Declaration of Conflicting Interests
The authors declared no potential conflicts of interest with respect to the research, authorship, and/or publication of this article.
Funding
The authors disclosed receipt of the following financial support for the research, authorship, and/or publication of this article: The development of MScreen was supported (in part) by the National Institutes of Health through the University of Michigan’s Cancer Center Support Grant (5 P30 CA46592).
References
Supplementary Material
Please find the following supplemental material available below.
For Open Access articles published under a Creative Commons License, all supplemental material carries the same license as the article it is associated with.
For non-Open Access articles published, all supplemental material carries a non-exclusive license, and permission requests for re-use of supplemental material or any part of supplemental material shall be sent directly to the copyright owner as specified in the copyright notice associated with the article.