
Abstract
Mass spectrometry (MS) is known for its label-free detection of substrates and products from a variety of enzyme reactions. Recent hardware improvements have increased interest in the use of matrix-assisted laser desorption/ionization time-of-flight (MALDI-TOF) MS for high-throughput drug discovery. Despite interest in this technology, several challenges remain and must be overcome before MALDI-MS can be integrated as an automated “in-line reader” for high-throughput drug discovery. Two such hurdles include in situ sample processing and deposition, as well as integration of MALDI-MS for enzymatic screening assays that usually contain high levels of MS-incompatible components. Here we adapt our c-MET kinase assay to optimize for MALDI-MS compatibility and test its feasibility for compound screening. The pros and cons of the Echo (Labcyte) as a transfer system for in situ MALDI-MS sample preparation are discussed. We demonstrate that this method generates robust data in a 1536-grid format. We use the MALDI-MS to directly measure the ratio of c-MET substrate and phosphorylated product to acquire IC50 curves and demonstrate that the pharmacology is unaffected. The resulting IC50 values correlate well between the common label-based capillary electrophoresis and the label-free MALDI-MS detection method. We predict that label-free MALDI-MS-based high-throughput screening will become increasingly important and more widely used for drug discovery.
Introduction
Mass spectrometry (MS) is a well-established tool for many areas of drug discovery. 19 Recently, the desire to also apply MS techniques to high-throughput screening (HTS) for hit discovery has strongly increased. So far, limitations concerning sample preparation, as well as measurement and analysis speeds, prevented the use of MS for HTS approaches. However, new advancements have made matrix-assisted laser desorption/ionization (MALDI) MS technology an ideal candidate for hit identification with the promise to open up new possibilities in high-throughput drug discovery.1,2,5
Until recently, the pharmaceutical and research screening community considered fluorescent-and chemiluminescent-based bioanalytical detection methods the preferred assay platform for isolated enzyme assays. Those assays are sensitive and fast, with a high degree of reproducibility and repeatability, and they are universal methods to evaluate a variety of targets. However, one of the biggest challenges is false-positive or false-negative readouts. Those false readouts are a common concern and are usually caused by certain compound properties that enhance or quench fluorescent or chemiluminescent signals. 4 MS-based assays have the potential to overcome those challenges and therefore could be viable alternatives.
MALDI is one of the methods that have shown several advantages, like an excellent signal-to-background ratio, high precision, and reproducibility.5,6 Additionally, MALDI-MS is considered a highly sensitive technology that allows simultaneous detection of multiple assay components. 10 Furthermore, MALDI-MS is a label-free detection method that offers the possibility of direct quantification of assay components like substrates and products of enzymatic reactions.7,9 Therefore, it would eliminate the need for specific antibodies or fluorescent labels. This significantly reduces reagent cost compared with the commonly used fluorescence-based assays. Additionally, the use of label-free detection methods reduces the risk of interference, thereby decreasing false-positive or false-negative hits. 8 Since label-free assays will not require extensive interference assays, they also have a positive impact on resources for assay development and HTS. Due to these advantages, the demand to optimize MS for HTS has risen over the last years. Still, to use MALDI-MS routinely for screening applications, several requirements concerning technology, sample preparation, and assay development have to be taken into consideration. Addressing those challenges has been a major focus of the HTS field.3,11,12,15
The launch of Bruker’s RapifleX MALDI Pharma Pulse (Bremen, Germany) has given the field a boost in measurement speed and throughput, which enables analysis of about 600,000 to 1 million compounds per week on a single platform. This single platform contains an integrated MALDI-MS system as a “in-line reader” and all other equipment for high-throughput applications, like compound addition and incubation ( Suppl. Fig. S3 ). With this step forward in technology, the remaining challenges that have to be overcome for incorporation of a MALDI-MS workflow into HTS are assay development and MALDI sample preparation. First, for assay development it was shown before that certain conditions within a biological assay decrease the ionization efficiency of the analytes. 13 Therefore, particular attention has to be given to the choice of buffer and assay components. Furthermore, there is a pressing need to reevaluate commonly used assays and implement the use of MS-suitable assay components while ensuring the biochemical and pharmacological activities of the enzymes. Additionally, challenges in MALDI sample preparation and subsequent transfer to the MALDI target have to be addressed. Clearly, the demand for 1536 compatibility and the handling of small-volume reactions allowing high sensitivity are additional requirements. 14 Therefore, a need to evaluate widely used existing HTS technology has emerged in the field.
Here we demonstrate the technological feasibility to adapt an existing kinase assay to MS-compatible conditions while still keeping the pharmacological characteristics that allow evaluation of compound activity. We further demonstrate the potential to utilize the Echo 550 acoustic liquid handler for sample transfer to a MALDI target. This enables the use of an MALDI mass spectrometer as an in-line reader in an HTS workflow of an existing platform.
Material and Methods
Materials
α-Cyano-4-hydroxycinnamic acid (4-HCCA, 70990-1G-F) was purchased from Sigma-Aldrich Chemie GmbH (D-89555, Steinheim, Germany). Acetonitrile (ACN, 1.00029.1000) was obtained from Merck (Darmstadt, Germany). Trifluoroacetic acid (TFA) is usually added to generate [M + H] ions and was purchased from Merck (1.08262.0025). SRCtide (NH2-GEEPLYWSFPAKKK-CONH2) and phosphorylated SRCtide (p-SRCtide, NH2-GEEPL(pY)WSFPAKKK-CONH2) were synthesized by Metabion (Planegg, Germany). The fluorescein isothiocyanate (FITC)–labeled SRCtide, c-MET kinase assay peptide substrate for analysis by capillary electrophoresis (CE, LabChip 3000) was purchased from Carna Biosciences (Natick, MA). Other reagents, Tris 1.08382, HEPES 1.10110, MgCl2 1.05833, and Triton X-100 1.08603, were acquired from Merck; ATP A6419-1G and BSA 30% A9576 were acquired from Sigma; DTT 1.11474 was acquired from Millipore (Billerica, MA); and Brij-35 28316 was acquired from Thermo Scientific (Waltham, MA). c-MET protein kinase (MET wt, 0171-0000-1) was purchased from ProQinase (Freiburg, Germany).
Enzyme Assay and Sample Preparation
Capillary Electropohoresis
For the c-MET kinase experiments, all assay reactions were prepared in 384-well plates (Greiner Bio-One, Monroe, NC, 784076-25) after the following procedure (the final assay concentrations are given in brackets).
For dose–response curves, 22.5 nL of compound solution with different concentrations in DMSO or pure DMSO was predispensed to each well. Three microliters of c-MET wt enzyme (2.5 nM [1 nM] in assay buffer—specified in results section, Fig. 1 ) was added via Multidrop Combi (Thermo Scientific) into each well. After centrifugation at 2000 rpm for 60 s with a Multifuge 3SR+ (Thermo Scientific) centrifuge, plates were preincubated at 22 °C for 15 min. This step was necessary for consistency to allow for enzyme and compound incubation for all assays that contained compounds or DMSO to obtain dose–response curves. Now 4.5 µL of ATP/substrate mix (66.7 µM [40 µM] ATP and 1.67 µM [1 µM] FITC-labeled SRCtide substrate in assay buffer) was added into each well via Multidrop Combi. The plate was centrifuged (2000 rpm, 5 s) and then incubated at 22 °C for 60 min. For kinetic measurements, the ATP concentration was varied from 33.2 µM [20 µM] to 1667 µM [1000 µM], with incubation times from 5 to 60 min, respectively. After incubation, the reaction was stopped by adding 7.5 µL of termination buffer (127 mM HEPES [pH 7.5], 0.01% Brij-35, 40 mM EDTA, 1% DMSO) into each well. The enzyme activity was then measured using CE. The phosphorylated product and nonphosphorylated substrate (FITC-SRCtide) were separated and detected with the LabChip 3000 EZ Reader (PerkinElmer, Waltham, MA) by excitation with a blue light-emitting diode (LED) and measuring the fluorescence emission.
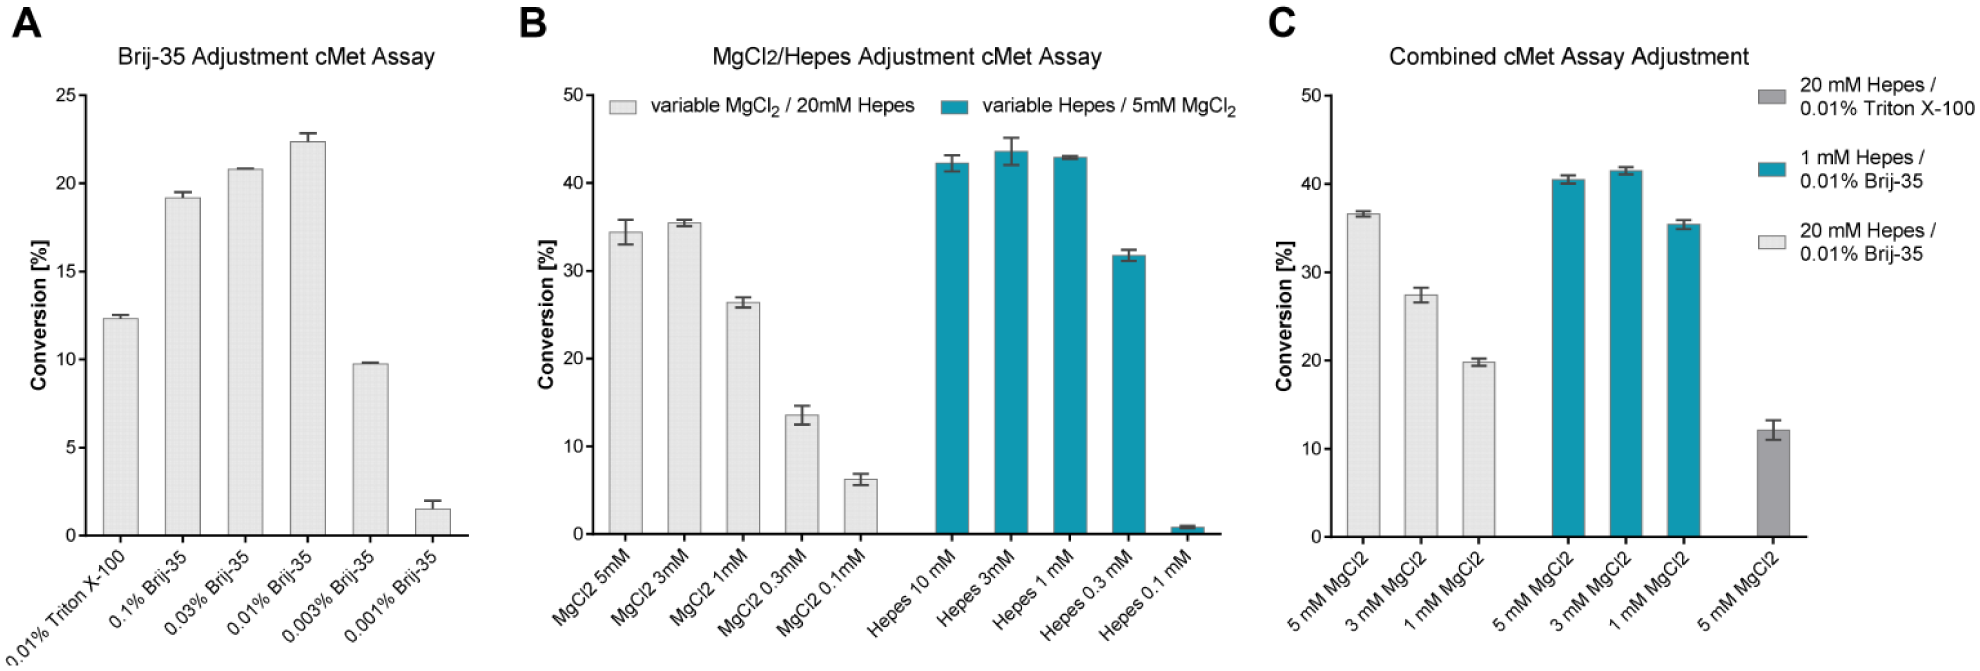
Adaptation of c-MET assay to MALDI-MS-compatible buffer conditions. Comparison of different Brij-35, MgCl2, and HEPES concentrations on the c-MET assay (standard buffer conditions: 20 mM HEPES [pH 7.5], 5 mM MgCl2, 2 mM DTT, 0.01% Triton X-100). Conversion (%) represents the percentage of substrate (SRC peptide) converted to product (p-SRC peptide) by c-MET kinase. (
MALDI-MS Detection
The assay was performed as described in Supplemental Figure S3 , with the unlabeled SRCtide peptide as substrate and in a 1536-well format (1536LDV, Labcyte, Sunnyvale, CA).
The reaction was stopped by adding 2.5 µL of 2% [v/v] TFA in matrix solution (10 mg/mL 4-HCCA was dissolved in 80% ACN and 20% water [Baker analyzed Ultra LC/MS 9823-02]) with the Multidrop Combi (Thermo Scientific) to give an assay reaction to matrix volume ratio of 1:1 and a final TFA concentration of 1%. This type of dispenser was used because it operates as a closed system to avoid evaporation of ACN.
Prior to spotting, MALDI targets (polished steel plain 1.0 inserts, Bruker Daltronics 1833280) were cleaned using the following steps: (1) 100% TFA, (2) water (Baker), and (3) allowed to dry at room temperature. Immediately after adding matrix solution, the assay plate was centrifuged at 2000 rpm for 60 s and transferred to the Echo 550 acoustic liquid handler (Labcyte) as a source plate. The plain steel MALDI target plate on the 3D printed adapter ( Suppl. Fig. S1 ) was introduced into the Echo 550 as a destination plate. Seventy-five nanoliters of the assay and matrix mix was transferred to the target plate in a 1536-well grid format. Automated spotting onto the target was performed using the Echo 550 by either 384- to 1536- or 1536- to 1536-well transfer.
MALDI Data Acquisition
MALDI time-of-flight (TOF) mass spectra were collected with either an UltrafleX III TOF-TOF or a RapifleX TOF Pharma Pulse instrument (both Bruker Daltronics). FlexControl and FlexAnalysis or MALDI Pharma Pulse 2.0 (for RapifleX) were used for acquisition and data analysis. Settings for both instruments were chosen to achieve the best ratio of sensitivity and resolution. With the UltrafleX III, spectra were acquired using an AutoXecute Method. Spectra were recorded in positive reflector mode for a mass range of 800–2500 m/z with an initial laser power of 31%. The instruments were calibrated using the Peptide Calibration Standard II (Bruker Daltronics, 8222570) and cubic enhanced mode (UltrafleX III) or quadratic mode (RapifleX), respectively. Data were acquired by summing up 500 satisfying laser shots in 100 shot steps following the random walk complete sample mode over each sample spot. For analysis, the mass spectral peaks representing the isotope pattern of the desired substrate and product peptide were used for analysis. The processing parameters for UltrafleX III were as follows: SNAP peak detection algorithm, signal-to-noise ratio (S/N) of 6, Savitzky–Golay smooth with 0.2 m/z width and 1 cycle, and Top Hat baseline substraction. The processing parameters for RapifleX were as follows: SNAP2 peak detection algorithm, S/N of 3, Savitzky–Golay smooth with 0.1 m/z width and 1 cycle, and Top Hat baseline substraction.
Data Analysis
Data analysis was done as described in Greis et al. (2016). 2 The phosphorylated product and the nonphosphorylated substrate peaks were identified and used for calculation. For the analysis via CE, the peak areas of the fluorescence-labeled peptides (phosphorylated FITC-SRCtide product and nonphosphorylated FITC-SRCtide) were detected by fluorescence intensity with the LabChip 3000 EZ Reader. The percent conversion, a measure of the ratio of the product to the substrate, was used for further analysis. Percent conversion was calculated from peak areas as [% conversion = 100 × (area of product peak)/((area of substrate peak) + (area of product peak))].
For MALDI-MS detection, the peak intensity of the monoisotopic mass peaks (m/z = 1679 for SRCtide and m/z = 1759 for the phosphorylated SRCtide) and the area of the isotope patterns were determined by the FlexAnalysis or MALDI Pharma Pulse software with the peak-picking settings described above. Percent conversion was calculated as [% conversion = 100 × (area of product peak × 1.253)/((area of substrate peak) + (area of product peak × 1.253))]. The factor for the product peak was introduced to account for the differences in ionization efficiency for substrate and product.
For the concentration-dependent c-MET kinase assays, the inhibition was plotted as the percent of enzyme activity. The data weres normalized and shown as percent of control using the Genedata Screener software (Genedata AG, Basel, Switzerland).
Results and Discussion
In HTS, a robust assay workflow with low variability between experiments is desirable. Recent advancements in the field of MALDI-MS present an opportunity to accomplish these twin goals and enable the use of this technology for HTS and hit discovery. To keep up with the technological advances, we looked into the feasibility of using MALDI-MS as an in-line reader in an HTS workflow. To explore this, we first assessed the use of the Echo 550 liquid handler (Labcyte) for sample preparation within an HTS workflow. The rationale for using the Echo liquid handler was its common use in HTS workflows, its routine integration in our well-established HTS system ( Suppl. Fig. S3 ), and its proven reliability. Second, as a proof of concept we decided to use an established c-MET kinase assay for evaluation in a MALDI-MS-based workflow. This assay is based on the phosphorylation of a peptide substrate, which due to its m/z shift of 80 Da can be easily detected by MALDI-MS, and therefore presents a good starting point for our feasibility studies.
To start our optimization, we first selected a suitable matrix. In order to detect small peptides via MALDI-MS, we chose 4-HCCA. We used 10 mg/mL 4-HCCA in 80% ACN/2% TFA. The matrix solution was added to the assay in a 1:1 volume ratio and centrifuged to remove trapped air bubbles. As the next step, 75 nL of assay–matrix mix was transferred via the Echo 550 liquid handler from the assay plate to a plain steel MALDI-TOF MS target in a 1536-well format. While performing the first tests, we observed that the standard full-metal target holders were too heavy to be handled by the Echo 550 liquid handler. Therefore, we adjusted the target holder to facilitate the Echo transfer. A lighter 3D printed copy of the target holder was produced out of acrylic plastic ( Suppl. Fig. S1 ) and utilized for the following sample preparations. In previous experiments, it was necessary to use a custom-made ultrasound transfer system, which enables matrix transfer on the sample. 20 The automatic laser-driven ionization of samples for MALDI-MS measurement depends on uniform spacing of samples over an evenly spaced grid. We found that the Echo transfer produced a reliable 1536-well pattern, which is necessary for a fully automated MALDI-MS analysis. Furthermore, when we used the Echo for sample transfer the matrix crystal distribution across the sample spot was very homogeneous and no double-layer spotting was needed for reliable detection ( Suppl. Fig. S1 ). As a result, we were able to develop an optimized protocol and establish a reliable MALDI-MS sample preparation workflow using the Echo 550 liquid handler. In conclusion, the transfer of a sample–matrix mix via acoustic liquid transfer is a viable option for a standard screening setup and workflow ( Suppl. Fig. S3 ). Using the MALDI-MS technology as a standard in-line reader, together with the already integrated Echo system, is simple and needs no further investments beside the MALDI-MS device. This is a clear advantage for many HTS departments, which invested a lot in ultrasound transfer technology during the last decade. In addition, many workflows are adapted toward this technology. In the current workflow, the use of Echo technology is not throughput limiting and allows target spotting of faster than 8 min. Samples on the MALDI-MS targets are always dry after the Echo transfer. Time might be problem for the use of Mosquito TTP and CiBio Well Vario, which include additional steps during the sample transfer, like washing or additional dry time. We observed longer dry times on the CiBio, but this is highly dependent on the sample/matrix composition and may differ from assay to assay. However, we also encountered limitations while using the Echo transfer for MALDI-MS target preparation. First, to guarantee reliable acoustic transfer, there is a relatively strict upper-volume cutoff for the solution in an Echo source plate. This either leads to a low-volume restriction on the assay setup or would make another pipetting step necessary. This additional step would also increase processing time and probably require integration of another pipettor, like the CiBio Well Vario positive displacement 1536-tip head system or TTP Mosquito. Increased use of Echo transfers during a screening run creates an additional limitation. Using the Echo for MALDI target preparation, as well as compound transfers to the assay plate in a standard HTS workflow, creates a scheduling bottleneck and will limit throughput of the screening process. Therefore, the pros and cons for the use of the Echo liquid handler have to be weighed carefully and considered for the individual screening platform setup.
Suppression of ionization is one of the biggest challenges in MALDI-MS sample preparation.11,16 Since we expected such ionization problems with our established c-MET assay buffer, we turned our attention to the adjustment of buffer ingredients and tested the c-MET kinase assay performance with those different buffer conditions. To be functional in an in vitro setting, biological systems require a certain pH range and are dependent on salts and/or certain metal cations for their activity. On the other hand, sample ingredients, such as buffer substances (e.g., HEPES and Tris), salts (e.g., NaCl, KCl, and MgCl2), and detergents (e.g., Triton X-100 and Tween-20), are known to influence ionization and negatively modulate the signals of MALDI spectra. For the c-MET kinase assay, we started with the known assay conditions of 20 mM HEPES (pH 7.5), 5 mM MgCl2, 2 mM DTT, and 0.01% Triton X-100, which were used to screen for c-MET kinase inhibitors with a Caliper CE system. Since we wanted to keep the established assay working within similar parameters, we started to adjust buffer ingredients step-by-step and monitored assay performance by looking at the percent of conversion by CE. It was shown before that Triton-X100 has a major impact on MALDI-MS signal intensity; 11 therefore, we first used different concentrations of Brij-35 to replace Triton-X100 ( Fig. 2A ). As shown in Figure 2A , 0.003%–0.1% Brij-35 keeps assay performance in an acceptable range. To further adjust the assay conditions for MALDI-MS analysis, we chose 0.01% Brij-35 and worked on further adjusting the buffer conditions.
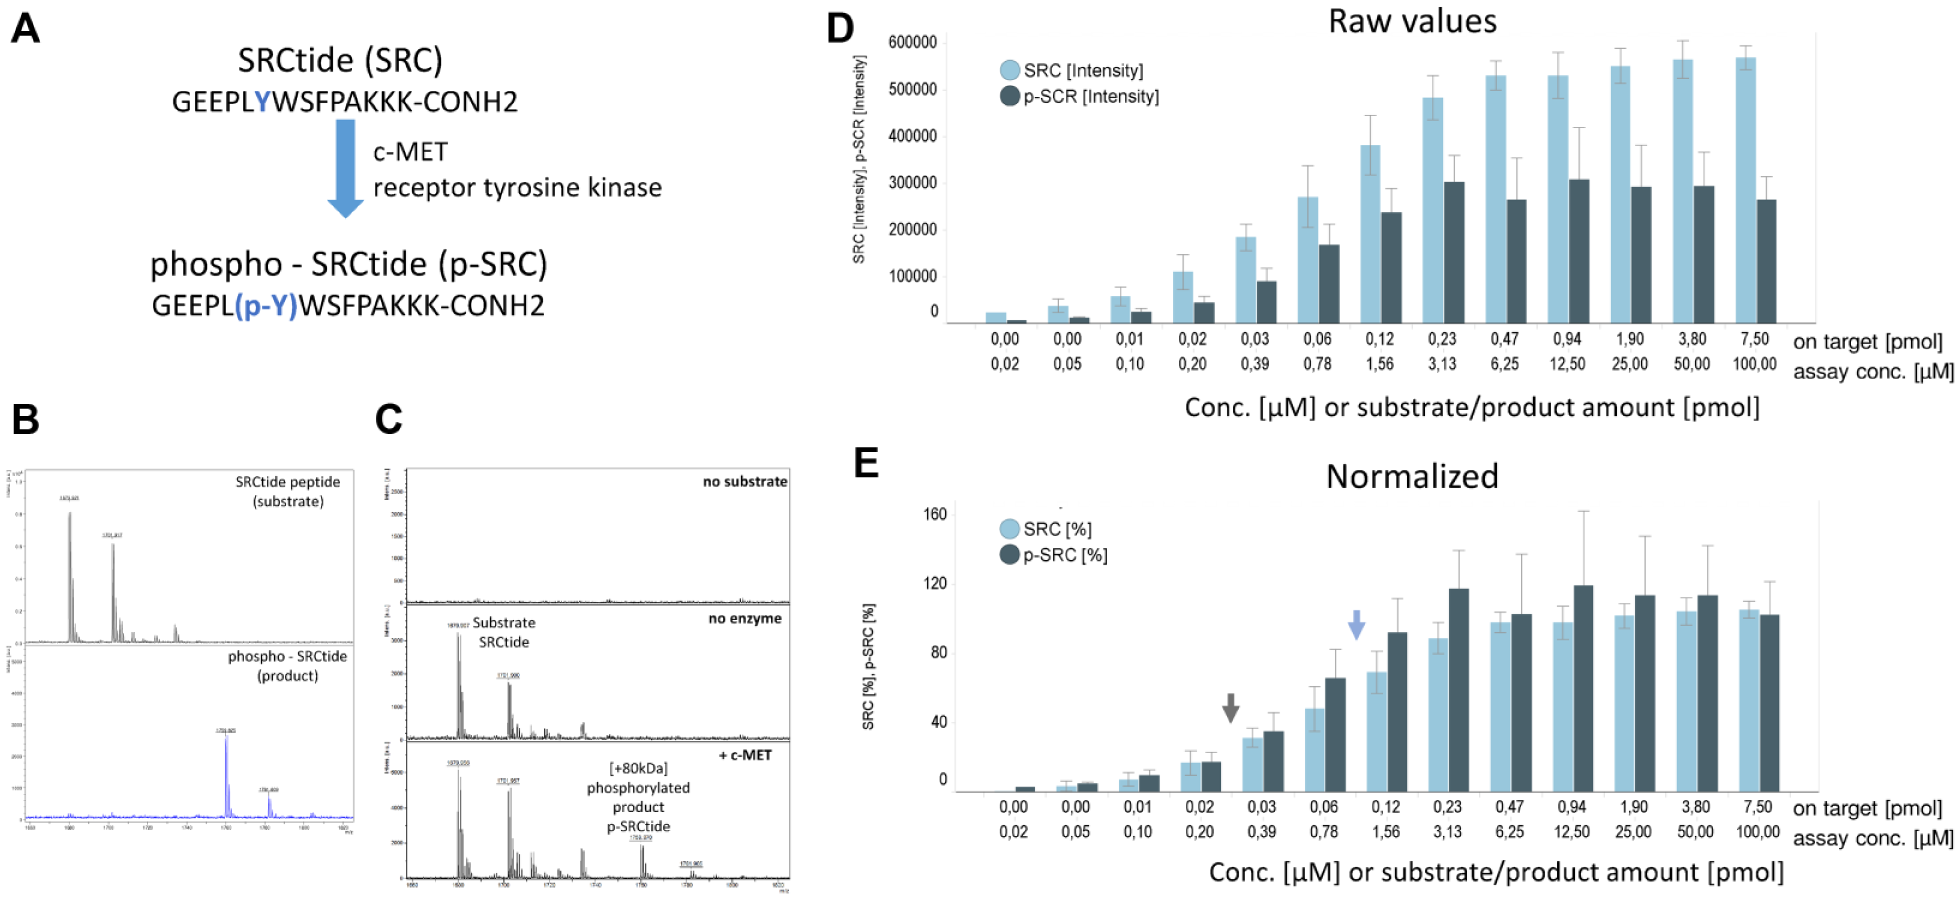
SRCtide and p-SRCtide detection via MALDI-MS. The 1536-well automated MALDI measurement and peak analysis of the substrate (SRCtide) and product (p-SRCtide) of the c-MET assay. (
As shown in Figure 2B , 0.3–10 mM HEPES was able to support the c-MET kinase activity at a similar level ( Fig. 2B , blue). On the other hand, variation in MgCl2 concentration had a bigger influence on assay performance. Even if 1 mM MgCl2 was in an acceptable range of 15%–30% conversion, a clear decrease between the starting conditions and 1 mM was visible ( Fig. 2B , gray). After evaluating the influence of the single buffer components, we looked at a combination of changes and compared them with the original assay conditions ( Fig. 2C , dark gray). Those experiments led to the conclusion that lowering the HEPES and MgCl2 concentrations and changing the feasible detergent would achieve a more MALDI-MS-compatible buffer composition. We decided to move ahead and use 1 mM HEPES (pH 7.5), 1 mM MgCl2, 2 mM DTT, and 0.01% Brij-35 for our c-MET kinase assay. This resulted in final concentrations in the sample–matrix mix of 0.5 mM HEPES (pH 7.5), 0.5 mM MgCl2, 1 mM DTT, and 0.005% Brij-35.
The rationale for the use of MALDI-MS in hit discovery is a fast, unbiased, and reliable detection of assay components. Enzyme assays that modify a substrate to produce a product with a clear mass shift are well suited for MALDI-MS. For the c-MET kinase assay described here, we used SRCtide, a well-established tyrosine kinase peptide, as a substrate. The c-MET kinase phosphorylates the SRCtide peptide at the tyrosine, resulting in p-SRCtide ( Fig. 2A ). Corresponding to this enzymatic activity, a mass increase of 80 Da for an added phosphate was detected and produces a mass shift of m/z = 80 in the mass profile. Consequently, both SRC and p-SRC can be detected individually/independently but in parallel via MALDI-MS ( Fig. 2B ). Even though the appearance of the mass shift indicates enzyme activity, quantitative measurement of the substrate (SRC) and product (p-SRC) is needed for our screening purposes in drug discovery. Additionally, to allow evaluation of enzyme activities between sample measurements, peak intensities have to be comparable from one well to another. It has been shown that MALDI efficiencies for phosphopeptides are significantly different than those of the nonphosphorylated forms.17,18 To assess the influence of desorption/ionization efficiencies for the c-MET assay, we used our established setup and compared the detection of SRC and p-SRC over a range of concentrations ( Fig. 2C , D ). As expected, the raw data show a difference in signal intensity between the nonphosphorylated and phosphorylated peptides. However, the signal intensity ratio is mostly consistent over the tested concentration range. Therefore, we expect that normalization achieves comparability between wells ( Fig. 2D ). Normalization can be done either by addition of an internal marker to each reaction or by normalization to controls on the plate. Furthermore, within the linear range shown in Figure 2D a quantitative relationship between the intensity of SRC or p-SRC as measured by MALDI-MS and the assay concentration exists. Consequently, the ratio of peak intensities measured for the substrate and product represents a linear relationship to enzyme activity within the assay. Hence, our experimental results were consistent with predictions allowing direct assessment and comparison of c-MET enzyme activities, which is especially useful in HTS assays.
Another advantage of using MALDI-MS for hit discovery is that it enables screening compounds for their influence on enzymatic activity in a direct, fast, and reliable way. After we determined suitable assay conditions (
Fig. 1
) and a linear detection range for substrate and product (
Fig. 2
), we wanted to evaluate the c-MET kinase assay in our previously established high-throughput MALDI-MS sample preparation workflow. In order to assess the performance of the c-MET kinase MALDI-MS assay in a pharmacologically relevant setting, we conducted a small concentration-dependent inhibitor study. To do this, we generated 20-point dose-dependent inhibition curves (DRCs) for each of 13 selected compounds. Historically, fluorescence-based technologies have been used for HTS against enzyme targets. However, since MALDI-MS assays allow label-free detection, they provide a step forward toward direct and parallel measurement of substrate and product. To evaluate MALDI-MS performance for the c-MET kinase assay, we compared two approaches. We used the fluorescence-based CE as an established standard method in addition to MALDI-MS to obtain dose–response curves (
Fig. 3A
,
B
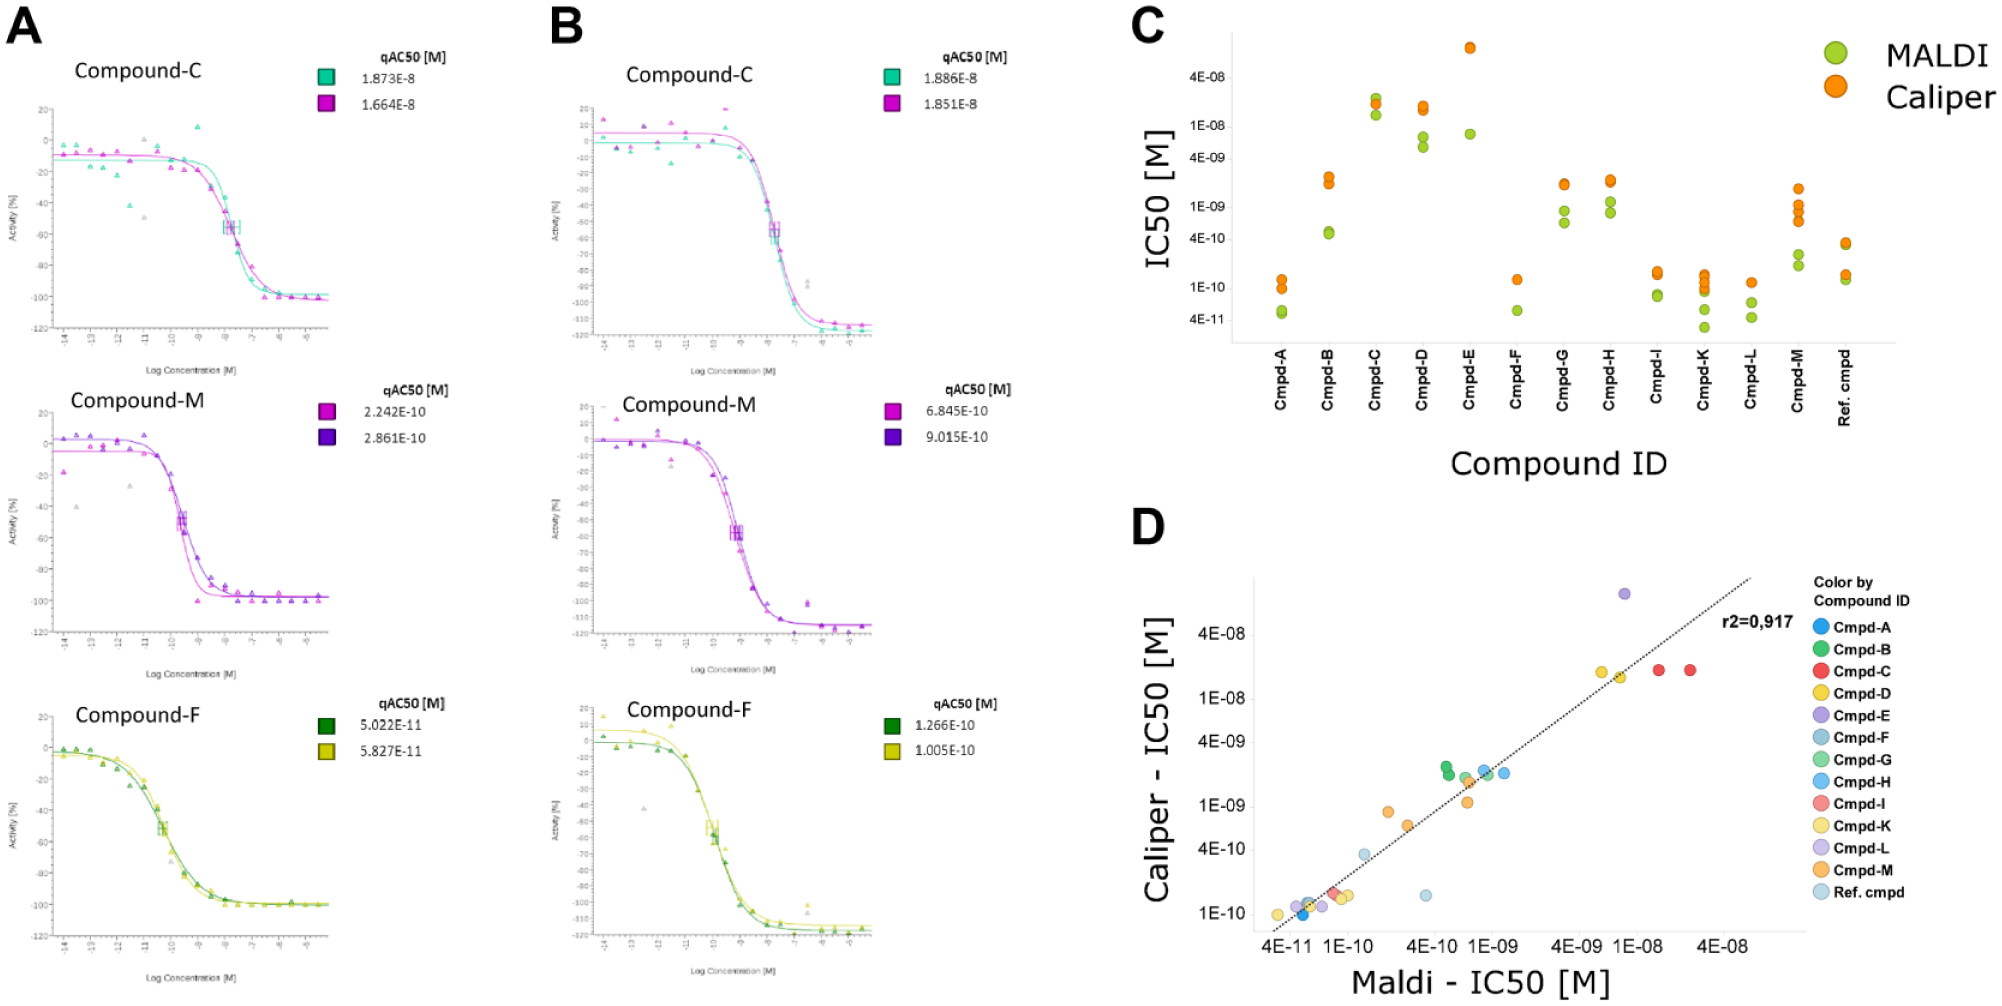
Comparison of in vitro c-MET kinase assay analyzed by MALDI-MS or Caliper LabChip 3000 CE. c-MET assay carried out in MALDI-MS-compatible buffer conditions. IC50 values were determined for selected compounds by testing SRCtide phosphorylation in the presence of a range of inhibitor concentrations. (
As we have shown previously, CE or MALDI-MS produced similar IC50 values for the c-MET kinase assay ( Fig. 3 ). For HTS, a robust assay workflow with low variability between experiments is necessary. Therefore, we next assessed the robustness of the MALDI-MS readout by performing a correlation analysis across replicates. We investigated the variation between independent experiments for either the fluorescence-based CE or the MALDI-MS-based assay approach. For that purpose, we obtained IC50 values for 13 active compounds using both methods. The results agree with our earlier finding that both methods produce similar and reliable IC50 values. To judge interexperimental variation between the two measurement methods, we analyzed the correlation of each method ( Fig. 4 ). Scatter plots using logarithmic scales for each of the comparative experiments demonstrate a high correlation for the CE and MALDI-MS methods with R2 values of 0.968 and 0.943, respectively. Interestingly, the variability between the two experimental workflows ( Fig. 3D ) with an R2 of 0.917 is similar to our determined interexperimental variation ( Fig. 4 ). Both comparisons, method versus method and experiment versus experiment, resulted in a high R2 value, which demonstrates a strong relationship and low variability, and therefore implies high robustness of both methods.
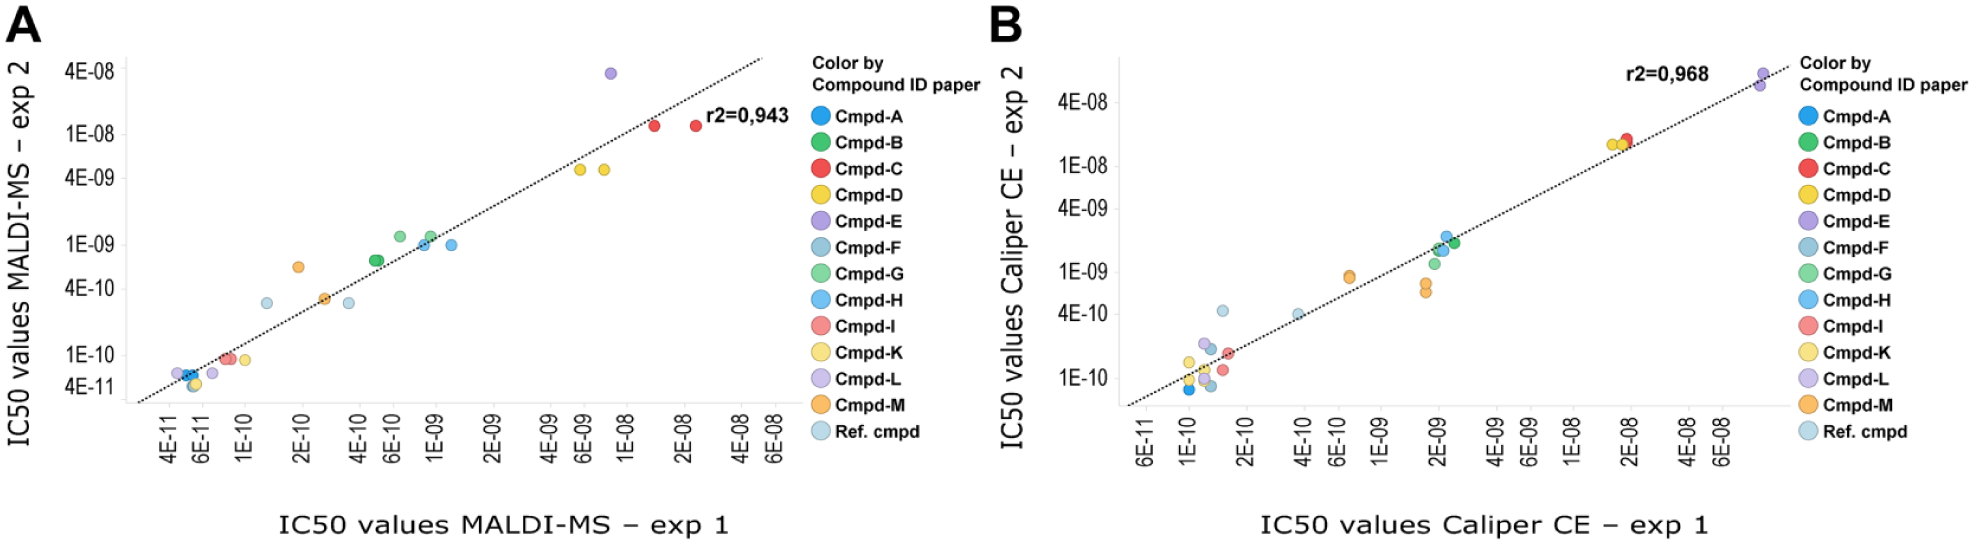
Analysis of interexperimental variation using MALDI-MS or Caliper CE analysis of c-MET kinase assay. IC50 values were determined for selected compounds and are plotted in a logarithmic scale on both axes. The colored circles represent IC50 values for the different compounds, the x axis corresponds to experiment 1, and the y axis corresponds to experiment 2. Shown are correlation graphs between two independent experiments for (
Taken together, the recent hardware improvements that resulted in increased speed and higher sampling rates put MALDI-TOF MS into a position of high interest and usage for high-throughput drug discovery.
For many secondary screens, CE-based assays are our preferred orthogonal readout, which generate high-quality data for the validation of hit series from primary screens. These primary screens typically run with assay technologies, which generates more biased hit series. 8 Therefore, we choose our internal gold standard 21 for the evaluation of MALDI-MS-based assay and process development. We are extremely impressed by the power of MALDI-MS and the opportunity to integrate MALDI-MS systems, like a standard reader, in our ultra-HTS workflow using acoustic transfer for target preparation. Besides the high-quality data, the label-free assay technology, and the expansion of target space, it allows us to eliminate the necessity to run orthogonal assays. Here we identified a big chance for early drug discovery departments that have to deal with the reduction of cycle times and the pressure to deliver first-in-class molecules for innovative target classes.
Footnotes
Acknowledgements
We thank Meike Hamester, Volker Sauerland, Franz J. Mayer, and Jens Fuchser from Bruker Daltonics (Bremen, Germany) for their valuable input and helpful discussions.
Supplementary material is available online with this article.
Declaration of Conflicting Interests
The authors declared no potential conflicts of interest with respect to the research, authorship, and/or publication of this article.
Funding
The authors disclosed receipt of the following financial support for the research, authorship, and/or publication of this article: No funding for this work was received by the authors. All research was done as work-for-hire for the employer Merck KGaA.
References
Supplementary Material
Please find the following supplemental material available below.
For Open Access articles published under a Creative Commons License, all supplemental material carries the same license as the article it is associated with.
For non-Open Access articles published, all supplemental material carries a non-exclusive license, and permission requests for re-use of supplemental material or any part of supplemental material shall be sent directly to the copyright owner as specified in the copyright notice associated with the article.