
Abstract
Among different biopharmaceutical products, monoclonal antibodies (mAbs) show a high level of complexity, including heterogeneity due to differences in size, hydrophobicity, charge, and so forth. Such heterogeneity can be related to both cell-based production and any of the stages of purification, storage, and delivery that the mAb is subjected to. Choosing the right formulation composition providing both physical and chemical stabilities can be a very challenging process, especially when done in the limited time frame required for a typical drug development cycle. Charge variants, a common type of heterogeneity for mAbs, are easy to detect by ion exchange, specifically cation exchange chromatography (CEX). We have developed and implemented a high-throughput CEX-based approach for the rapid screening and analysis of charge modifications in multiple formulation conditions. In this work, 96 different formulations of antistreptavidin IgG1 and IgG2 molecules were automatically prepared and analyzed after incubation at high temperature. Design of experiment and statistical analysis tools have been utilized to determine the major formulation factors responsible for chemical stability of antibodies. Regression models were constructed to find the optimal formulation conditions. The methodology can be applied to different stages of preformulation and formulation development of mAbs.
Keywords
Introduction
Different orthogonal analytical methods are typically used to characterize monoclonal antibodies during the drug development process to monitor for possible modifications that occur during product manufacturing and storage.1,2 Like most globular proteins, monoclonal antibodies have predominantly charged and other polar amino acids at the interface of the protein with water. Residues at the protein–liquid interface are much more susceptible to chemical or enzymatic modification than those shielded within the more hydrophobic interior of the protein structure. The common chemical degradations of monoclonal antibodies include C-terminal processing of lysine residues,3,4 N-terminal pyroglutamate formation, 5 deamidation, 6 glycation, 7 and oxidation.8,9 Many of those modifications change the total charge or charge distribution of the protein molecule, and various methods can be applied to characterize these charge variants.10,11 According to structural and functional studies, antibody charge isoforms can have an impact on immunogenicity and overall stability. 12 Characterization and quantification of the isoforms are necessary for a consistent product quality, and rapid, reliable, and quantitative analytical methods are required for this purpose. Chromatographic and electrophoretic methods are the most common and relatively simple analytical tools for the analysis of heterogeneity of recombinant proteins. Isoelectric focusing may help to visualize the charge isoforms, but chromatographic methods are more suitable for accurate quantification. 13 When higher resolution is necessary to resolve all protein variants, capillary zone electrophoresis, microliquid chromatography, and two-dimensional electrophoresis can be helpful. Two-dimensional liquid chromatography (2D-LC) coupled with mass spectrometry can produce an excellent resolution and identification of individual charge variants. 14 Recently, a high-throughput screening assay to analyze antibody charge variants on a microfluidic chip has been described. 15 The separation in this method is achieved by zone electrophoresis, with separation times more than 10-fold faster than conventional, low-throughput methods. The assay is based on the commercially available microfluidic LabChip GXII platform (Caliper, PerkinElmer Company, Alameda, CA) that performs electrophoretic separation and laser-induced fluorescence detection. One disadvantage of this method is the necessity to label the protein with a fluorescent probe, although the label does not change the overall charge according to the authors. The gold standard for accurate analysis of protein variants remains mass spectrometry–based peptide mapping. 16 However, even with recent technological advances, this method takes significant time to prepare samples, run the experiment, and particularly, analyze the massive dataset. The instrumentation is very expensive and requires well-trained personnel to operate it. In formulation development of an antibody, the level of chemical degradation is an important parameter to monitor. Fast and reliable screening methods are necessary to select the most stable formulation for efficient and safe drug product storage and delivery, and chromatographic methods are probably best suited for this purpose. These methods are easy to automate, more reproducible, and less dependent on the sample solution properties than electrophoretic techniques. The chromatographic method most often applied for this purpose is cation exchange chromatography (CEX), which has become a standard assay for the characterization of antibody charge heterogeneity. CEX is very sensitive to the specific molecule, and even for the same IgG type of antibody, significant method development is usually required before further implementation. In spite of this problem, CEX has been a great tool to detect charge-related degradations in analytical and formulation development. The typical CEX analysis time is about 30 min, and it can be significantly reduced when the new generation of high-pressure instrumentation and columns is used. In the work presented here, we propose a new method not only to rapidly screen many formulations, but also to create a prediction model for charge-based degradation of a protein considering all the formulation factors. Some loss of resolution observed during a shorter run time is compensated by thorough statistical analysis of a large amount of data. This method can provide a robust analysis of formulation stability and the understanding of various effects related to formulation composition and external factors.
Materials and Methods
Monoclonal Antibody Formulation Preparation
Monoclonal antibodies, antistreptavidin type IgG1 and IgG2, were purified from mammalian cell culture and dialyzed into buffer containing 10 mM sodium acetate at pH 5.2. The dialysis was performed at a 1:200,000 volume ratio at 4 °C, including three buffer changes. The dialyzed protein was concentrated to 30 mg/mL by centrifugation using 10,000 MWCO centrifugal filters (Amicon Ultra-15, Millipore Corporation, Billerica, MA). The pI values were determined as 8.2 and 7.7 correspondently for IgG1 and IgG2. Stock solutions for excipients such as sucrose, sorbitol, proline, and sodium chloride were prepared at high concentrations. Stock formulations and protein solutions were prepared in 15 or 50 mL plastic vials and placed onto a TECAN liquid handling system platform for automated mixing. The formulations were created using a specialized TECAN script and 96-well plates assigned for stress or analytical assays. Separate plates were prepared for each time point and each stress condition. The concentration of acetate, citrate, and phosphate buffers was 10 mM; the concentration for sucrose, sorbitol, and proline was 270 mM; for polysorbate 20, it was 0.004%, and for NaCl, it was 100 mM. The full 96-well plate setup for formulation screening is shown in Table 1 .
Values of Percentage of CEX Peak Area Change Obtained for Antistreptavidin IgG1 (
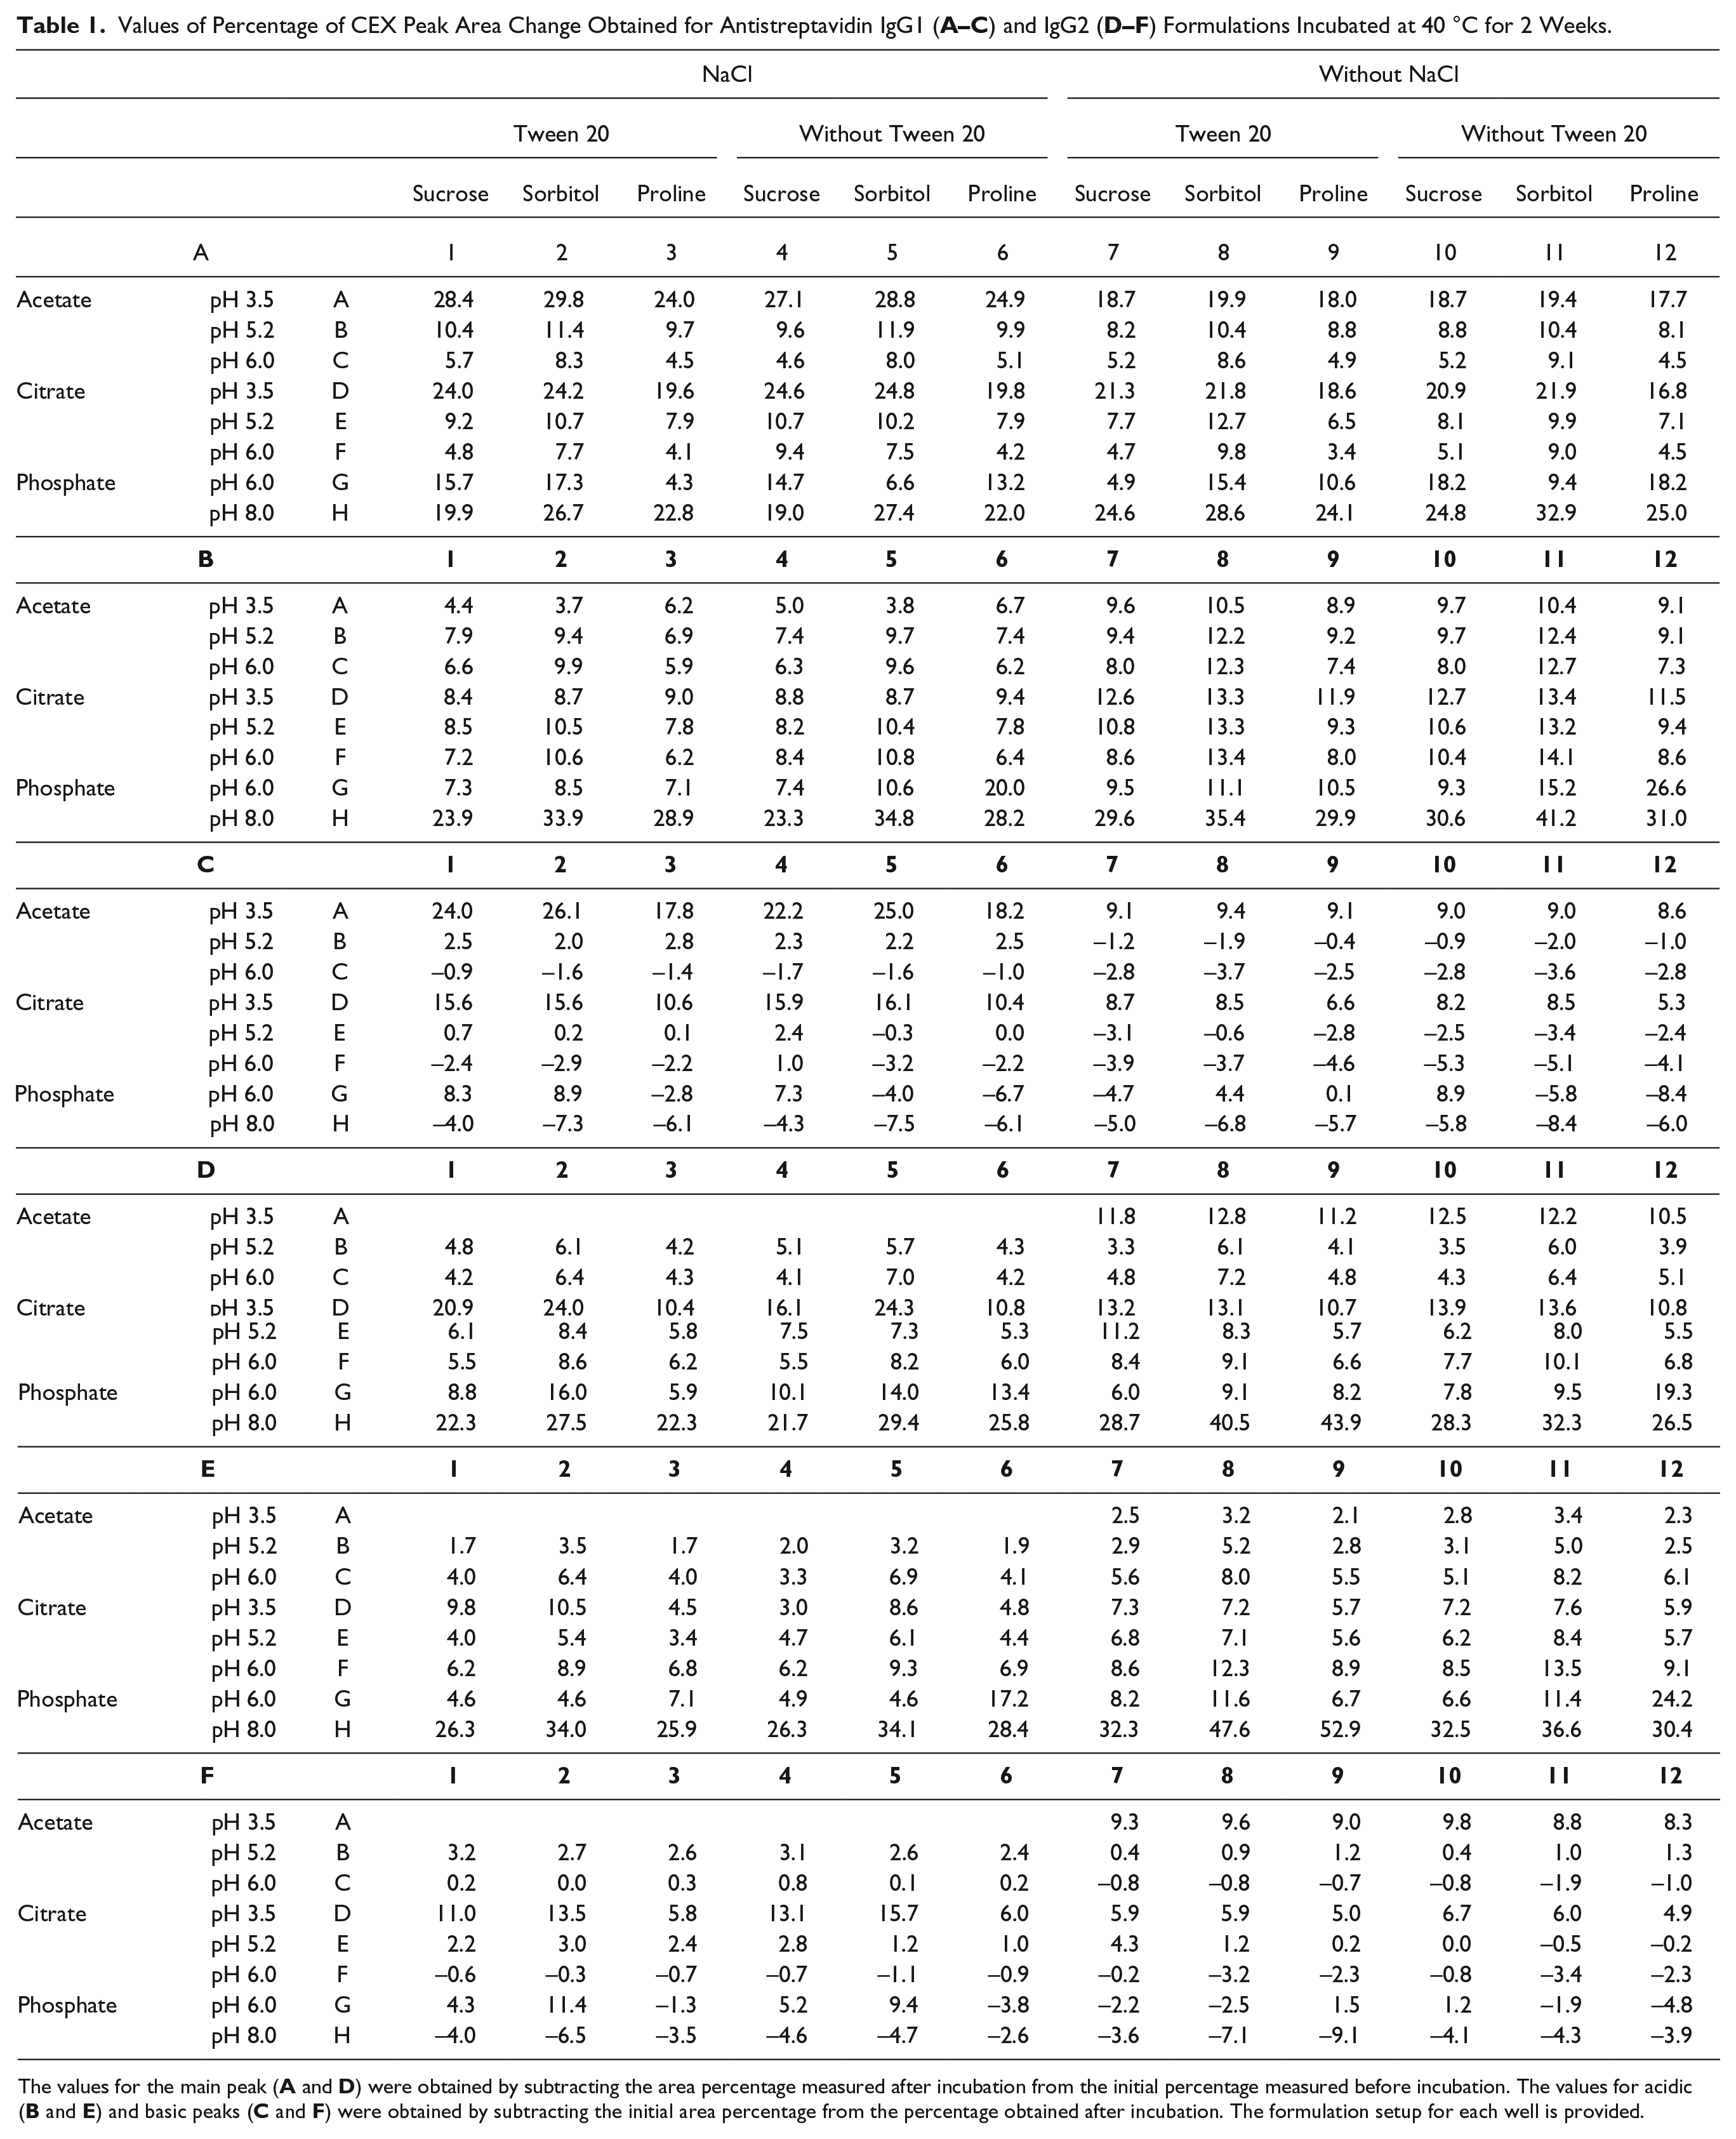
The values for the main peak (
Temperature Stress Study
Ninety-six-well plates containing IgG1 and IgG2 formulations were sealed using the PlateLoc Velocity 11 automatic sealer (Agilent, Santa Clara, CA) for a 1.7 s seal time at 175 °C. The plates were incubated for 2 weeks at 40 °C. To control evaporation during incubation, we used the measurement of the liquid level in each well on the TECAN station by conductive tips.
High-Throughput Cation Exchange Chromatography
Before CEX analysis, all samples were buffer exchanged into 10 mM sodium acetate (pH 5.2) buffer using Zeba Spin Desalting Plates (Thermo Scientific, Waltham, MA). The buffer exchange step was repeated five times, and this sample was used for further analyses. The IgG1 and IgG2 charge variants present in each sample were analyzed by high-throughput CEX. The method employed a Waters Acquity H-Class UPLC System (Waters Corporation, Milford, MA) equipped with a ultraviolet (UV) diode array detector. Each sample (10 µg) was injected onto a YMC-BioPro SP-F HPLC column, 50 × 4.6 mm, with 5 µm pore size (YMC Europe GmbH, Dinslaken, Germany) with the following mobile phases: Mobile Phase A, 200 mM MES(2-(N-morpholino)ethanesulfonic acid); Mobile Phase B, 200 mM MES base; and Mobile Phase C, 200 mM NaCl. The pH was maintained at 6.0 throughout the run, and a salt gradient was selected after preliminary prescreening for each molecule. The flow rate was 1 mL/min, and the total run time was 10.5 min. The sample elution was monitored by UV absorbance at 280 nm, and the peak integrations were performed using Empower software (Waters Corporation). Typically, three peak areas were integrated: the main peak, the acidic peak (earlier retention time than the main peak), and the basic peak (later retention time than the main peak). Results were reported as a percentage of each peak relative to the total integrated area.
Data Analysis and Interpretation
The percentage values for the changes in acidic, main, and basic peaks were used as output parameters to build a correlation and prediction model based on the formulation factors as variables. Both continuous and categorical variables were included in the experimental design: pH as a continuous variable and buffer, and excipients and detergent as categorical variables. For each experiment, 96 data points were obtained for all the combinations of formulation conditions. An example of using such a design approach was shown in our previous report. 17 For specific details on the analysis of the data, please see the Supplemental section.
Results and Discussion
Integration Results and Predictive Regression Models
Ninety-six formulations, each of both the IgG1 and IgG2 antistreptavidin antibodies, were incubated on plates at 40 °C for 2 weeks. Following incubation, all samples were exchanged into sodium acetate buffer (pH 5.2) as described in Materials and Methods and transferred to the autosampler of a UPLC instrument. CEX analysis was performed at room temperature, while the autosampler was kept at 4 °C. Some adjustment of the mobile-phase pH and the salt gradient was necessary to obtain the optimal resolution for both the IgG1 and IgG2 molecules. Typical CEX chromatograms of the IgG1 and IgG2 were quite different, with better resolution of the IgG1 sample ( Fig. 1 ). No significant changes were observed among the samples in different formulations before the stress. CEX chromatograms were integrated, and initially the data were expressed as the percent of total integrated area for each of the three peaks, the main peak, the acidic peak, and the basic peak. The exact nature of the chemical modifications is very difficult to determine from a CEX chromatogram even at high resolution and with reference samples; instead, we quantified the changes in acidic, main, and basic peak area percentage and evaluated the correlation of those changes with formulation factors after high temperature stress in the different formulation compositions. For the main peaks, the values obtained after incubation were subtracted from the values before the incubation. For the acidic and basic peaks, the numbers obtained before incubation were subtracted from the percentage numbers obtained after incubation. The results are shown in Table 1 . We analyzed the difference between the values obtained after 40 °C incubation and the values obtained before incubation because the changes in peak area are more indicative of chemical modifications than absolute values. The results presented in Table 1 indicate the amplitude of the changes in each type of peak. One can visually compare the effect of formulation factors such as pH on the presence of different charge variants and overall stability. No knowledge of specific chemical changes was elucidated from the method, but the formulations with the highest and lowest levels of modifications are easy to identify.
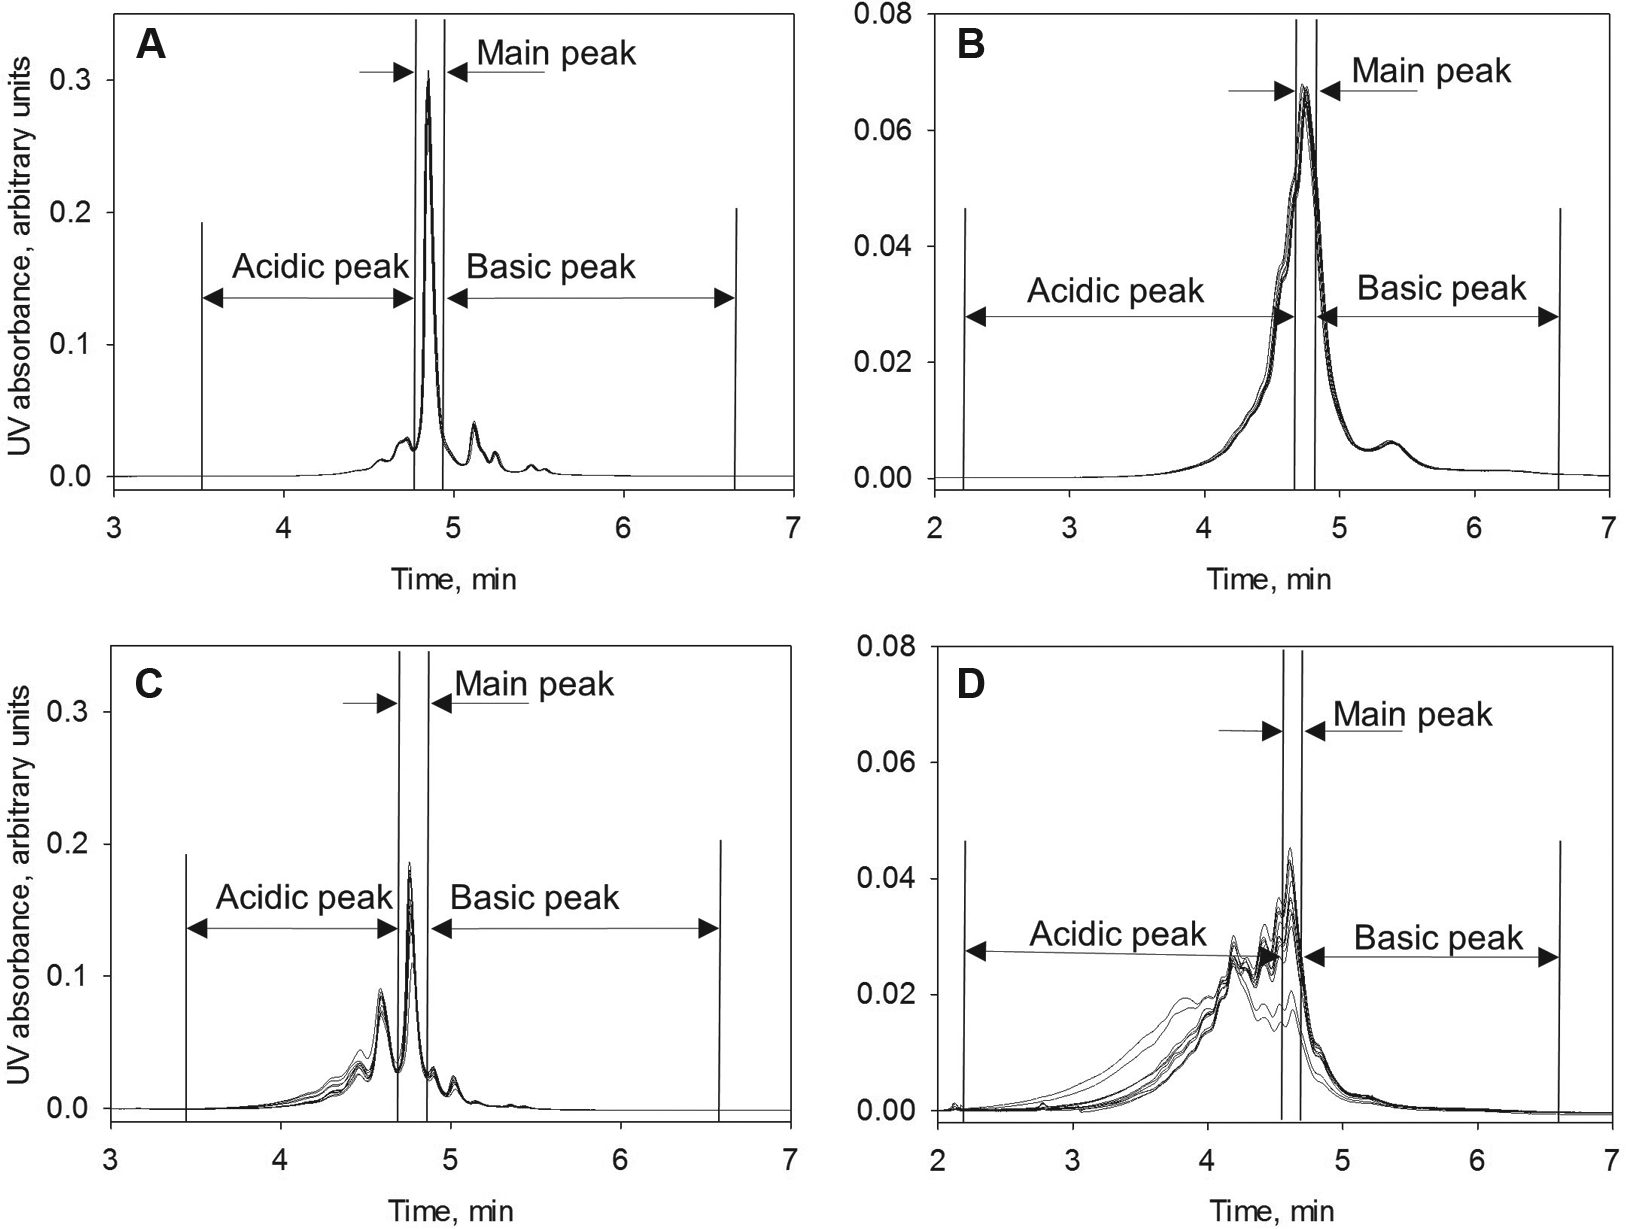
CEX chromatograms of the samples in phosphate (pH 6.0) formulations (raw H for plate setup shown in
Table 1
) for antistreptavidin IgG1 (
To investigate the effect of formulation factors on the level of different charge variants, we performed a thorough analysis of high-throughput data using a multivariable statistical application as described in the Supplemental section. Our intention was not to determine the exact composition of chemical modifications under the three peaks, the main, acidic, or basic peaks. Other methods, such as mass spectrometry–based peptide mapping, can do this very effectively. 18 For possible specific chemical modifications corresponding to each peak, see the Supplemental section. For each peak area, the percent change was used as the output parameter in the prediction model based on multivariate regression. We estimated the statistical significance of each of the formulation factors by assessing the goodness of the model from the plot of actual experimental data versus data predicted by regression models. The fits were good (R2 > 0.89) for both the IgG1 and IgG2 molecules (see the Supplemental section). We considered all factors and interactions between factor pairs in the regression model employed in this study. The significance of the factors was determined by p value, which indicates the probability of obtaining an F statistic larger than the one determined by pure chance. A p value of 0.05 or less for the factor is considered statistically significant. The effects of the formulation factors were quantified by the scaled estimates, obtained from the regression model (see the Supplemental section for the scaled estimates data). We plotted the predicted functions in the coordinates of peak percentage versus pH based on our regression models. In Figure 2 , the plots are presented for each excipient and buffer type in the presence or absence of salt. All prediction models are shown for the samples without surfactant since the presence of surfactant is statistically significant only for the IgG1 main or basic peaks, and the magnitude of the surfactant effect is less than 1% even when such an effect is statistically significant. The labels indicate acetate and phosphate buffers. Solid lines without labels indicate the citrate buffer data only. The dotted lines show the range of predicted values beyond the experimental formulation conditions.
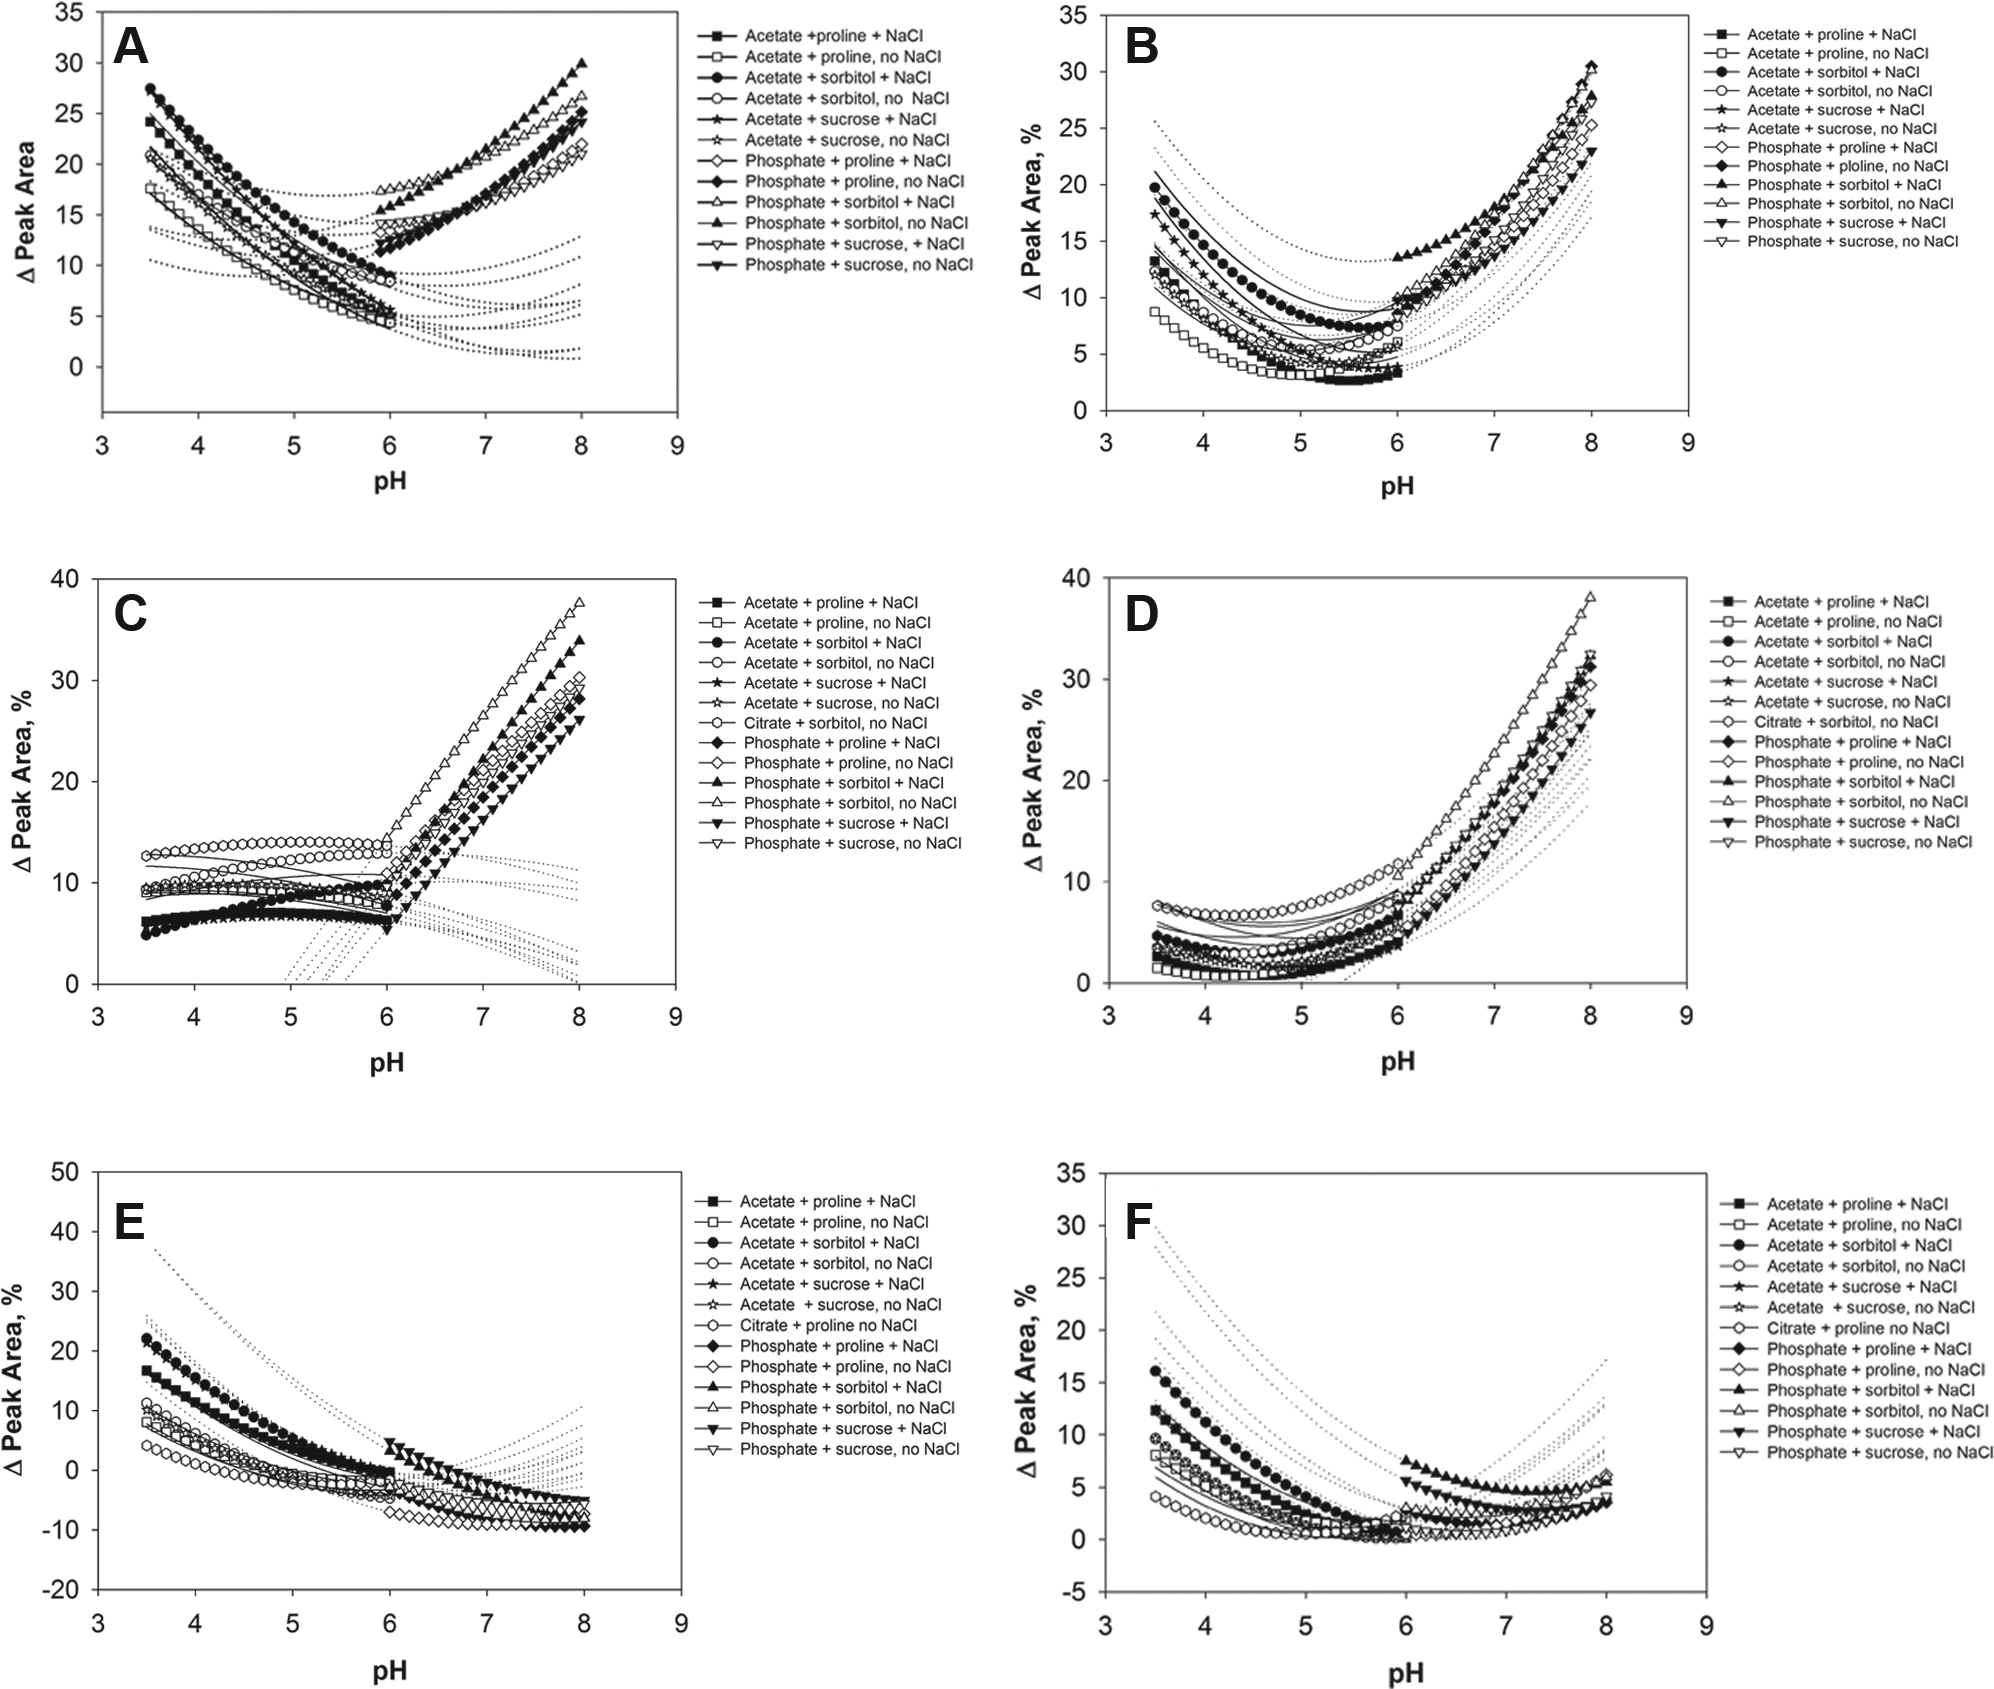
Predicted functions for CEX peak area change percentage for antistreptavidin IgG1 (
Effects of pH and Other Formulation Factors
The changes of area percentage values for the IgG2 samples in acetate and citrate buffers have minima in the pH range between 5.0 and 6.0. For all other formulations, the minimum change in main peak values is located at pH 6.0 for the formulations tested. We also analyzed the changes in acidic and basic peaks. The plots for the prediction models based on the IgG1 and IgG2 data are shown in Figure 2C , D for the acidic peaks and in Figure 2E , F for the basic peaks. The decrease in the basic peak at high pH can be explained by formation of pyroglutamic acid from N-terminal glutamic acid. 5 Cyclization of glutamine to form pyroglutamate causes a loss of the N-terminal primary amine, which is positively charged at neutral pH, therefore resulting in antibodies with more acidic species. Because of this modification, some basic species can transform to less basic variants and coelute with the main peak.
Prediction models for IgG1 formulations in acetate and citrate buffers show a strong dependence on salt with greater modifications in the samples without NaCl. The curvature of the acidic peak plots is not as pronounced as the curvature for the main peak plots, and the maximum values are shifted in the presence of salt. The presence of sorbitol causes higher levels of acidic modifications, and the combination of citrate buffer and sorbitol results in the highest level of modifications in the range of pH 3.5–6.0. For phosphate buffer and the pH range of 6.0–8.0, the IgG1 formulations with sorbitol also have the highest level of acidic modifications. The presence of NaCl is also protective in the phosphate formulations, but overall stability decreased drastically at higher pH, with acidic area changes reaching values as high as 20%. According to Figure 2D , for the IgG2 formulation, the acidic peak changes are less dependent on salt. All IgG2 formulations also have increased acidic modifications at higher pH values. Similar to the case of IgG1, the IgG2 formulations in citrate buffer with sorbitol and without salt have the higher modification level in the pH range of <6.0. The acidic modifications predicted by the model for IgG2 phosphate formulations significantly increase at pH > 6.0, up to 30%–40% at pH 8.0. Generally, at pH 3.5–6.0 the acidic modifications in the IgG1 formulations have higher values than those in the IgG2 formulations. Modifications at pH > 6.0 have steep upward slopes to the higher pH values for both the IgG1 and IgG2 formulations. Both types of formulations have a small curvature, which is positive for the IgG1 and negative for the IgG2 formulations, determined by negative and positive quadratic terms for the scaled estimates (see the Supplemental section). Similar to the plots for the main peak model, the labels for the acid peak model are shown for acetate and phosphate buffers. Only the plot for citrate buffer with sorbitol and no salt is labeled since it indicates the upper boundary for the pH range between 3.5 and 6.0. The plots for the basic peak models look more interesting than the plots for the acidic peak models because of the negative values obtained both by experimentation and by the model (see Tables 1B and 2 and Fig. 2E , F ). This indicates that there is a decrease in the area of the basic peaks after stress. For the IgG1, the basic peak modifications have their maximum at low pH under the tested conditions, although the plots have some negative curvature for all formulations. In contrast to the acidic peak data, the basic peak changes are greater in the presence of salt for the otherwise same buffer composition. The citrate formulation with sorbitol and no salt is the most stable formulation at pH < 6.0. In this model, the peak changes are greater at lower pH, which is the opposite of the acidic peak models. For the IgG2 prediction models, the results are similar to the IgG1 model results with some differences. For IgG2, the presence of salt in the citrate and phosphate formulations containing proline makes the level of modifications lowest in the low pH range for each buffer. We also labeled the plots for acetate and phosphate buffers. The plots for citrate buffer with proline plus salt and for citrate buffer with sorbitol and no salt are also labeled because they indicate the lowest boundaries for the values in the low pH range. All scaled parameter estimates and root mean squared error values R2 for each model are shown for all significant factors in Table 2 . The sign of the scaled estimate corresponds to the effect of the formulation factor. More changes in the peak area with the higher numerical value of the formulation factor or with the presence of the factor correspond to more positive scaled estimates.
Scaled Parameter Estimates and Root Mean Squared Error Values (R2) for the Models of CEX Peak Area Changes Obtained after 40 °C Incubation of Antistreptavidin IgG1 and IgG2 Formulations.
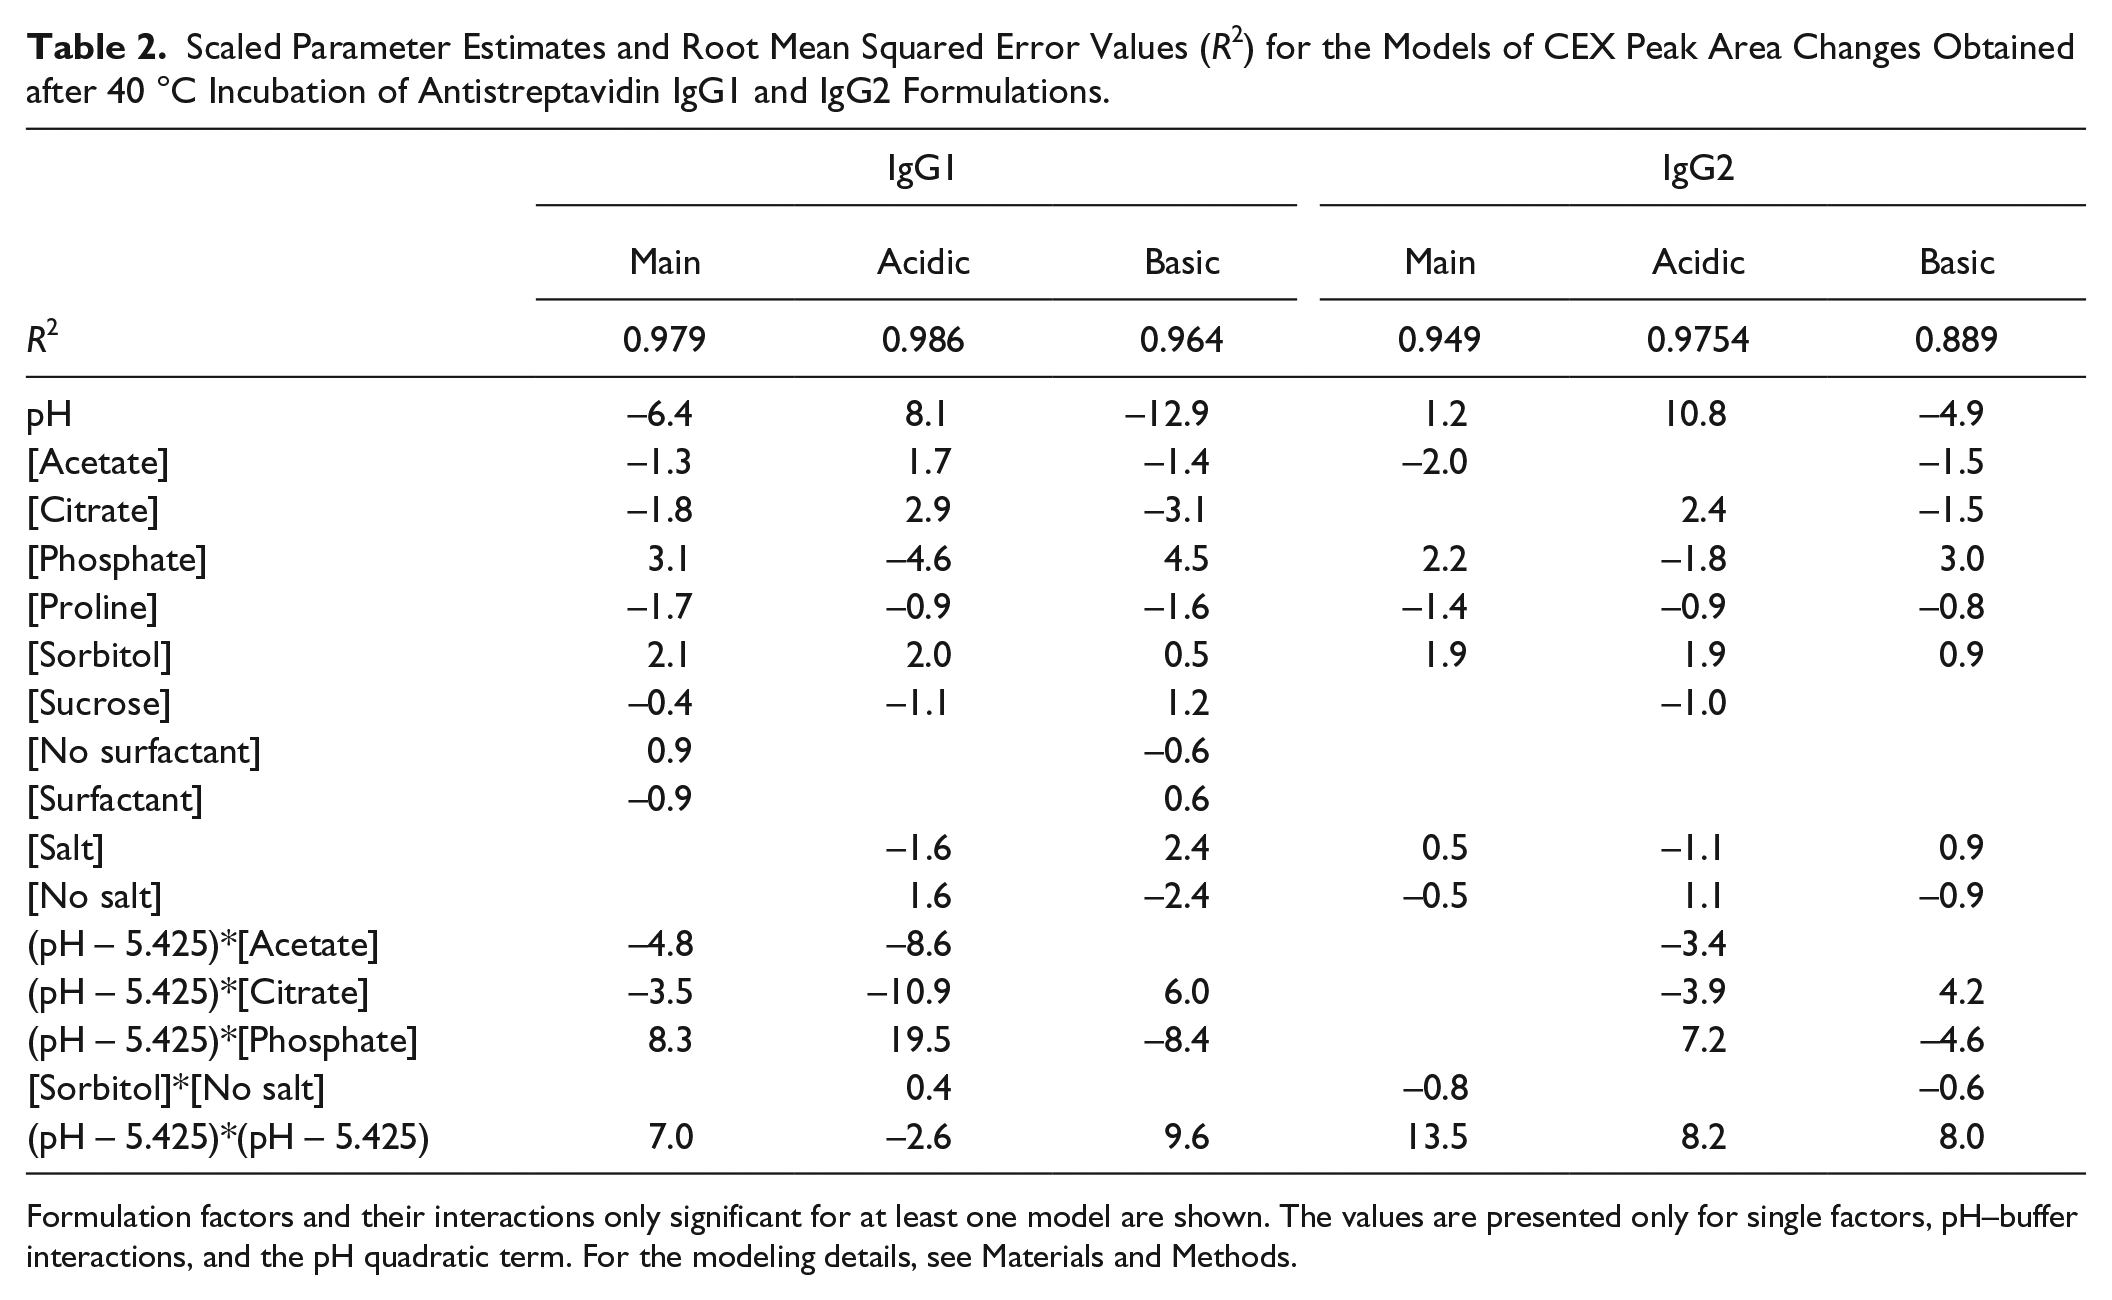
Formulation factors and their interactions only significant for at least one model are shown. The values are presented only for single factors, pH–buffer interactions, and the pH quadratic term. For the modeling details, see Materials and Methods.
Summary
Screening of candidates for chemical modifications can be a very useful tool during the early candidate selection process. This methodology is ideally suited for design of experiment (DOE) applications and for antibody molecules; it can be implemented without significant method development. It is also possible to expand the number of studied formulations and to avoid the screening of every one of them. Different experimental designs can accomplish that. 19 In summary, plate-based high-throughput CEX is a high-throughput tool that can significantly accelerate the process of formulation optimization in both the early and late stages of drug development.
Footnotes
Acknowledgements
We thank Dr. R. Matthew Fesinmeyer for discussions regarding the chemical modifications, and Dr. Gerd Kleemann and Dr. Bruce Kerwin for discussions of high-throughput assays.
Supplementary material is available online with this article.
Declaration of Conflicting Interests
The authors declared no potential conflicts of interest with respect to the research, authorship, and/or publication of this article.
Funding
The authors received no financial support for the research, authorship, and/or publication of this article.
References
Supplementary Material
Please find the following supplemental material available below.
For Open Access articles published under a Creative Commons License, all supplemental material carries the same license as the article it is associated with.
For non-Open Access articles published, all supplemental material carries a non-exclusive license, and permission requests for re-use of supplemental material or any part of supplemental material shall be sent directly to the copyright owner as specified in the copyright notice associated with the article.