
Abstract
Selection of a suitable formulation that provides adequate product stability is an important aspect of the development of biopharmaceutical products. Stability of proteins includes not only resistance to chemical modifications but also conformational and colloidal stabilities. While chemical degradation of antibodies is relatively easy to detect and control, propensity for conformational changes and/or aggregation during manufacturing or long-term storage is difficult to predict. In many cases, the formulation factors that increase one type of stability may significantly decrease another type under the same or different conditions. Often compromise is necessary to minimize the adverse effects of an antibody formulation by careful optimization of multiple factors responsible for overall stability. In this study, high-throughput stress and characterization techniques were applied to 96 formulations of anti-streptavidin antibodies (an IgG1 and an IgG2) to choose optimal formulations. Stress and analytical methods applied in this study were 96-well plate based using an automated liquid handling system to prepare the different formulations and sample plates. Aggregation and clipping propensity were evaluated by temperature and mechanical stresses. Multivariate regression analysis of high-throughput data was performed to find statistically significant formulation factors that alter measured parameters such as monomer percentage or unfolding temperature. The results of the regression models were used to maximize the stabilities of antibodies under different formulations and to find the optimal formulation space for each molecule. Comparison of the IgG1 and IgG2 data indicated an overall greater stability of the IgG1 molecule under the conditions studied. The described method can easily be applied to both initial preformulation screening and late-stage formulation development of biopharmaceutical products.
Keywords
Introduction
In modern biopharmaceutical development, it is critical to decide on a stable formulation for the drug product as early in the development process as possible. Indeed, a stable formulation is needed in preclinical development or during candidate selection to ensure that the molecules being assessed do not degrade during storage prior to testing or during the testing itself. Normally, formulation development is a part of early or late-stage clinical development when one lead candidate has already been selected. With the wide range of pH, buffer compositions, and excipients available, the number of combinations of those factors is immense. Screening of even a subset of possible formulations during a typical development process requires a large amount of material, a lot of time, and other resources. Often the first available, somewhat stable formulation is chosen to move the product into clinical trials. Usually such a selection is supported by only one or two stress conditions and by only a few analytical methods. Often formulation factors that are favorable for one output (e.g., thermal stability) are not good for another, such as colloidal stability. Low pH induces protein unfolding and aggregation, 1 but at the same time, the lower pH values minimize self-association caused by protein-ion interactions. 2 The presence of salt could be a critical factor for aggregation propensity, but it also affects stability differently depending on the pH of the solution.3–5 Salt bridges can decrease the viscosity of some antibodies at high concentrations,6,7 but at the same time they can also decrease conformational stability. A given excipient can be favorable for stability under one condition and unfavorable under other conditions, 8 and also mixtures of excipients can have their positive or negative effects. It is difficult to thoroughly evaluate a multitude of factors in one set of stability studies performed using typical low-throughput procedures. A large number of factors dictate application of preliminary experimental design for multiple samples and careful statistical analysis of a large number of data points. Recently, the concept of design of experiment (DOE) has been widely used in formulation development. 9 A DOE approach not only decreases the number of experiments to be performed but also creates the platform for data analysis. To establish correlations between factors and the stability of proteins, different statistical methods have been implemented.10,11 With the recent advancements in automation and computer science, high-throughput methods could be automated to create a continuous process starting from sample preparation through data collection and analysis. Recently, researchers from Novartis Pharma AG constructed a custom-designed automated platform for formulation screening 12 and used it to collect data on several antibodies and many formulation conditions. The results were also compared with classic approaches and were found comparable. In another example of work with high-throughput methods, scientists from Merck, Inc. screened formulations of three antibodies for aggregation propensity and thermal stability under increased temperatures. 13 In both studies, microplates were used to store antibody formulations under the stress conditions and to place the samples into different instruments for measurements. Here we report an extension of that work where we employ 96-well microtiter plates as the platform carrier for formulation screening under stress conditions using the analytical methods of differential scanning fluorimetry (DSF) to assess conformational stability and size exclusion chromatography (SEC) to measure self-association. These are the first two of multiple analytical methods being developed for this high-throughput platform. The main purpose of this study was not to discover new properties of antibody formulations but rather to present the successful application of the high-throughput platform starting from automatic sample preparation, followed by high-throughput analytical assays and completed by thorough data analysis. With the help of statistical analysis, we have established correlations or the lack thereof between protein stability and formulation factors. Furthermore, we were able to distinguish the difference between IgG1 and IgG2 subtypes of the same antibody in stability responses to stress and formulation components. Such techniques can be easily complemented by or combined with other methods for full property screening, including colloidal stability and chemical stability, of biopharmaceutical products.
Materials and Methods
Monoclonal Antibody Formulation Preparation
Anti-streptavidin IgG1 and IgG2 monoclonal antibodies were purified from mammalian cell culture and were dialyzed into buffer containing 20 mM sodium acetate at pH 5.2. The dialysis was performed at a 1:100,000 volume ratio at 4 °C, including three buffer changes. The dialyzed protein was concentrated to ~50 mg/mL by centrifugation using 10,000 MWCO centrifugal filters (Amicon Ultra-15; Millipore Corporation, Billerica, MA).
Excipient stock solutions such as sucrose, sorbitol, proline, and sodium chloride were prepared in water at high molar concentrations. All stock formulations and protein solutions were prepared in plastic vials and placed onto a TECAN (Männedorf, Switzerland) liquid handling system platform for further automated mixing. The final formulation compositions were created in two 48-well plates of 3 mL per well volume using a TECAN script. Then formulations were distributed by appropriate volume into 96-well plates assigned for stress or analytical assays. Separate plates were prepared for each time point and for each stress condition. The plates were hard-shell, full-skirted 96-well PCR plates (cat. HSP-9601; BioRad Laboratories, Hercules, CA). The following excipients were used: sucrose (lot C26H07; J. F. Baker, Columbus, OH), D-sorbitol (lot 075K0078; Sigma-Aldrich, St. Louis, MO), and L-proline (lot MKBH7930V; Sigma-Aldrich). The concentration of acetate, citrate, and phosphate buffers was 10 mM. The final concentration was 270 mM for each excipient, 0.001% for polysorbate (Tween 20) and 100 mM for NaCl.
Differential Scanning Fluorimetry
DSF measurements were performed according to the previously developed method. 14 Protein formulations were added to a 96-well plastic microplate at 19.0 µL per well. SYPRO Orange dye (Invitrogen, Carlsbad, CA) was diluted (1:250 dilution of stock) in water, and 1 µL of the diluted dye was added to each well, making the final dilution 1:5000. DSF measurements were made using a Bio-Rad CFX96 thermal cycler platform instrument (Bio-Rad Laboratories). The fluorescence of the dye during protein melting was monitored using the “FRET” mode while the temperature was increased from 20 °C to 95 °C at 0.1 °C increments. Samples were equilibrated at each temperature for 3 s before taking the fluorescence readings. The fluorescence signal was then plotted as a function of temperature, and the temperature of hydrophobic exposure, Th, was determined as the midpoint of the lowest temperature transition from the first derivative plot as determined by the CFX Manager software (Bio-Rad Laboratories).
Mechanical Agitation Stress
The 96-well plates with antibody formulations were sealed and mechanical agitation stress was applied using an orbital shaker (MixMate Orbital Shaker; Eppendorf North America, Hauppauge, NY) according to the method described as follows: each 96-well round-bottom plate containing 200 µL per well of the sample formulation solution was sealed and shaken at 4 °C for 24 h at a constant speed of 2000 rpm. After agitation, plates were centrifuged at 3000 rpm to sediment large insoluble particles, and the supernatant was transferred to another plate for analysis.
High-Throughput Size Exclusion Chromatography
The amount of soluble mAb oligomer present in each formulation was analyzed by high-throughput SEC. The method employed a Waters Acquity H-class UPLC system (Waters Corporation, Milford, MA) equipped with a UV diode array detector. Then, 10 µg of each sample was injected onto a single gel filtration column (ACQUITY UPLC BEH200 SEC 1.7 µm, 4.6 × 150 mm; Waters Corporation) with a mobile phase containing 100 mM sodium phosphate and 250 mM sodium chloride (pH 6.8) at a flow rate of 0.4 mL/min and a runtime of 6 min. The results were analyzed using Empower software (Waters Corporation), and the peak integration was calculated using the UV absorbance at 280 nm. The results were reported as monomer peak percentage of total integrated area.
Data Analysis and Interpretation
Both continuous and categorical variables were included in the experimental design, pH as a continuous variable and buffer, excipients, and detergent as categorical variables. There were 96 results from each experiment for all combinations of formulation conditions. An example of using such a design approach has been shown in our previous report. 15 The statistical software package JMP 7.02 and Proc GLM in SAS version 9.3 (SAS Institute, Inc., Cary, NC) were used for the calculations. The method of standard least squares with emphasis on effect screening was used in the regression models for data fitting. The modeling process starts with a regression model consisting of the main effects of factors along with their two-way interactions and a quadratic term for pH values. Scaled estimates were used to compare the effects of different formulation factors. Observations were considered outliers and excluded if the absolute values of their model Studentized residuals were greater than 2. After data exclusion, the modeling would then repeat, and a list of significant model terms (p < 0.05) was selected for the final model. The regression model was used to predict response values for given factor values. Based on the model, a prediction formula was created and a graph representing values obtained by experiment versus predicted values was plotted for both Th and percentage of monomer. The deviation of such a fit from the linear model was characterized by R2 values.
Results and Discussion
Thermostability Screening by DSF
DSF was used to determine the temperature of hydrophobic exposure, Th, of 96 formulation conditions. The Th is an approximation of the unfolding or melting temperature, Tm, often determined by differential scanning calorimetry (DSC) for monoclonal antibodies.14,16 Results of the determination of Th for each of the 96 formulations are shown in Table 1A , B . For both IgG1 ( Table 1A ) and IgG2 ( Table 1B ), the effect of pH was very visible. Th values appeared to be significantly lower than that for higher pH. The addition of proline increased the thermostability at pH 3.5, but proline slightly decreased Th values for formulations at higher pH, where sucrose had a positive effect. The Th values for an IgG2 were lower than for an IgG1 in the same formulations, as shown in Table 1C , where the differences between the Th values for IgG1 and IgG2 were calculated for each formulation on the plate. The IgG1 molecule appeared to be more stable, especially in formulations with salt at low pH.
Th Values Determined by Differential Scanning Fluorimetry for (
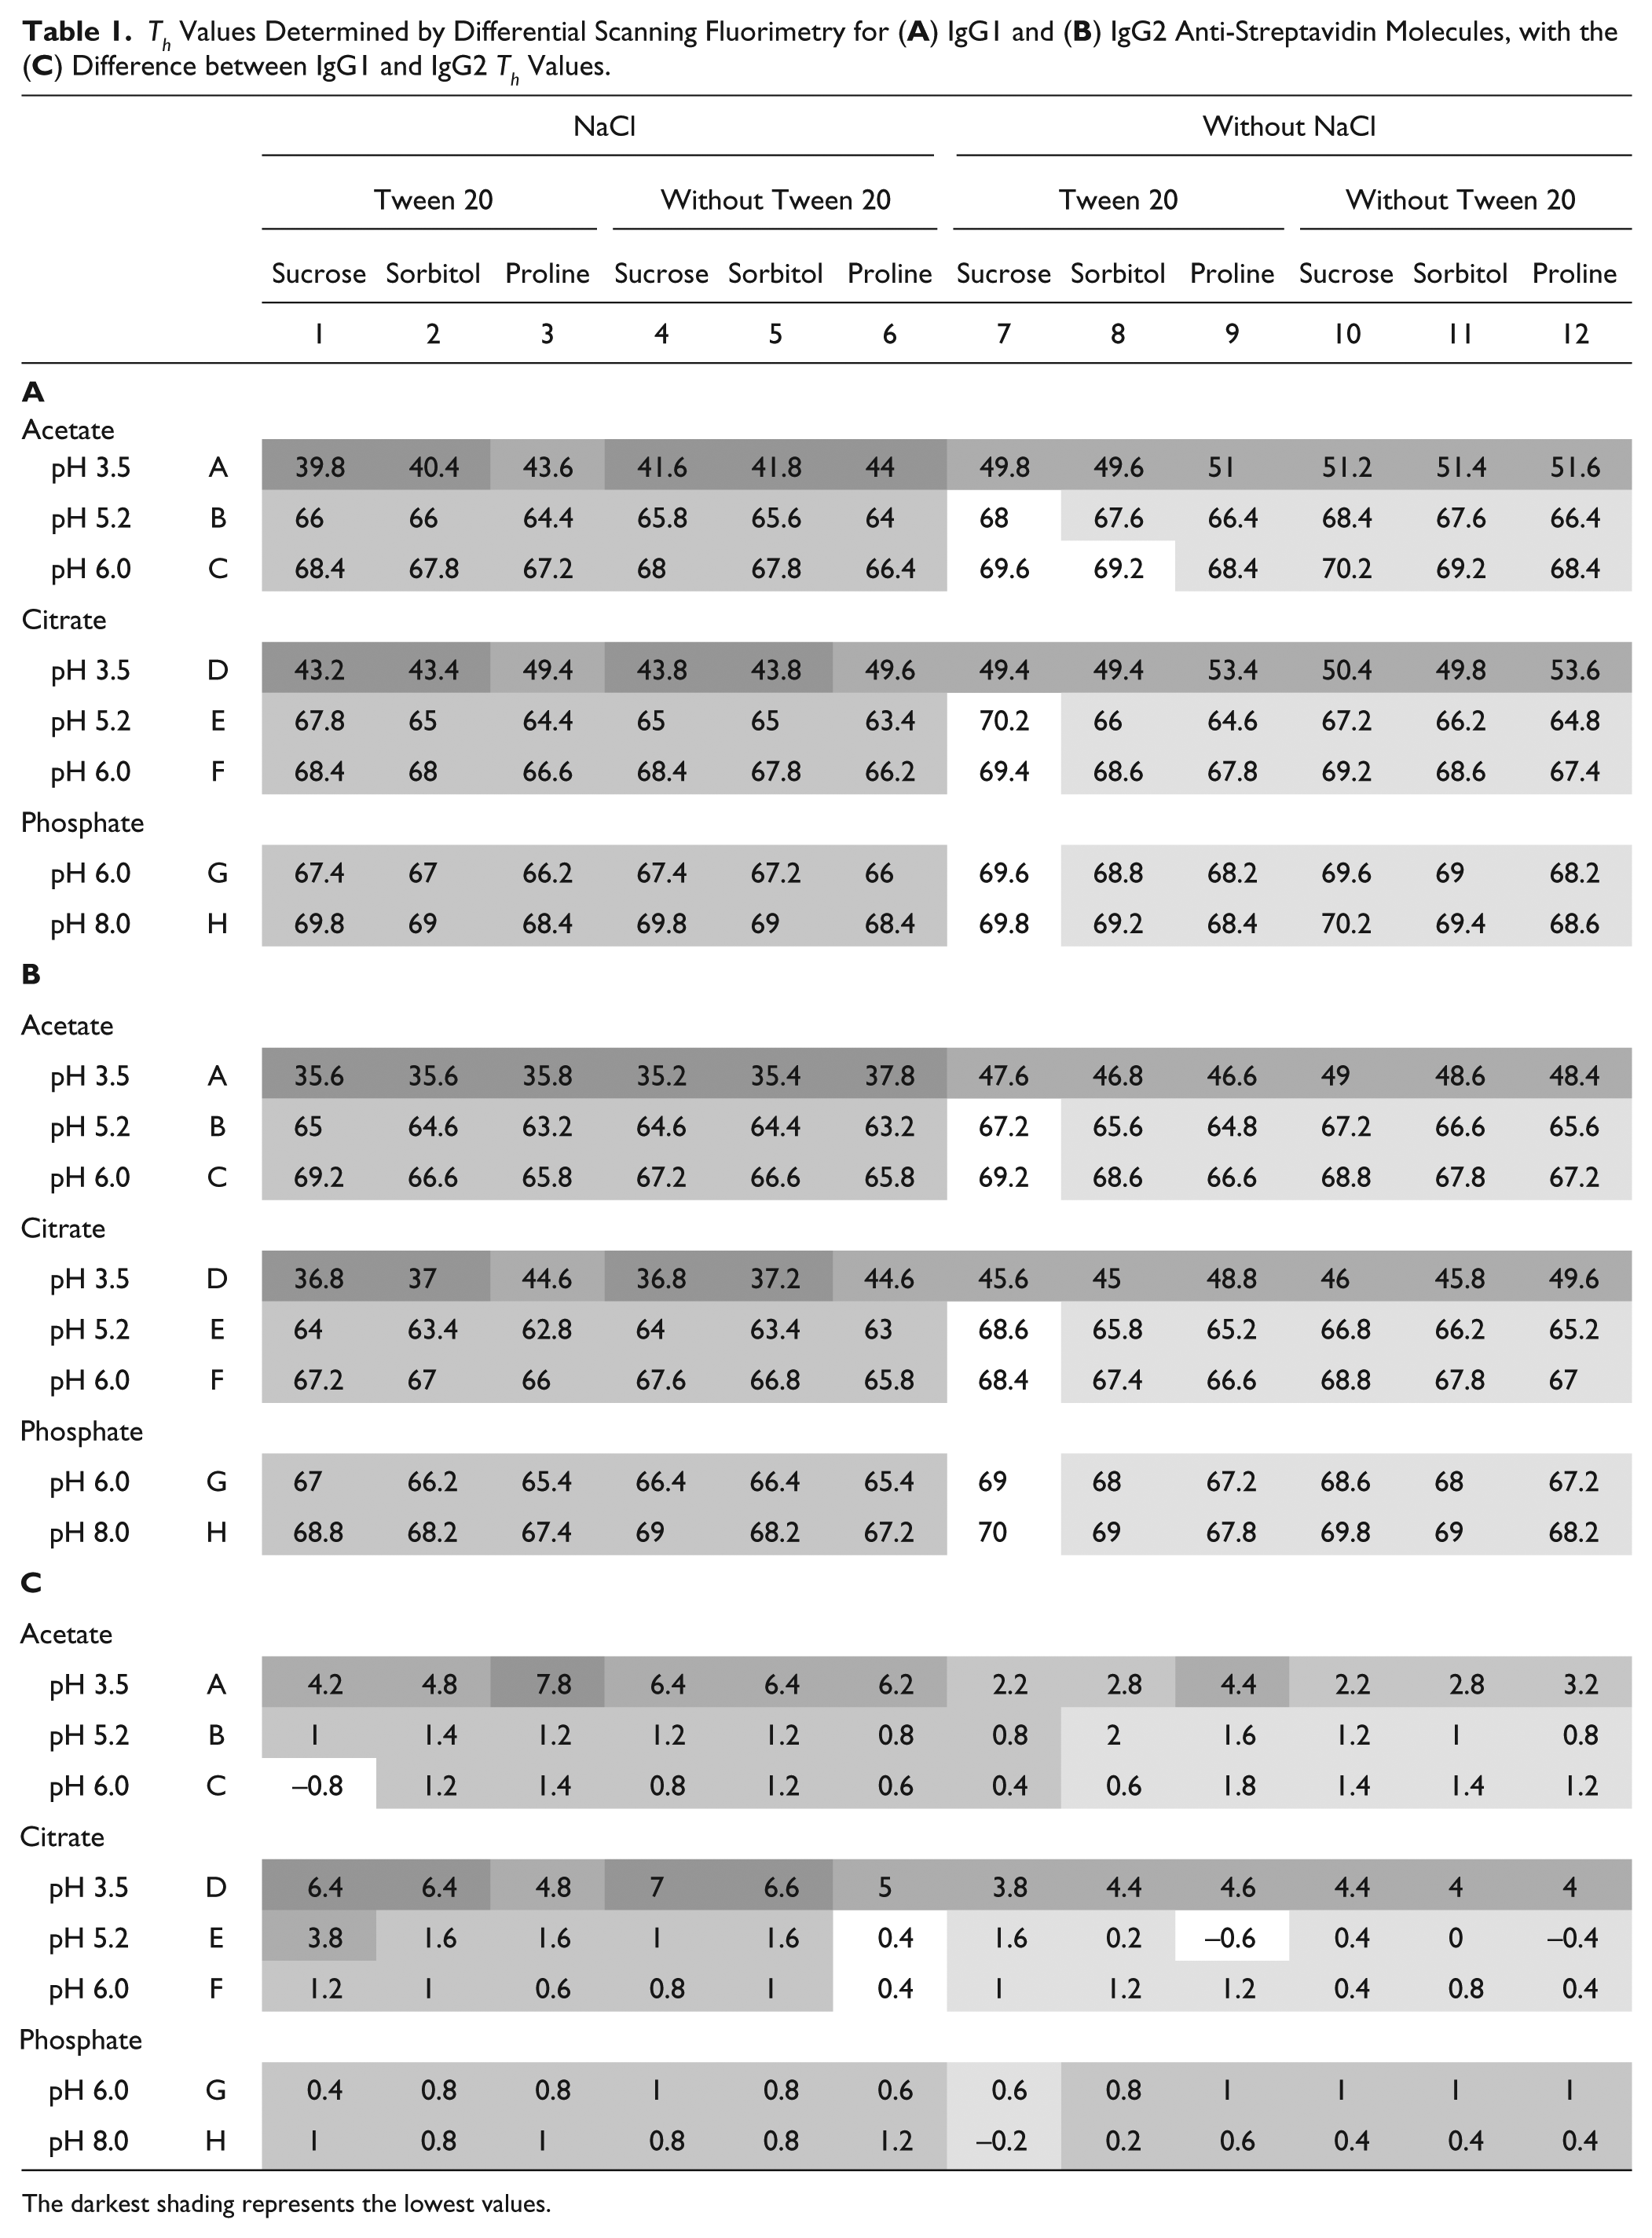
The darkest shading represents the lowest values.
A thorough analysis of the effects of formulation factors was performed by the application of multivariable statistical analysis, as described in the Materials and Methods. The statistical significance of each formulation factor can be used to determine whether the effect on Th was real or due to random variation. First, the goodness of the model was assessed by plotting the experimental data versus the data predicted by our regression models. As shown in Figure 1A , B , the fits had high R2 values of 0.988 for both the IgG1 and IgG2 molecules (i.e., roughly 99% of the variation in the Th response is explained by the corresponding model). To estimate the significance of the formulation factors, we used corresponding scaled estimates, which represented the positive or negative effect on thermostability and its relative magnitude in the predictive regression model. The significance of the factors was determined by the p value. A p value of 0.05 or less for the factor was considered statistically significant (see Materials and Methods). In the table inserted into Figure 1 , scaled estimates are presented for all statistically significant factors and their interactions. The most significant factor was pH and the term pH*pH, creating the curvature on Th response versus pH values. Our results are consistent with a previously observed increase of unfolding temperature at higher pH. 17 The buffer type is also significant with phosphate presence as a negative factor and citrate or acetate presence as positive factors. According to Figure 1 , the presence of salt is also a significant negative factor (see also Table 1A , B ). Some interactions of pH, buffer, and salt factors are important in the model. Based on the presented data, the best thermally stable formulation for both IgGs would be acetate or citrate at pH 5.0–6.0, with no salt. At this range of pH values, sucrose and sorbitol make better excipients than does proline. But if antibody formulations are exposed to low pH, proline definitely helps to increase thermostability of the IgG molecule.
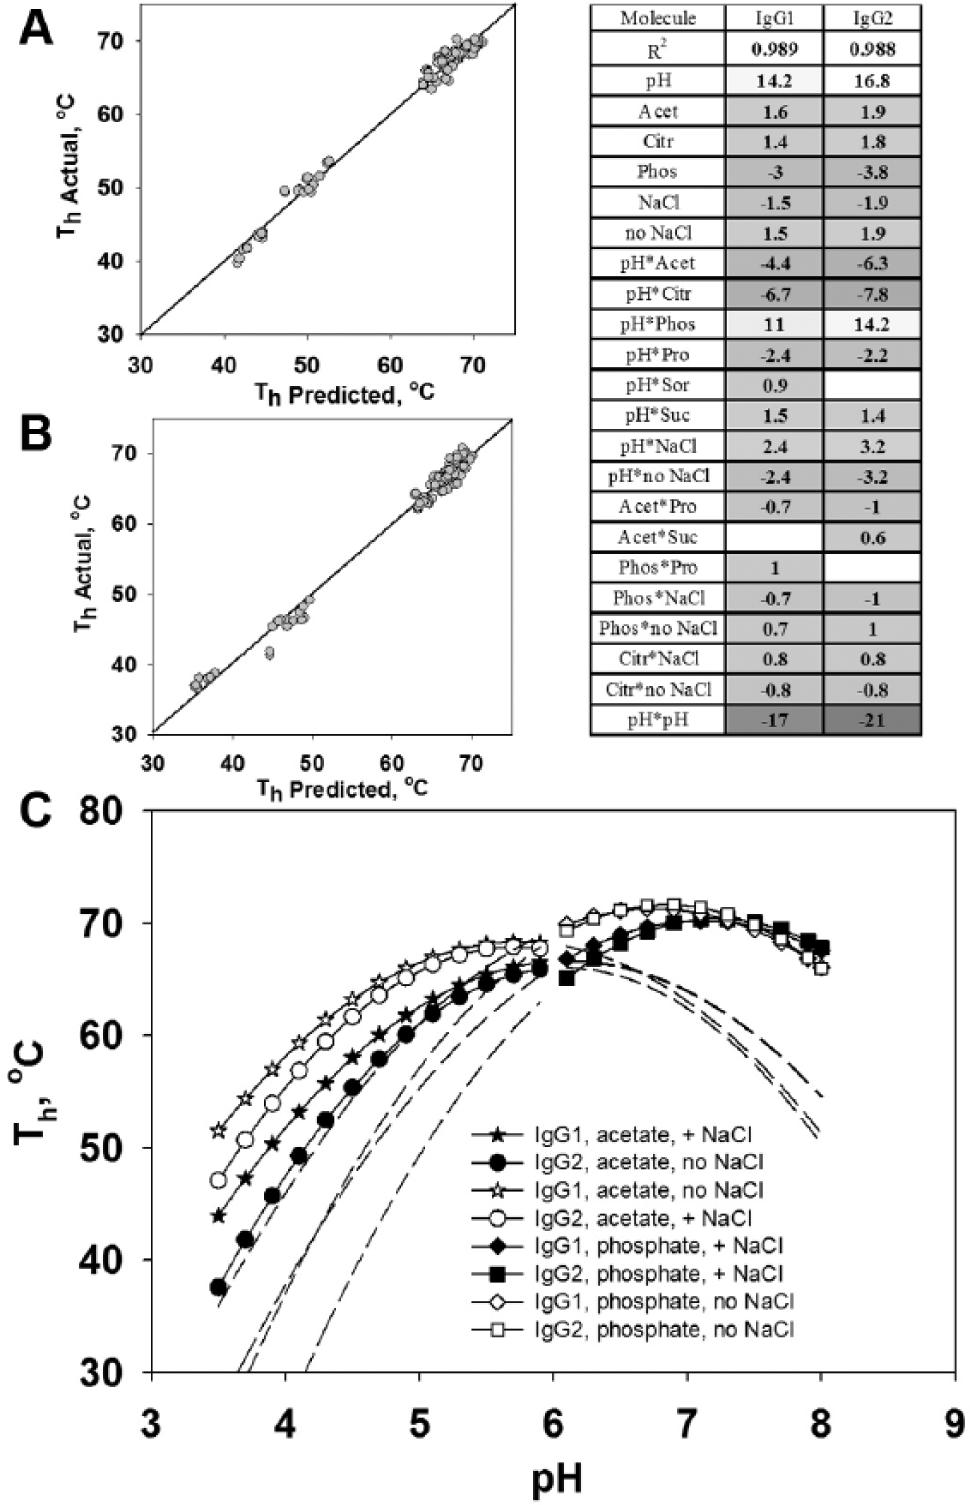
Experimentally determined Th values plotted against the predicted Th for IgG1 (
Considering all significant factors in the model, we plotted a prediction function of Th versus pH for both IgG1 and IgG2 in different formulations (see Fig. 1C ) according to the described model. The data are shown for acetate and phosphate buffers with and without salt. Extrapolated values, covering the pH range where experimental data were not taken, are indicated by the dashed lines. The curves for citrate buffer fell between the curves for acetate and phosphate and are not shown. The effects of excipients were not significant, and graphs without detergent, with only proline, are shown. According to Figure 1C , maximum thermostability was predicted in the range of pH 5.5–6.0 for acetate buffer and in the range of pH 6.7–7.1 for phosphate buffer. The presence of salt decreased Th, and this effect was more significant at low pH. Salt also shifted the Th prediction to a higher pH. By this analysis, IgG1 was predicted to be more stable than IgG2. The difference between Th values for IgG1 and IgG2 was the greatest at low pH, becoming virtually nonexistent at pH >6.0. Statistical analysis has presented a complete picture of thermostability of both IgG1 and IgG2 molecules in 96 formulations. We determined the significant formulation factors and predicted the Th dependence on them with a high level of linearity between actual and predicted values. Using a prediction model, we can select formulations with the maximum thermal stability. According to our analysis, formulations with pH around the range of 5.5–5.8 and with no salt are more stable in acetate buffer. Excipients and detergent are not significant for thermostability in that pH range. Formulations in phosphate buffer have higher thermostability at pH ~6.7–6.9 without salt. These results are in good correlation with previously published studies on the conformational stability of monoclonal antibodies.18,19 A good correlation has been found between the temperature of unfolding and aggregation propensity. 20 Other works focused on the general dependencies of protein aggregation mechanisms and conformational stability. Several mechanisms have been proposed to relate aggregation and unfolding.21,22
Stability at Different Temperatures
The samples were incubated at different temperatures for 2 weeks, and the monomer percentage was determined by SEC. Monomer percentage values from SEC for all formulations and temperatures are presented in Table 2 for IgG1 and in Table 3 for IgG2. For the scaled estimates obtained by regression models from SEC results and for representative SEC chromatograms after incubation at different temperatures, see the Supplemental Data.
Monomer Percentage Values Determined by Size Exclusion Chromatography for IgG1 Anti-Streptavidin Molecule after Incubation at (
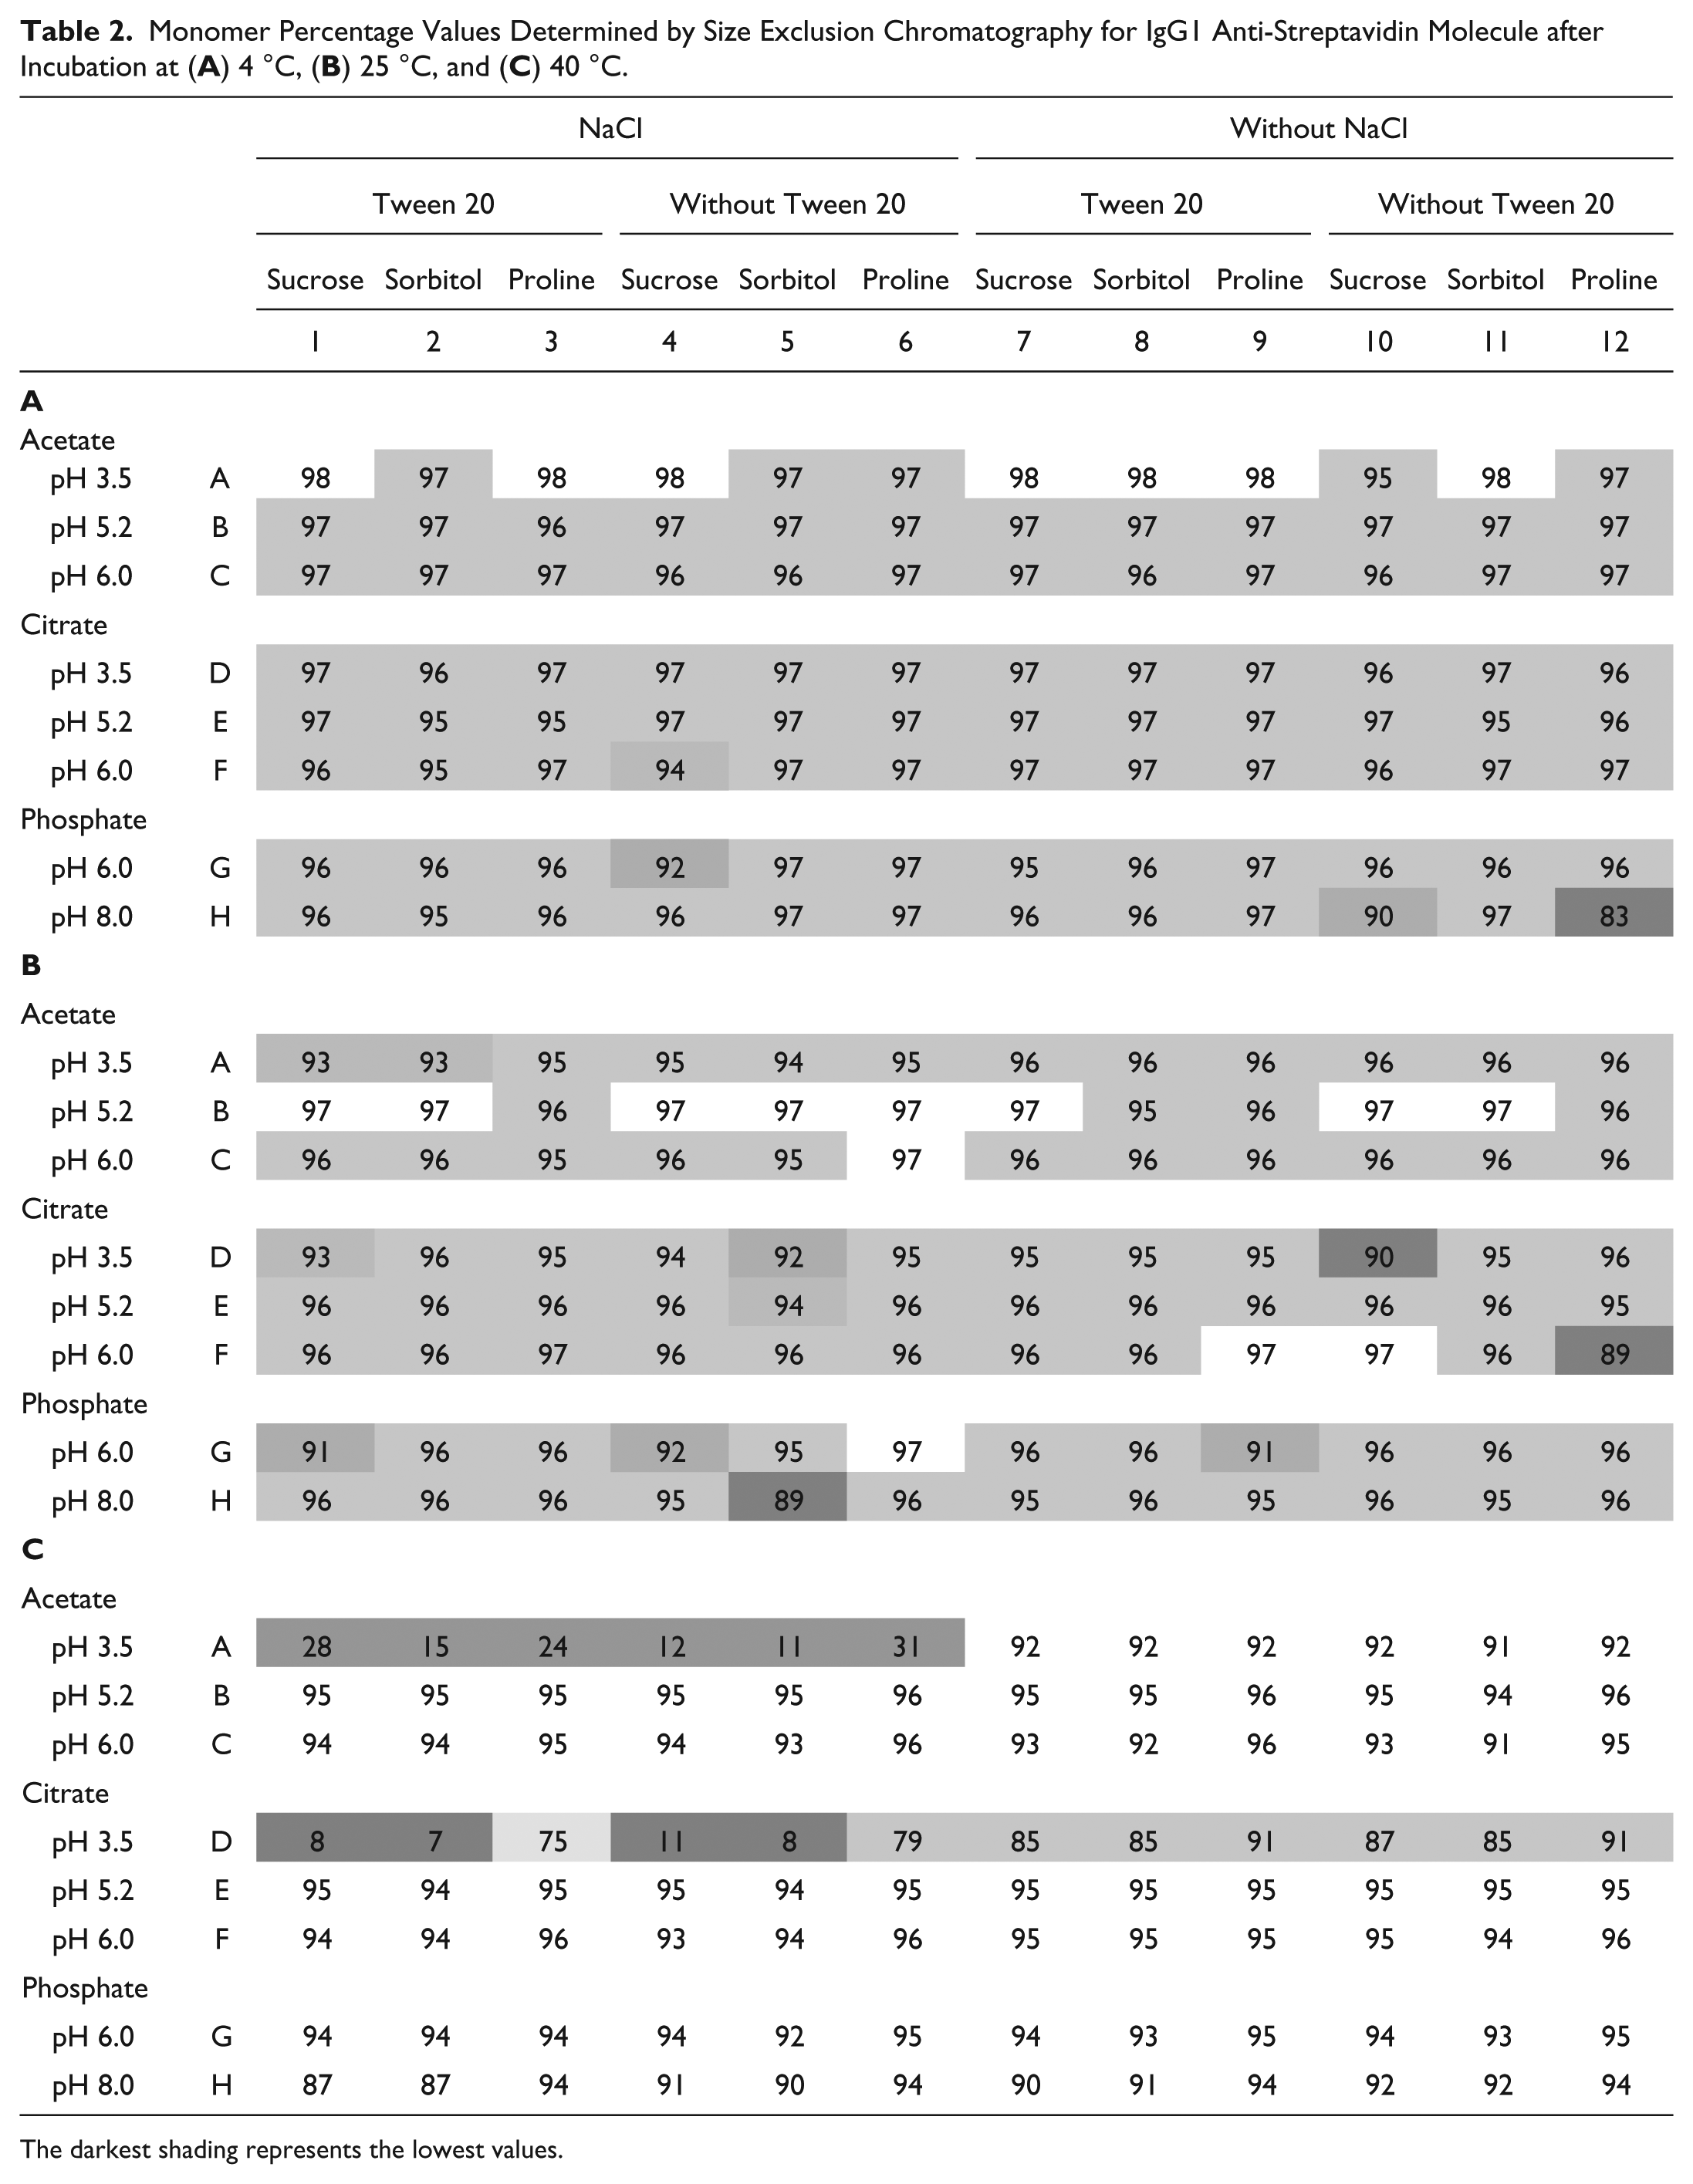
The darkest shading represents the lowest values.
Monomer Percentage Values Determined by Size Exclusion Chromatography for IgG2 Anti-Streptavidin Molecule after Incubation at (
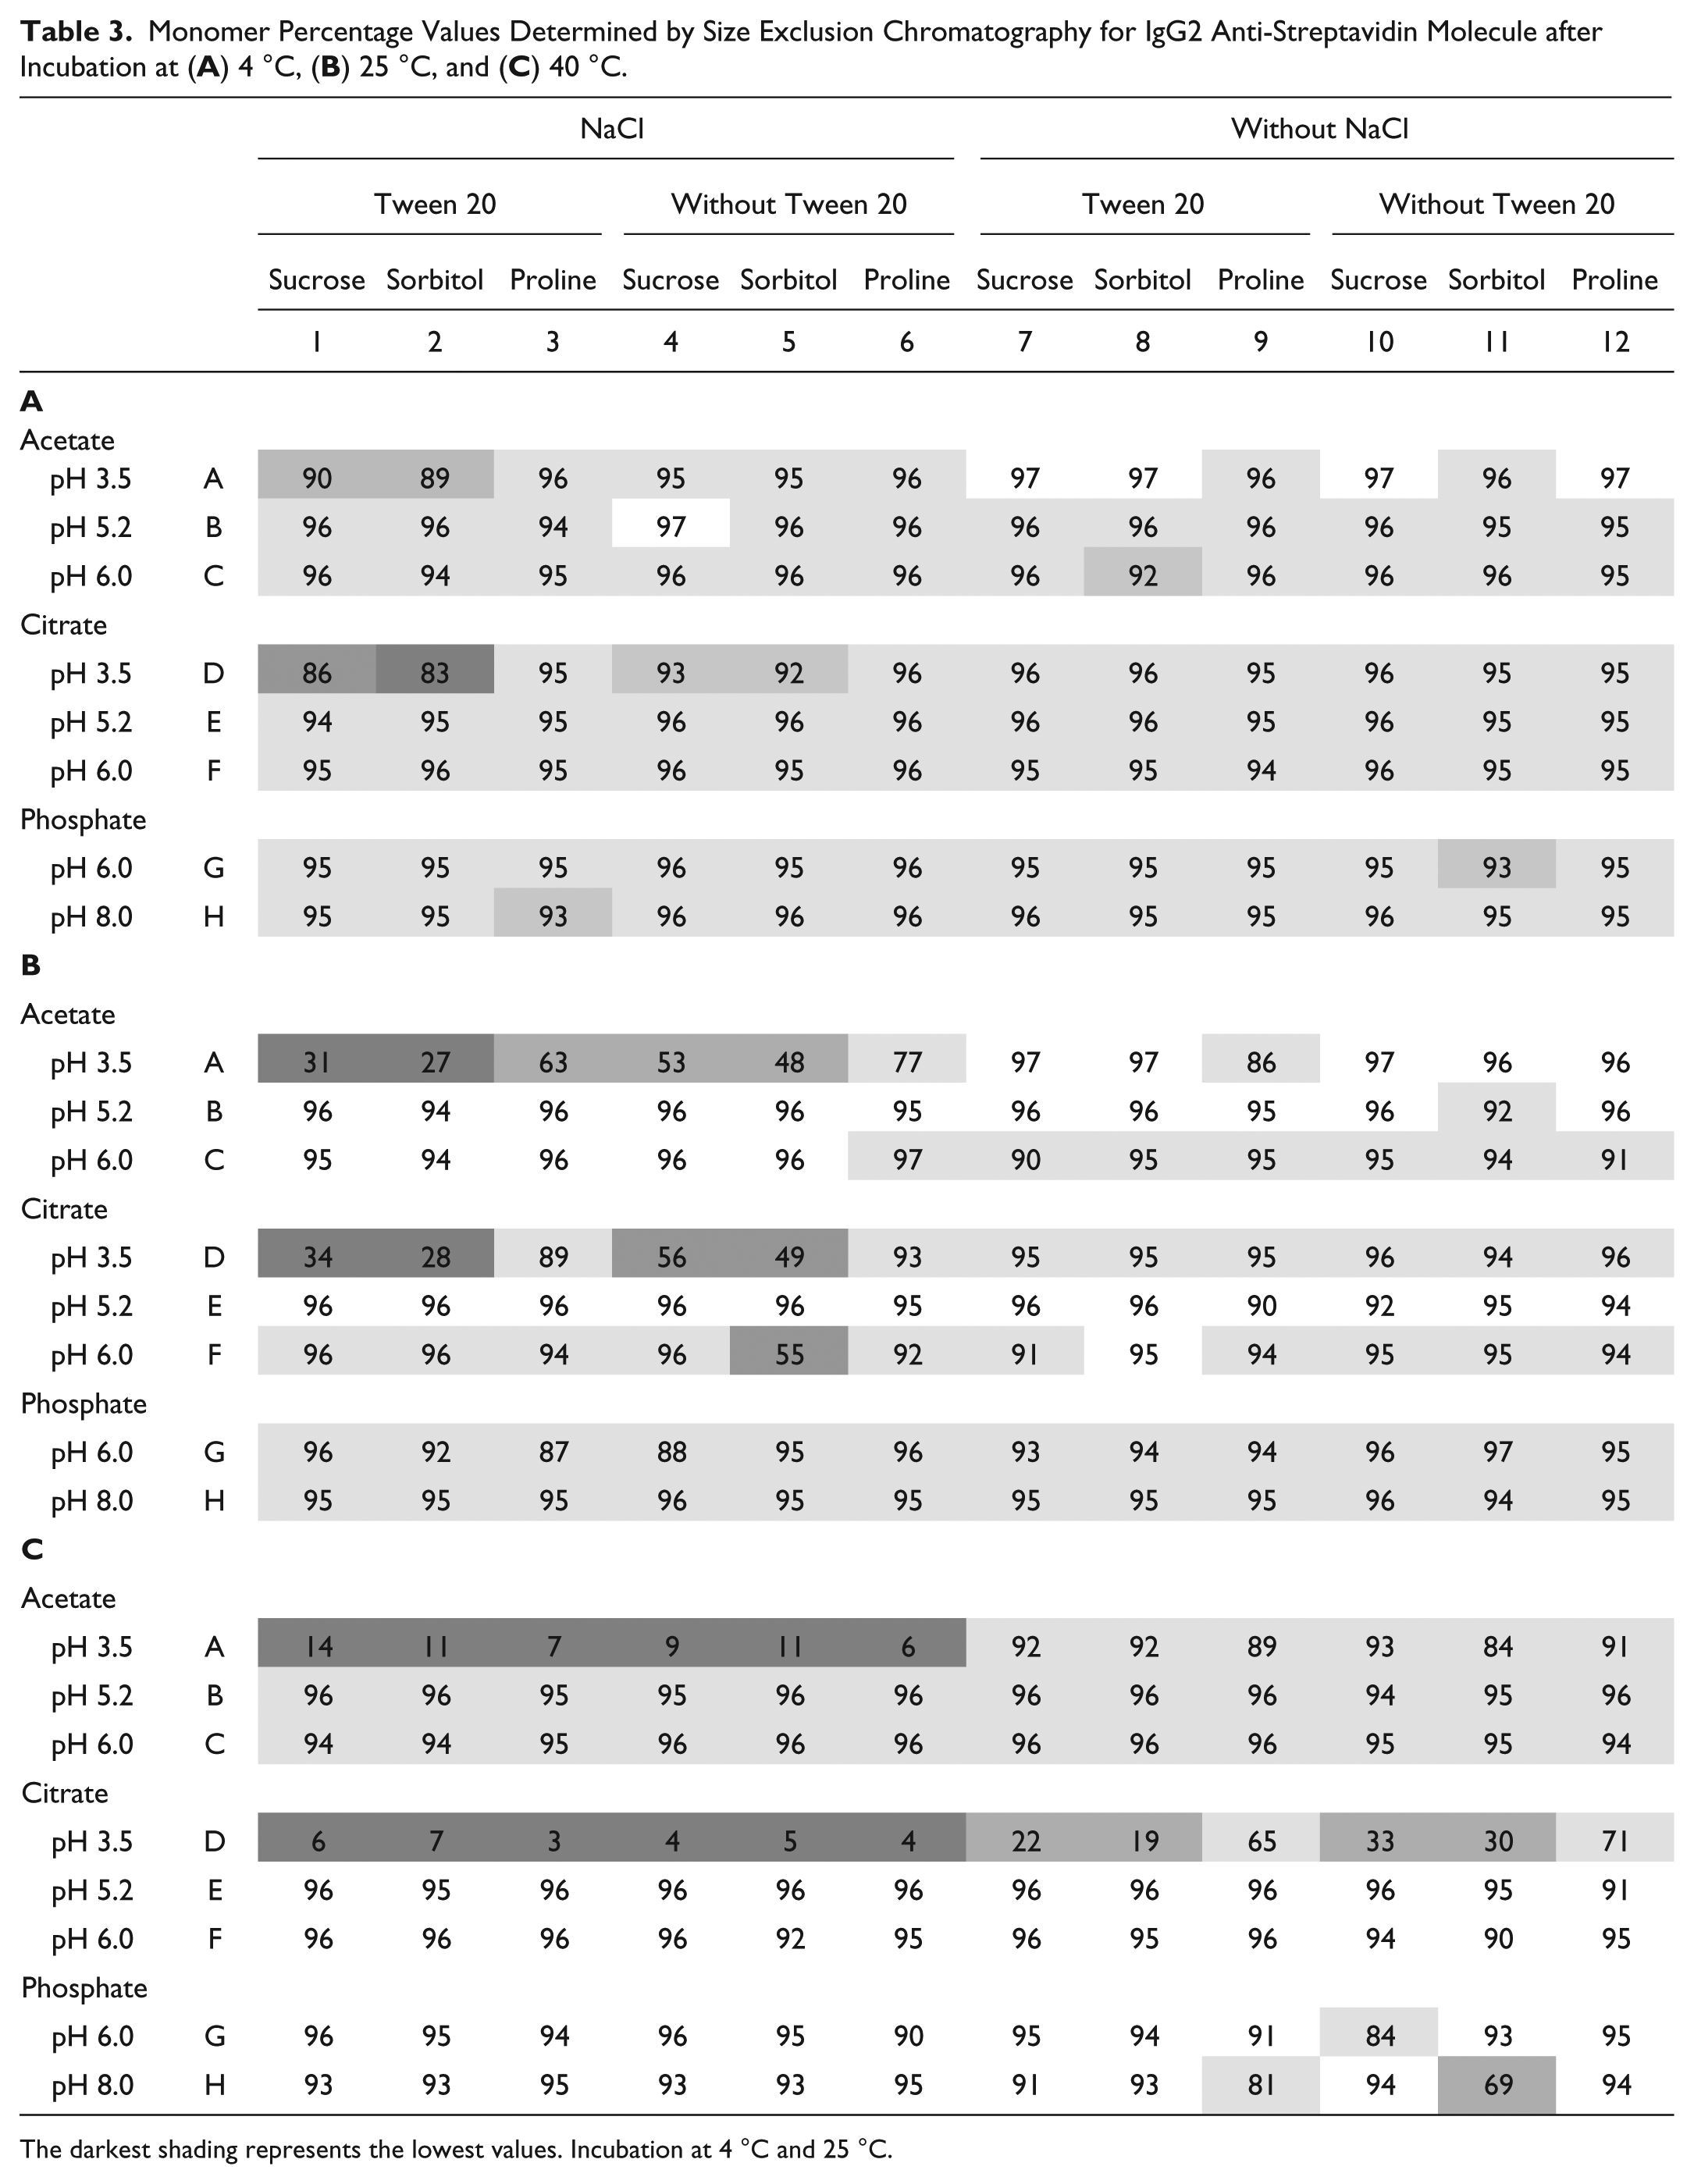
The darkest shading represents the lowest values. Incubation at 4 °C and 25 °C.
Incubation of an IgG1 and an IgG2 at 4 °C in the 96 different formulation conditions showed little degradation for IgG1 when analyzed by SEC ( Table 2A ). Data for IgG2 ( Table 3A ) showed more degradation in general for all samples and specifically at pH 3.5 in both acetate and citrate buffers. Also, citrate buffer seemed to decrease stability in comparison with acetate and phosphate buffers. A more thorough analysis by multivariate regression of the SEC IgG1 and IgG2 data showed poor prediction models. This lack of correlation can be simply explained by the low level of degradation at 4 °C. Similar to the results from the 4 °C study, there was no visible correlation of degradation with formulation factors for the IgG1 and IgG2 samples after 25 °C incubation by using SEC results ( Tables 2B and 3B ). The samples in citrate buffer and at pH 3.5 were less stable. The results obtained by SEC after incubation at 25 °C showed no acceptable prediction model for the IgG1 molecule. But the model for the IgG2 had a better prediction power, and the effect of formulation factors on the IgG2 samples was much more pronounced at 25 °C than at 4 °C.
Incubation at 40 °C
At the highest incubation temperature, some samples were almost completely degraded. According to the SEC data in Tables 2C and 3C , the samples without salt at pH 3.5 had a low percentage of monomer, and this effect was more pronounced than for the 4 °C incubation data. In fact, for IgG2 samples, there was no more than 7% of monomer left in the citrate buffer at these conditions. The positive effect of proline on stability at pH 3.5 was clear for IgG1 samples with salt and IgG2 samples in citrate without salt. IgG2 samples with salt were degraded to the level where proline could no longer help.
As expected, at high temperature, there were more degradation and more significant factors (see Supplemental Data). According to the SEC-based model, the most significant single factors were pH and its square term pH*pH, with the higher values for the IgG2 molecule. In the analysis, types of buffers were significant factors for IgG2 and, with the exception of acetate buffer, also for IgG1. Among excipients, only the presence of proline significantly increased monomer percentage in the SEC samples for IgG1. Salt was a negative factor, with comparable values for IgG1 and IgG2 molecules.
Stability after Mechanical Agitation
Mechanical agitation is another stress to test the stability of formulations under conditions of induced protein exposure to a liquid-air interface. Results shown in Table 4 indicate good stability of IgG1 samples with the range of monomer percentage values from 96.9 to 99.2. There was no visible dependence on formulation conditions. IgG2 results showed a decrease in monomer percentage in the samples at low pH and in the presence of salt. The absence of detergent also decreased the stability of agitated samples. Statistical analysis produced relatively weak prediction models, indicating low correlations of SEC data with formulation factors. Only IgG2 results provided a good prediction for a positive effect for acetate and a negative one for phosphate. Increased pH values and the presence of detergent slightly increased formulation stability for IgG2.
Monomer Percentage Values Determined by Size Exclusion Chromatography for (
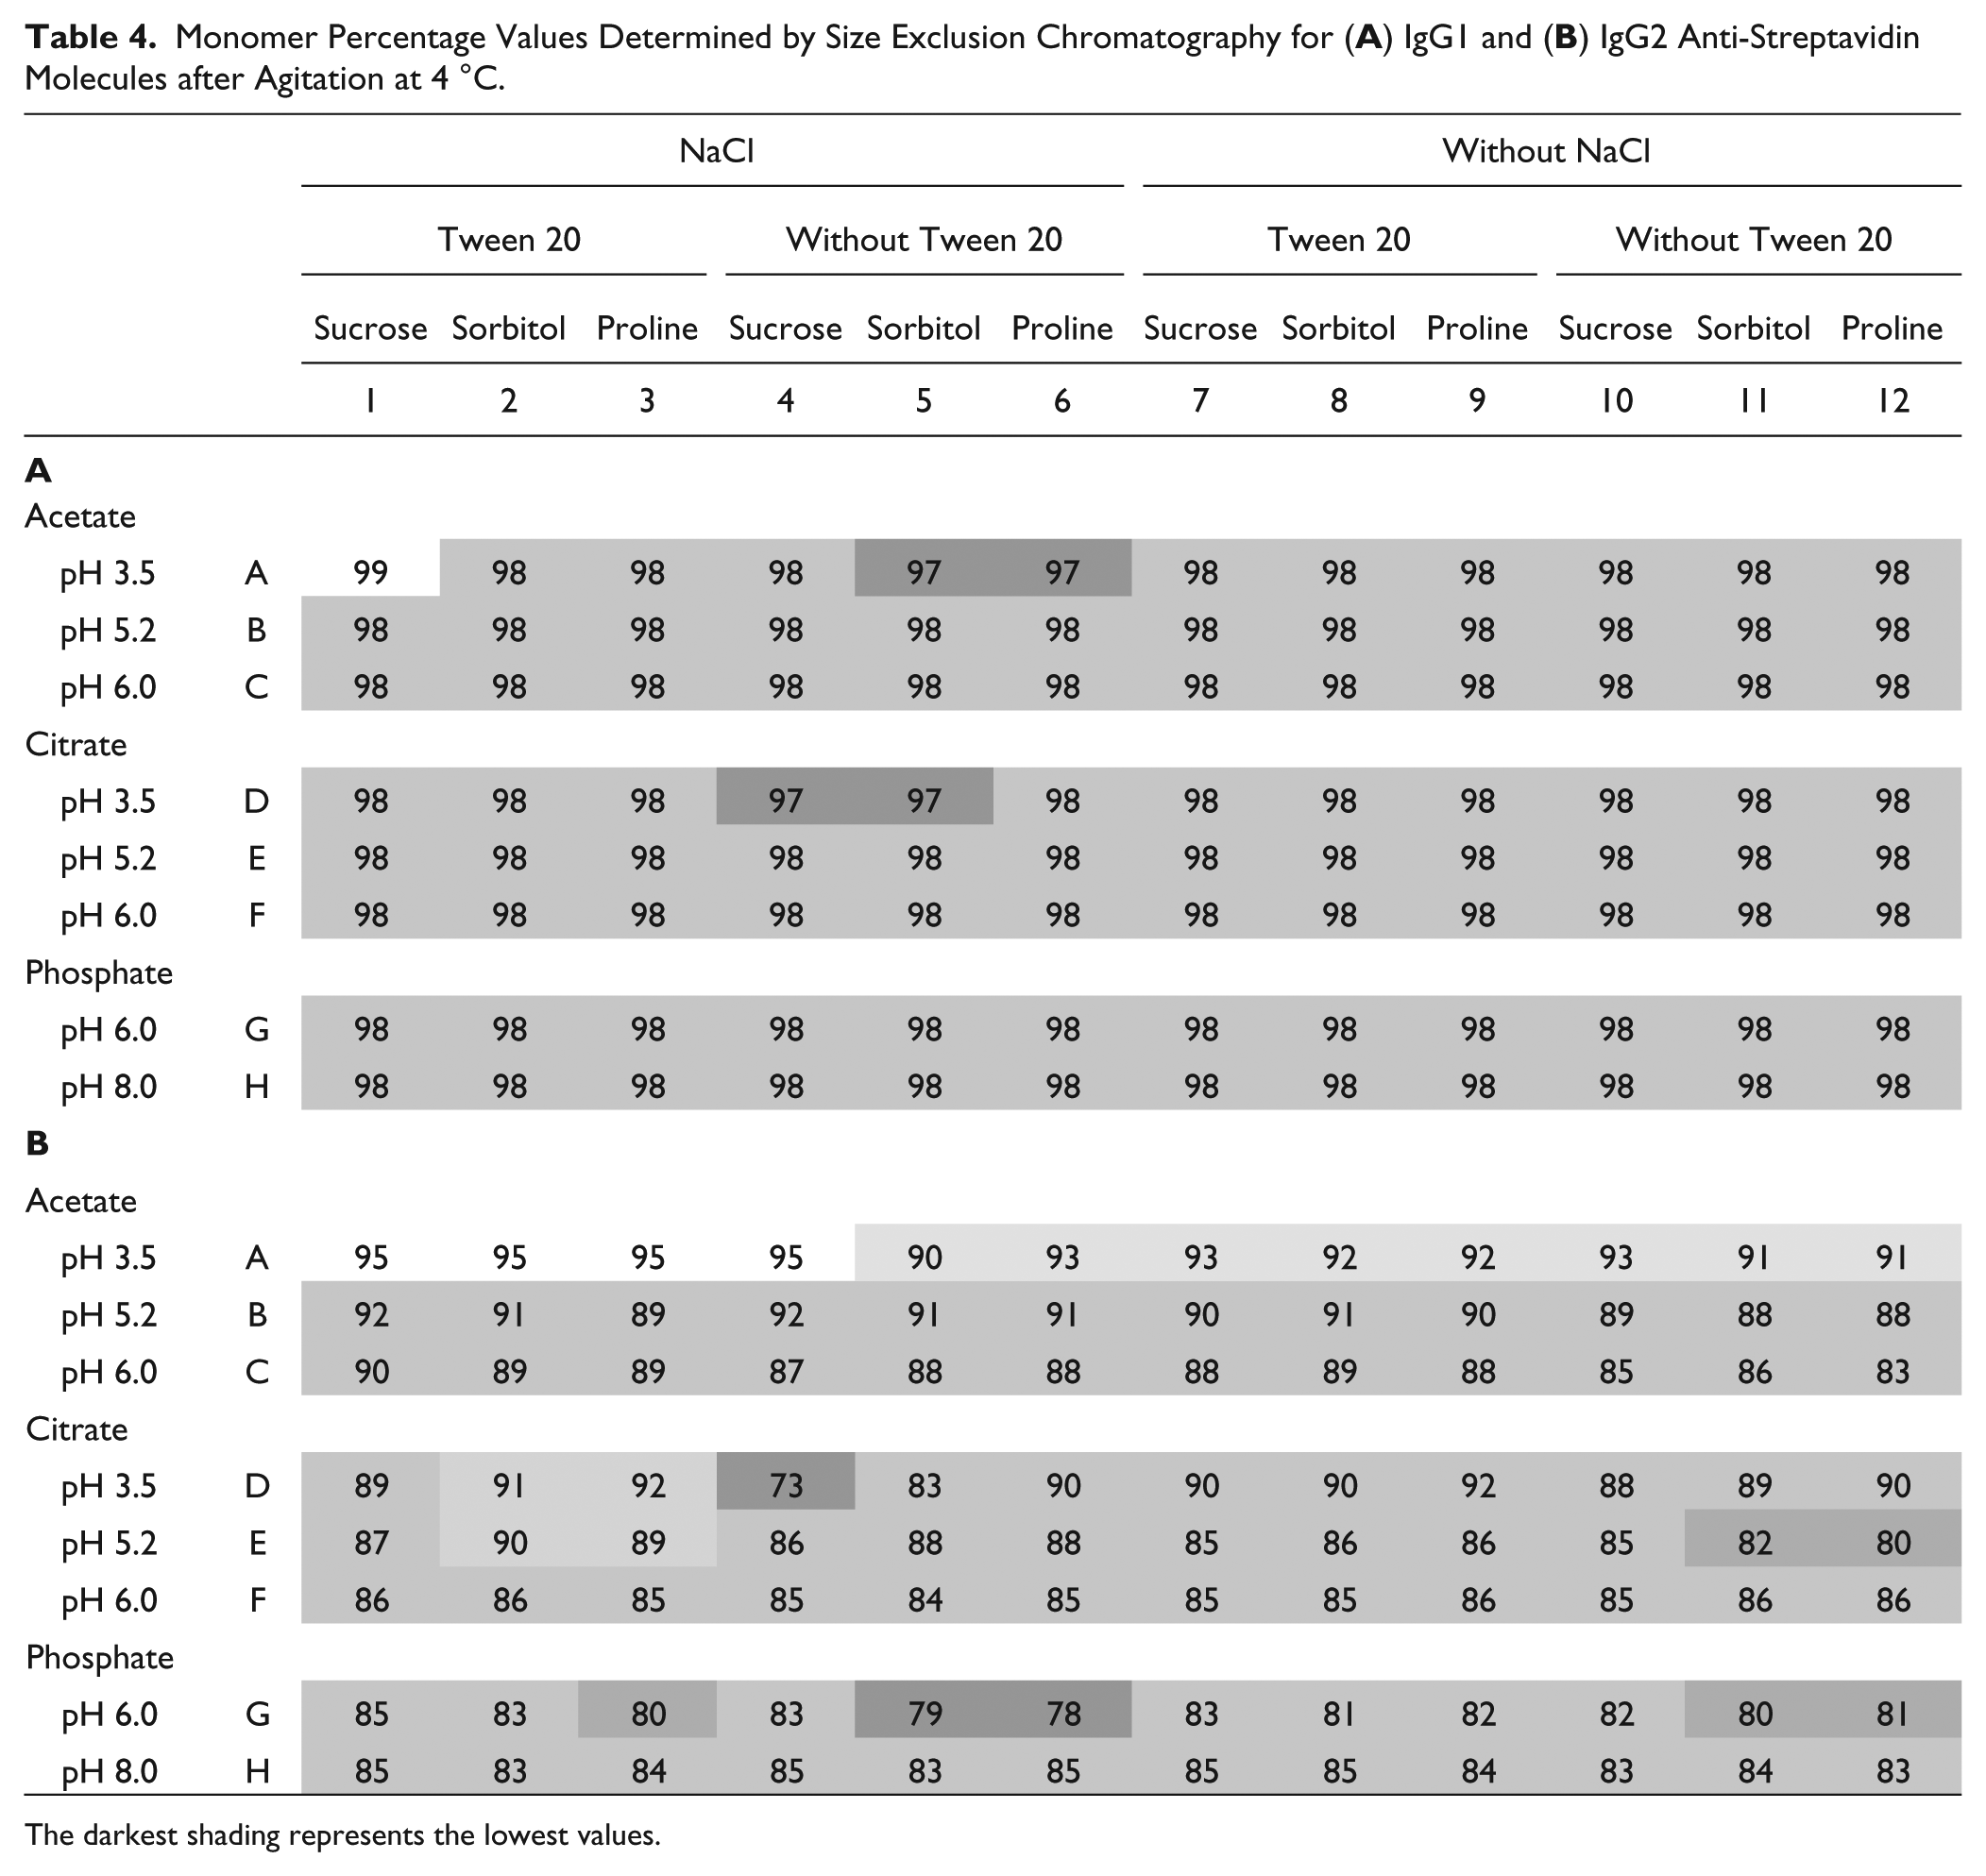
The darkest shading represents the lowest values.
Optimization of Formulations and Comparison of IgG Molecules
The choice of the best formulation conditions depends on many factors. In our study, we have obtained results from several analytical and stress techniques. We have determined significant factors affecting the stability of samples under temperature and mechanical stresses. If we would have used the classic way to pick the most stable formulations, we would have looked for the samples with maximum monomer percentage for each data set. Depending on what component of stability we would prefer to maximize, we choose the best formulations from the available data. But sometimes, the high values for monomer percentage correspond to different conditions. It is obvious that a more systematic analysis is necessary to find the optimal combination of factors for a stable formulation.
Correlation between Th data and SEC results after incubation at high temperature
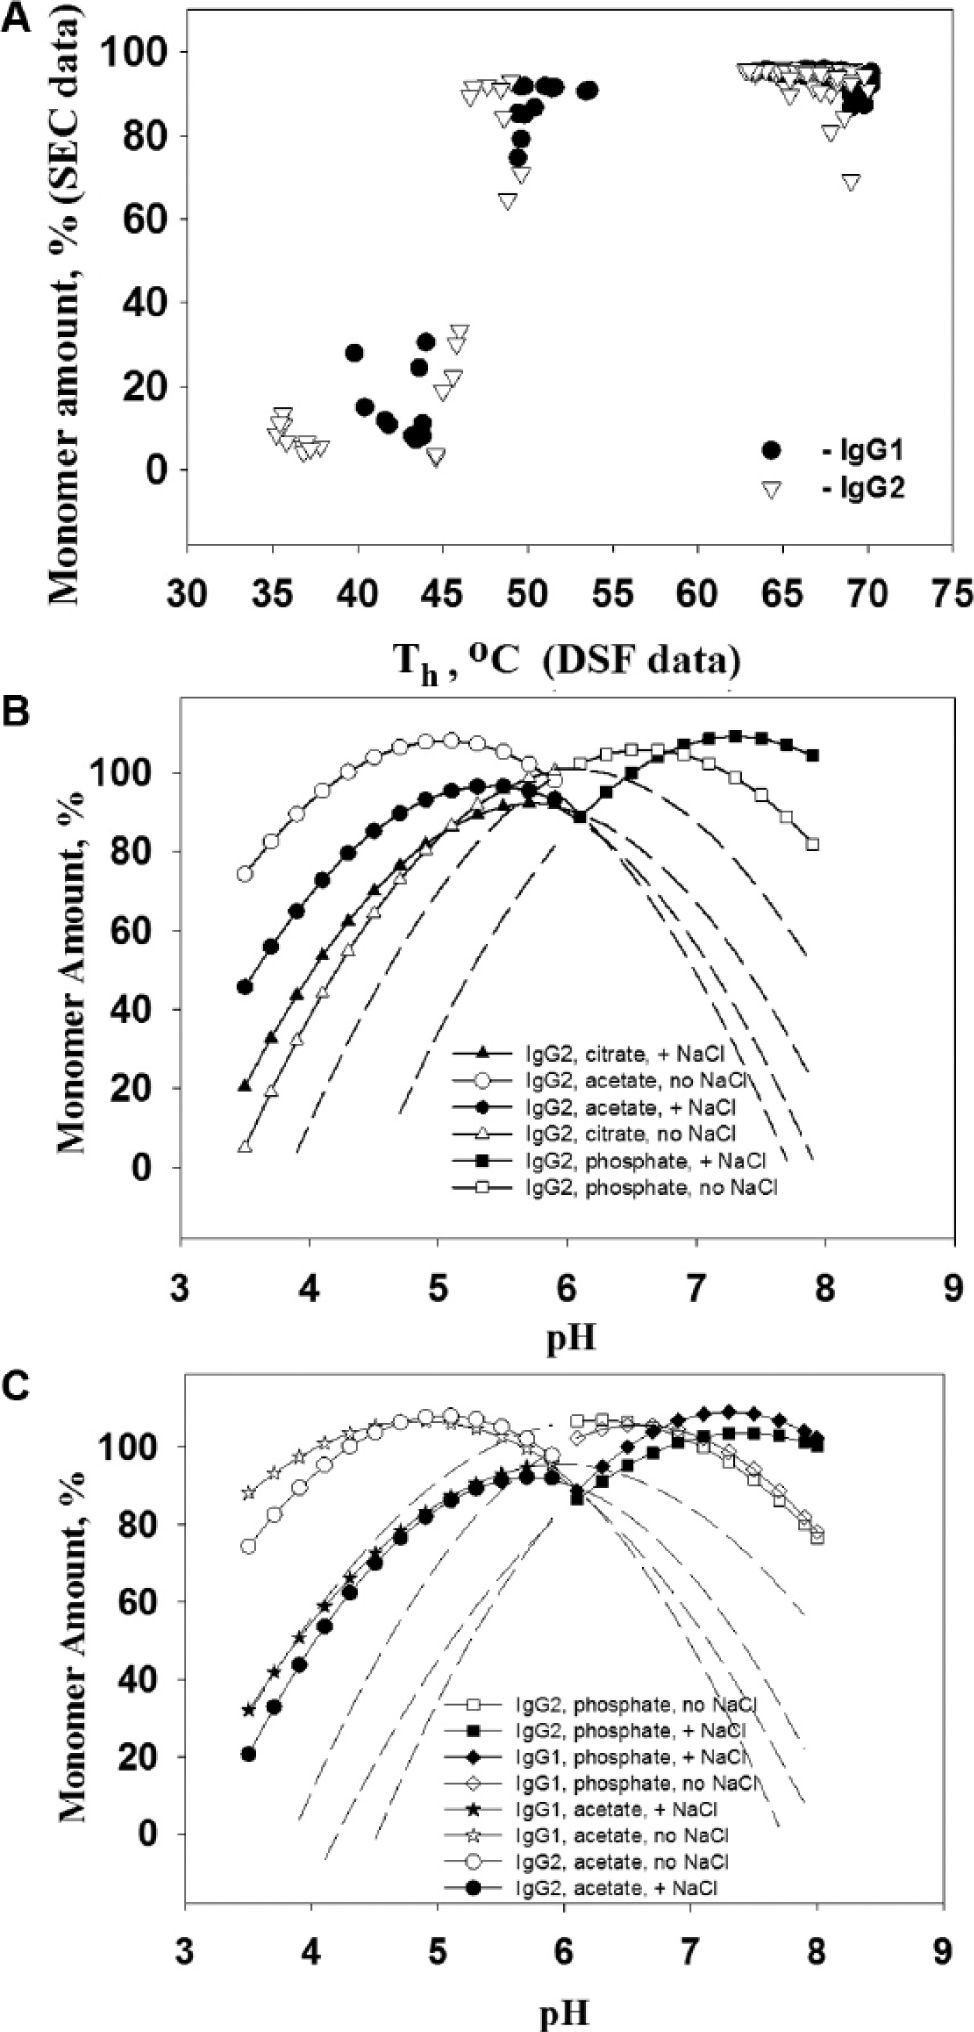
A good prediction model, with dependence on multiple formulation factors, was obtained for the Th values determined by DSF. An interesting question, then, is, “How well can Th predict degradation, presumably aggregation, after exposure to high temperature?” To answer this question, we examined the SEC data set that provided monomer percentage after the 40 °C incubation. In Figure 2A , the monomer amount (SEC data) was plotted as a function of Th (DSF data) for both IgG1 and IgG2 molecules in all formulations studied. It seems reasonable that if the incubation temperature is much lower than the Th value, the aggregation propensity depends on factors other than conformational stability.23,24 As shown in previous studies, 25 the unfolding transition of the CH2 domain overlaps with the unfolding of the Fab domain at pH ~5.0, which makes DSF measurements less sensitive. Since pH is the major factor affecting DSF data, formulations with higher Th are more stable after incubation at 40 °C. The closer the unfolding temperature is to the incubation temperature, the higher the aggregation level. After the Th value reaches some distance from the incubation temperature, aggregation drops significantly (see Fig. 2A ). But protein aggregation caused by elevated temperature could be dependent on not only conformational stability. 19 Therefore, to accurately predict aggregation propensity, one should consider all factors affecting protein-protein and protein-solution interactions, including chemical, colloidal, and conformational stabilities.22,26,27
(
Maximizing formulation stability with the help of prediction models
In these studies, two types of assays probing conformational stability as well as stability under mechanical stress were employed. Using the results of these studies, prediction models were developed from the SEC results under each stress condition. This provides an opportunity to determine the optimal formulation conditions under which the monomer content is maximized. The models obtained for the two IgG types under stress conditions had a different goodness of fit characterized by the linearity (root mean square error value: R2) of the actual versus predicted value plot. The R2 value for the 4 °C incubation was low for both IgG1 and IgG2. The highest R2 was obtained for the 40 °C incubation. R2 values for SEC models were higher for the IgG2 than for IgG1 molecules after both temperature and mechanical stress, reflecting the fact that the IgG2 was less stable and more dependent on formulation factors. To evaluate stability dependence on formulation factors at 40 °C, we applied the same procedure as we used for constructing a prediction model based on the DSF results. We used the monomer amount determined by SEC as a major output value of stability. Multivariate regression analysis was performed to obtain a prediction formula for monomer amount versus formulation factors dependence. In Figure 2B , C , this function is plotted with pH as the x-axis variable factor for the IgG2 molecule in acetate, citrate, and phosphate buffers in the presence of salt and without salt. The excipients were not significant factors in our model with the exception of proline for IgG1, and we selected proline as a factor for the plots shown in Figure 2B , C . Similar to the DSF-based model, the results beyond the experimental conditions are represented by dashed lines. According to the predicted function, the maximum monomer content was reached at pH 5.1 for acetate buffer without salt. The addition of salt shifted the maximum slightly to pH 5.4. For the citrate buffer, the maximum was at pH 6.0 without salt and at pH 5.7 with salt and, at low pH with salt, made the citrate formulations slightly more stable. Formulations in phosphate buffer showed maximum stability at pH 6.5 without salt and at pH 7.3 in the presence of salt. At higher pH, the presence of salt stabilized phosphate formulations. To compare IgG1 and IgG2 molecules, we prepared plots for both acetate and phosphate buffers with and without salt (see Fig. 2C ). IgG1 formulations were more stable than were IgG2 formulations at low pH in acetate with no salt and at higher pH in phosphate with salt. In other formulations, the differences were not significant for the studied experimental conditions, but the prediction model showed theoretically higher IgG1 stability for citrate formulations with salt, and for phosphate formulations without salt, the stability was higher for the IgG2.
As can be seen in Figure 2B , C , the prediction function monomer amount versus pH was dependent on the type of buffer and the presence of salt. Formulations at low pH were unstable because of low conformational stability. The presence of salt in combination with low pH values increased antibody instability even more. The maximum monomer amount shifted at different pH values in different buffers. Salt shifted the maximum to higher pH in acetate and phosphate buffers. For citrate buffer, the shift with salt went to slightly lower pH values. Generally, the proteins were more soluble when the solution pH was far from the proteins’ pI. 28 For the anti-streptavidin IgG1 and IgG2 isotypes, the theoretical pI values were 8.2 and 7.7, respectively.
Mechanical agitation stress did not have a significant impact on IgG1 monomer content, changing by no more than 3% as analyzed by SEC. In turn, the IgG2 molecule was more sensitive to agitation stress and showed greater degradation at higher pH in phosphate buffer.
Based on the systematic analysis illustrated here, using both experimental data and prediction models, we can select the most stable formulations for IgG1 and IgG2 molecules. According to our data, antibodies are significantly degraded at pH 3.5 at elevated temperatures. Our models predict some curvature in the dependence of both thermostability and monomer content on pH with the maxima for each located between the high and low pH values (see Fig. 1 and Fig. 2B , C ). Formulations with phosphate buffer resulted in strong negative effect for both IgG1 and IgG2 antibodies after a 40 °C incubation (see Tables 2 and 3 ). Although high pH values seem to be favorable for thermal stability and for monomer content after high temperature exposure, the proximity of pH to pI might compromise colloidal stability and increase native aggregation propensity. This is confirmed for the IgG2 molecule by the agitation study (see Table 4 ). Acetate buffer appears more preferable than citrate in stability models at all temperatures and after agitation stress. The presence of detergent increases stability after agitation but makes no difference under high temperature stress. Proline is desirable under very stressful conditions, such as high temperature in low pH formulations in the presence of salt; however, sucrose provides greater stability at higher pH values, which are more common for antibody formulations. Considering all factors, the recommendation for the best formulation for IgG1 and IgG2 is acetate buffer, pH 5.0–6.0, with detergent and sucrose and without salt.
In this study, high-throughput methods of stress and characterization analysis for screening a large number of formulations, consuming only a small amount of protein, were applied to determine formulation conditions under which a studied protein was most stable. The choice of a final formulation can be dependent on many parameters, and the analysis of high-throughput data provides an opportunity to select the desired stability output according to formulation factors and their values. In this work, we used only temperature and mechanical agitation as stress conditions; however, new stresses and analytical techniques can easily be integrated into the package of assays described here. Formulation screening can also be performed by sequential steps, screening a wide range of conditions followed by a higher resolution analysis with a focus on only one factor. The modular structure of this method and its flexibility allow a seamless adaptation and application to every stage of the drug development process, from candidate selection to commercial formulation development.
Footnotes
Acknowledgements
We thank Dr. R. Matthew Fesinmeyer for discussions regarding the agitation methods, Dr. Ramil Latypov for discussion regarding conformational stability, and Dr. Gerd Kleemann and Dr. Bruce Kerwin for discussions of high-throughput assays.
Declaration of Conflicting Interests
The authors declared no potential conflicts of interest with respect to the research, authorship, and/or publication of this article.
Funding
The authors received no financial support for the research, authorship, and/or publication of this article.
References
Supplementary Material
Please find the following supplemental material available below.
For Open Access articles published under a Creative Commons License, all supplemental material carries the same license as the article it is associated with.
For non-Open Access articles published, all supplemental material carries a non-exclusive license, and permission requests for re-use of supplemental material or any part of supplemental material shall be sent directly to the copyright owner as specified in the copyright notice associated with the article.