
Abstract
The goal of protein formulation development is to identify optimal conditions for long-term storage. Certain commercial conditions (e.g., high protein concentration or turbid adjuvanted samples) impart additional challenges to biophysical characterization. Formulation screening studies for such conditions are usually performed using a simplified format in which the target protein is studied at a low concentration in a clear solution. The failure of study conditions to model the actual formulation environment may cause a loss of ability to identify the optimal condition for target proteins in their final commercial formulations. In this study, we utilized a steady-state/lifetime fluorescence-based, high-throughput platform to develop a general workflow for direct formulation optimization under analytically challenging but commercially relevant conditions. A high-concentration monoclonal antibody (mAb) and an Alhydrogel-adjuvanted antigen were investigated. A large discrepancy in screening results was observed for both proteins under these two different conditions (simplified and commercially relevant). This study demonstrates the feasibility of using a steady-state/lifetime fluorescence plate reader for direct optimization of challenging formulation conditions and highlights the importance of performing formulation optimization under commercially relevant conditions.
Introduction
Proteins are complex molecules with unique three-dimensional structures. The integrity of such structures is critical to protein biological function. Proteins in solution, however, are only marginally stable with a relative low free energy of unfolding (~5–10 kcal/mol at 25 °C). 1 Therefore, optimization of formulation conditions for proteins must ensure their structural stability during manufacturing, shipping, and storage. Protein formulation optimization requires the identification of the optimal pH, ionic strength, and excipient conditions from a large set of potential conditions in a rapid and cost-effective manner. To quickly differentiate protein stability in various formulations, the structural stability of a protein is usually evaluated under a stressed condition (commonly elevated temperature). During a thermal melting experiment, protein structural stability can be reflected by melting temperatures (Tm), which are measured by monitoring a biophysical signal sensitive to protein structure. For example, vibrational spectroscopy and far-UV circular dichroism (CD) can monitor protein secondary structures, and fluorescence and near-UV CD are often used to probe protein tertiary structures. The overall thermal stability of proteins is frequently investigated using differential scanning calorimetry.
Specific therapeutic needs often call for unique formulation conditions for optimal clinical uses, which presents substantial analytical challenges during formulation development. For example, subunit vaccines are often formulated with adjuvants (e.g., aluminum salts and emulsion) for enhanced immunogenicity. Another example is monoclonal antibodies (mAbs), which frequently need to be formulated at high concentrations (50–200 mg/mL) to enable subcutaneous or intramuscular administration for better patient compliance. 2 The highly scattering adjuvanted samples or strongly absorbing high-concentration mAbs are not easily analyzed using absorption or conventional intrinsic fluorescence-based techniques. In addition, the formulation development of high-concentration mAbs is limited by the large consumption of protein. The optimization of such protein formulations is therefore often conducted indirectly in transparent solutions containing relatively low protein concentrations (e.g., 0.1–1 mg/mL) for the sake of ease of analysis and conservation of materials. 3 Formulation screening data obtained under such convenient conditions, however, may fail to predict the situation under a more commercially relevant condition. In fact, many studies have found destabilization effects by protein adsorption to Alhydrogel.4,5 Research has also shown that the thermal stability of proteins (e.g., mAbs) can be concentration dependent. 6 It is possible that protein thermal stability in a commercial formulation (e.g., at high concentrations or in the presence of adjuvants) may be affected to different extents by excipients compared with that in model conditions (i.e., low concentrations in clear solutions). Therefore, there is a need to develop a high-throughput platform permitting direct optimization for analytically challenging but pharmaceutically relevant formulations.
In the present study, we explored the utility of an intrinsic fluorescence-based system integrating a front-face geometry (suitable for the analysis of turbid and high-concentration samples) into a high-throughput microplate. This platform has the following features: (1) low sample consumption, (2) rapid fluorescence acquisition, (3) front-face geometry, (4) free of the use of external dyes, and (5) capability to record both time-resolved (TRF) and steady-state (SSF) fluorescence. We have developed a general workflow using this system for direct optimization of challenging protein formulations. A key step of this workflow is the selection of a suitable method to generate Tm values. The effect of Tm calculation methods on Tm values was investigated, and differences seen can be attributed to the linear nature of the response to unfolding. Choosing a parameter with a linear response is preferable to generate accurate Tm values. It is also shown that TRF may be used as an alternative technique to SSF for formulation screening purpose. We also found significant discrepancies in the excipient screening results performed under simplified conditions (i.e., proteins at 0.2 mg/mL in clear solutions) and pharmaceutically relevant conditions (e.g., adjuvanted or high protein concentrations). This result demonstrates the importance of direct formulation optimization of commercially relevant conditions. In addition, we also show the potential use of intrinsic fibril fluorescence to study the thermally induced formation of fibrils in high-concentration mAb samples.
Materials and Methods
Reagents
Lysozyme, RiVax, and a mAb were selected as model proteins. Lyophilized lysozyme powder from chicken egg white was purchased from Sigma-Aldrich (St. Louis, MO). RiVax (a mutated form of the A-chain of ricin used as a vaccine 3 ) was expressed and purified in-house using a protocol previously described. 7 The mAb was obtained from Janssen Research & Development, LLC (Horsham, PA).8,9 Sodium phosphate dibasic, sodium citrate, and sodium chloride were purchased from Fisher Scientific (Hampton, NH). Excipient stock solutions used in this study were obtained from the Solubility & Stability Screen Reagents (Hampton Research, Aliso Viejo, CA) unless otherwise stated. The Solubility & Stability Screen Reagents are a set of commonly used excipients formulated in water.
Sample Preparation
For the pH screening study, these three model proteins were prepared in 20 mM citrate phosphate isotonic (having an ionic strength of 150 mM adjusted by NaCl) buffers (pH 3.0, 4.0, 5.0, 6.0, 7.0, and 8.0) at a concentration of 0.2 mg/mL. RiVax or the mAb was then subjected to an excipient screening study in which each protein (at 0.4 mg/mL) was mixed with an equal volume of each of 40 excipient stock solutions with the final buffer containing 20 mM citrate phosphate isotonic buffer (pH 6.0).
Out of the 40 excipients studied, 9 excipients with three different effects (stabilizing, destabilizing, and neutral) were selected to further investigate their effects on the thermal stability of proteins in commercially relevant conditions. These conditions include the presence of Alhydrogel (Brenntag Biosector, Frederikssund, Denmark) in the final formulation of RiVax and high protein concentrations (50–200 mg/mL) commonly used in formulations of mAbs. For this study, RiVax (at 0.2 mg/mL) was prepared in 10 mM histidine isotonic buffer (pH 6.0) containing 2 mg/mL Alhydrogel in the absence or presence of excipients. Protein was adsorbed for 2 h at room temperature prior to further analysis. The binding efficiency of RiVax was evaluated by quantifying protein using the Bradford assay (Pierce Coomassie Plus Assay Kit, Thermo Fisher Scientific, Waltham, MA) after centrifuging down the Alhydrogel. mAb samples at various concentrations (80, 40, 16, 1.6, and 0.2 mg/mL) were prepared in 20 mM citrate phosphate isotonic buffer (pH 6.0) for the thermal stability study. mAb samples at 80 mg/mL in the same buffer containing excipient stock solutions were also prepared. All the protein samples were analyzed on 384-well plates (Hard-Shell 384-well PCR plates, Bio-Rad, Hercules, CA), and silicon oil (Thermo Fisher Scientific) was added onto sample to avoid evaporation during temperature studies. Sample plates were centrifuged to remove air bubbles if needed.
Instrumentation
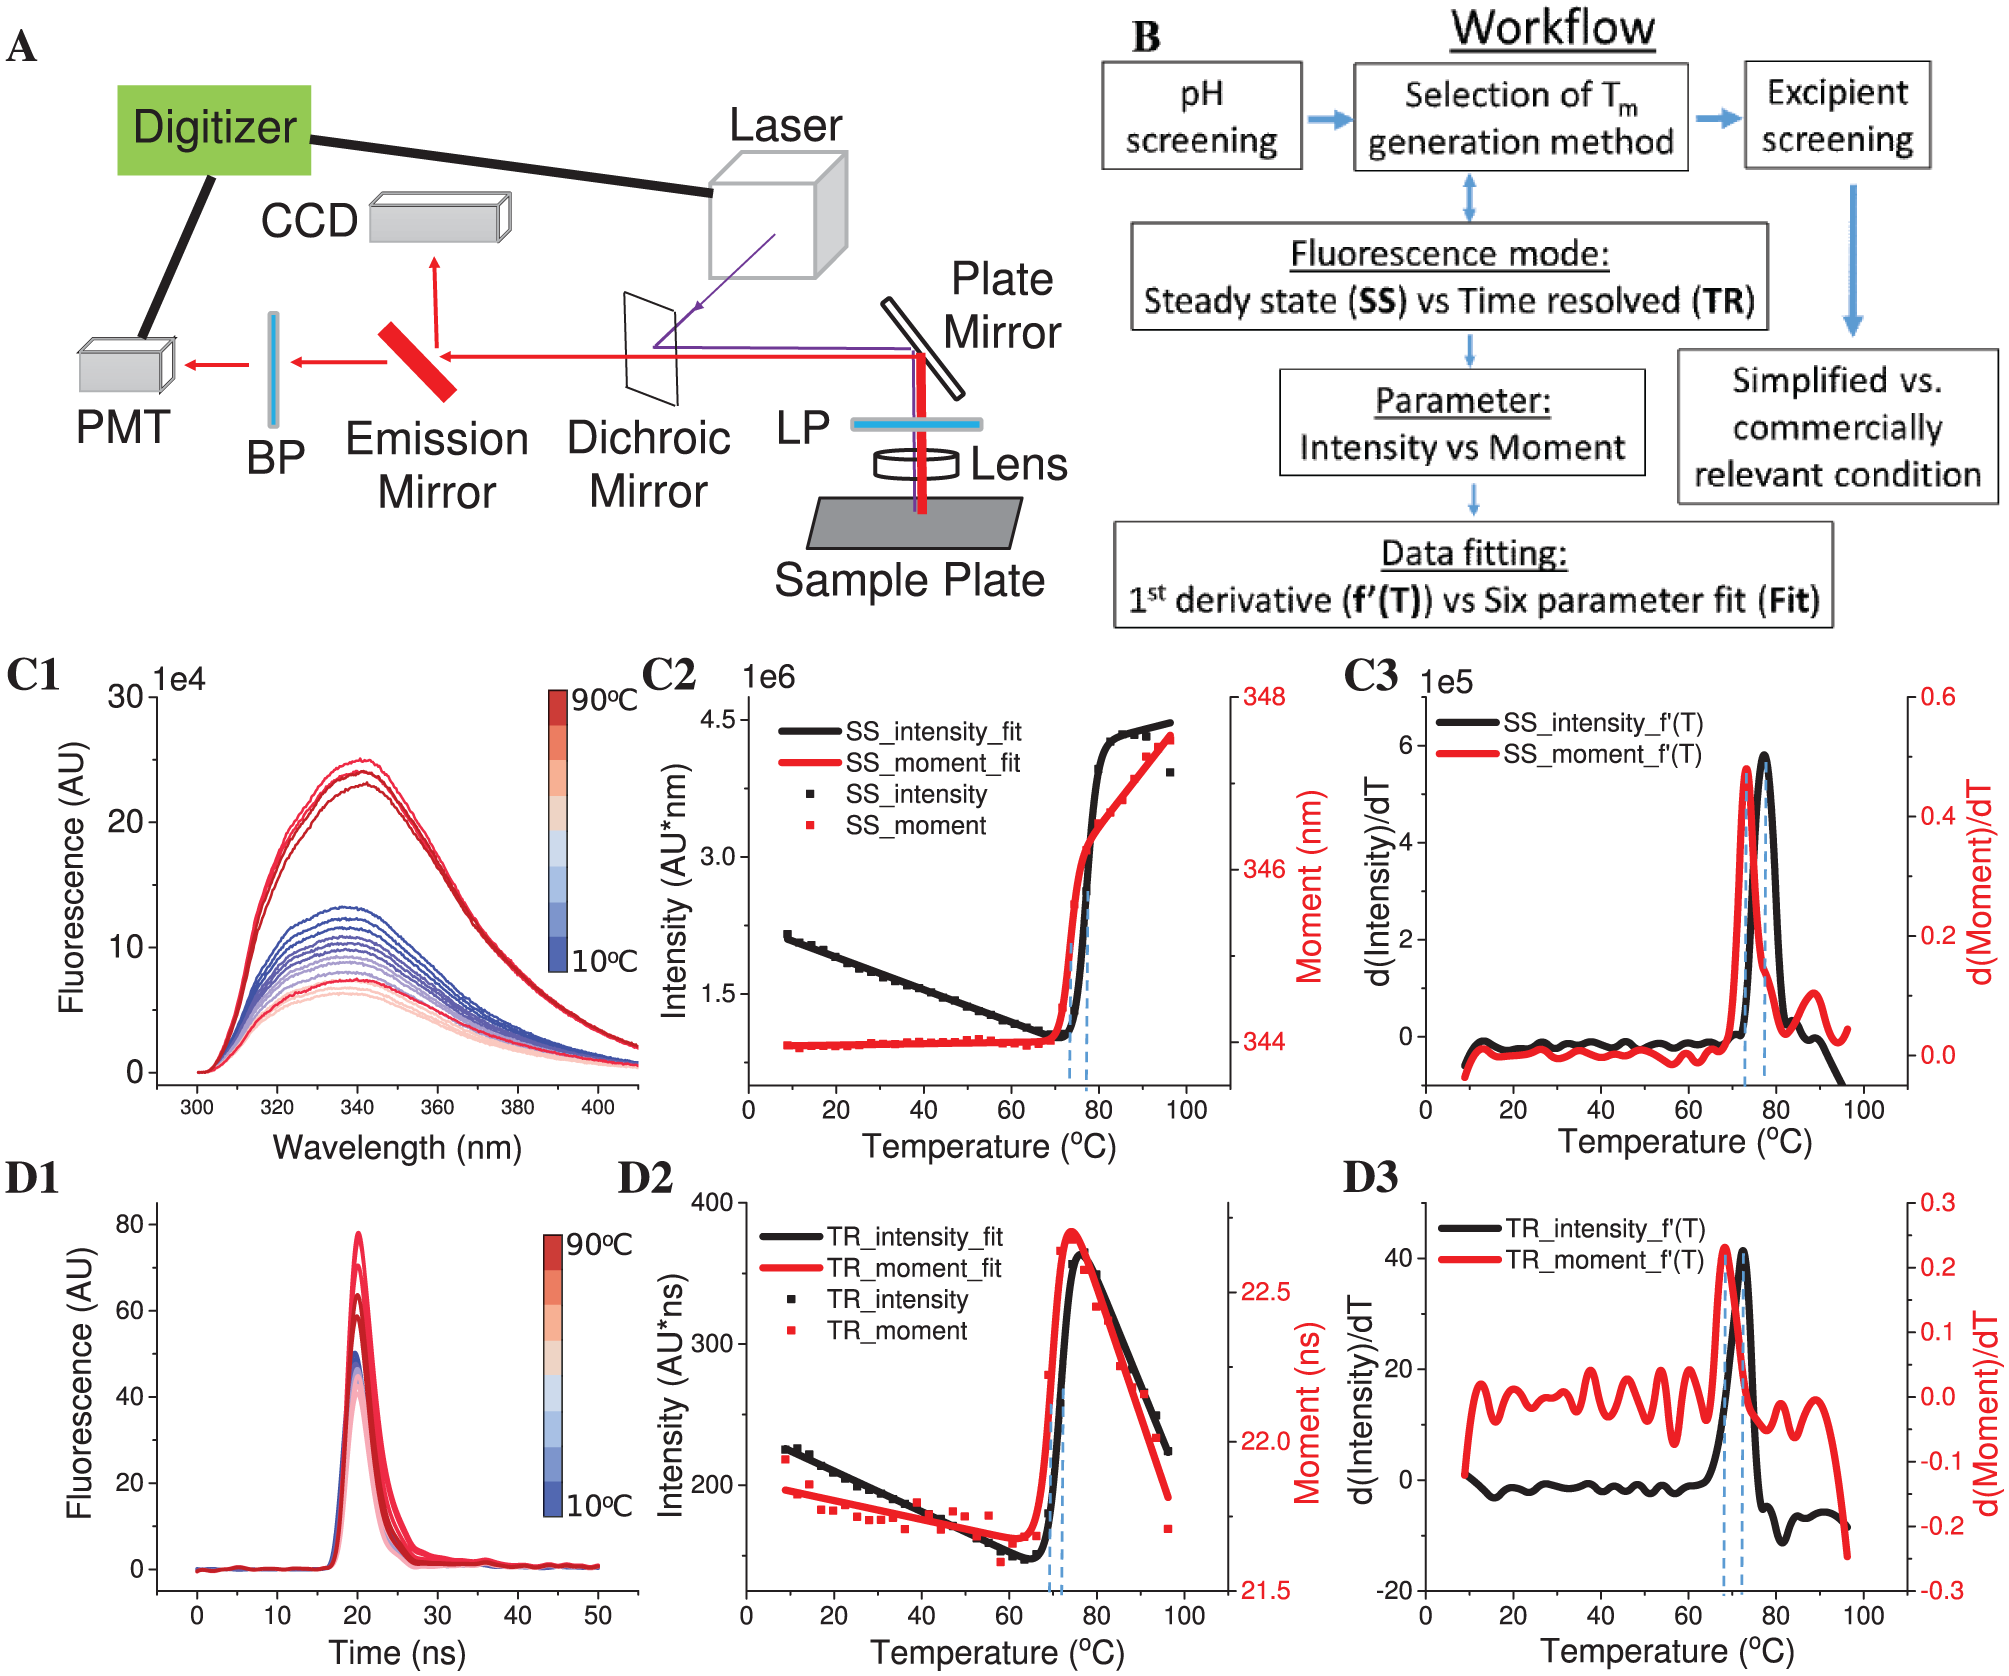
The diagram of the fluorescence plate reader used in this study, which is manufactured by Fluorescence Innovations, Inc. (Minneapolis, MN), is shown in Figure 1A . 10 It contains four key components: a laser source, a photomultiplier tube (PMT), a charge-coupled device (CCD) spectrometer, and a temperature-controlled sample plate holder. The laser source consists of two lasers: a tunable dye laser (280–305 nm) and a combination laser (350 and 532 nm). The PMT measures the TRF, while the CCD records the SSF from 300 to 450 nm. The temperature-controlled sample holder is able to accommodate a 384-well plate. This instrument has two modes: TRF and SSF. The mode can be switched by a mirror, referred to here as the “emission mirror.” The emission mirror is not used in the TRF mode in which the emitted light goes to the PMT after a band-pass filter. When the emission mirror is in place, the emission signal is directed to the CCD for the measurement of SSF.
(
Steady-State and Time-Resolved Fluorescence
In the SSF mode, the emission mirror is placed to acquire tryptophan (Trp) emission spectra. The excitation laser wavelength was set at 295 nm (> 95% Trp emission). A 310 nm long-pass dichroic mirror was used to block excitation light from entering the CCD. Measurements were performed using an integration time of 100 ms. A temperature ramp from 10 to 90 °C with an increment of 2.5 °C per step was used. Samples were equilibrated for 2 min at each temperature, at which point the signal stopped changing. The same temperature ramp was also used for the TRF mode.
The TRF mode records fluorescence decay waveforms as previously described. 11 The PMT voltage was set at 500 V. The dye laser (at 295 nm) was used for measuring Trp TRF. A 310 nm long-pass dichroic mirror and a 360/23 nm band-pass filter were used. The combo laser (at 350 nm), a 405 long-pass dichroic mirror, and a 485/20 nm band-pass filter were used to monitor the TRF derived from the formation of fibrils in high-concentration mAb samples upon thermal stress.
Data Analysis
As shown in Figure 1C1 , D1 , raw data (spectra from SSF and waveforms from TRF) were used to calculate melting temperatures (Tm). The raw data were first processed with in-house Python scripts to derive the following two parameters: intensity and moment at each temperature ( Fig. 1C2 , D2 ). Intensity represents the peak area under the curve for a spectrum or waveform. Moment is defined as the center of a spectrum or waveform where it vertically divides the peak area under the curve into two halves. The mathematical expressions for these two parameters are shown as follows:


where x is wavelength (SSF) or time (TRF) and I(x) is the fluorescence signal. Intensity was integrated from 300 to 400 nm (SSF) or from 10 to 60 ns (TRF). Moment can also be described as the mean spectral center of mass (MSM) in intrinsic Trp fluorescence studies, as previously described.12,13 Plotting intensity or moment versus temperature generates a melting curve to describe a thermal unfolding event. Each melting curve was further processed to obtain Tm values employing two commonly used methods: a six-parameter fitting (fit) method ( Fig. 1C2 , D2 ) or a first derivative (f′(T)) method ( Fig. 1C3,D3 ). The six-parameter fit was performed with MATLAB (MathWorks, Natick, MA) using the following expressions:
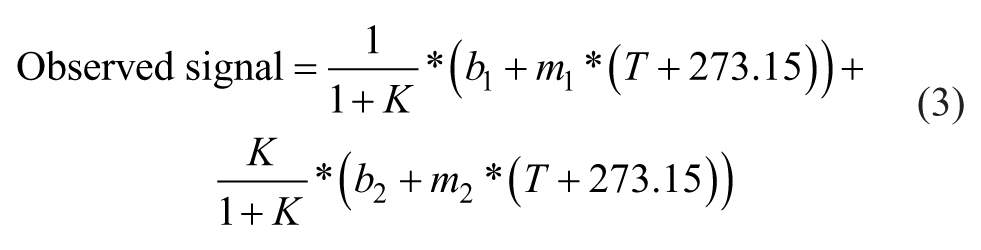
where K is the unfolding constant and b1 and m1 are the intercept and slope of the native state baseline, respectively. b2 and m2 are the intercept and slope of the unfolded state baseline, respectively. T is the temperature (in °C) and ΔH is the enthalpy of unfolding. R is the ideal gas constant (1.987e-3 kcal/mol/K), and Tm is the melting temperature (in °C). For the first derivative method, a cubic spline was used to interpolate all points of a melting curve. Intensity or moment was interpolated every 0.01 °C. The temperature at the absolute maximum value was taken as the Tm.
As illustrated in Figure 1B , both types of fluorescence (SSF vs TRF) were recorded in the pH screening study. Two parameters (moment and intensity) were calculated from each set of fluorescence data to generate four melting curves in total. Two fitting methods (first derivative vs six-parameter fitting) were then applied to each melting curve to calculate Tm. Therefore, eight Tm values can be obtained at most for each sample. The optimal Tm generation method for each protein was selected for the excipient screening study. The method used to generate the Tm was expressed using an abbreviated nomenclature consisting of the type of fluorescence, the parameter used to measure the melting curve, and the derivation method. For example, TR_moment_f′(T) indicates that TRF is performed, moment is plotted as a function of temperature to generate the melting curve, and a first derivative method is used to calculate the Tm value.
Results
pH Screening for Lysozyme, RiVax, and a mAb
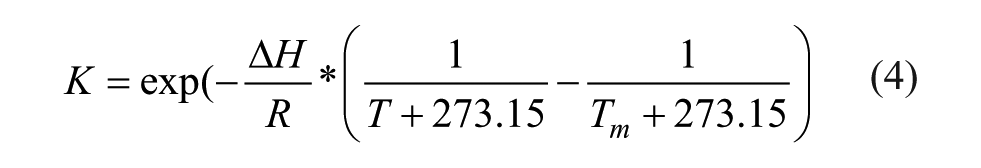
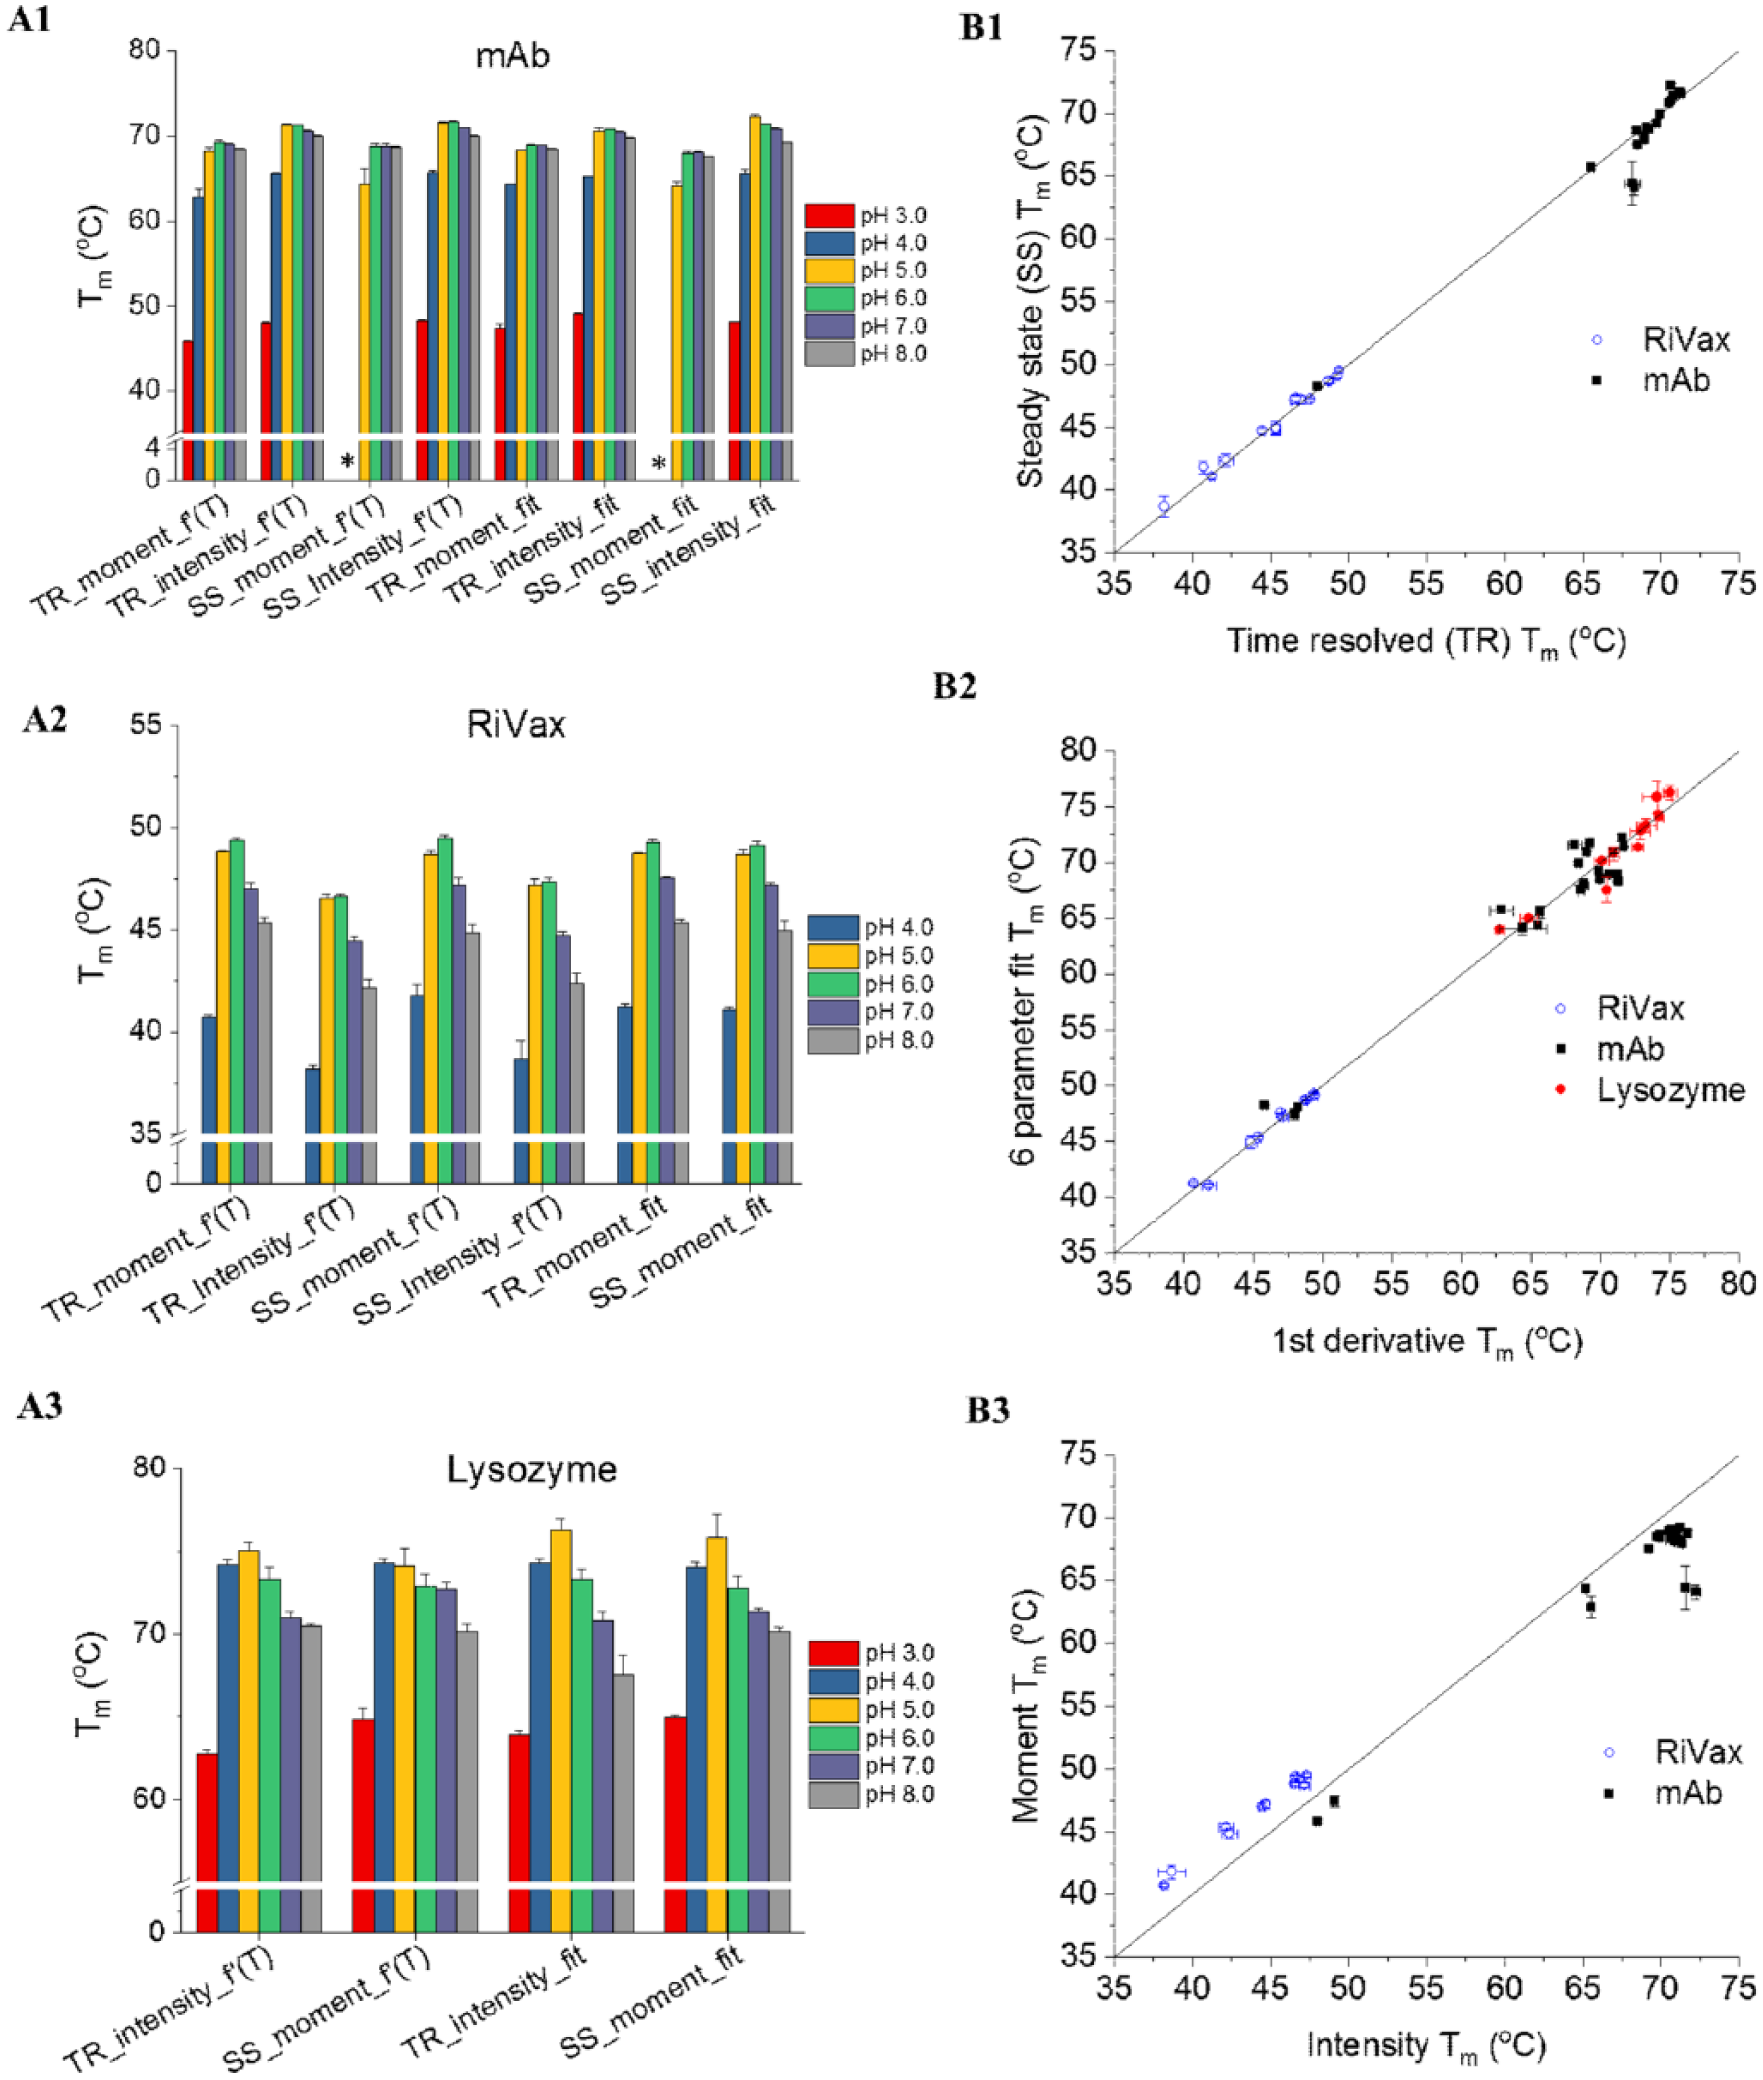
The pH-dependent thermal stability of three model proteins (lysozyme, RiVax, and a mAb) was investigated using both SSF and TRF. These proteins were analyzed at 0.2 mg/mL in 20 mM citrate phosphate isotonic buffers (pH 3.0–8.0). At pH 3.0, RiVax did not show a thermal transition, presumably due to the unfolding of RiVax at low pH. This is confirmed by a large red shift in the emission peak position of RiVax at pH 3.0 at 10 °C (data not shown). The other two proteins showed thermal transitions in all pH conditions examined. As shown in Figure 2A1 , eight Tm values were obtained for the mAb at pH 4.0–8.0. For the other samples (the mAb at pH 3.0 or the other proteins under all pH conditions), however, melting curves derived using some parameters did not show a detectable transition and the corresponding Tm values cannot be calculated. For example, intensity-based melting curves of lysozyme from SSF measurement did not show an observable thermal transition. The order of thermal stability of RiVax ( Fig. 2A2 ) and lysozyme ( Fig. 2A3 ) is as follows: pH 6.0 > 5.0 > 7.0 > 8.0 > 4.0 > 3.0 and pH 5.0 > 4.0 > 6.0 > 7.0 > 8.0 > 3.0, respectively. These results are in good agreement with previously published data.3,9,14 The mAb at pH 4.0 and 3.0 showed significantly lower thermal stability than the other pH conditions. The mAb at pH 5.0–8.0 showed similar Tm values. By averaging the Tm generated from all methods, the mAb at pH 6.0 showed the highest Tm value and was therefore selected as the base buffer condition for the following excipient study.
pH screening for the mAb, RiVax, and lysozyme using Trp fluorescence (
Tm Correlation Plots
For the same protein sample tested using this fluorescence plate reader, Tm values generated using different methods can be slightly different. For instance, the Tm of RiVax generated using TR_moment_f′(T) is higher than that obtained using TR_intensity_f′(T) (
Fig. 2A2
). We therefore studied the dependency of Tm values on each of three factors: the type of fluorescence measurement (SSF vs TRF), the parameter derived (intensity vs moment), and the data fitting method (first derivative vs six-parameter fitting). Three Tm correlation plots for each factor were then constructed (
Fig.2B1–3
) by varying one factor at a time while keeping the other two factors the same. Lysozyme data are only included in the Tm correlation plot for the data fitting method (
Simulation to Explain the Discrepancy between Tm Values by Moment versus by Intensity
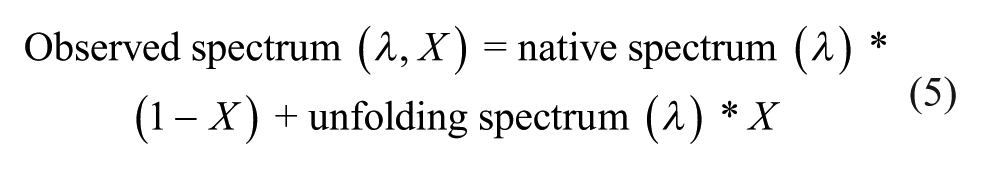
To explain the discrepancy in Tm values generated using the intensity and moment methods, we simulated thermally induced changes of these two parameters as a function of the degree of unfolding (i.e., the percentage loss of native state) during an SSF thermal melt study. Thermal unfolding of proteins usually results in a red shift in Trp emission spectra due to increased exposure of the indole side chains to the polar aqueous solvent. Depending on the relative intensity of the emission spectrum of the unfolded state, three scenarios (I, II, and III) are proposed here ( Fig. 3A ). To simplify the simulation, the intrinsic thermal quenching effect on the fluorescence of the native and unfolded states is not considered and a two-state unfolding process is assumed. At any extent of unfolding, the observed emission spectrum is assumed to be a linear combination of both native and unfolded state signals:
where X is the degree of unfolding and λ is wavelength. The moment and intensity are calculated from the observed emission spectrum and are then plotted as a function of degree of unfolding ( Fig. 3B–D ). The corresponding temperature for each degree of unfolding is calculated using the Van’t Hoff equation (eq 4) to plot melting curves ( Fig. 3B–D inset). For case I, the unfolded state shows increased intensity compared with the native state. As illustrated in Figure 3B , intensity is found to be linearly proportional to the degree of unfolding. The 50% intensity alteration point (indicated by red dots) corresponds to a degree of unfolding of 50% and a “true” Tm of 72 °C. Moment, however, shows a concave-down relationship with the degree of unfolding. At the 50% moment alteration point, the degree of unfolding is only 21%, resulting in an “erroneous” Tm with a lower value (~70 °C). The thermally unfolded state of the mAb falls under case I and therefore shows a moment Tm lower than the intensity Tm ( Fig. 2B3 ). In scenario III, an opposite trend is observed in which the unfolded state has a lower intensity than the native state. Intensity and moment show a linear and concave-up dependency with the degree of unfolding, respectively, causing the moment Tm to be higher than the intensity Tm. This scenario applies to RiVax. Scenario II is an extreme case where the unfolded state has the same intensity as the native state. The intensity remains constant through thermal unfolding, making it an uninformative parameter with which to monitor thermal unfolding. The moment under such circumstance has a linear relationship with the degree of unfolding and therefore can be used to obtain the true Tm. These guidelines will also apply to explain the differences of Tm values observed in the TRF mode. In summary, the parameter with a linear dependence on the degree of unfolding should be used to generate the accurate Tm values. Intensity is one such type of parameter and should be preferred over moment to derive a Tm. Therefore, intensity is selected for the mAb for the following excipient screening studies. In the extreme case (II), moment, but not intensity, can be used to derive the true Tm. RiVax showed only a very weak transition when monitored by intensity, causing difficulty in deriving the Tm using intensity ( Suppl. Fig. S1 ). This, in fact, suggests that the fluorescence of unfolded RiVax is only slightly different than that of its native state, indicating that moment is nearly linear with the degree of unfolding. In addition, moment-derived melting curves should result in Tm values with better reproducibility for RiVax than the intensity-derived ones because moment melting curves show a more pronounced transition with a better sensitivity and are less effected by spectral noise. Therefore, it seems reasonable to use the moment instead of intensity for RiVax during the excipient screening study.
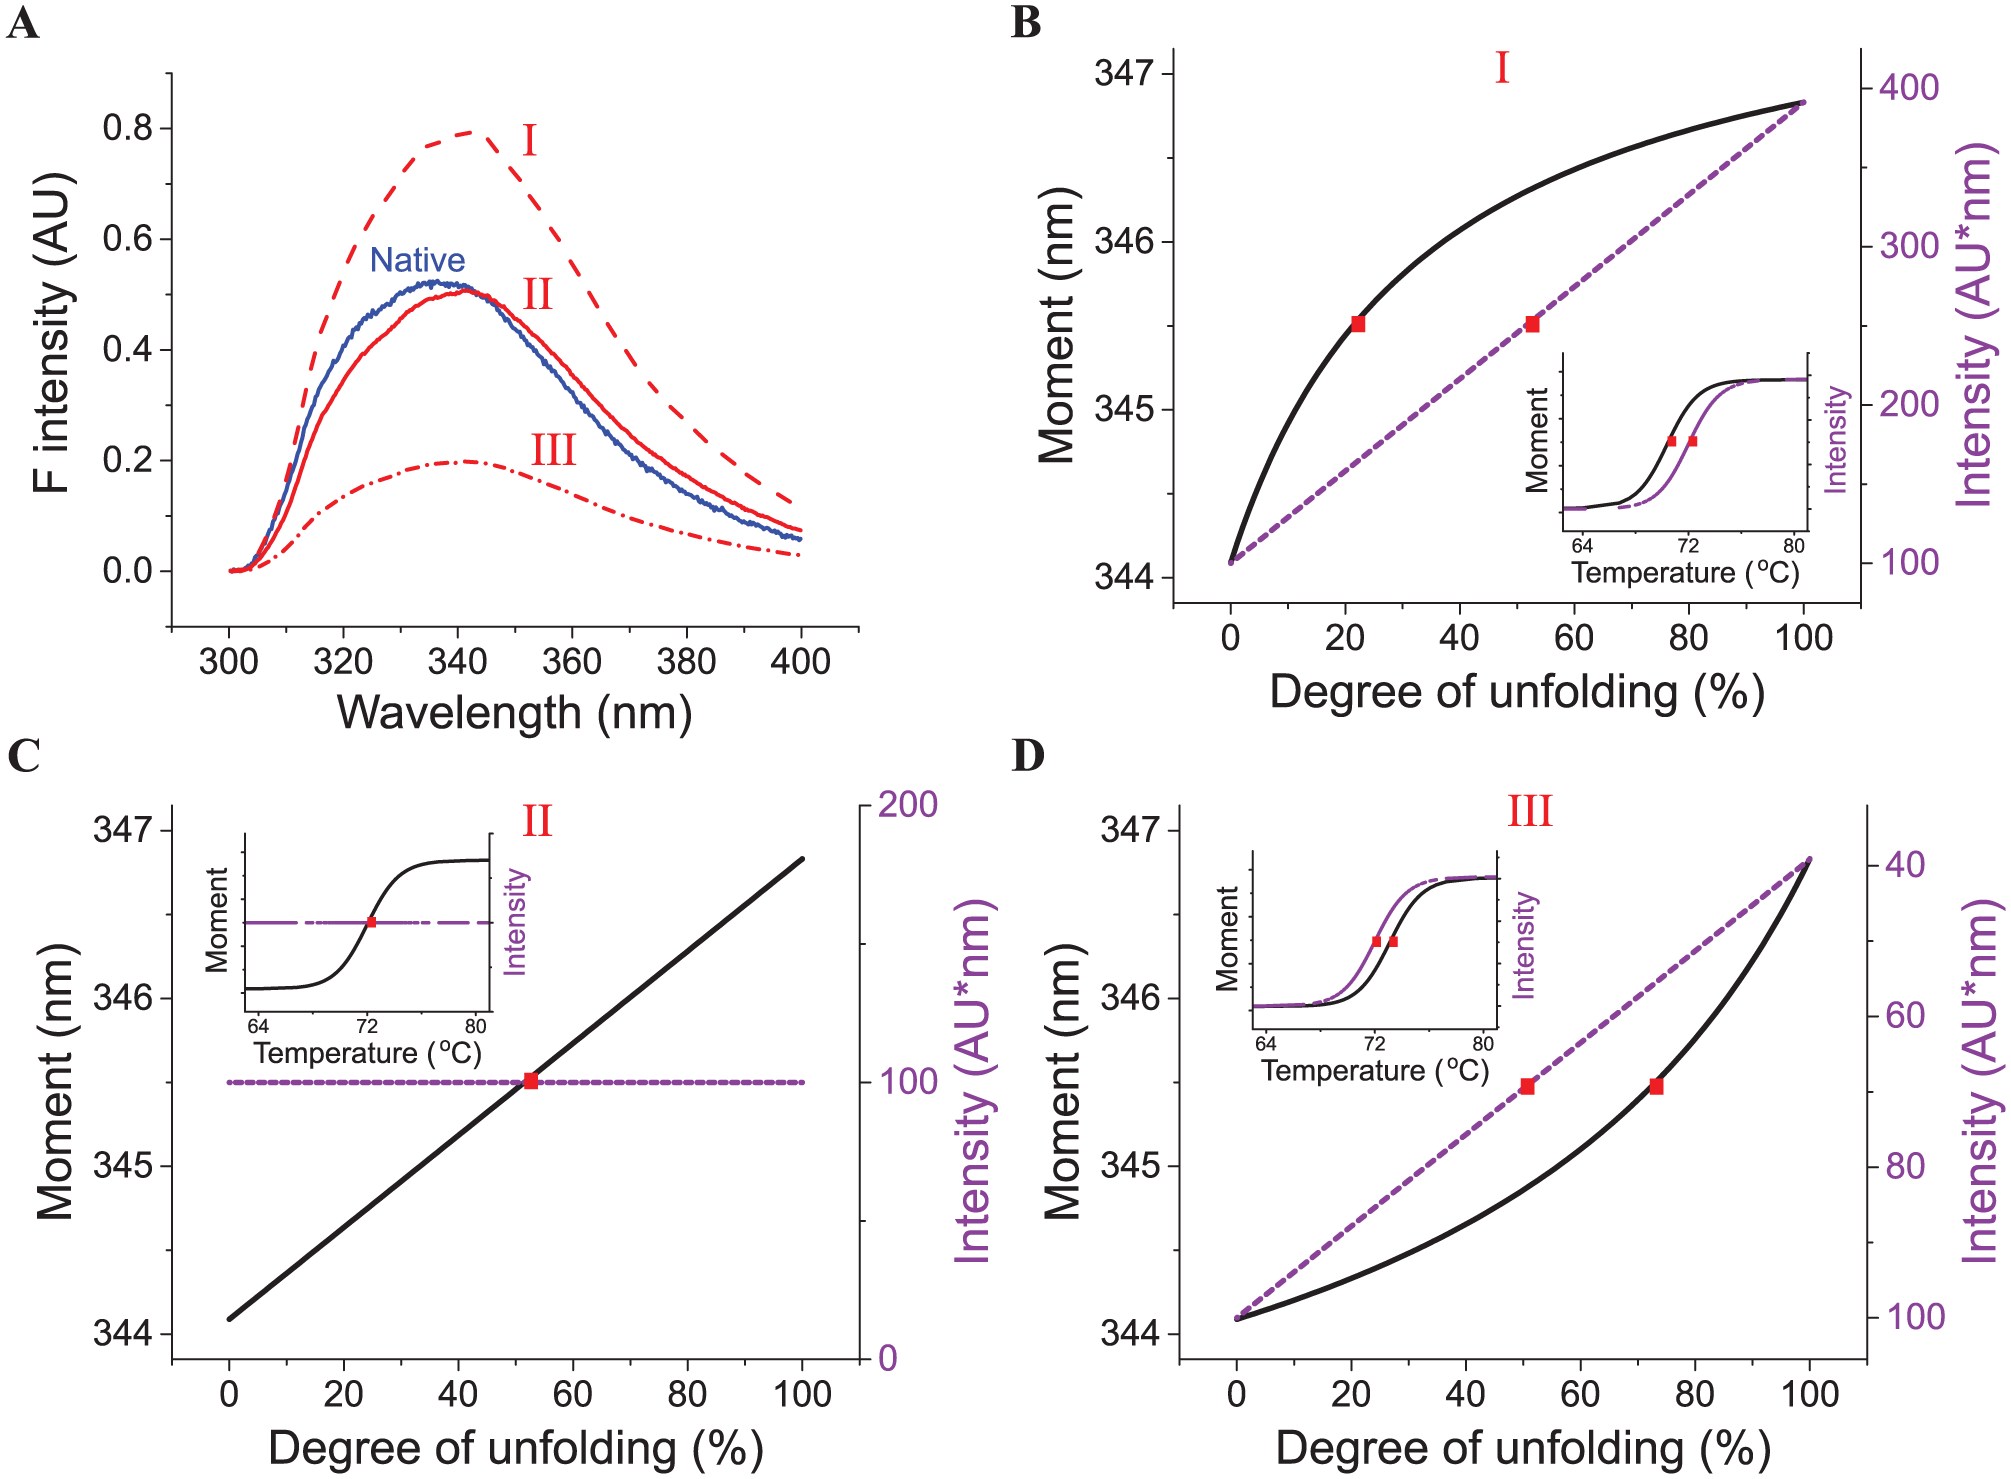
Simulation of thermal unfolding monitored by moment and intensity of SSF. (
Excipient Screening for RiVax and the mAb at 0.2 mg/mL in Solution
The mAb and RiVax were further subjected to an excipient screening study. Lysozyme was not examined due to its high intrinsic stability. An isotonic buffer of 20 mM citrate phosphate at pH 6.0 was chosen for this study because both proteins showed the highest thermal stability in this buffer based on the pH screening study described above. The stabilization or destabilization effects of excipients are indicated by the change in Tm (ΔTm) of the protein in their presence. A positive ΔTm generally indicates an increase in protein thermal stability. Based on the study performed above, we selected SS_intensity_ f′(T) and SS_moment_ f′(T) to generate Tm values for the mAb and RiVax, respectively. As shown in Figure 4 , most osmolytes tested (1 M sucrose, 1 M sorbitol, and 0.375 M trehalose) were found to be stabilizers for both proteins, probably due to preferential exclusion effects. 15 The addition of glycerol (25%, v/v) resulted in an increase in RiVax Tm but had no significant effect on the mAb. An approximately 4 °C increase in Tm was observed for the mAb in the presence of 0.5 M sodium sulfate, which had negligible effects on RiVax. Most amino acid excipients did not show dramatic effects on both proteins except arginine chloride, which decreased the Tm values by 3 and 10 °C for the mAb and RiVax, respectively. The destabilizing excipients for both proteins include chaotropes (e.g., 250 mM urea, 250 mM guanidine HCl, and 250 mM KSCN), cyclodextrins, and polymers (e.g., polyethylene glycol [PEG] and polyvinyl pyrrolidone [PVP]). The mechanisms responsible for the destabilizing effects of these excipients have been discussed previously.15,16
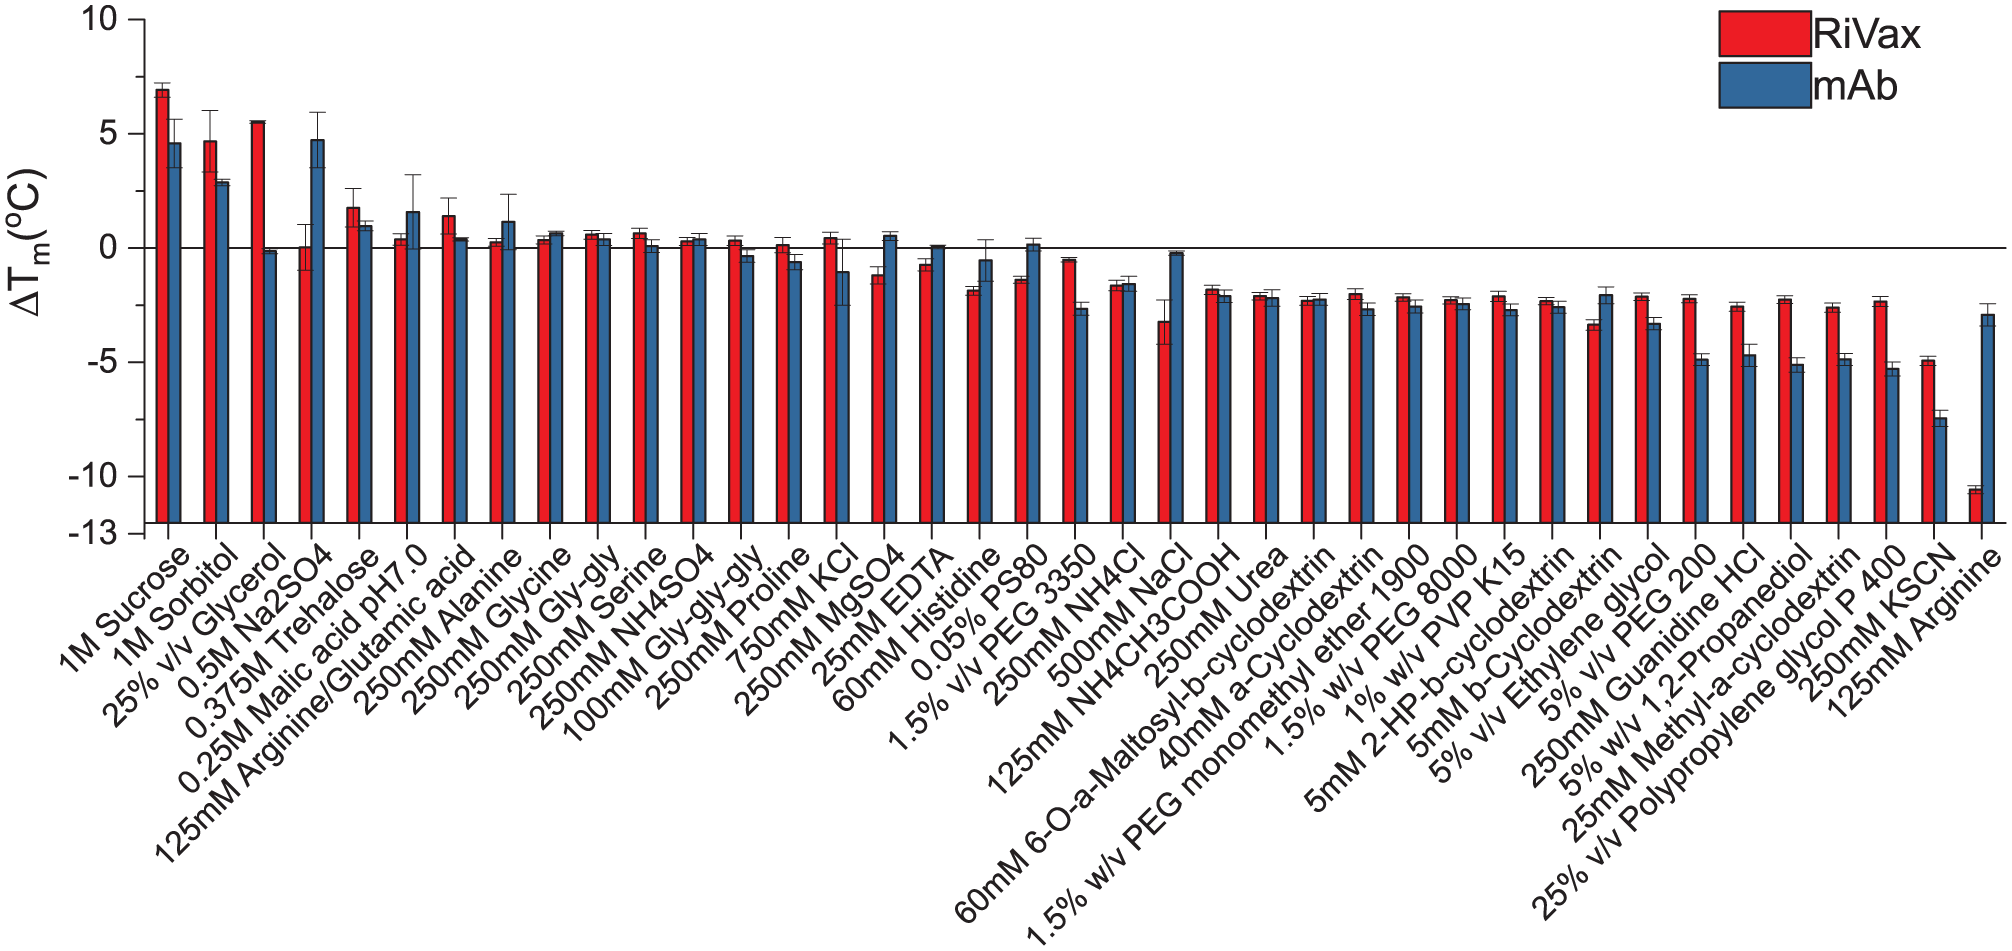
Excipient screening study for RiVax and the mAb (at 0.2 mg/mL) in 20 mM citrate phosphate isotonic buffer (pH 6.0) using Trp fluorescence. The stabilization or destabilization effects of excipients are indicated by the change in the Tm (ΔTm) of the protein in the presence of excipients. A reference line at no change in the Tm (ΔTm = 0 °C) is shown. Error bars indicate standard deviations (N = 3).
Excipient Screening of RiVax with and without Alhydrogel
RiVax, as a subunit vaccine candidate, is formulated with adjuvants (e.g., Alhydrogel) to enhance its immunogenicity. In this study, a base buffer of 10 mM histidine isotonic buffer (pH 6.0) was used to avoid the use of phosphate buffers, which could significantly reduce the binding of RiVax to Alhydrogel (AlOH). The thermal stability of RiVax (at 0.2 mg/mL) in the absence or presence of AlOH (2 mg/mL) was studied, and the effects of excipients on RiVax under these two conditions were studied. Based on the initial excipient study (
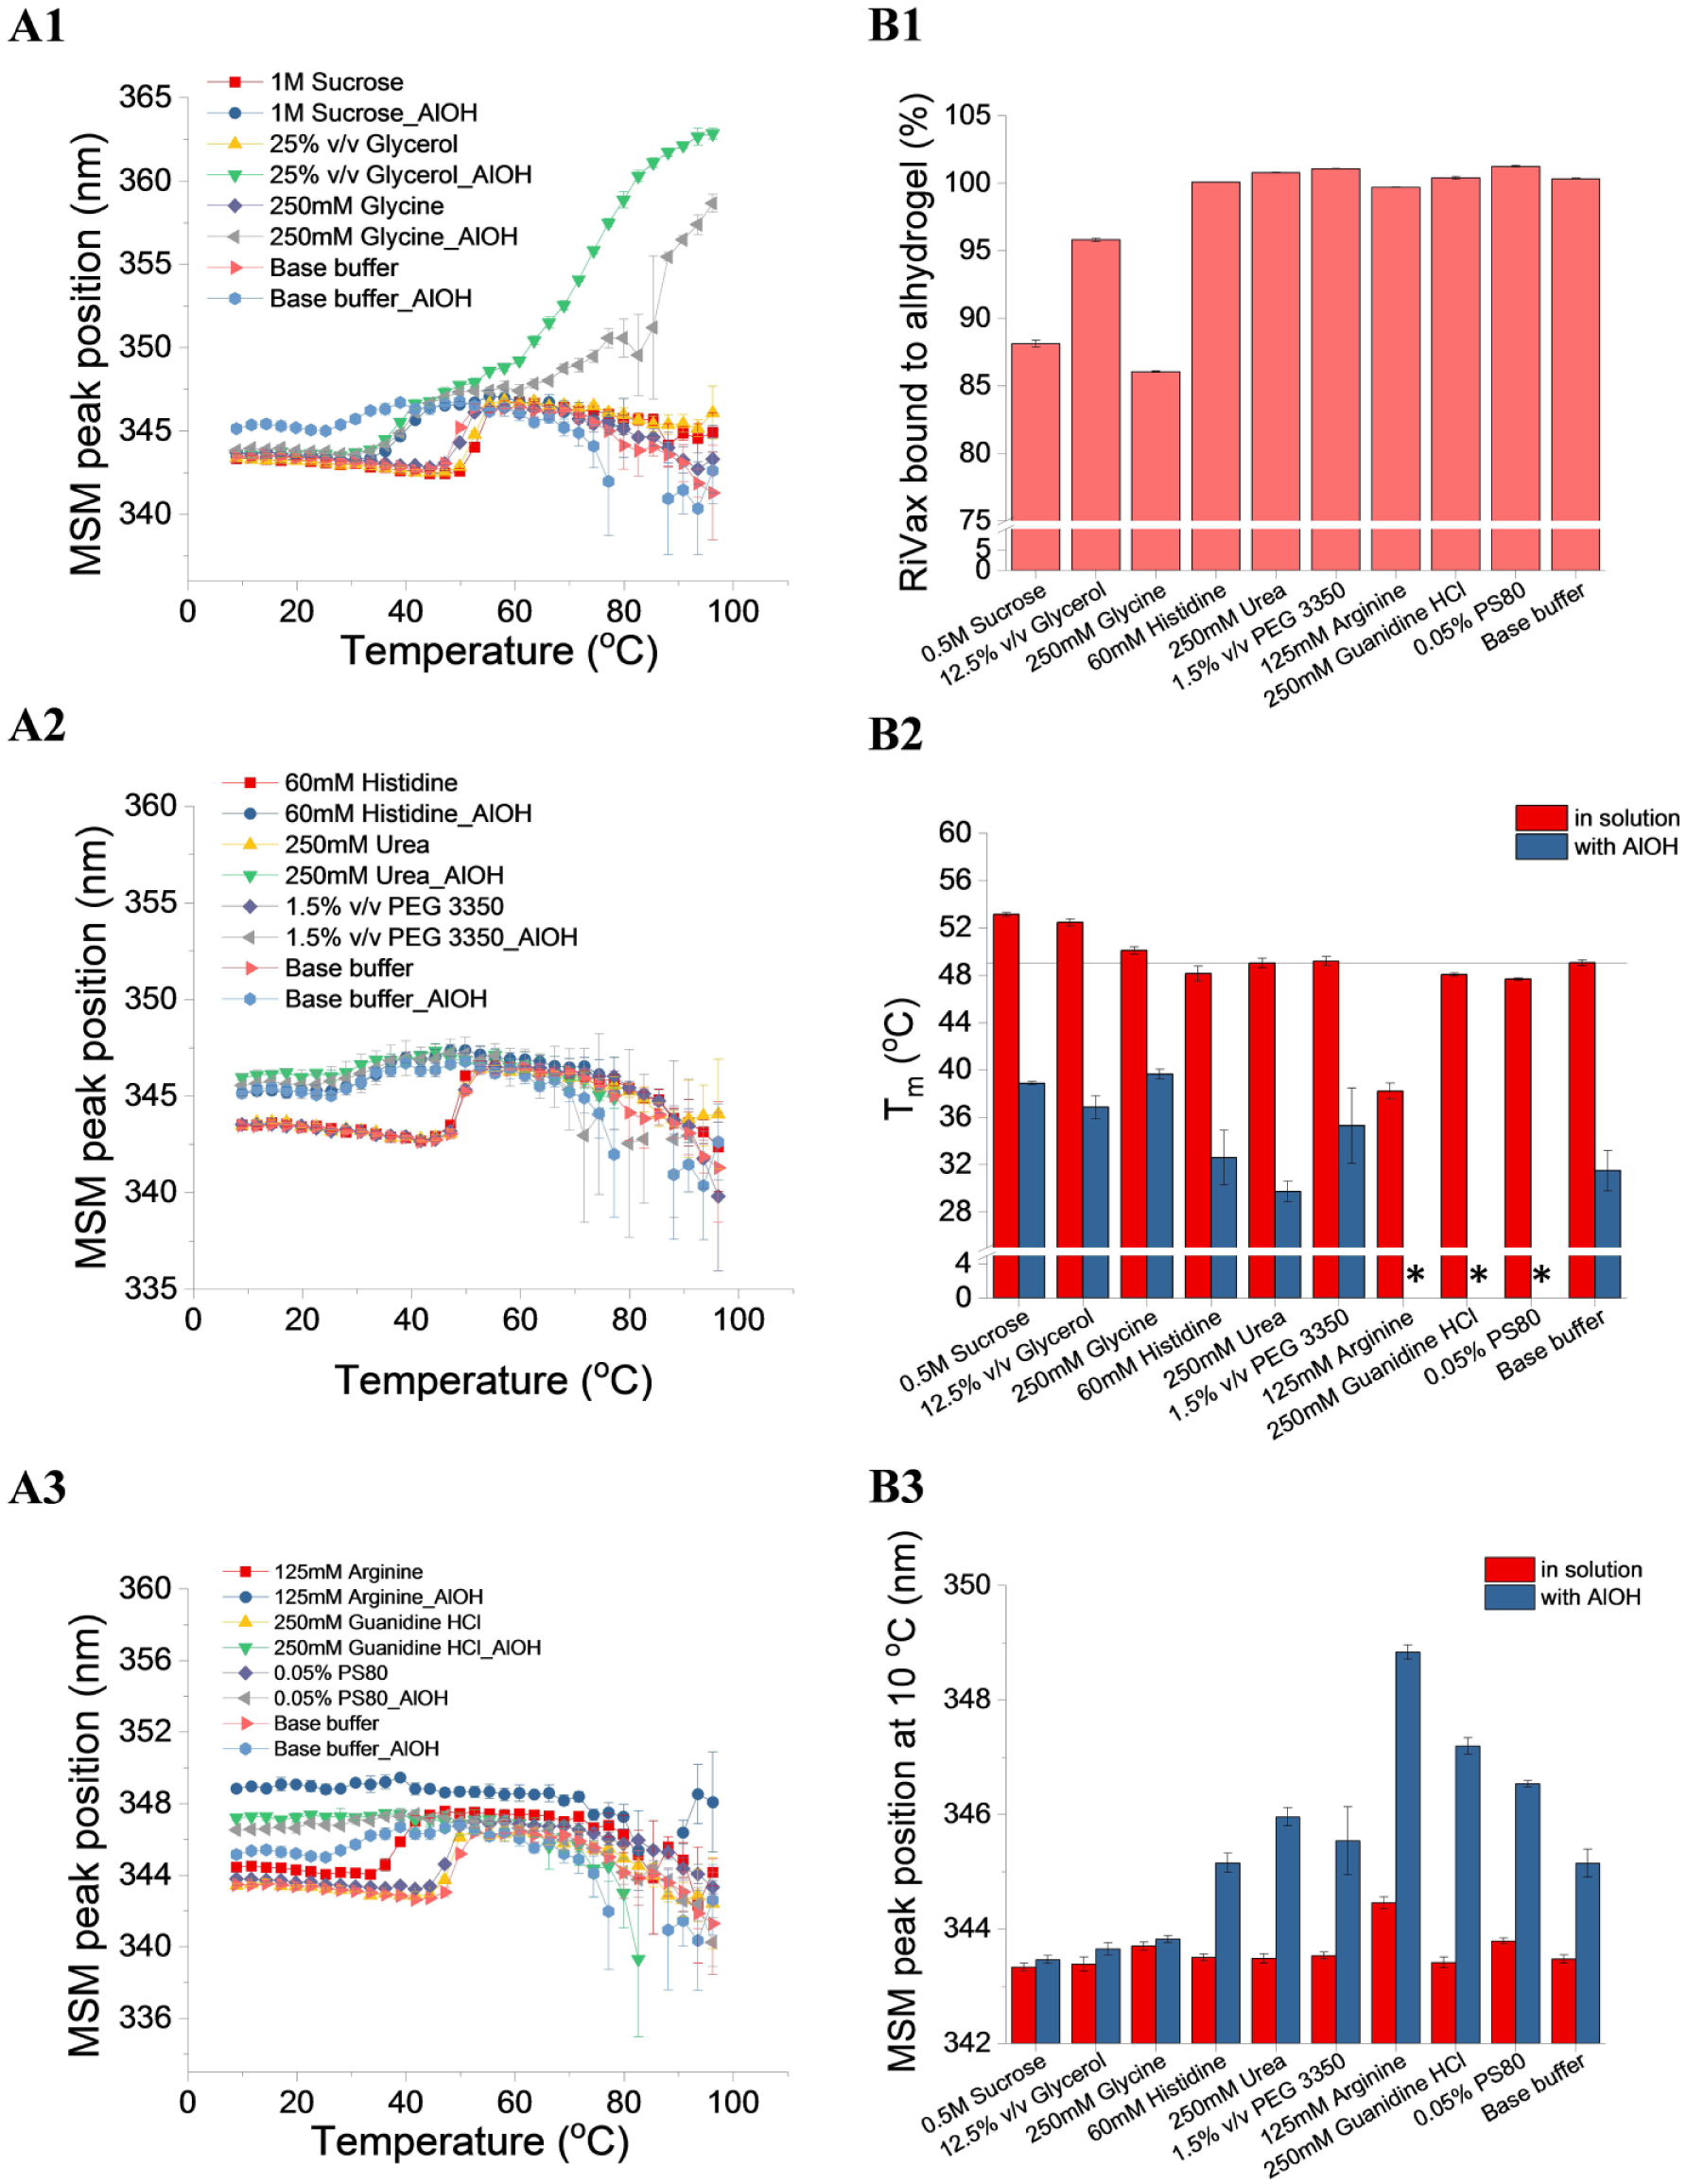
Comparison of the effects of excipients on the thermal stability of RiVax in 10 mM histidine isotonic buffer (pH 6.0) in the absence or presence of 2 mg/mL Alhydrogel. Thermal melting curves of RiVax in the absence or presence of Alhydrogel (
Excipient Screening of the mAb at 0.2 and 80 mg/mL
Excipient screening studies for mAbs are routinely performed at low concentration (e.g., 0.1–1.0 mg/mL) due to limited protein quantity and ease of analysis, while actual commercial drug products often contain mAbs at very high concentration (50–200 mg/mL). The thermal stability of mAbs has been previously shown to be dependent on protein concentration. 6 The dependency of Tm on protein concentration (0.2–80 mg/mL) in 20 mM citrate phosphate isotonic buffer (pH 6.0) was investigated here. Figure 6A shows that the Tm values of the mAb gradually decrease as the mAb concentration increases, and the effect is more pronounced at lower protein concentrations. We then studied if excipients affect the thermal stability of the mAb at high or low concentrations differently. Thus, their effects on Tm (ΔTm) of the mAb at 0.2 or 80 mg/mL were further studied using Trp intrinsic fluorescence. As shown in Figure 6B , 0.05% (v/v) PS 80 and 60 mM histidine did not produce major effects on the Tm at 0.2 or 80 mg/mL. The other excipients resulted in a significantly larger ΔTm value at 80 mg/mL compared with the mAb at 0.2 mg/mL. For example, 1 M sucrose had an enhanced stabilization effect on the mAb at 80 mg/mL. Glycerol (25%, v/v) did not thermally stabilize the mAb at 0.2 mg/mL but improved the Tm of the mAb at 80 mg/mL by more than 2 °C. Urea (at 250 mM) decreases the Tm of the mAb at 0.2 mg/mL by about 2 °C but did not result in detectable destabilization effects at 80 mg/mL. A similar result was observed for 1.5% (w/v) PEG 3350. The destabilization effects of 135 mM arginine and 250 mM guanidine HCl were significantly less at 80 mg/mL in contrast to their effects on the mAb at 0.2 mg/mL. Therefore, it is clear that the excipient screening results (reflected by ΔTm) obtained using the mAb at 0.2 mg/mL sometimes fail to predict the results at 80 mg/mL.
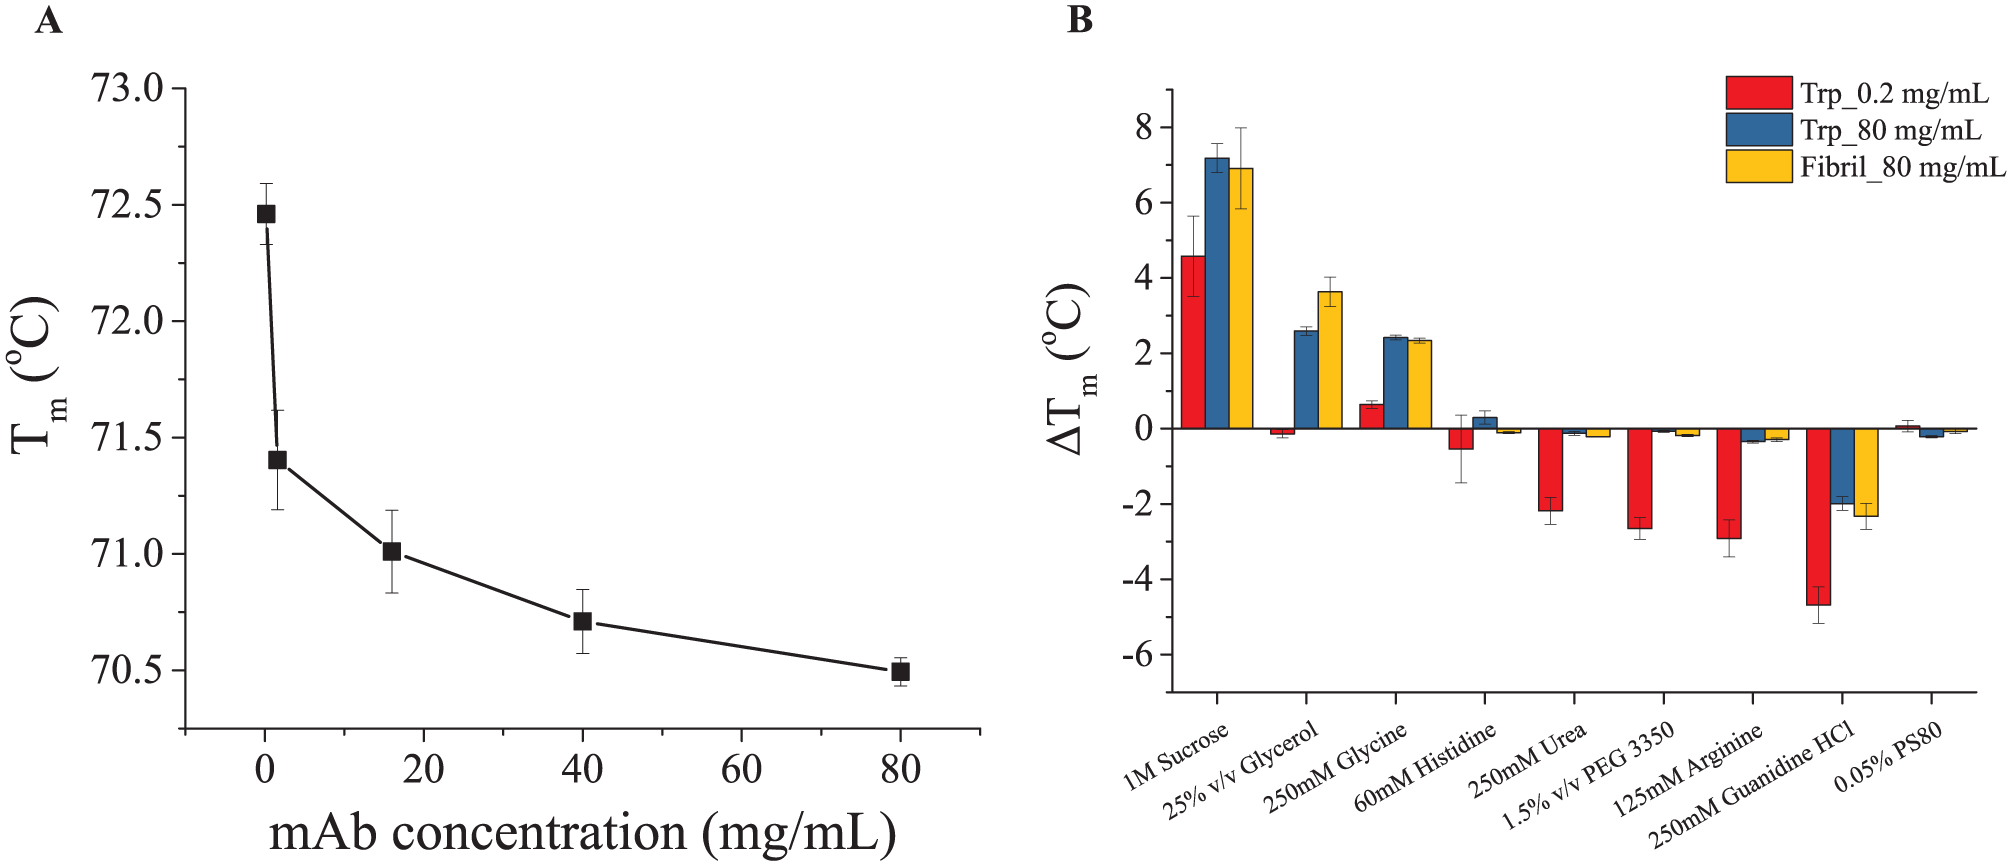
Excipient screening of the mAb at 80 mg/mL in 20 mM citrate phosphate isotonic buffer using Trp intrinsic fluorescence and fibril intrinsic fluorescence. (
Previous studies have reported that formation of fibrils by several proteins upon stress (e.g., elevated temperature) produced a characteristic fluorescence (excitation 355 nm and emission max 470 nm).18–20 The mAb used in this study has been found to form fibrils at elevated temperature driven by the formation of an intermolecular β sheet. 8 Here we tested the feasibility of studying the formation of fibrils by monitoring this florescence. We monitored this fluorescence using TRF with an excitation of 350 nm and emission of 485 ± 20 nm. During thermal unfolding, an increase in the intensity of such fluorescence was observed for the mAb at 80 mg/mL ( Suppl. Fig. S2 ), but not at 0.2 mg/mL (data not shown), probably due to the relatively low quantum yield of the fibril fluorescence. The Tm values calculated using the first derivative method from the fibril fluorescence of the mAb at 80 mg/mL showed a good correlation with the data from the Trp fluorescence study. This suggests the potential use of this method as a formulation monitor to measure the aggregation of high-concentration mAbs.
Discussion
In the present study, a high-throughput platform for the optimization of protein pharmaceutical formulations based on intrinsic fluorescence is described. It employed both TR and SS modes. Three model proteins (lysozyme, mAb, and RiVax) were tested to investigate the feasibility of using this platform for formulation development. These three proteins in a selected standard condition (0.2 mg/mL in clear solution) were first subjected to a pH screening study to identify optimal buffer conditions. Various Tm generation methods were employed to calculate the Tm. Accordingly, an optimal generation method was selected for an excipient screening study. The mAb and RiVax were further subjected to excipient studies under both standard and pharmaceutically relevant conditions. The results show significant discrepancy in the excipient screening data (reflected by ΔTm) of proteins studied under the simplified reference condition versus more commercially relevant conditions.
In the pH screening study, Tm values of each model protein generated using various methods overall show a similar trend across all pH conditions tested. A more detailed analysis of the dependency of Tm on these generation methods suggests that the type of fluorescence used (TRF vs SSF) and the data fitting method (first derivative vs six-parameter fit) do not significantly affect the final Tm values. The parameter selected to monitor protein thermal unfolding (intensity vs moment), however, has a significant impact on Tm values. We attempted to explain these results by simulating the correlation between changes in the parameter signal and the degree of protein unfolding. The simulation study suggests that, in most cases, fluorescence intensity is able to reflect the degree of unfolding in a linearly proportional manner, making the Tm derived from intensity a true value. Moment, however, is not linearly dependent on the degree of unfolding in most cases and therefore often results in a “false” Tm value. Similar work by Žoldák et al. suggested that the fluorescent intensity ratio, a commonly used parameter, does not generate a reliable Tm value because it is not linearly proportional to the population of macrostates. 21
The advantages of this high-throughput platform are better manifested in the excipient screening study. This technique is based on the intrinsic fluorescence of Trp in protein molecules. It is therefore label-free and potential interfering extrinsic probes can be avoided. Second, sample consumption is minor. It requires only 10 μL of sample at 0.2 mg/mL (i.e., 2 μg) per well, which means less than 1 mg of protein is needed even if all 384 wells are used. Third, a standard thermal scanning of a 384-well plate only takes 4–5 h using the thermal ramp described in the Materials and Methods section. Finally, the front-face geometry between the sample plate and detection makes it possible to study samples under challenging conditions, such as high-concentration and highly scattering conditions.
This fluorescence platform was further applied to study the effects of several selected excipients on RiVax and a mAb under difficult formulation conditions. In the case of RiVax, the protein was first adsorbed to AlOH (forming a turbid solution) and excipient effects on protein tertiary structures and melting temperature were studied. A previous study has employed extrinsic fluorescence for the high-throughput formulation screening of aluminum-adjuvanted vaccines. 22 However, common detergents such as Triton X100, poloxamers, and PS 80 cannot be tested because they produce excessive background signals, which seriously interfere with measurements or may themselves interact with excipients. In contrast, with this intrinsic fluorescence-based, high-throughput platform, such detergents can be tested. We were also able to observe stabilization effects of sucrose, glycerol, and glycine on AlOH-adsorbed RiVax. Our findings are in good agreement with previous work, which observed a decreased thermal stability of RiVax when adsorbed to AlOH and found that such destabilizing effects were only partially diminished by the addition of 15% glycerol. We also observed that these stabilizers reduced the binding efficiency of RiVax to AlOH. It is possible that these excipients partially stabilize adsorbed RiVax by decreasing the binding affinity of RiVax to AlOH. Possible mechanisms include (1) a preferential exclusion effect, which prevents the increase in the exposed surface area induced by protein adsorption to AlOH, and (2) a competitive binding effect between excipients and RiVax to AlOH. 23 It is critical to study the thermal stability of adsorbed antigen to optimize formulations and better understand the in vivo stability of such proteins. The use of a large quantity of stabilizer (1 M sucrose, 25% glycerol, or 250 mM glycine) only increased the Tm of adsorbed RiVax to near physiological temperature (37 °C). Upon vaccination, due to the loss of stabilizing effects of these excipients, adsorbed RiVax may adopt an altered tertiary structure at 37 °C. This may partially explain the unsatisfactory immunogenicity of RiVax even when adsorbed to AlOH. 24 It would be interesting to study the dissociation and structural behavior of adsorbed RiVax and other protein antigens when exposed to physiological environments to better understand the effects on immunogenicity.
In the case of the mAb, excipient effects on high-concentration mAb were investigated. The requirement for a sample volume as low as 10 μL facilitates such excipient screening. Thus, for a mAb at 100 mg/mL, only 1 mg of protein is required for each excipient condition. The sample volume can be potentially further reduced if needed. The effects of excipients on the thermal stability of the mAb examined here are quite distinctive. Osmolytes (e.g., 1 M sucrose and 25% glycerol) show a better stabilization effect on the mAb (at 80 mg/mL) than the more dilute mAb (at 0.2 mg/mL), especially for 25% glycerol, which did not thermally stabilize the mAb (at 0.2 mg/mL). This discrepancy is probably due to a more pronounced preferential exclusion effect for high concentrations of the mAb. On the other hand, the destabilizers become less effective for the high-concentration mAb, possibly because of a decreased destabilizer/protein molar ratio. In addition, the good agreement between Tm values obtained using fibril fluorescence and those generated using Trp fluorescence shows that the formation of fibrils is concurrent with the unfolding of the protein. In other words, the kinetics of fibril formation may be much faster than the kinetics of the unfolding process, suggesting that the unfolding process may be the rate-limiting step. The implementation of fibril fluorescence for studies of mAbs could provide the following insights: (1) the formation of fibril as an alternative to look at the aggregation behavior of mAb and (2) a better understanding of the kinetic processes of thermal unfolding and aggregation of mAbs.
This study establishes a general workflow based on protein intrinsic fluorescence for direct optimization of protein formulations. Key steps involve a pH screening study, selection of a parameter for monitoring thermal unfolding, and a final excipient screening study. This work highlights the importance of performing the excipient screening under pharmaceutically relevant conditions (e.g., high protein concentration formulation or adjuvanted formulation with high turbidity).
Supplemental Material
DS_TECH780620 – Supplemental material for Improved Fluorescence Methods for High-Throughput Protein Formulation Screening
Supplemental material, DS_TECH780620 for Improved Fluorescence Methods for High-Throughput Protein Formulation Screening by Yangjie Wei, Nicholas R. Larson, Siva K. Angalakurthi and C. Russell Middaugh in SLAS Technology
Footnotes
Acknowledgements
The authors would like to thank Dr. Gregory Gillispie, Fluorescence Innovations, Inc., for his thoughtful comments on the manuscript.
Declaration of Conflicting Interests
The authors declared no potential conflicts of interest with respect to the research, authorship, and/or publication of this article.
Funding
The authors disclosed receipt of the following financial support for the research, authorship, and/or publication of this article: This research was supported in part by a graduate student fellowship award to Y.W. from the American Association of Pharmaceutical Scientists Foundation. The KU authors wish to acknowledge the NIH biotechnology training grant (5T32GM008359-26) to N.R.L.
Supplemental material is available online with this article.
References
Supplementary Material
Please find the following supplemental material available below.
For Open Access articles published under a Creative Commons License, all supplemental material carries the same license as the article it is associated with.
For non-Open Access articles published, all supplemental material carries a non-exclusive license, and permission requests for re-use of supplemental material or any part of supplemental material shall be sent directly to the copyright owner as specified in the copyright notice associated with the article.