
Abstract
ARID1A, a component of the chromatin remodeling complex SWI/SNF, is an evolutionarily conserved complex that uses the energy of adenosine triphosphate hydrolysis to remodel chromatin structure and functions as a master regulator of gene transcription. Recent genomic studies have revealed that ARID1A is one of the most frequently mutated genes in human cancers. However, therapeutic approaches that selectively target ARID1A-mutant tumors are not yet clinically available. Our previous study showed that ARID1A facilitates chromatin response and cell cycle checkpoint activation after DNA damage. Therefore, an ARID1A deficiency may result in therapeutic vulnerabilities in cell cycle modulators. The goals of our study were to develop a novel screening approach, based on fluorescent ubiquitination-based cell cycle indicators (FUCCI), and to identify chemical agents that can selectively modulate the cell cycle transition in ARID1A-deficient cancer cells. Using this high-throughput assay, we screened 2643 compounds and identified six potential chemical modulators that can selectively modulate the cell cycle in ARID1A-deficient cells; these agents may be useful for developing new therapeutics for ARID1A-mutant tumors. In summary, our study demonstrates that FUCCI cell-based high-content screening is a powerful and effective approach for identifying cell cycle modulators and can be applied to multigenotypic screening for targeted cancer therapeutics.
Introduction
AT-rich interactive domain 1A gene (ARID1A), also known as BAF250a, has been identified as one of the most frequently mutated genes in a broad spectrum of human cancers by multiple next-generation genomic-sequencing studies.1,2 The Cancer Genome Atlas database showed that mutations of ARID1A were present in 30% to 57% of clear cell and endometrioid ovarian cancers, 39% to 44% of uterine endometrioid carcinomas, 9% to 19% of esophageal adenocarcinomas, 9% to 10% of colorectal carcinomas, and 8% to 29% of gastric carcinomas.1–3 Studies have shown that ARID1A functions as a tumor suppressor.1,3 Most ARID1A mutations are inactivating mutations, which result in a loss of ARID1A expression in tumors. Several recent studies have exploited targeted therapeutics for ARID1A-deficient tumors, for example, PARP inhibition, 2 EZH2 inhibition, 4 and ATR inhibition. 5 In addition, ARID1A and ARID1B synthetic lethality has also been reported recently, suggesting ARID1B as a potential therapeutic target for ARID1A-mutant tumor. 6 Nevertheless, there are currently no effective treatments clinically available that can selectively kill ARID1A-mutant tumors. Therefore, identifying novel therapeutic strategies for ARID1A-mutated tumors is still currently needed. 7
ARID1A is a subunit of the SWI/SNF chromatin remodeling complex. 8 It uses the energy of adenosine triphosphate hydrolysis to remodel chromatin structure and facilitate proteins’ access to chromatin. 9 Interestingly, studies by our research group and others have shown that chromatin remodeling factors play an important role in DNA damage response and the repair of DNA double-strand breaks.10–12 More interestingly, our study revealed that ARID1A deficiency leads to defective cell cycle checkpoint activation in response to DNA damage. 2 As a consequence, ARID1A-depleted cells exhibit an impaired capability to initiate and maintain cell cycle arrest when encountering DNA damage.
To maintain genomic integrity, the cell cycle is tightly and precisely regulated in a sequential and irreversible fashion. Progression through the cell cycle is promoted by enzymes known as cyclin-dependent kinases (CDKs), which are regulated positively by key regulatory proteins called cyclins and negatively by CDK inhibitors13,14 and monitored by checkpoints.15–17 Checkpoints can stop the cell cycle in response to DNA damage, which allows time for efficient DNA repair and thereby maintains genomic stability. 18 Thus, defective cell cycle modulation or checkpoint function can lead to deleterious genetic alterations and contribute to tumorigenesis.
Highly selective kinase inhibitors that target key cell cycle modulators, including CDKs (CDK4 and CDK6),19,20 CHK1/2,21–23 WEE1,24,25 and so forth have been developed and tested in multiple clinical trials. 14 One CDK4/6 inhibitor, palbociclib, has been approved, in combination with the aromatase inhibitor letrozole, for use in breast cancer treatment. 20 More than 10 clinical trials of palbociclib, in combination with other signaling pathway–targeting drugs, have been conducted or are ongoing in a variety of tumors. Additional CDK4 and CDK6 inhibitors (such as ribociclib and abemaciclib) are being actively tested in clinical trials as well. 14 Chemical inhibitors that target WEE1 can alter the G2/M checkpoint in response to DNA damage, and several phase I and phase II clinical trials are testing the WEE1 inhibitor MK-1775, in combination with other chemotherapeutic agents, in multiple solid tumors.24,25 Therefore, chemical compounds that can modulate the cell cycle in cancer cells have great potential to be translated into new cancer treatments.
Our data showed that ARID1A-deficient cells have a major defect in the G2/M checkpoint after being exposed to double-strand break-inducing agents such as ionizing radiation. 2 This finding may uncover a mechanism that underlies the tumor-suppressing function of ARID1A in human cancers. More important, our results provide a rationale to determine whether we can identify selective cell cycle modulators to treat ARID1A-mutant tumors by targeting cell cycle checkpoint vulnerability in these cancer cells. Specific abrogation of cell cycle control in ARID1A-deficient cells may also help us identify targeted sensitization strategies to enhance the responses of ARID1A-mutant tumors to mainstay chemotherapy and radiation therapy, which will have a clear clinical impact on the development of rational combination therapy.
We generated fluorescent ubiquitination-based cell cycle indicator (FUCCI)–expressing HCT116 wild-type (WT) and ARID1A genetic knockout (AKO) cell lines and performed comparative high-content screening using an image-based functional assay to identify cell cycle modulators that can selectively target ARID1A-deficient cancer cells. We used the FUCCI method because the probes can effectively label individual G1 phase nuclei with red fluorescent signals and those in S/G2/M phases with green fluorescent signals. The switch of fluorescent signals during cell cycle transition in FUCCI is induced by the reciprocal activities of the ubiquitin E3 ligase complexes APCCdh1 and SCFSkp2. More specifically, APCCdh1 primarily functions in G1 phase. In contrast, SCFSkp2 is predominantly active in S, G2, and early M phases. Cdt1 is ubiquitinated by SCFSkp2 during S/G2 and degraded by proteasome, and Geminin is ubiquitinated by APCCdh1 during G1, likewise leading to proteosomal degradation. Consequently, the APCCdh1 and SCFSkp2 substrates Geminin and Cdt1 are degraded in G1 and S/G2/M, respectively. By fusing the red- and green-emitting fluorescent proteins mKO2 and Azami Green (mAG) to Cdt1 and Geminin, the nuclei of cells in G1 phase (and G0) appear red and those of cells in S/G2/M appear green. Thus, two chimeric proteins, mKO2-hCdt1 (30/120) and mAG-hGem (1/110), function as G1 and S/G2/M markers.26–28
The two major goals of our study were 1) to provide proof-of-principle evidence that comparative FUCCI cell–based screenings can be used to identify cell cycle modulators in specific genetic contexts and 2) to identify chemical agents that can selectively target cell cycle transition in ARID1A-deficient cancer cells and can thus be used as new clinically applicable therapeutics against ARID1A-mutant tumors.
Materials and Methods
Cell Cultures and Reagents
Human AKO (Q456*/Q456*) and parental WT HCT116 (ATCC ID CCL-247) cells were purchased from Horizon Discovery (St. Louis, MO). The human ARID1A (Q456*/Q456*) HCT116 cell line is a homozygous KO of ARID1A that results from the knockin of a premature stop codon (Q456*). Cells were maintained in RPMI1640 medium, which was purchased from Corning Cellgro (Thermo Fisher Scientific, Waltham, MA), containing 2 mM L-glutamine and 25 mM sodium bicarbonate and supplemented with 10% fetal bovine serum (FBS; Gibco, Thermo Fisher Scientific). Gastric cancer AGS cell line was purchased from the American Type Culture Collection (ATCC). AGS cells were maintained in RPMI1640 medium supplemented with 10% FBS. Trypsin EDTA 0.25% and cell culture phosphate-buffered saline (PBS) were purchased from Corning Cellgro (Thermo Fisher Scientific). A PremoFUCCI Cell Cycle Sensor (BacMam 2.0) was purchased from Thermo Fisher Scientific (Rockford, IL). Black 96-well cell culture imaging plates were purchased from Greiner Bio-One (Monroe, NC). Anti-ARID1A antibody was purchased from Bethyl Laboratories (Montgomery, TX). The horseradish peroxidase secondary antibody was purchased from Jackson ImmunoResearch (West Grove, PA). Topotecan was purchased from Selleck Chemicals (Houston, TX).
Generation of FUCCI Sensor-Labeled HCT116 Cells
Approximately 2 × 10⁵ human AKO (Q456*/Q456*) and parental WT HCT116 cells were seeded in 60 mm dishes and allowed to adhere. Twenty-four hours later, each Premo reagent (40 µL of Premo Geminin-CFP component A and 40 µL of Premo Cdt1-red fluorescent protein component B) was mixed by inversion to ensure a homogenous solution. Premo reagents were added directly to the cells in complete cell medium and mixed gently. Cells were cultured in the culture incubator at 37 °C in a humidified atmosphere at 5% CO2 overnight; the next day, the cells were ready to be used as stable FUCCI sensor-labeled cells ( Suppl. Fig. S1A ).
Library Compounds and Preparation for Screening
The chemical library was obtained from the National Cancer Institute/Development and Therapeutic Program (NCI/DTP), which includes 2643 compounds: 1) approved oncology drugs set V (114 compounds), 2) diversity set IV (1596 compounds), 3) mechanistic diversity set II (816 compounds), and 4) natural products set III (117 compounds). Each well of the diversity and approved oncology drugs set plates holds 20 µL of a 10 mM DMSO solution. Each well of the mechanistic set plates holds 20 µL of a 1 mM DMSO solution.
The 117 compounds of the natural products set III are stored on 96-well polypropylene microtiter plates, with 60 compounds per plate. Each well contains a compound with 1 µL of glycerol at a concentration of 0.2 M; we added 19 µL of DMSO per well to obtain 20 µL of a 10 mM solution. For the diversity set IV, approved oncology drugs set V, and natural products set III plates, the compounds were diluted by plating 1 µL as a 100× concentration into 100 µL of a PBS mixture in 96-well plates, to a concentration of 0.1 mM. The mechanistic diversity set II compounds were diluted by plating 10 µL as a 10× concentration into 90 µL of a PBS mixture in 96-well plates, to a concentration of 0.1 mM.
Automation
Plate and liquid handling was performed using a high-throughput screening platform composed of an EL406 washer dispenser (Biotek, Winooski, VT) and a JANUS automated liquid-handling workstation (PerkinElmer, Billerica, MA).Cell seeding and assays were performed in black 96-well imaging plates (Greiner Bio-One). Image acquisition and quantification were performed with an ImageXpress Micro High-Content Analysis System (Molecular Devices, Sunnyvale, CA; Suppl. Fig. S1B ).
High-Throughput Screening Protocol
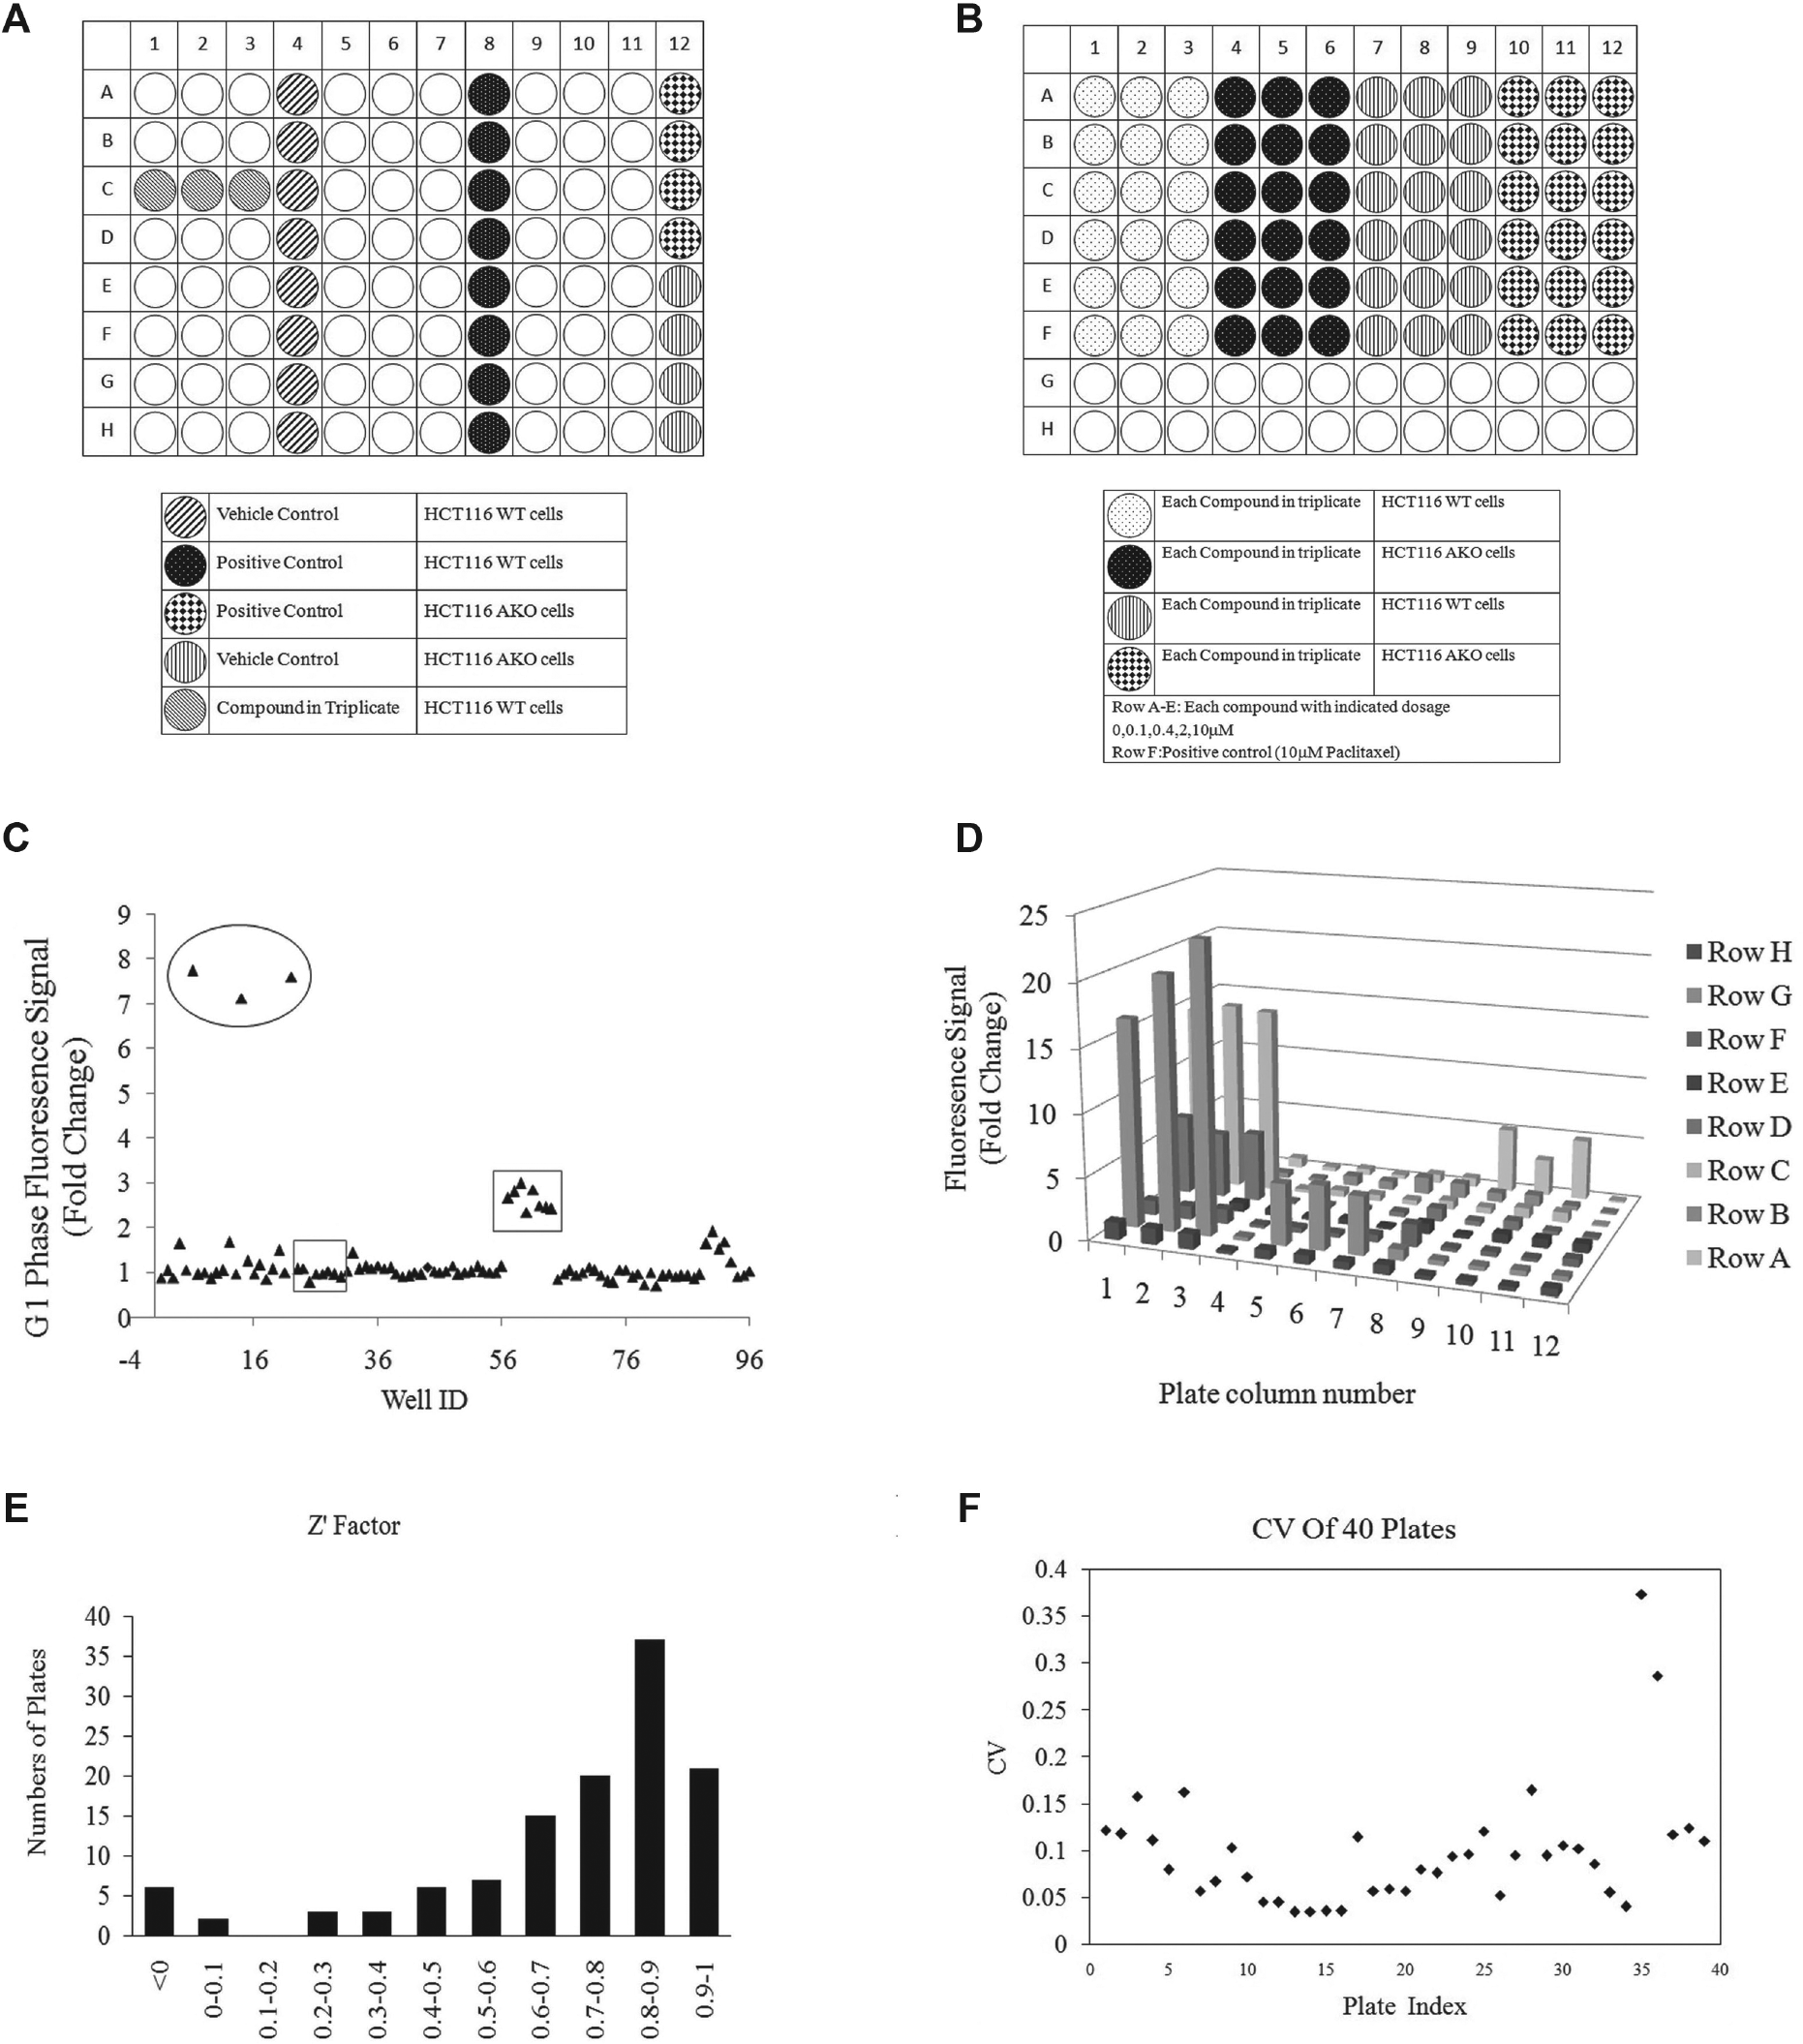
For the screening, 10 µL volumes of each diluted 0.1 mM screening library compound were dispensed in triplicate, in a designated layout, into assay plates using the JANUS automated liquid-handling workstation at a final concentration of 10 µM. We then dispensed 90 µL of FUCCI sensor-labeled WT and AKO cell suspensions into black 96-well optical imaging plates (Greiner Bio-One) using the EL406 washer dispenser, at a density of 5 × 10³ cells per well. Each compound was added in triplicate in one row, with the vehicle and positive controls in columns 4 and 8 on each plate (see Fig. 1A for plate layout information). Cells were subsequently incubated at 37 °C in a humidified atmosphere with 5% CO2 for 24 h. The supernatant containing the compounds was then removed. Cells were washed with PBS once and fixed with 0.4% paraformaldehyde at 4 °C overnight. On the third day, cells were washed again with PBS and stained with 1 µg/mL of DAPI in PBS for 10 min; the assay plates were then ready for image acquisition.
(
High-Content Image Acquisition and Analysis
We imaged 96-well optical imaging plates using the automated ImageXpress Micro High-Content Analysis System. Eight fields of images per well were acquired at a 10×objective in three wavelengths: wavelengths1 (W1), wavelengths2 (W2), and wavelengths3 (W3), respectively—using filter sets for DAPI (383/445 nm), cyan (458/489 nm), and far red (587/610 nm). Images were analyzed using a modified multiwavelength cell-scoring analysis module of MetaXpress software (Molecular Devices). Objects of interest were identified by gating to fluorescent intensity levels above the local background level and minimum and maximum object sizes. The DAPI signal was used to detect all cell nuclei as total cell counts. The G2/M phase signal was measured at W2. The G1 phase signal was measured at W3. The quantitative data image analysis algorithm included total cell counts, all nuclei mean integrated intensities, all nuclei mean areas, percentage positive W2, all W2 mean stain integrated intensities, all W2 mean stain areas, percentage positive W3, all W3 mean stain integrated intensities, and all W3 mean stain areas.
Hit Confirmation Assay
FUCCI sensor-labeled WT and AKO cell suspensions were plated onto black 96-well imaging plates at a density of 5 × 10³ cells per well (see Fig. 1B for plate layout information). Positive hits of screening library compounds were added into the wells in triplicate, with increasing concentrations of 0.1 µM, 0.4 µM, 2 µM, and 10 µM placed in different rows. The plates were incubated at 37 °C in a humidified atmosphere with 5% CO2. Twenty-four hours later, the supernatant containing the compounds was removed. Cells were washed with PBS once and fixed with 0.4% paraformaldehyde at 4 °C overnight. On the third day, cells were washed again with PBS once and stained with 1 µg/mL of DAPI in PBS for 10 min. Images of the plates were acquired using the automated ImageXpress micro high-content analysis system.
Secondary Validation Assay: Cell Cycle Analysis by Flow Cytometry Using DAPI Staining
Both WT HCT116 cells and AKO cells (1 × 10⁵) were seeded in six-well plates. The following day, cells were treated with different compounds (final concentration of 1–10 µM) or DMSO for 24 h. Cells were then trypsinized and washed with PBS. Subsequently, cells were fixed with cold 70% ethanol and incubated for a minimum of 2 h on ice. After being washed with PBS, cells were resuspended in DAPI staining solution (0.1% DAPI, 100 µg/mL RNase A, and 0.1% Triton X-100) and incubated for 40 min at ambient temperature in the dark. Three independent experiments were performed to obtain the mean values and their standard deviations (SD). A cell cycle analysis was performed at The University of Texas MD Anderson Cancer Center (Houston, TX) Flow Cytometry and Cellular Imaging Facility. Cells were analyzed in a Beckman Coulter Gallios flow cytometer using Kaluza Flow Analysis software.
Drug Response Analysis from the Cancer Cell Line Encyclopedia
Three independent cancer cell types (colon, breast, and ovarian cancers) were profiled at the genomic level (data available at http://www.broadinstitute.org/ccle and Gene Expression Omnibus using accession No. GSE36139), and the sensitivity data of a total of 18 cell lines were obtained. Eight-point dose-response curves were generated for the anticancer drug topotecan. Compound sensitivity data were used to generate the dose-dependent drug response curve using GraphPad Prism6 software (GraphPad Software, Inc., La Jolla, CA).
RNA Interference and Immunoblotting
Stable knockdown of ARID1A expression in AGS cells was established via RNA interference using lentiviral vector–based MISSION shRNA (Sigma, St. Louis, MO). ARID1A was targeted with a lentiviral particle of MISSION shRNA ARID1A NM_006015 as well as MISSION nontargeted control particles as previously described. 2 Specificity and efficacy of the shRNA ARID1A procedure were evaluated by Western blotting after transduction and puromycin selection in cells. For immunoblotting, after samples were separated using electrophoresis, membranes were blocked with 5% milk diluted in Tris buffer with 0.1% Tween 20 for 1 h at room temperature. Membranes were then incubated with primary ARID1A antibodies (1:500) diluted in PBS-T/5% (w/v) milk at 4 °C overnight. Subsequently, membranes were washed with PBS-T and incubated with secondary antibody (1:2000). Finally, signals of the bound antibody were detected using enhanced chemiluminescence (GE Healthcare, Pittsburgh, PA).
MTT and Apoptosis Assay
MTT (Sigma; M5655) was used to evaluate the proliferation of cells. Briefly, the control AGS cells and ARID1A knock down (Nos. 1 and 2) AGS cells were counted and seeded in a 96-well plate at a density of 1 × 10³ cells per well. The next day, cells were treated with 0.01 µM topotecan or DMSO. After 72 h, cells were incubated with MTT substrate (Sigma; 20 mg/mL) for 4 h, and the cultures were removed and replaced with DMSO. The optical density was measured spectrophotometrically at 570 nm. Apoptotic cells were detected by FITC Annexin V Apoptosis Detection Kit (BD Pharmingen, San Diego, CA) according to the manufacturer’s instruction. The control AGS cells and ARID1A knock down cells (Nos. 1 and 2) were seeded in a six-well plate. The next day, cells were treated with 1 µM topotecan or DMSO. Cells were harvested for apoptosis analysis 24 h after drug treatment. Cells in late apoptosis were analyzed and were both FITC Annexin V and propidium iodide positive. Basically, cells were washed with cold PBS and then resuspend in 1× binding buffer at a concentration of 1 × 10⁶ cells. Cell suspension was transferred to a 5 mL culture tube, and cells were incubated with 5 µL FITC Annexin V and 5 µL propidium iodide for 15 min before flow cytometry analysis. Three independent experiments were performed, and mean values and their SDs were calculated.
Data Analysis
The screening-level quantitative data from the MetaXpress analysis were integrated using AcuityXpress software (Molecular Devices). Data were exported to ATF files and analyzed using Microsoft Excel. The means and SD of each compound were calculated from triplicate measurements. The statistical significance of the differences between each compound and the vehicle control was calculated using a two-tailed Student t test. A p value <0.01 was considered statistically significant. The percentage of control (PC) was used for data normalization. The PC was defined as the activity of each sample (Si) divided by the means of the vehicle control wells © (PC = Si/m©(C) × 100), also known as the fold change. The means of the screened compounds were compared with the means of the vehicle controls in each plate. The final results were reported as the fold change compared with the vehicle controls, with the cutoff set to the means + 3 SD. Z′ factors and coefficient of variation (CV) are used for quality control. The volcano plot, column scatter plot, and cell cycle graph were created using GraphPad Prism6 software. Data from the MTT and apoptosis assay were summarized as mean ± SD. Differences among groups were analyzed by using a two-tailed Student t test. Statistical significance was defined as p < 0.05. Calculations were performed with GraphPad Prism software.
Results
Design of Comparative High-Throughput FUCCI Cell-Based Screening in ARID1A WT and KO Cancer Cells
We developed and performed comparative FUCCI cell-based screening in ARID1A WT and AKO cancer cells in four major steps ( Suppl. Fig. S1 ). First, we generated FUCCI HCT116 WT cells and AKO cells that contain dual fluorescent colors in different phases of the cell cycle. We used the colon cancer cell line HCT116 for general screening purposes because these cells are well-established cell model systems for cell cycle, DNA damage response, and DNA repair studies. Isogenic HCT116 cell lines that lack ARID1A expression were developed using a knockin mutant, ARID1A (Q456*/Q456*), which abolishes ARID1A expression as a result of an early stop codon (Horizon Discovery). The effectiveness of ARID1A depletion in HCT116 ARID1A-KO cells was confirmed by Western blot analyses as previously described. 2 In FUCCI-HCT116 cells, the nuclei of cells in G1 phase (and G0) are red detected by Cdt1-red fluorescent protein, whereas the nuclei of the cells in S/G2/M are green detected by Geminin-cyan fluorescent protein ( Suppl. Fig. S1C ).
We seeded FUCCI HCT116 WT cells and AKO cells in micro-clear 96-well plates to perform screening, including the vehicle control, positive control, and different cell types ( Fig. 1A ). Each compound was tested in triplicate. The vehicle control (DMSO) and positive control (paclitaxel) were added in eight wells of columns 4 and 8 in each plate. We also plated cells of the alternative cell line in column 12 in each plate; these cells were treated with vehicle control from rows 1 to 4 and with positive control from rows 5 to 8. Using this format, we were able to test 24 compounds in each 96-well plate ( Fig. 1A ).
We exposed the cells to 2643 compounds from four chemical libraries, which had been obtained from the NCI DTP program. Cells were incubated with these chemical compounds for 24 h. The working concentration of each compound was 10 µM, with 10 µL of each diluted compound added into 100 µL of culture medium to achieve a final 1:1000 dilution. We screened 228 plates of 96 wells with appropriate positive and vehicle controls. At the end of treatment, cells were fixed and stained.
We performed high-content image acquisition and measured the fluorescence signals to express nine parameters, including 1) total cell counts, 2) all nuclei mean integrated intensities, 3) all nuclei mean areas, 4) percentage positive W2 (cyan fluorescent signal indicating G2/M cells), 5) all W2 mean stain integrated intensities, 6) all W2 mean stain areas, 7) percentage positive W3 (red fluorescent signal indicating G1 cells), 8) all W3 mean stain integrated intensities, and 9) all W3 mean stain areas. We then used these parameters to identify chemical modulators that can selectively target cell cycle transition in AKO cancer cells. A representative heat map indicating the distribution of positive hit locations in the screening plates is shown in Supplemental Figure S1D .
In each plate, the fold changes of W2% and W3% were calculated on the basis of the W2 and W3 signals from untreated vehicle control samples and drug-treated samples. We used the fold change values to show the effect of screening compounds on G2/M and G1 cell cycle distribution in both WT and AKO cancer cells. As shown in Figure 1C , a representative scatter plot was generated from a screening plate using the fold changes of W2% (W2% of treated cells/W2% of untreated cells). From this scatter plot, the distribution of positive hits (indicated in the ovals), positive controls, and vehicle controls (indicated in square boxes) could be clearly visualized ( Fig. 1C ). Active compounds, circled in the scatter plot, represent promising hits that induce a significant increase in the number of G2/M cells (increase of W2%) compared with untreated cells (vehicle-treated cells). In addition, as shown in a three-dimensional bar diagram, the positive hits significantly increased the strength of the W2 fluorescence signals compared with the vehicle controls and positive controls ( Fig. 1D ).
Normalization and Quality Control of Screening
Normalization of data within each plate is the key step in enabling us to compare results across plates in the whole screening process. In our screening, the data were normalized using a vehicle treatment approach and by calculating the fold change in each screening plate, also known as the PC. For example, for the fifth sample of one plate, the PC was calculated by dividing S5 by the mean of C and then multiplying the result by 100. The Z′ factor was used to determine whether the data collected from each plate met the minimum quality requirement. The optical assay with a Z′ factor value greater than 0.5 was considered to be excellent. The results were robust on the basis of an overall Z′ factor of 0.513. For example, in 83.3% of the 114 screening plates using WT cells, Z′ factor values were greater than 0.5, and 65% were greater than 0.7. These data showed that our assay met the quality requirement of the screening experiments ( Fig. 1E ). In addition, those plates with a Z′ factor lower than 0.3 were excluded from further analysis. To assess assay performance, the CV of the vehicle control was calculated for each of the first forty 96-well plates screened. All CVs, except those from only two plates, were smaller than 20%, suggesting that variations among different plates were at an acceptable level ( Fig. 1F ).The variation in these two plates was likely biological, caused by variations in cell culture and maintenance.
Selection of Hits from Cell Cycle Modulators Identified from HCT116 WT Cells
In our screenings, we observed that some compounds induced a significant reduction in total cell counts, which suggests a cytotoxic effect. To calculate cytotoxicity, we used three parameters: total cell counts, all nuclei mean integrated intensities, and all nuclei mean areas. Basically, we set two different cutoffs for cytotoxicity determination: a 20% reduction in total cell counts or a 50% reduction in total cell counts. In the first 40-plate screening set, we validated the results of our compounds in secondary confirmatory screening using gradient dosages. To our surprise, we found that many of the chemicals that induced a 20% to 50% reduction in total cell counts still showed a good dosage response in modulating cell cycle transition at a lower concentration (data not shown). Therefore, in our screening, to enrich positive hits, we include this portion of compounds that induced no more than 50% reduction in total cell counts in our hit selection pool. Thus, we chose more than 50% reduction in total cell counts as cytotoxicity, and we excluded these compounds in further analysis.
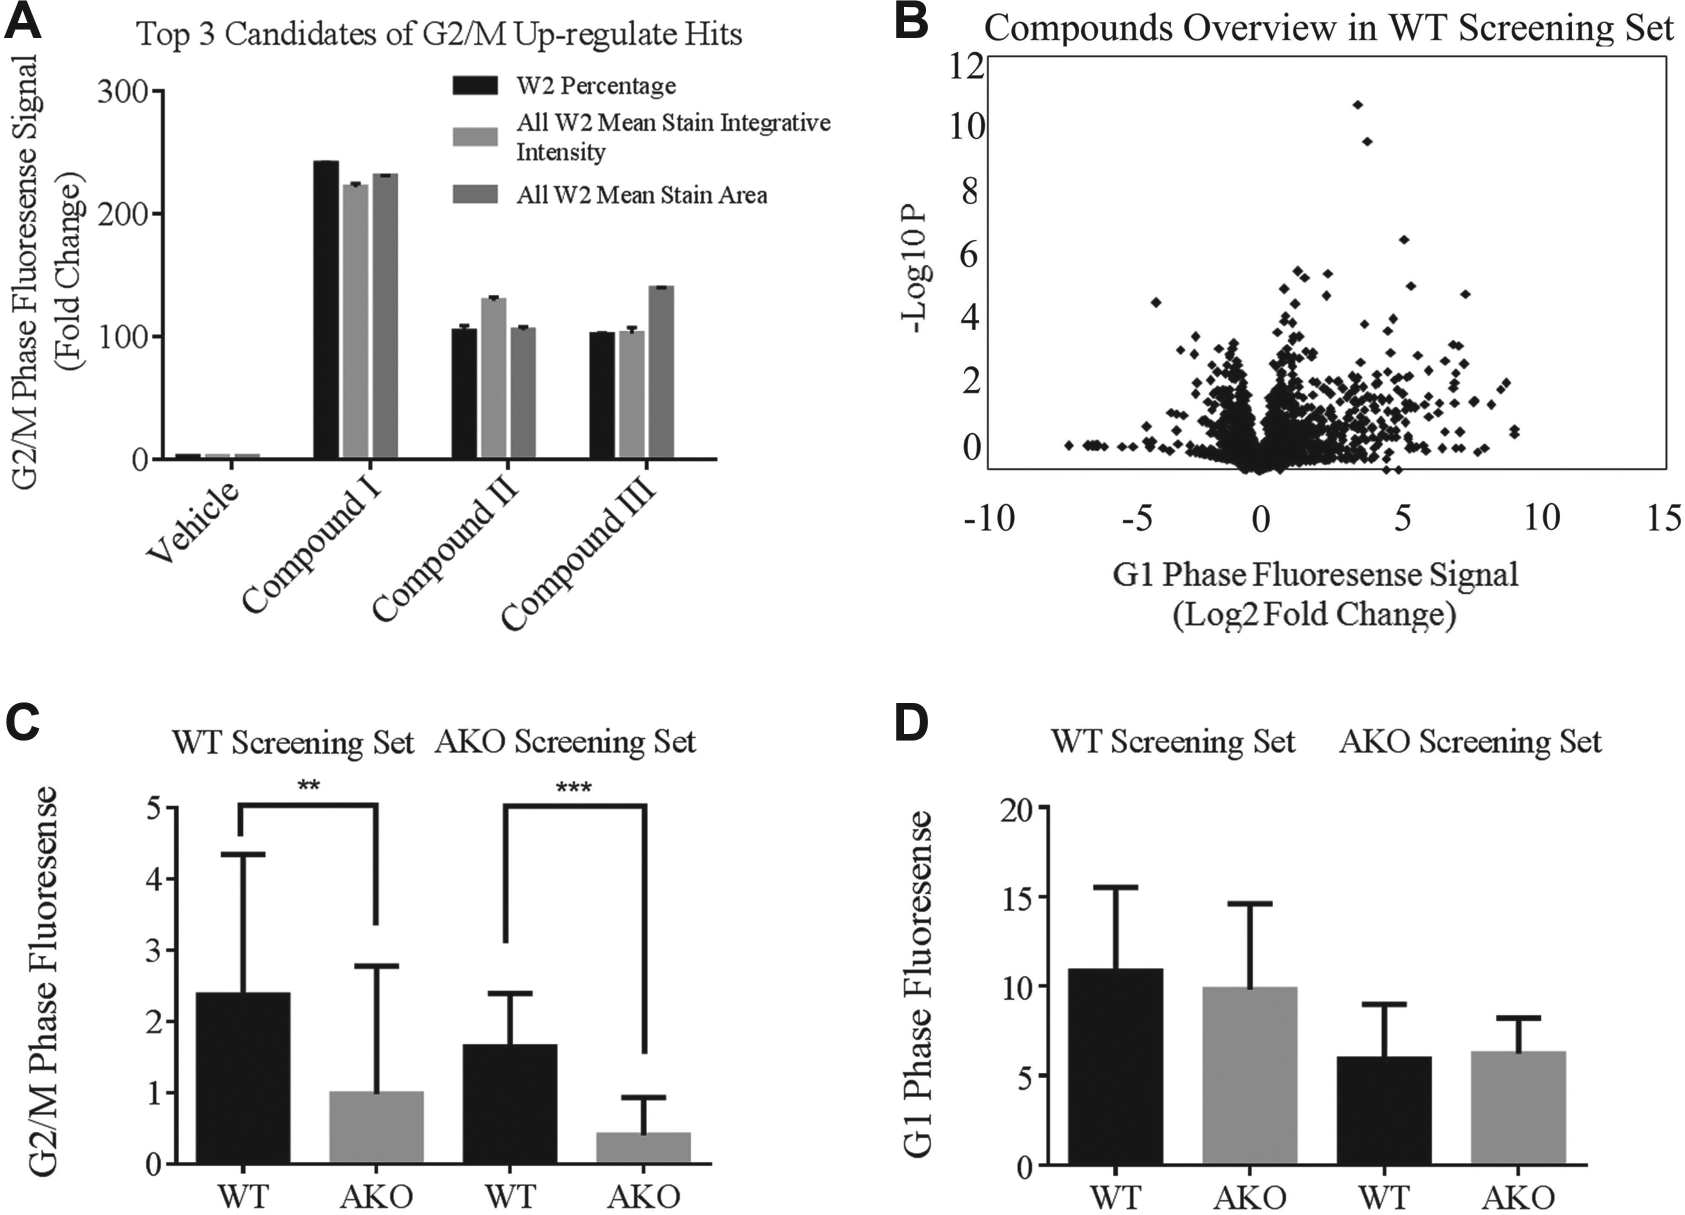
The effect of each chemical compound on cell cycle transition in HCT116 WT cells was calculated as a fold change compared with the vehicle control. The cutoff for selecting primary hits was set as a fold change greater than the value of the mean + 3 SD, which is considered as a stringent selection criterion on the basis of the results of previous studies.29,30 The parameters we used for G2/M (W2) phase and G1 phase (W3) signals were calculated using percentage positive W2/W3, all W2/W3 mean stain integrated intensities, and all W2/W3 mean stain areas. Our data showed that the candidate hits had a consistent change in all three parameters, indicating that the parameters were interconnected and related ( Fig. 2A ). Thus, we chose percentage positive W2/W3 as the major parameter for each fluorescent channel to calculate the modulatory effect of our compounds in the screenings on cell cycle transition. As shown in the volcano plot ( Fig. 2B ), the p value indicating the statistical significance of the differences between each compound and the vehicle control as well as the fold change of each chemical compound with to the vehicle control are the major parameters that determine the positive hit selection.
(
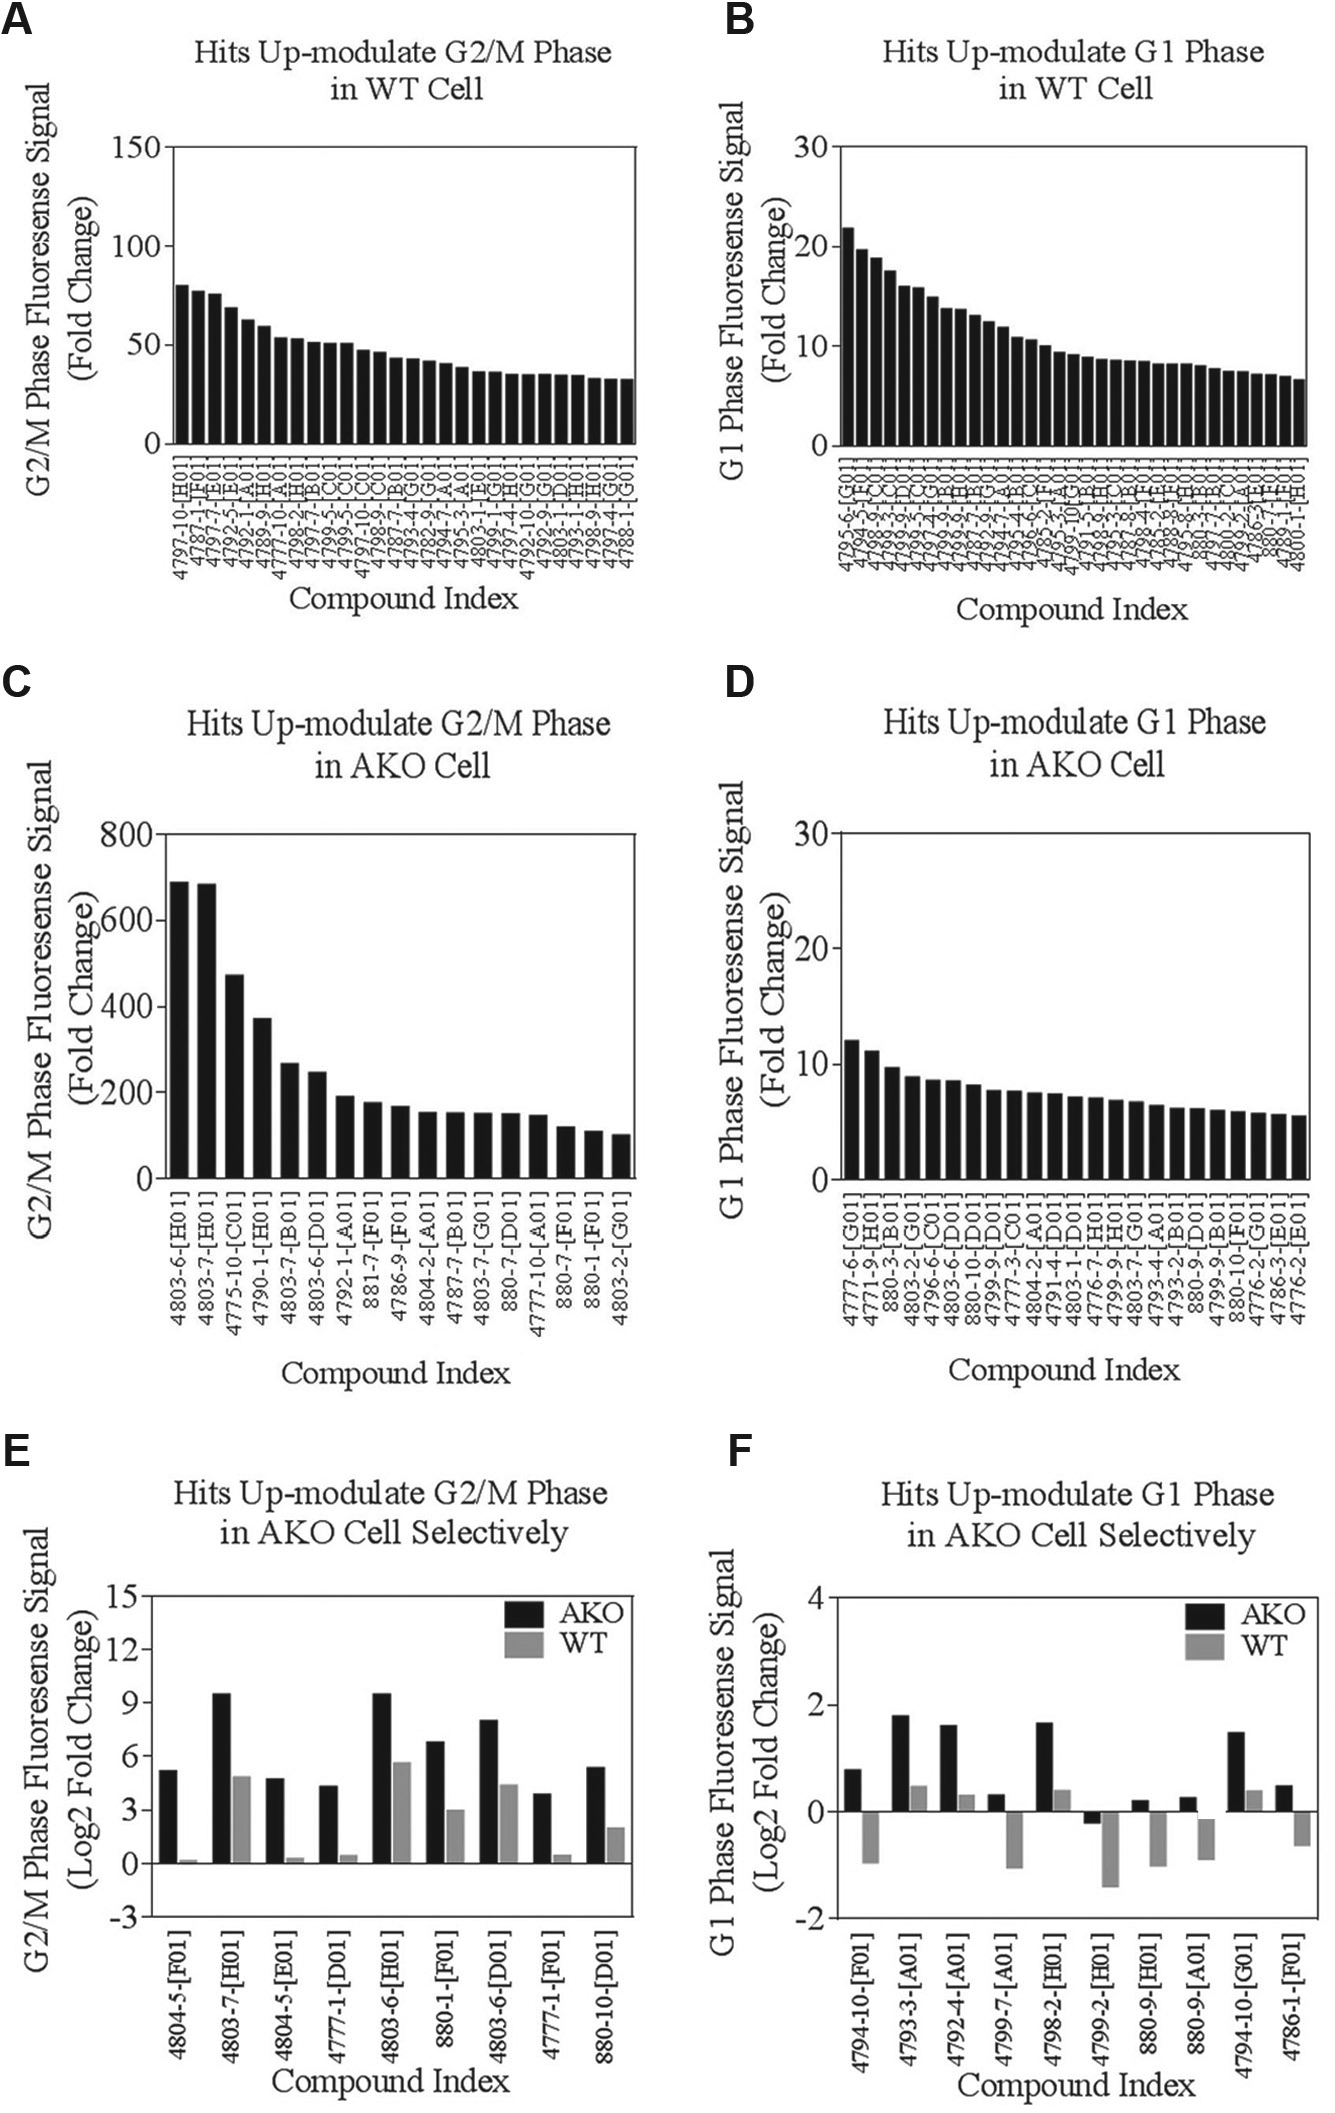
W2 indicates cells in the G2/M phase. Representative data on W2 fluorescent signals from the top candidate compounds are shown in Figure 3A . Twenty-eight of the 2643 chemicals we screened had values of fold change larger than the mean + 3 SD without remarkable cytotoxic effects. W3 indicates cells in the G1 phase. Thirty-three compounds had values of fold change from W3 fluorescent signals larger than the mean + 3 SD ( Fig. 3B ).Interestingly, when we compared the hits we identified using W2% and W3% parameters, we found that six candidates overlapped in the W2% and W3% sets ( Fig. 3A , B ). It is likely that these compounds cause activation of both G1 and G2/M cell cycle checkpoints and led to the accumulation of G1 and G2/M cells.
(
Selection of Hits from Cell Cycle Modulators Identified from AKO Cells
We used the same method described above for cell cycle modulator hit selection in the WT screening set to identify hits in the AKO screening set. The primary readout was calculated as a fold change compared with the vehicle control. The cutoff for selecting primary hits was also set as a fold change > mean + 3 SD relative to the vehicle control. For W2 indicating cells in the G2/M phase, 17 of 2643 chemicals screened led to a fold change of W2% larger than the mean + 3 SD ( Fig. 3C ). For W3 indicating cells in the G1 phase, 23 led to a fold change of W3% larger than the mean + 3 SD ( Fig. 3D ). We excluded chemicals that induced a 50% and greater reduction in total cell counts, considering them cytotoxic.
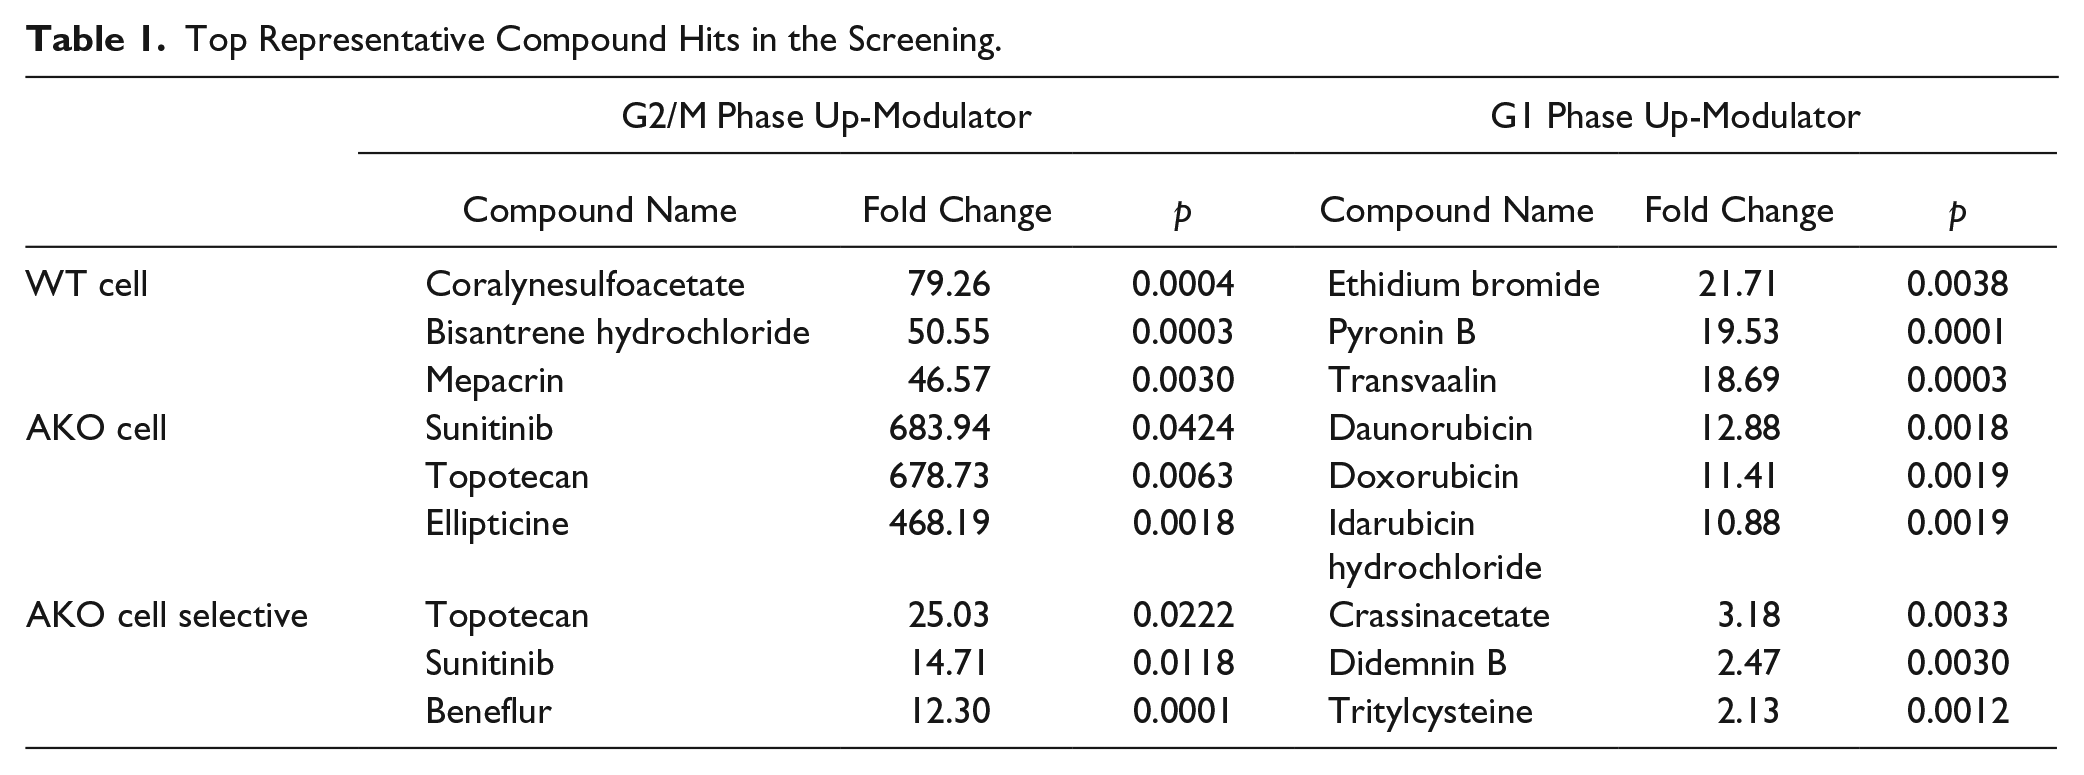
One of the advantages of our comparative screening approach in WT and mutant cells is that it enables us to identify the positive modulators that can selectively or more significantly up-modulate the G2/M or G1 phase in AKO cells but not in WT cells. To achieve this goal, we calculated the final readout as the fold change between AKO cells and WT cells. The cutoff for selecting hits was also set as the fold change > mean + 3 SD. In this measurement, for the fluorescence signal acquired by W2 (indicating cells in the G2/M phase), 9 of the 2643 chemicals led to a fold change of W2% larger than mean + 3 SD ( Fig. 3E ). For the fluorescence signal acquired by W3 (indicating cells in the G1 phase), 10 chemicals led to a fold change of W3% larger than mean + 3 SD ( Fig. 3F ). In summary, as shown in Table 1 , we identified six compounds as potential selective modulators of cell cycle in ARID1A-deficient cancer cells.
Top Representative Compound Hits in the Screening.
In each plate, we treated two different cell lines with vehicle control to compare W2% in two screening sets of WT and AKO cells. Interestingly, we found that in the WT cell screening set, the basal level of W2% (G2/M phase) in vehicle wells was lower in AKO cells than in WT cells. The result is similar in the AKO cell screening set. There was no significant difference in the basal level of W3% (G1 phase) between the WT and AKO screening sets ( Fig. 2C , D ). The basal level of W2%, indicating the G2/M phase, was lower in AKO cells than in WT cells without the addition of any compound treatment. This result indicates that ARID1A deficiency leads to impaired G2/M checkpoint initiation and maintenance, which is consistent with our previous finding. 2 It also demonstrated that our screening will be valuable in the development of a functional assay for exploring cell cycle modulation in multiple cell lines of different genetic backgrounds.
Hit Validation in a Secondary Screening
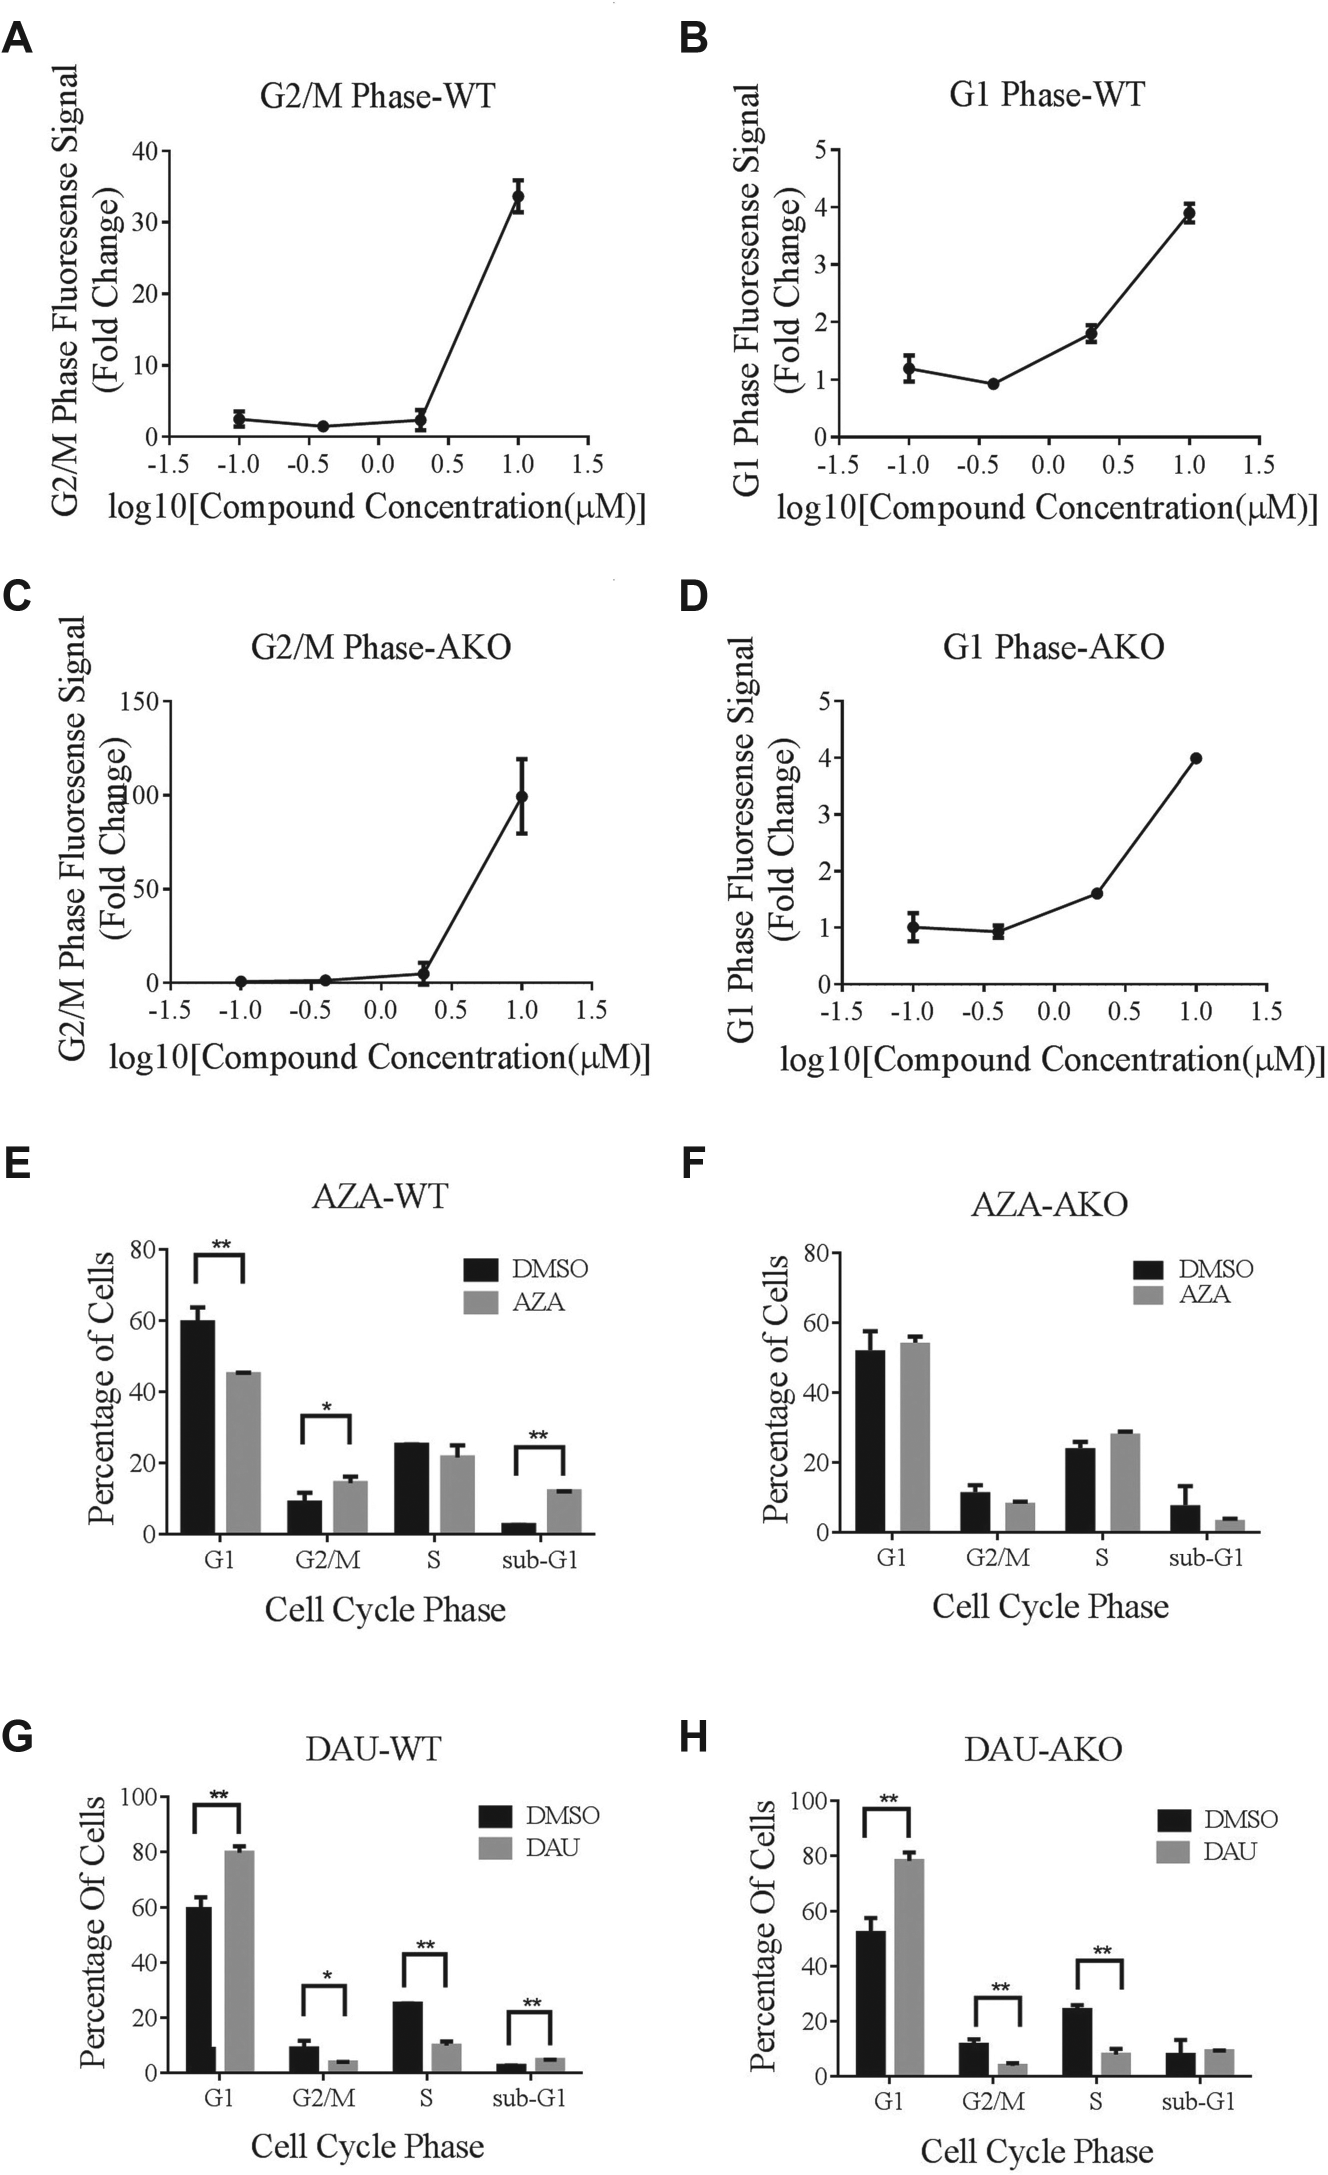
We performed a secondary screening to validate the compound hits ( Fig. 1B ). As shown in Figure 4 , the effect of compound I on cell cycle transition was dosage dependent, as the concentration ranged from 0 to 10 µM. The value of the parameters, such as percentage positive W2 and percentage positive W3, increased dramatically at the effective concentration of 10 µM and increased slightly at the concentrations of 0.4 µM and 2 µM in both WT ( Fig. 4A , B ) and AKO cells ( Fig. 4C , D ). All of the identified positive modulators were included in the validation screening to confirm the final results.
(
Final Validation Using Cell Cycle Flow Cytometry Assay
We selected two compounds, azacitidine and daunorubicin, as the representative hits from Figure 3 and performed flow cytometry assays to confirm the results of our initial primary and secondary screenings. As expected, these compounds demonstrated significant modulation of cell cycle phase alterations in cell cycle transition, which was consistent with the observations from our primary screening. We analyzed them in both HCT116 WT and AKO cells. The working concentration was then adjusted to 10 µM (azacitidine; Fig. 4E , F ) and 1 µM (daunorubicin; Fig. 4G , H ). The FUCCI marker-labeled cells exhibited red and cyan fluorescence. Thus, we used DAPI staining instead of propidium iodide staining to eliminate the interference caused by the autofluorescence of FUCCI cells. Our results demonstrated that the overall effects of cell cycle modulation caused by these two hits were consistent with our screening data, providing an independent confirmation of our screening results.
Azacitidine, a chemical analogue of cytidine, is a nucleoside that is present in DNA and RNA. It is an inhibitor of DNA methyltransferase and is used clinically in the treatment of myelodysplastic syndrome. As a ribonucleoside, its incorporation into RNA leads to the disassembly of polyribosomes and defective methylation. Its incorporation into DNA leads to covalent binding with DNA methyltransferases, which impairs DNA synthesis and cell cycle progression. 31 The molecular mechanisms underlying the biological function of azacitidine may explain why it was identified as one of the top hits on our screenings.
Another hit, daunorubicin, is a member of the anthracycline family that is used as an anticancer treatment in patients with certain types of leukemia. Similar to doxorubicin, daunorubicin interacts with DNA by intercalation, inhibits the progression of the enzyme topoisomerase II, and thus stops the process of DNA replication in the S phase. 32 In our imaging-based screening assay and cell cycle flow cytometry assay, daunorubicin was potent at inducing G2/M phase arrest, which is in accordance with its mechanism of action.
Validation of Topotecan as ARID1A Deficiency Target Hit
As shown in Table 1 , one of the active compounds inducing a G2/M accumulation is topotecan, which is a topoisomerase-I inhibitor used as a chemotherapeutic agent to treat ovarian cancer, lung cancer, and other cancers. Topoisomerase-I is a nuclear enzyme creating a single-strand break. Topotecan intercalates with the cleavage complex of topoisomerase-I and traps it in the cleavage complex bound to the DNA. When DNA damage occurs, the double-strand breaks cannot be repaired efficiently because of the accumulation of trapped topoisomerase-I complexes and thereby lead to cell death. 33
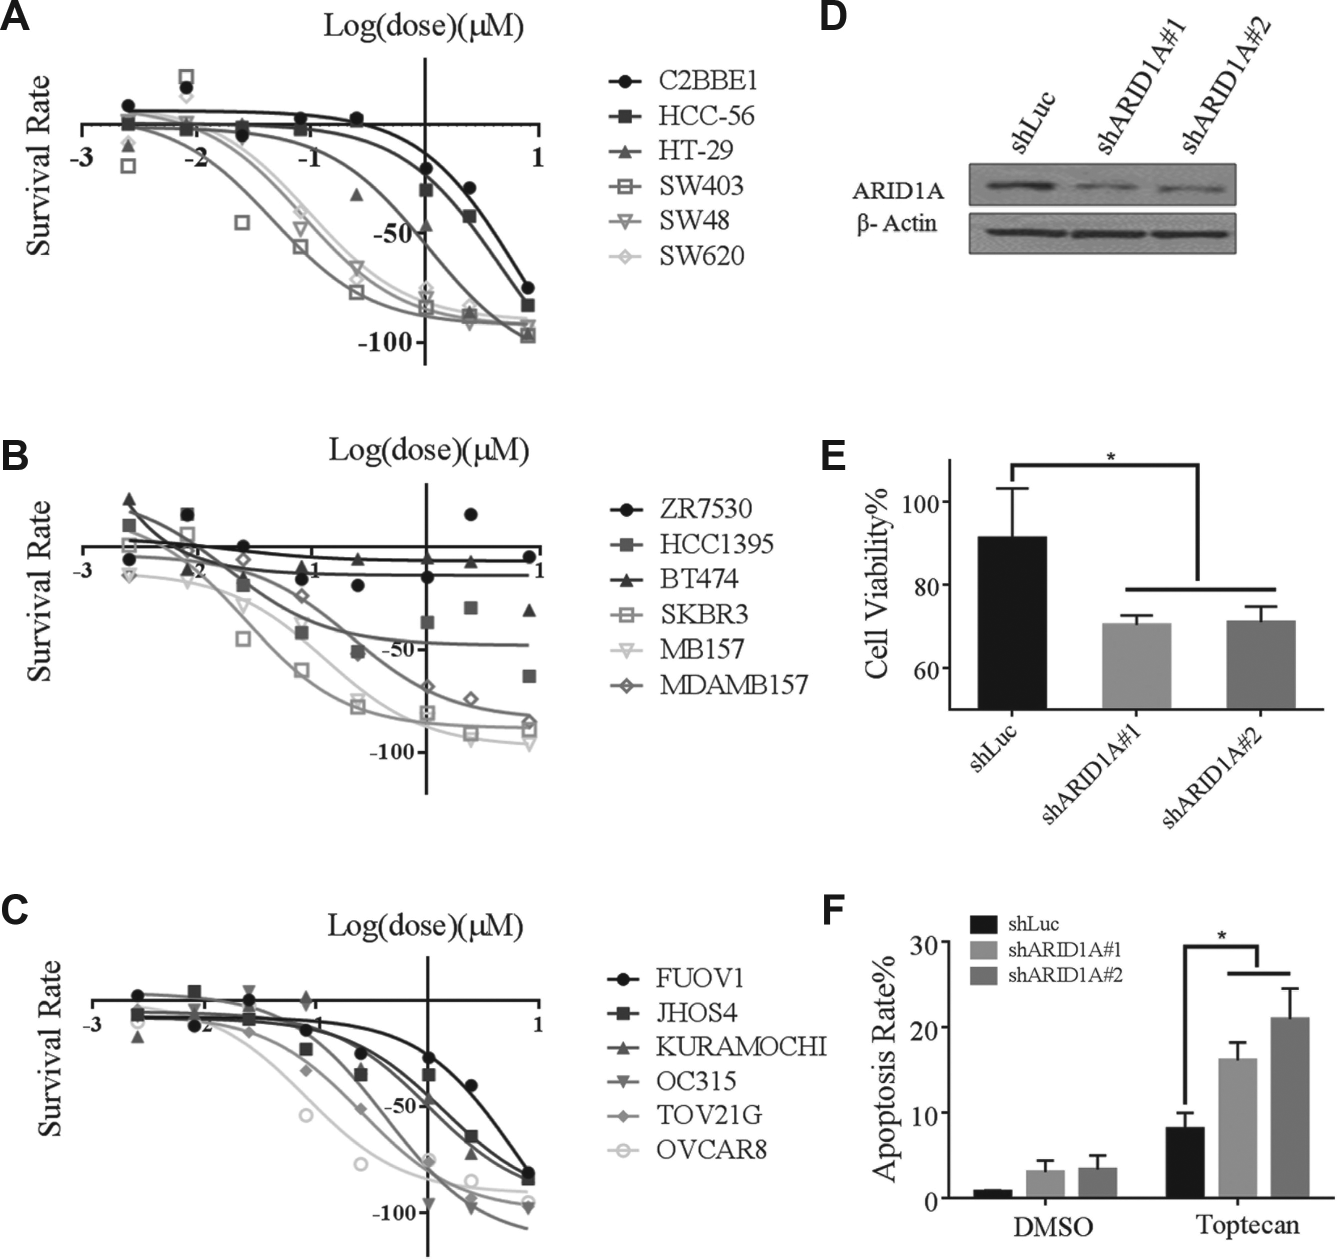
To confirm the effect of topotecanon targeting ARID1A deficiency, we first analyzed the Cancer Cell Line Encyclopedia database. 34 In three cancer types, including colon, breast, and ovarian cancers, we found that cancer cells with reduced ARID1A expression showed an increased sensitivity to topotecan treatment ( Fig. 5A–C ). These results were consistent with the result from our AKO screening that topotecan may be used to selectively target ARID1A-deficient tumors.
(
Next, we depleted ARID1A in a gastric cancer AGS cell line to confirm the effect of topotecan. ARID1A knockdown efficiency was validated by Western blotting in these cells ( Fig. 5D ). At the concentration of 0.1 µM, topotecan treatment significantly inhibited cell growth in ARID1A-deficient cells compared with the control cells ( Fig. 5E ). We further examined apoptosis in these cells after topotecan treatment. We found ARID1A-depleted AGS cells showed a significantly higher percentage of apoptotic cells than that in control AGS cells. Collectively, these data suggest that topotecan can selectively target ARID1A-depleted cancer cells ( Fig. 5F ).
Discussion
The goals of our study were to develop an image-based high-throughput assay and use it to identify the cell cycle modulators that selectively target ARID1A-deficient tumors. We developed this high-throughput assay protocol using the FUCCI sensor-labeled HCT116 WT and AKO cell lines generated for our study.
In recent years, FUCCI cells have been widely used for visualizing cell cycle distribution in live cells, facilitating our understanding of the molecular requirements for cell cycle modulation. Since the development of FUCCI cells in 2008, the FUCCI system has been adapted to several model systems, making this technology available for diverse biological studies.26–28 A great advantage of the FUCCI sensor is that it provides a living cell sensor, enabling high-throughput screenings in both in vitro and in vivo experiments.
The first FUCCI cell-based drug assay was conducted in 2011. 28 The authors developed a FUCCI cell-based assay in different cell lines and visualized drug-induced cell cycle modulation in a time-lapsed manner; this was the first report to integrate the complexity of cell cycle modulation into drug discovery. Their success demonstrated that this assay represents a new drug discovery tool for identifying cell cycle modulators. Another research group quantified the cell cycle effects of three anticancer drugs in FUCCI cell xenografts in a mouse model. 35 However, there have been no FUCCI cell-based high-content drug screenings of genotype-specific cell cycle modulators. To this end, we generated new cell lines using FUCCI technology and developed a high-content screening system to identify the cell cycle modulators that selectively target ARID1A-deficient cancer cells.
Using FUCCI cell lines, we can recognize cells in different cell cycle phases through two different channels of a fluorescent microscope. A unique aspect of our assay is that we were able to transform high-quality cell images to the fast and accurate multiple-wavelength scoring system, with DAPI scoring representing total cell counts for cytotoxic evaluation, W2 and W3 wavelength percentages, W2 and W3 mean integrated intensities, and the mean stain areas for the cell subpopulation (G2/M and G1) evaluation. Moreover, we conducted high-content analyses by visualizing cell cycle subpopulations within FUCCI cells. The parameters of the W2 and W3 percentages were feasible for the cell subpopulation evaluation. The W2 and W3 mean stain integrated intensities and mean stain areas were consistent with the changes in the parameters of the W2 and W3 percentages, which can be used as alternative measurements. Therefore, FUCCI technology provides an accurate alternative solution for studying cell cycle distribution. Compared with the gold standard, cell cycle flow cytometry, this method can be used to analyze living cells in a high-content format with higher efficiency and a lower cost.
To identify cell cycle modulation hits in living cells, two research groups used different methods. One group stained the cells with Vybrant DyeCycle Green and scanned the plates with an fluorescence cytometer to generate a cell cycle histogram profile for each well. 36 The hits rates of this assay were G1 (0.086%), S (0.185%), G2 (0.009%), and M (0.333%). Another group used an image-based cell cycle analysis, which was combined with Cell Cycle Chromobody technology and the CytoTox-Glo cytotoxicity assay. 37 Our hit rates were similar to these previously used assays, and the parameters of our FUCCI screening system were much easier to quantitate. In our assay, cytotoxicity was readily measured by quantitative parameters, which allowed us to set up thresholds tailored to each individual screening setting.
In our screening, we seeded cells and dispensed compounds into micro-clear 96-well plates simultaneously using our automation system, which enabled consistent treatment conditions for all tested compounds. Cells were exposed to the drug treatment under the same conditions. The compounds were tested at a final concentration of 10 µM to allow screening efficiency. However, a single concentration used in the primary screening led to cytotoxic effects of potent compounds, which had an effective dosage range far below that of our work concentration. Thus, a positive compound may be excluded from the top hits as cytotoxic because of a significant reduction in cell survival. To resolve this issue, we defined the cell count cutoff as less than 50% inhibition of cell survival.
In future studies, a multiple-drug concentration screening might increase the positive rate. Nevertheless, in our study, we screened 2643 library compounds in two HCT116 FUCCI cell lines (WT and AKO) and identified positive hits that increased the number of cells in the G2/M or G1 phase. More important, we also identified positive hits that increased the number of cells in the G2/M or G1 phase selectively in AKO cells. The positive hits were validated using a secondary confirmatory assay in a dosage-dependent manner and a cell cycle flow cytometry assay. We further confirmed the selective targeting ARID1A deficiency by topotecan. Consistent with this finding, there was an inverse correlation between ARID1A expression and topotecan sensitivity identified in multiple cancer cell lines from the Cancer Cell Line Encyclopedia database. Our results demonstrated that FUCCI cell-based high-content drug screening is useful for identifying selective cell cycle modulators in cancer cells with specific genetic alterations.
We studied WT and ARID1A-deficient cancer cells because a recent study by our research group showed that ARID1A deficiency leads to impaired G2/M checkpoint initiation and maintenance. 2 Interestingly, we found that in ARID1A-deficient cells, the basal level of W2% was lower than that in WT cells without compound treatment. This result shows that AKO cells have a lower G2/M phase percentage than do WT cells at the basal level, which is in accordance with the findings of our previous study. This finding also provides strong experimental support that our assay is robust and functional and can be used not only in ARID1A-deficient cell lines but also in many other cell lines with specific genetic alterations, leading to selectively targeted cell cycle modulation.
For the positive hits we identified in WT HCT116 cells, the G2/M phase up-modulators could be used as sensitizers for radiotherapy or chemotherapy. The G1 phase up-modulators could be used for single-cell proliferation inhibitors. More important, we identified chemical modulators, which have a selective effect on ARID1A-deficient cells but not on WT cells. These compounds will have great potential as targeted therapeutics for ARID1A-deficient tumors in the near future. Therefore, we will perform further in vivo and in vitro experiments to validate the biologic effects of these hits on both ARID1A-proficient and -deficient cells in different cell models and animal models, such as those of ovarian, gastric, and pancreatic cancer. We will also explore the underlying mechanisms of compounds that selectively target ARID1A-deficient cancer cells in our future studies. Because ARID1A has been identified as one of the most frequently mutated genes in the Cancer Genome Atlas databases, we believe that the results of our study will have a broad clinical impact on many cancer types. It is our hope that the compounds we have identified will contribute to the development of novel anti-cancer treatments for patients with ARID1A-mutant tumors, which will be tested in clinical trials in the near future.
Footnotes
Acknowledgements
We thank the National Cancer Institute/Development and Therapeutic Program (NCI/DTP) for providing the chemical screening compound plates.
Declaration of Conflicting Interests
The authors declared no potential conflicts of interest with respect to the research, authorship, and/or publication of this article.
Funding
The authors disclosed receipt of the following financial support for the research, authorship, and/or publication of this article: This research was supported by grants from the National Science Foundation of China (No. 81372852 and No. 81572961), The University of Texas MD Anderson Cancer Center Support grant CA016672, Department of Defense grant OC140431, and NCI grant CA181663 to G.P. and a grant from The University of Texas MD Anderson Cancer Center Duncan Family Institute for Cancer Prevention and Risk Assessment to I.P.U.
Supplementary material is available online with this article.
References
Supplementary Material
Please find the following supplemental material available below.
For Open Access articles published under a Creative Commons License, all supplemental material carries the same license as the article it is associated with.
For non-Open Access articles published, all supplemental material carries a non-exclusive license, and permission requests for re-use of supplemental material or any part of supplemental material shall be sent directly to the copyright owner as specified in the copyright notice associated with the article.