
Abstract
Induction of the cytochrome P450 (CYP) family of enzymes by coadministered compounds can result in drug-drug interactions, as in the case of the coadministration of rifampicin with many CYP3A substrates, including midazolam. Identification of potential drug-drug interactions due to CYP induction during drug discovery is critical. We present a substrate cocktail method that was applied to assess the induction of CYP1A, CYP2B6, CYP2C9, and CYP3A using a 96-well high-throughput format. Viable cell counts were determined using a high-content screening system to normalize activities. Substrate cocktail incubations demonstrated a similar fold induction for known inducers as compared with discrete probe incubations. The system was further validated by determining the induction potency of rifampicin. The Emax and EC50 values in two separate lots of hepatocytes for CYP3A induction by rifampicin in a 96-well format were similar when discrete probe was compared with the probe cocktail. This system has been demonstrated to be suitable for high-throughput assessments of CYP induction.
Introduction
The importance of the CYP family of enzymes in drug disposition and safety is well documented. The CYP family of enzymes is estimated to be responsible for greater than 75% of the known metabolism of therapeutic agents, and alteration of CYP activity can have a significant influence on the disposition of pharmaceutical agents used today, resulting in undesirable effects. 1
CYP activities can be altered by inducing the expression of a CYP and its reaction cycle partners, including P450 reductase.2,3 This increase in expression may result in an increase of CYP activity, which can lead to increasing metabolite(s) levels and could be potentially toxic. Many clinically relevant examples of the CYP induction phenomena exist such as the induction of CYP1A by tobacco smoke inhalation and CYP3A by carbamazepine and rifampicin.4,5
CYP induction is usually the result of signaling through nuclear receptors that are capable of binding to the xenobiotic response elements (XREs) located in the gene locus of the respective CYP.2,6 Four of the important nuclear receptors are the aryl hydrocarbon receptor (AhR), pregnane X receptor (PXR), retinoid X receptor (RXR), and constitutive androstane receptor (CAR).2,7 PXR, RXR, and CAR usually function as heterodimer partners with other nuclear receptors by binding of a ligand and then binding to XREs in the gene locus of an inducible CYP. Cytochromes P450 2B6, 2C9, 3A4, and 3A5 all contain XREs for these three receptors and, therefore, can be induced through their signaling.2,6 There is some purported preference for these receptors due to gene locus content of the respective XREs, such as CAR with CYP2B6 and PXR with CYP3A, but the individual responses may vary significantly. 8
The potential induction of CYPs can be assessed in multiple ways, including activity, mRNA analysis such as quantitative polymerase chain reaction (qPCR), and protein analysis such as enzyme-linked immunosorbent assay (ELISA) or Western blotting. 9 The measurement of mRNA allows for several forms to be analyzed simultaneously, but the increase in mRNA does not proportionally increase the functional CYP content. Factors, such as the translation efficiency of apo-protein from mRNA and posttranslational modifications, limit the direct correlation of increased mRNA content to increased CYP activity. However, it can serve to avoid potential false-negative results with regard to induction signal transduction experienced by other approaches. 10 Protein analysis is limited by the availability of highly selective antibodies for closely related CYP forms. Direct correlation to activity could also be hindered by factors such as heme incorporation and compound inhibition or inactivation. 11 Since it demonstrates the end result of the change in CYP activity, activity measurement is usually more desirable. Members of the CYP enzyme family tend to have overlapping substrate specificities, but selective probes, which are critical for accurate measurement, are well described in the literature. 12
In this study, we measured the activities of CYP forms using probes individually or as a cocktail in 24-well plated and 96-well plated hepatocytes to show the feasibility of a substrate cocktail approach in the analysis of CYP1A, CYP2B6, CYP2C9, and CYP3A. This approach has been used in other studies as well.13–15 However, we also coupled the assessment of the viable cell count using a Cellomics (Pittsburgh, PA) instrument for normalization of enzyme activity and detection of possible cytotoxicity, and we investigated induction of unintended CYP forms by prototypical inducers to ensure the results were not an artifact of the cocktail probe system.
Materials and Methods
Materials
13C2-,15N-Acetaminophen, 2H6-hydroxybupropion, 2H9-hydroxytolbutamide, 13C3-1′-hydroxymidazolam, plateable cryopreserved human hepatocytes, and 24-well collagen I–coated plates were purchased from BD Biosciences (Woburn, MA). Black-walled, clear-bottom, collagen I–coated 96-well plates were purchased from Thermo Scientific (Rochester, NY). Cryopreserved hepatocyte recovery media (CHRM), 4′,6-diamidino-2-phenylindole (DAPI), William’s E media, and plating and maintenance media supplements were purchased from Invitrogen (Carlsbad, CA). Dulbecco’s modified Eagle’s media (DMEM), Dulbecco’s phosphate buffered saline (DPBS), fetal bovine serum (FBS), penicillin/streptomycin/glutamine, and minimal essential medium (MEM) nonessential amino acids were purchased from Mediatech (Manassas, VA). Acetaminophen, carbamazepine, clozapine, coumestrol, (±)-ibuprofen, ketoconazole, lovastatin, metoprolol, β-naphthoflavone, phenacetin, phenobarbital, phenytoin, rifampicin, and tolbutamide were purchased from Sigma Aldrich (St. Louis, MO). Bupropion, dextromethorphan, dextrorphan, 2H3-dextrorphan, hydroxybupropion, hydroxytolbutamide, 1′-hydroxymidazolam, and midazolam were purchased from Toronto Research Chemical (Toronto, Canada). Nevirapine, ritonavir, DL-sulforaphane, and troglitazone were also purchased from commercial sources. All chemicals, reagents, and solvents used in this study were of either analytical or high-performance liquid chromatography (HPLC) grade.
Plating and Treatment of Hepatocytes
Cryopreserved hepatocytes were plated after isolation using CHRM at 375 000 cells/well for 24-well plates or 60 000 cells/well for 96-well plates. For 96-well plates, 50 µL/well of DMEM containing 10% FBS, 1 U/mL penicillin, 1 µg/mL streptomycin, 0.292 mg/mL L-glutamine, and nonessential amino acids was added before 80 µL of plating media from Invitrogen (part # CM3000 and A1217601) containing 0.75 million cells/mL was gently added to the well. Hepatocytes were allowed to attach overnight in an incubator at 37 °C and 5% CO2.
Cells were treated with 500 µL (24-well) or 100 µL (96-well) of maintenance media (Invitrogen, part # CM4000 and A1217601) containing vehicle (0.1% DMSO), β-naphthoflavone (10 µM), phenobarbital (1 mM), or rifampicin (0.32–25 µM). The maintenance medium was refreshed daily during the 48-h treatment.
CYP Activity Assay
After treatment, the maintenance media were replaced by the same volume of DPBS containing either a discrete probe substrate or a probe substrate cocktail. The probe substrates used were 100 µM phenacetin 200 µM bupropion, 200 µM tolbutamide, and 50 µM midazolam for assessments of CYP1A, CYP2B6, CYP2C9, and CYP3A activities, respectively. Midazolam was used at concentrations above Km to avoid depletion of the substrate that would result in possible underestimation of induction. The cells were incubated for 20 min prior to extracting a small amount of the incubation buffer for analysis. The cells were washed with DPBS after the incubation. An equal volume of a 1:1 acetonitrile/methanol solution containing 50 ng/mL of 13C2-,15N-acetaminophen, 2H6-hydroxybupropion, 2H9-hydroxytolbutamide, or 13C3-1′-hydroxymidazolam was added to the incubated DPBS to provide an internal standard for each analyte.
To test the influence of PXR activation on CYP2D6 activity, 20 µM dextromethorphan was used as a probe substrate and incubated for 20 min with treated cells. An equal volume of a 1:1 acetonitrile/methanol solution containing 50 ng/mL of 2H3-dextrorphan was added to the incubated DPBS to provide an internal standard.
The incubated samples were analyzed using a system consisting of an API 4000QTrap (AB Sciex, Foster City, CA) and an HPLC system consisting of two LC-10ADvp series HPLC pumps, a SIL-HTC autosampler, a CTO-10ACvp column oven, and a DGU-14A column oven (Shimadzu, Kyoto, Japan) or consisting of a TripleTOF 5600 (AB Sciex) and an ultra-performance liquid chromatography (UPLC) system consisting of two LC-30AD series UPLC pumps, a SIL-30AC autosampler, a CTO-30A column oven, and a DGU-20A5R column oven (Shimadzu). The column was a Sunfire C18 2.1 × 150–mm, 5-µ column from Waters Corporation (Milford, MA), and mobile phases were (a) 0.02% formic acid in water and (b) 0.02% formic acid in acetonitrile. The binary gradient was the following: 0% B (0–0.5 min), 0% to 99% B (0.5–4 min), 99% B (4–4.5 min), and 0% B (4.6–8 min). A standard curve containing 2 nM to 1 µM of each metabolite of interest was used to quantify the formation of acetaminophen, hydroxybupropion, hydroxytolbutamide, and 1′-hydroxymidazolam to assess the activities of CYP1A, CYP2B6, CYP2C9, and CYP3A, respectively.
Assessment of Cell Viability
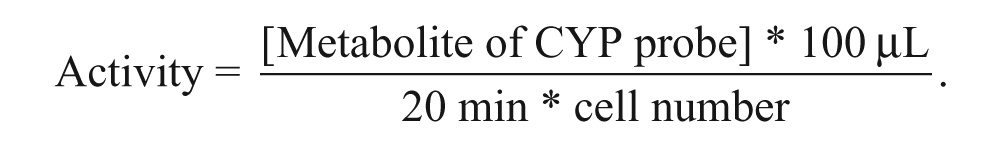
After washing with DPBS, the cells were fixed using 3.7% p-formaldehyde in DPBS for 1 h. The formaldehyde was removed and 0.6 µM DAPI in DPBS was added. The cells were stained by DAPI for 20 min and then washed three times with DPBS. Cells were counted using an ArrayScan II (Cellomics) with a 5× objective lens. This step was performed with only 96-well plates due to the limitations of the ArrayScan II instrument, and the results were used to normalize activities in 96-well plates to a per cell basis by the following equation:
Analysis of mRNA via Quantitative Real-Time PCR
Isolation of mRNA from 24-well plated human hepatocytes was performed using an RNeasy kit from Qiagen (Valencia, CA). Reverse transcription was performed using a SuperScript VILO cDNA Synthesis Kit from Invitrogen (Grand Island, NY) and a DNA Engine thermocycler from Bio-Rad (Hercules, CA). Nuclease-free water was acquired from Invitrogen (Grand Island, NY). Real-time PCR was performed using a 7500 Fast Real Time PCR System and TaqMan Fast Advanced Master Mix from Applied Biosystems (Carlsbad, CA). The assays were performed in duplex or triplex using β-2-microglobulin (B2M) as an endogenous control in the FAM channel and the genes of interest in the VIC channel and NED channel, and the data were assessed via ΔΔCt calculations to determine fold induction. B2M was chosen from a panel of endogenous controls (Applied Biosystems human endogenous control plate, part # 4426700) due to its low variation between vehicle and positive control treatment groups after mRNA content normalization and due to the specificity of the probe and primer set. The following TaqMan probes and primer assay sets from Applied Biosystems were used for these assays in a primer-limited format: Hs00984230_m1 (B2M), Hs00167927_m1 (CYP1A2), Hs04183483_g1 (CYP2B6), HS04260376_m1 (CYP2C9), Hs02576168_g1 (CYP2D6), HS00604506_m1 (CYP3A4), Hs01016332_m1 (P450 oxidoreductase), Hs00609293_g1 (hydroxymethylbilane synthase), and Hs00167441_m1 (aminolevulinate, delta-, synthase 1). Student’s t test was used to determine if a treatment caused any changes as compared with vehicle control.
Results and Discussion
Comparison of Results for Known Inducers with Discrete Probes or Substrate Cocktail
For the substrate cocktail to be suitable for the assessment of CYP induction, the fold induction response to an inducer should match the observed results with a discrete probe. As shown in Tables 1 to 3 , the fold induction for known inducers using lots 246 and 262 are similar among discrete and substrate cocktail incubations. The 96-well activities were normalized by cell number as acquired from a Cellomics instrument, whereas no normalization was performed with 24-well results.
Fold Induction from a 24-well Format with Lot 246
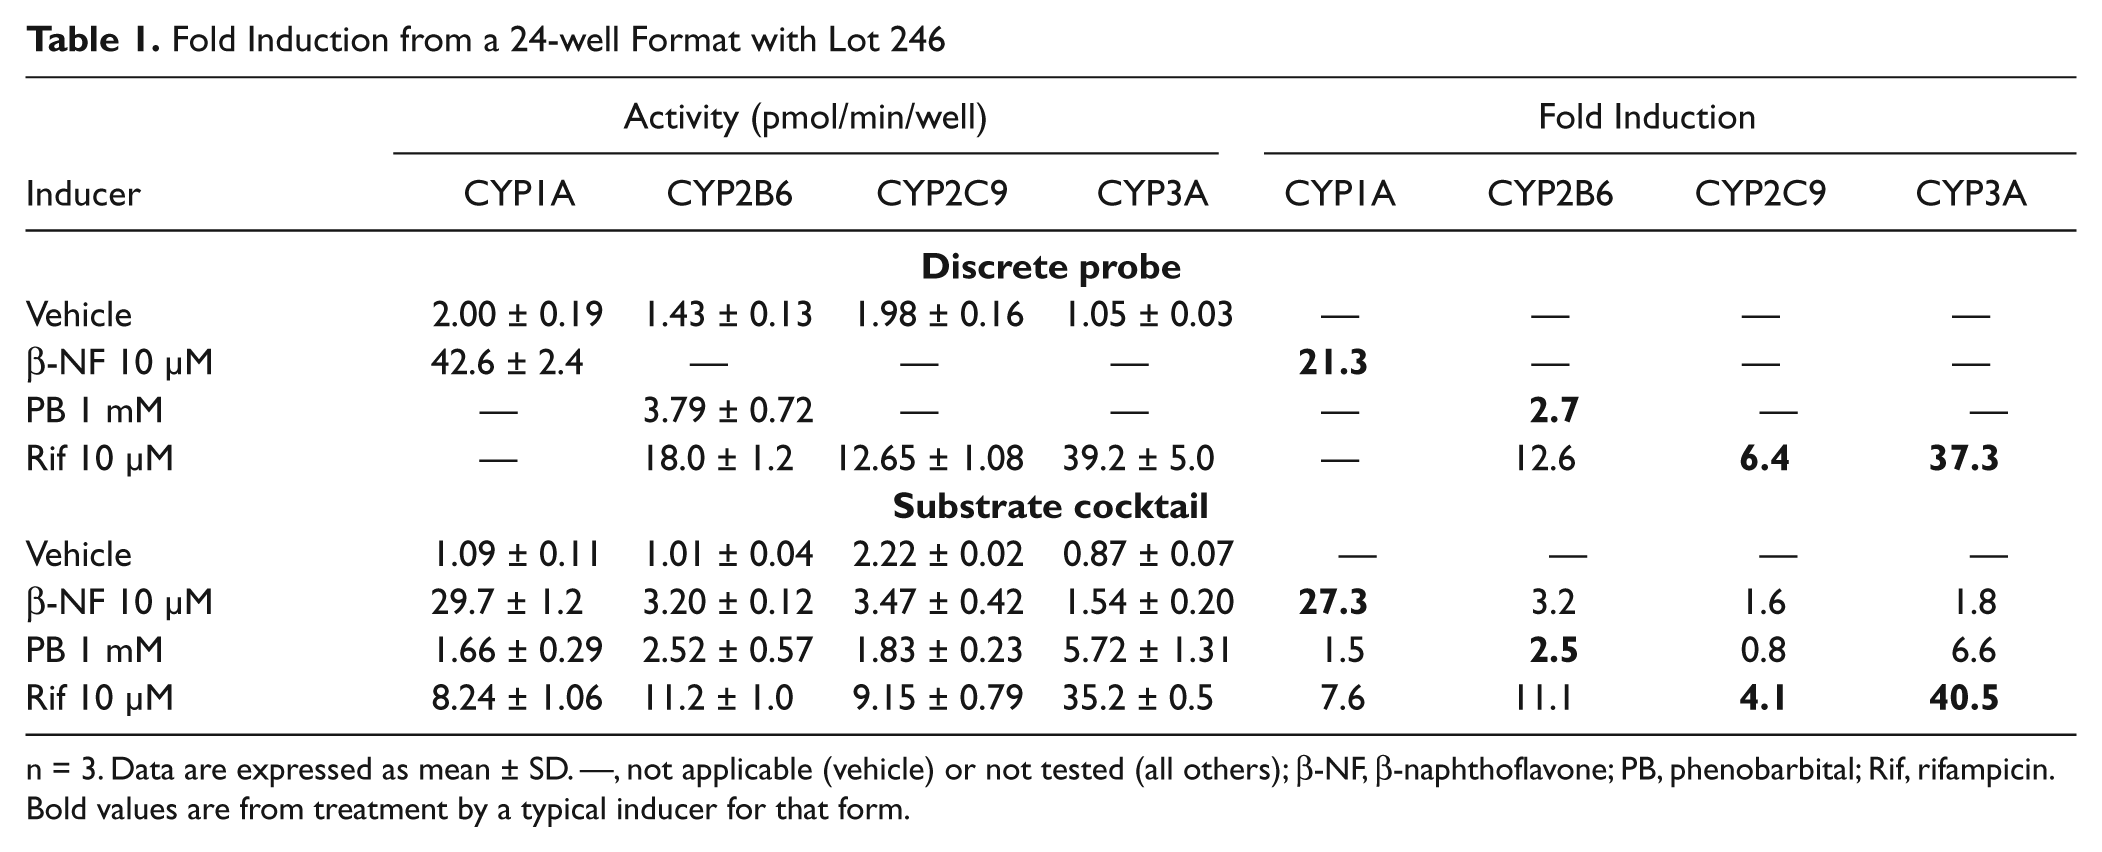
n = 3. Data are expressed as mean ± SD. —, not applicable (vehicle) or not tested (all others); β-NF, β-naphthoflavone; PB, phenobarbital; Rif, rifampicin. Bold values are from treatment by a typical inducer for that form.
Fold Induction from a 96-well Format with Lot 246
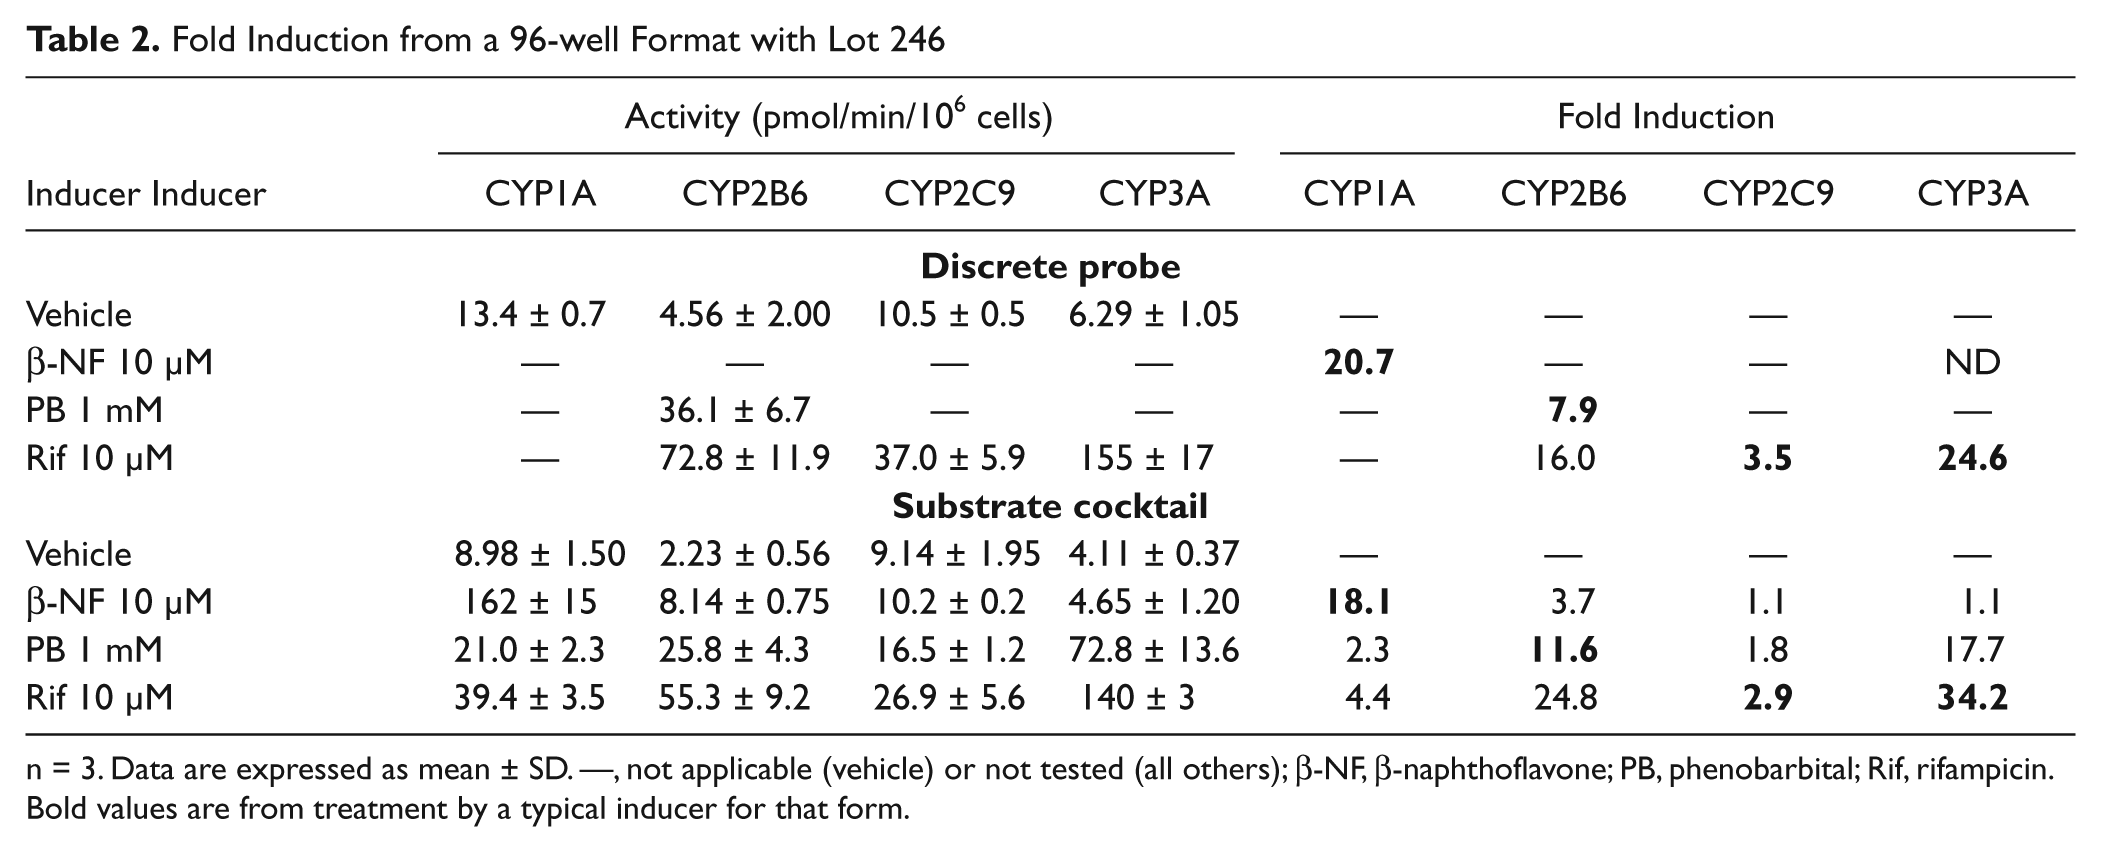
n = 3. Data are expressed as mean ± SD. —, not applicable (vehicle) or not tested (all others); β-NF, β-naphthoflavone; PB, phenobarbital; Rif, rifampicin. Bold values are from treatment by a typical inducer for that form.
Fold Induction from a 96-well Format with Lot 262
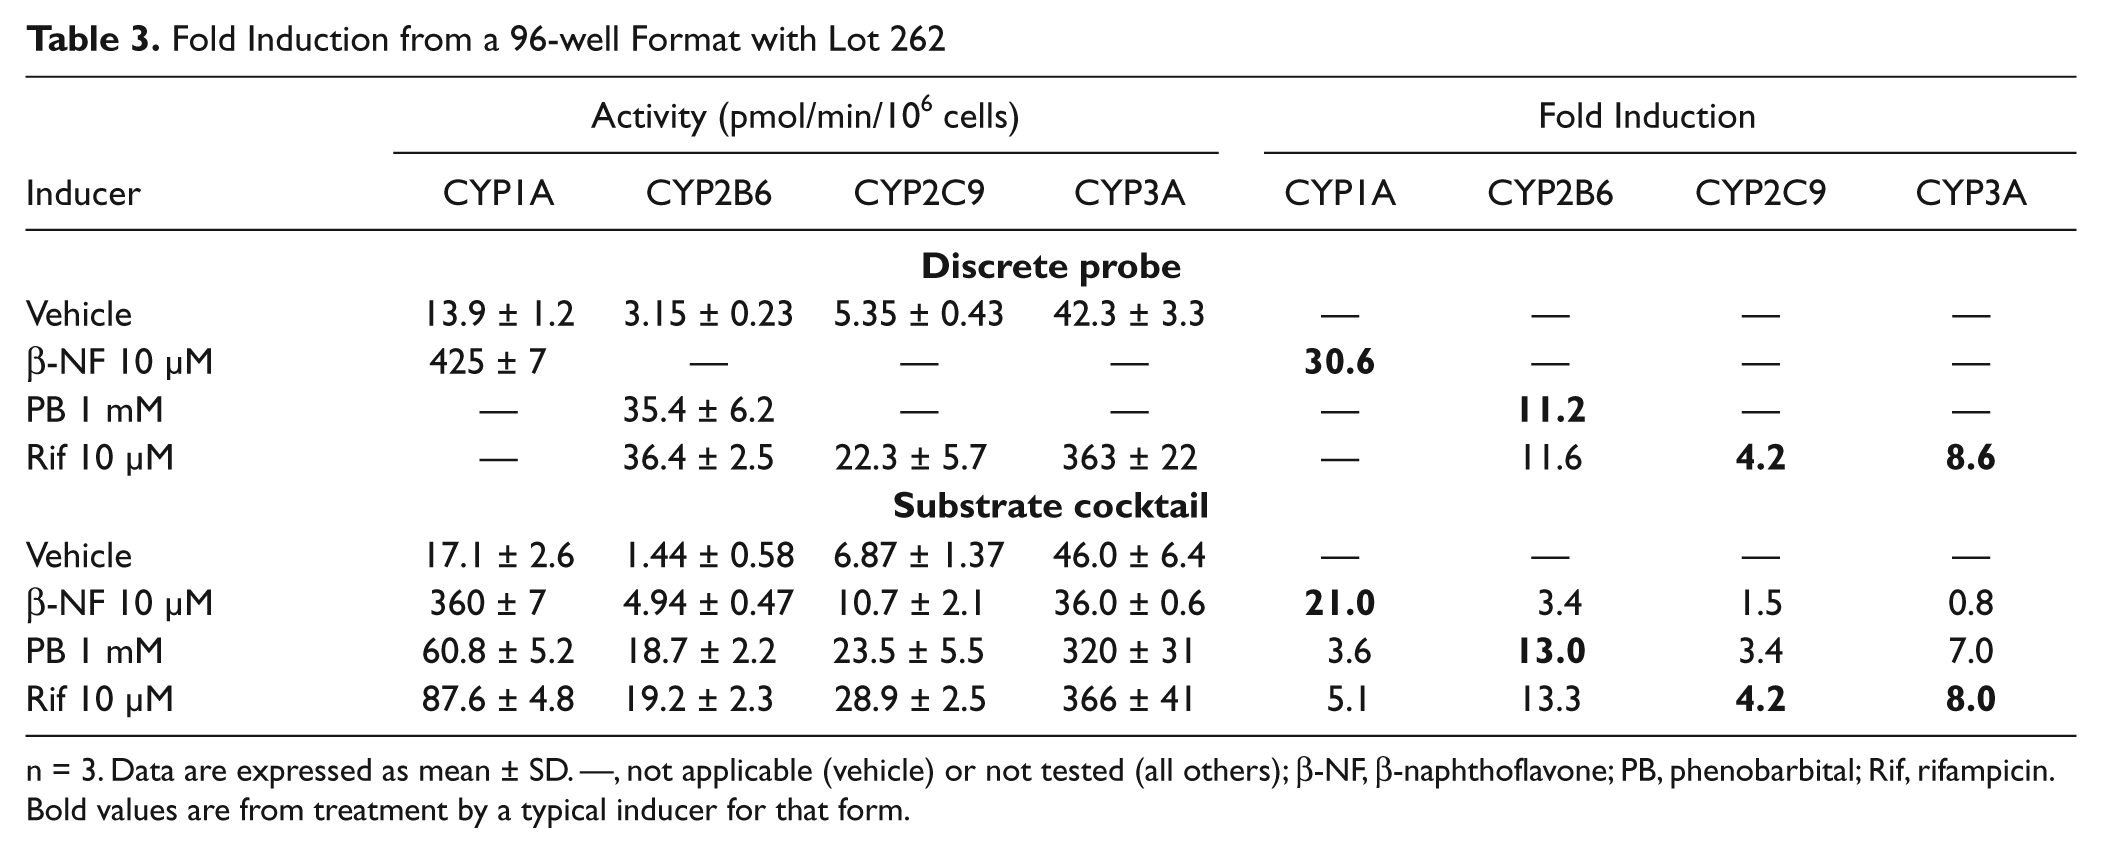
n = 3. Data are expressed as mean ± SD. —, not applicable (vehicle) or not tested (all others); β-NF, β-naphthoflavone; PB, phenobarbital; Rif, rifampicin. Bold values are from treatment by a typical inducer for that form.
For CYP1A, the fold induction after treatment with β-naphthoflavone was not affected by the use of a substrate cocktail. The results from lot 246 ( Tables 1 and 2 ) showed similar results in both 24- and 96-well formats, as well as discrete probes and substrate cocktails. The fold induction after treatment for this lot ranged from 18- to 27-fold. The basal level of activity and induced level of activity for CYP1A appeared to be reduced by 30% to 45% with the use of a substrate cocktail with lot 246. A possible explanation is competition between the CYP forms for limited amounts of P450 reductase. 16 The results obtained from lot 262 ( Table 3 ) appeared to be less affected by the use of the substrate cocktail. The basal activity increased by 23% but was not significant, by Student’s t test, due to the variation evidenced by the standard deviation. The induced activity was reduced by 15%, which was a smaller effect than that shown with lot 246. The CYP1A activity resulting from the use of a substrate cocktail did not alter the fold induction. The CYP1A results from the substrate cocktail suggest indirect induction effects by the known inducers for other CYP forms. Phenobarbital and rifampicin, which are not known to signal through the AhR pathway, increased CYP1A activity in both donors.2,17 Rifampicin increased CYP1A activity up to 7.6-fold. The increase of activity was not as strong as with β-naphthoflavone but was substantial. Since CYP1A mRNA is not known to be increased by treatment with rifampicin, it is likely due to other processes. Induction of P450 oxidoreductase or other factors involved in the regulation of CYP activity by the PXR and CAR pathways may explain this phenomenon.3,18 These data suggest a mechanism for disconnection between mRNA levels and enzyme activity for the induction of a CYP form.
For CYP2B6, the fold induction also did not appear to be affected by the use of a substrate cocktail. The reduction of measured basal and induced CYP2B6 activities using a substrate cocktail was consistent between the two donors and was consistent in affecting both the negative control and positive control to a similar extent. The basal and induced activities were affected equally, so fold induction was not affected. With these two donors, rifampicin at 10 µM showed equal or greater potency of CYP2B6 induction as compared with phenobarbital at 1 mM. There is a discrepancy between the 24-well and 96-well format for fold induction of CYP2B6 for lot 246, but the reason is unknown.
As seen with CYP1A, CYP2B6 activity was also increased by an inducer that was not known to affect the signaling pathway that regulates mRNA levels of CYP2B6. Treatment with β-naphthoflavone, an AhR ligand, increased CYP2B6 activity by approximately 3-fold in each condition tested. The reason for this increase is speculated to be similar to that for CYP1A.2,3
To investigate the observed phenomenon of increased phenacetin O-deethylase activity observed with rifampicin and increased bupropion hydroxylase activity observed with β-naphthoflavone, a comparison was done using incubations with phenacetin as a discrete probe, bupropion as a discrete probe, or the substrate cocktail using lot 246. The increase in activity was also observed in discrete probe incubations and, therefore, is not a unique phenomenon of the cocktail probe as shown by Table 4 .
Effect of Rifampicin and β-naphthoflavone on CYP Activity and mRNA Levels of CYP Forms and Genes Involved in CYP Regulation
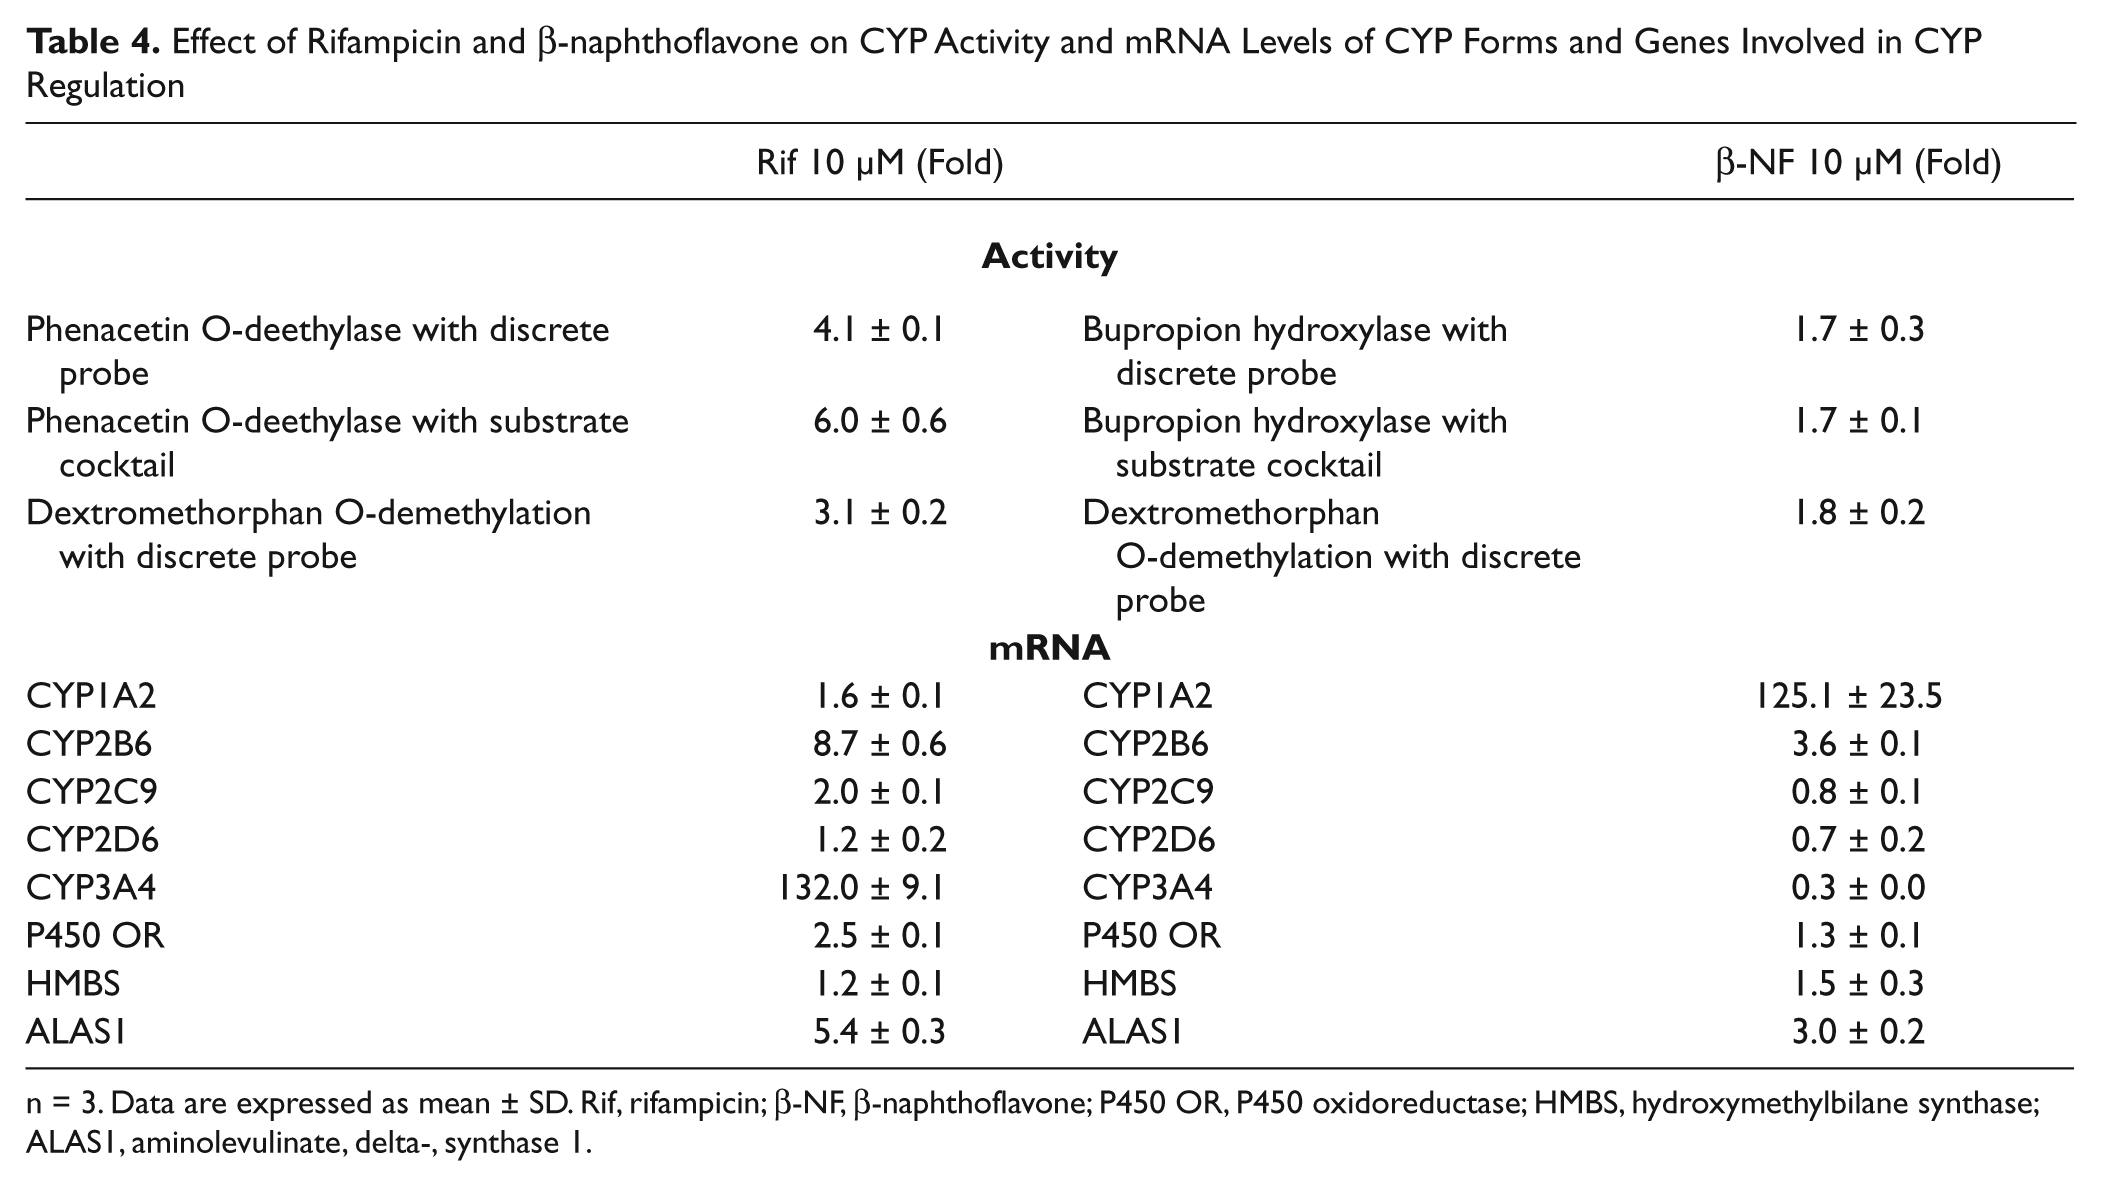
n = 3. Data are expressed as mean ± SD. Rif, rifampicin; β-NF, β-naphthoflavone; P450 OR, P450 oxidoreductase; HMBS, hydroxymethylbilane synthase; ALAS1, aminolevulinate, delta-, synthase 1.
Three approaches were taken to elucidate the source of apparent induction by β-naphthoflavone and rifampicin. The first was using a CYP2D6 probe to see if the activity increased after cells were treated with rifampicin or β-naphthoflavone. The second was the use of qPCR analysis to analyze mRNA expression of CYP genes and genes of others proteins involved in CYP regulation. The third approach was the use of PXR inhibitors, such as coumestrol, ketoconazole, and DL-sulforaphane, to attempt to isolate the effect of rifampicin on CYP1A activity to the PXR signaling pathway.19–21
There was an increase in CYP2D6-mediated dextromethorphan O-demethylation activity after the treatment with rifampicin and β-naphthoflavone, to a much smaller extent, even though there was no induction of CYP2D6 mRNA ( Table 4 ). CYP1A2 mRNA was not significantly increased with the rifampicin, but there was a small increase in CYP2B6 mRNA expression with β-naphthoflavone. Since mRNA levels for CYP1A2 did not correlate with the increased activity, it is possible that other genes involved in CYP regulation could be involved in the increase of CYP1A and CYP2D6 activity.
To investigate a possible explanation for the disconnection between activity and mRNA, mRNA analysis was performed for some genes that are involved in the CYP reaction cycle and in heme biosynthesis. The mRNA expression of aminolevulinate synthase 1 (ALAS1), a protein involved in heme biosynthesis, was increased by rifampicin and β-naphthoflavone, but mRNA of hydroxymethylbilane synthase, another protein involved in heme biosynthesis, was not affected.22,23 Also, rifampicin weakly induced P450 oxidoreductase mRNA expression, but β-naphthoflavone did not. The induction of mRNA for other proteins involved in the reaction cycle of CYP or involved in the synthesis of heme, which can be incorporated into CYP, shows there is potential to increase CYP activity even if the mRNA of the particular CYP being measured is not being induced.
To study the potential effects of PXR inhibitors, cells were treated with 20 µM coumestrol, 25 µM ketoconazole, or 1 mM DL-sulforaphane, which are concentrations near their reported IC50 values for PXR in the absence or presence of rifampicin.19–21 Coumestrol had no effect on rifampicin induction of CYP3A activity at 20 µM, and a treatment of 100 µM coumestrol resulted in over 60% cell number reduction. The treatments for ketoconazole and DL-sulforaphane resulted in approximately 50% cell number reduction as compared with non-PXR-treated controls. There was a reduction in induction on a per cell basis for all cytotoxic concentrations of PXR inhibitors, but as suggested by the reduction in cell number, the effects of normal cellular function impairment cannot be separated from any potential PXR inhibition (data not shown).
The activity and mRNA data suggest two different scenarios for the effect of rifampicin on CYP1A activity and for the effect of β-naphthoflavone on CYP2B6 activity. Rifampicin appears to affect CYP1A activity via indirect mechanisms of induction, including possibly P450 oxidoreductase expression and heme incorporation. β-Naphthoflavone may have direct and indirect effects on CYP2B6 activity since CYP2B6 mRNA was increased but ALAS1 mRNA was also increased. These data also do not rule out the possibility of posttranscriptional regulation of CYP genes that could lead to increased efficiency of expression of CYP functional proteins that are generically regulated through PXR and AhR signaling pathways.
As expected, CYP2C9 induction was weaker than the other forms examined. 2 With lot 246, there was a small reduction of activity using the substrate cocktail with the induced cells, and the vehicle was relatively unchanged. The use of the substrate cocktail did not appear to influence the measurement of CYP2C9 activity with lot 262. The fold induction was similar in the discrete and substrate cocktail with both donors.
CYP3A activity did not seem to be affected by the use of the substrate cocktail. With both hepatocyte lots and incubation formats, some differences in fold induction were observed between discrete and substrate cocktails. However, this was likely due to the variation in the vehicle control since the induced activity levels were very similar as measured by discrete or substrate cocktails.
As a further validation of the use of the substrate cocktails for induction assessment, EC50/Emax curves for CYP3A induction by rifampicin were generated and compared among the discrete and substrate cocktails. These curve fits were conducted via four-parameter fitting. As shown in Figure 1 , the EC50 values for a given lot were highly consistent, whereas there was more variation among Emax values. Since the fold induction is measured against the vehicle control for CYP activity, variation in vehicle control activity would influence the Emax values. Figure 1D shows the relationship of rifampicin concentration to activity with the discrete probe and substrate cocktail using data used to generate Figure 1B . The two curves are almost indistinguishable, with the greatest differences being the vehicle control. In Figure 1C , the higher Emax value for rifampicin was seen with the discrete probe as opposed to the substrate cocktail; therefore, the use of the substrate cocktail may not be responsible for the differences in the estimated Emax values. It appears that the substrate cocktail did not influence the estimation of the CYP3A induction potency by rifampicin.
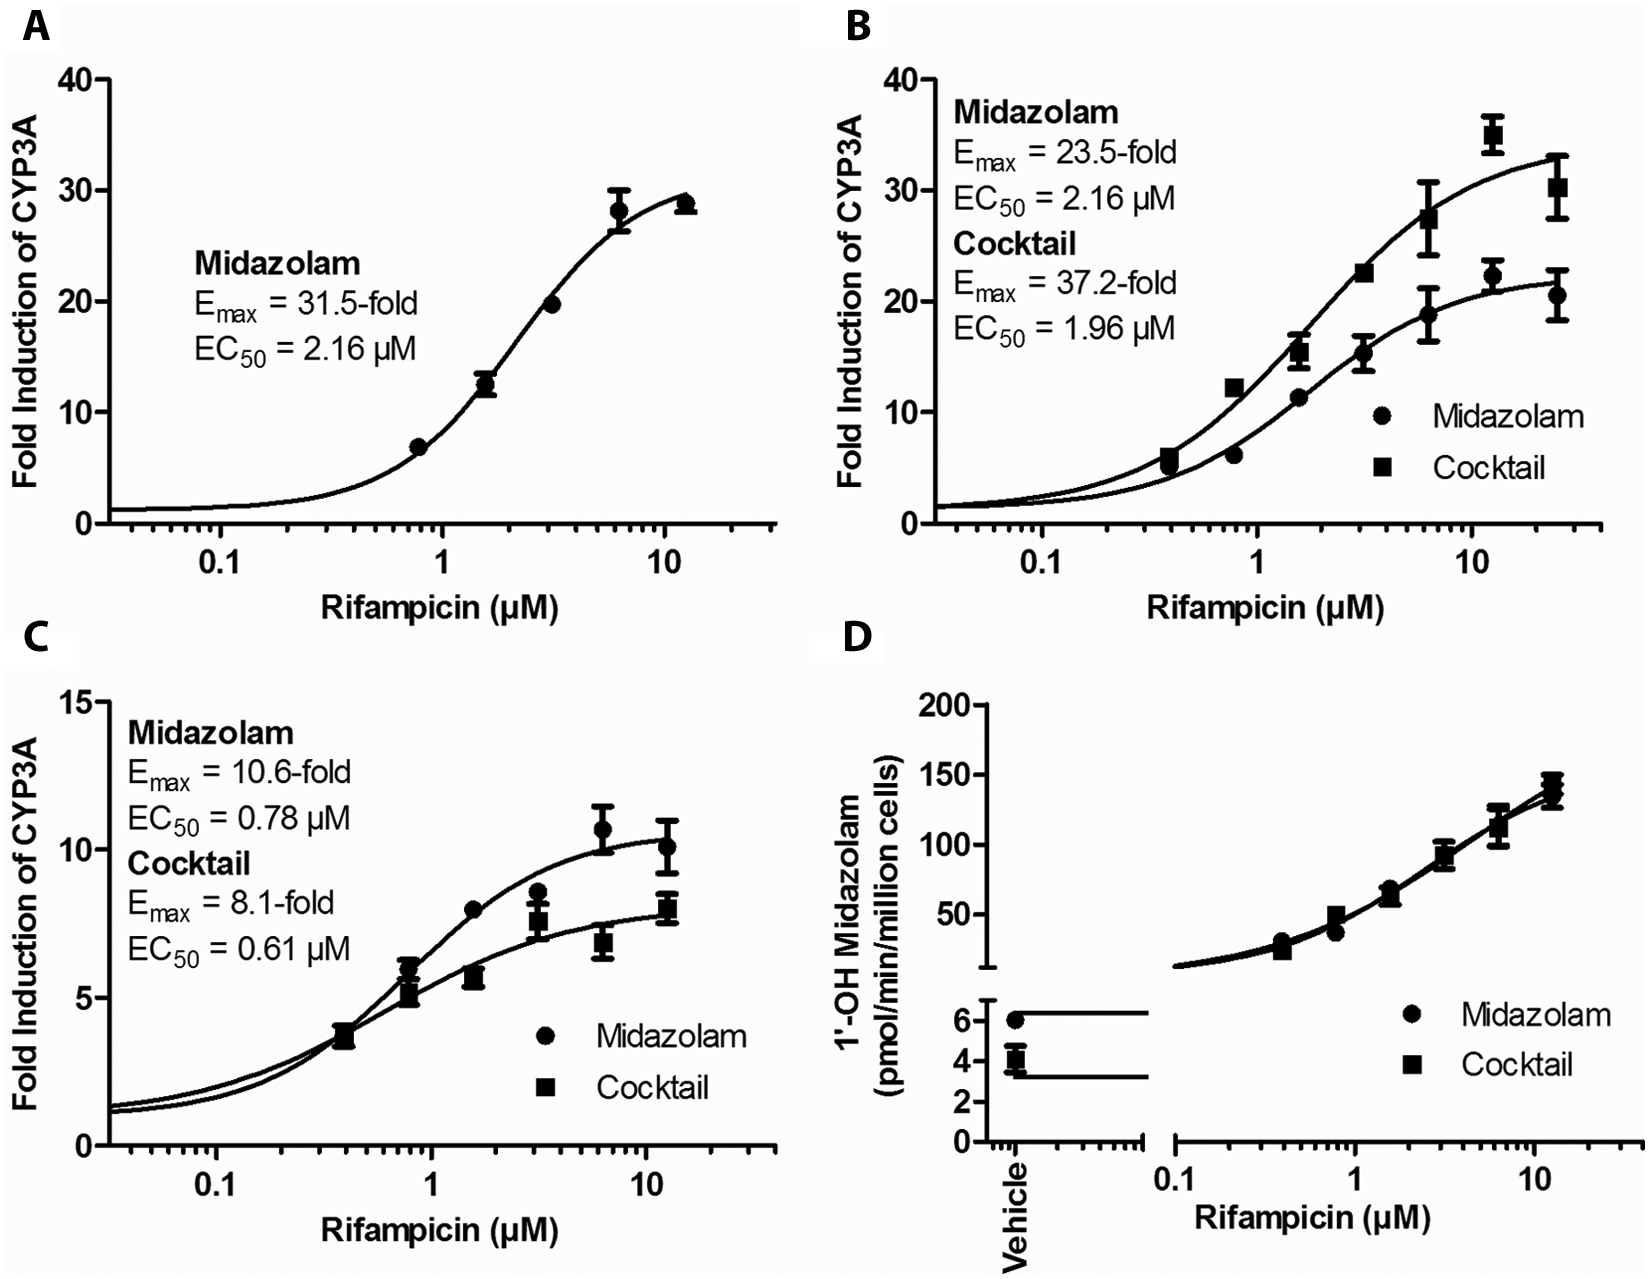
EC50/Emax determinations for rifampicin in a 24-well format with midazolam as the probe with lot 246 (
Impact Analysis of Normalization by Cell Count on CYP Activity
The use of cell counts allows the determination of concentration-dependent cell number reduction by potentially cytotoxic compounds such as the PXR inhibitors coumestrol, ketoconazole, and DL-sulforaphane. Without measuring the impact on cell number or cell viability by these compounds, the cause in reduction of CYP activity may not be properly assessed due to lack of information on cellular function. This potential situation could apply with inducers that are being used above the tolerated concentrations in hepatocytes, which would result in underestimation of potency or a false-negative result.
To assess the ability of cell counts to reduce analytical variation, the coefficient of variation (CV) was calculated with and without cell count normalization for lots 246 and 267 CYP activities, as shown in Table 5 . The mean % CV is very similar with and without normalization, so the normalization does not appear to aid in reducing variation. The cell numbers were consistent, with a % CV of 6.7% for lot 246 and 12.7% for lot 262; therefore, the utility of normalization may be limited in terms of reducing variation in activity since the plating of cells appeared to be reproducible.
Effect of Normalization by Cell Count on the Coefficient of Variation (%) for CYP Activities in 96-well
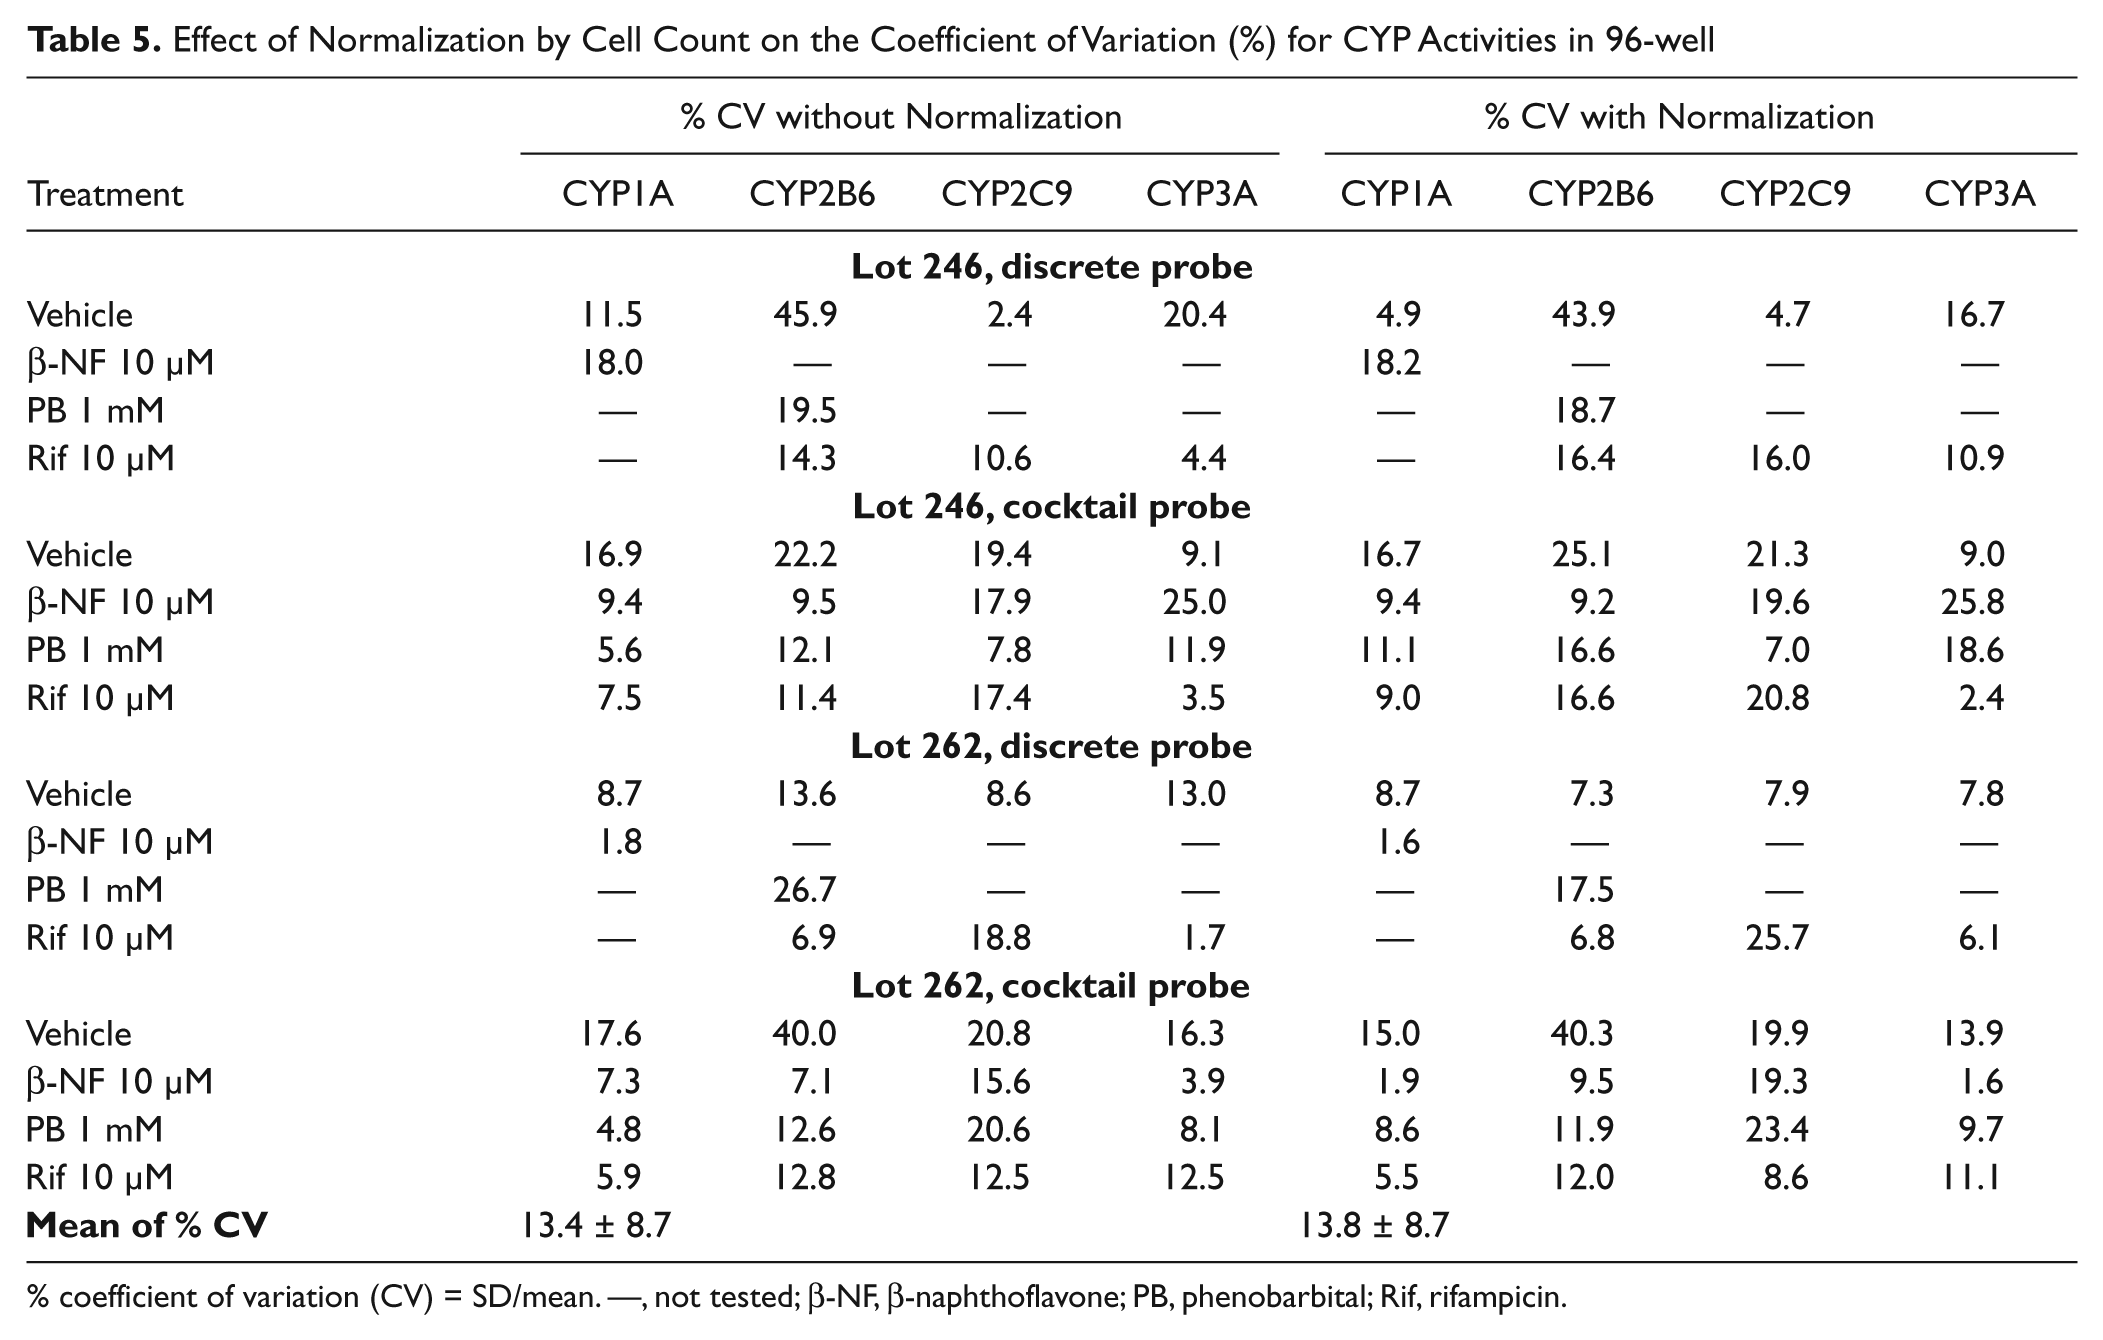
% coefficient of variation (CV) = SD/mean. —, not tested; β-NF, β-naphthoflavone; PB, phenobarbital; Rif, rifampicin.
The positive impact of cell counts appears to be limited to the accuracy of assessing the data being generated. However, this aspect is essential in properly interpreting the results generated from the activity assay.
Assessment of Induction Potential for a Commercial Compound Set Using Four Concentrations
To show the utility of this assay system, a group of 13 commercially available compounds, including known inducers and noninducers of CYPs, were tested at 0.3, 1, 10, and 30 µM in duplicate using lot 246 to replicate a scenario for high-throughput screening (HTS). The values for EC50 and Emax were estimated for compounds that induced greater than 1.5-fold for at least two concentrations and did not result in an ambiguous curve fit using three-parameter EC50 and Emax fittings. Estimated EC50 and Emax values were reported only if at least two tested concentrations were above the estimated EC50 value. The baseline value of induction, with testing compound concentration at zero, was fixed to 1 to perform curve fittings resulting in the following equation:

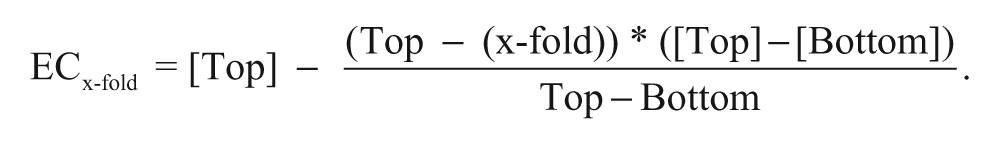
To allow comparison of compounds whose Emax values were different, the concentrations to produce 2-, 3-, or 5-fold of induction (ECx-fold) were calculated using fold induction values bracketing the target fold induction by the following formula:
The results for the commercial compound set are presented in Table 6 .
Induction Potency of Various Commercial Compounds Assessed with Substrate Cocktail for CYP1A, CYP2B6, CYP2C9, and CYP3A: (
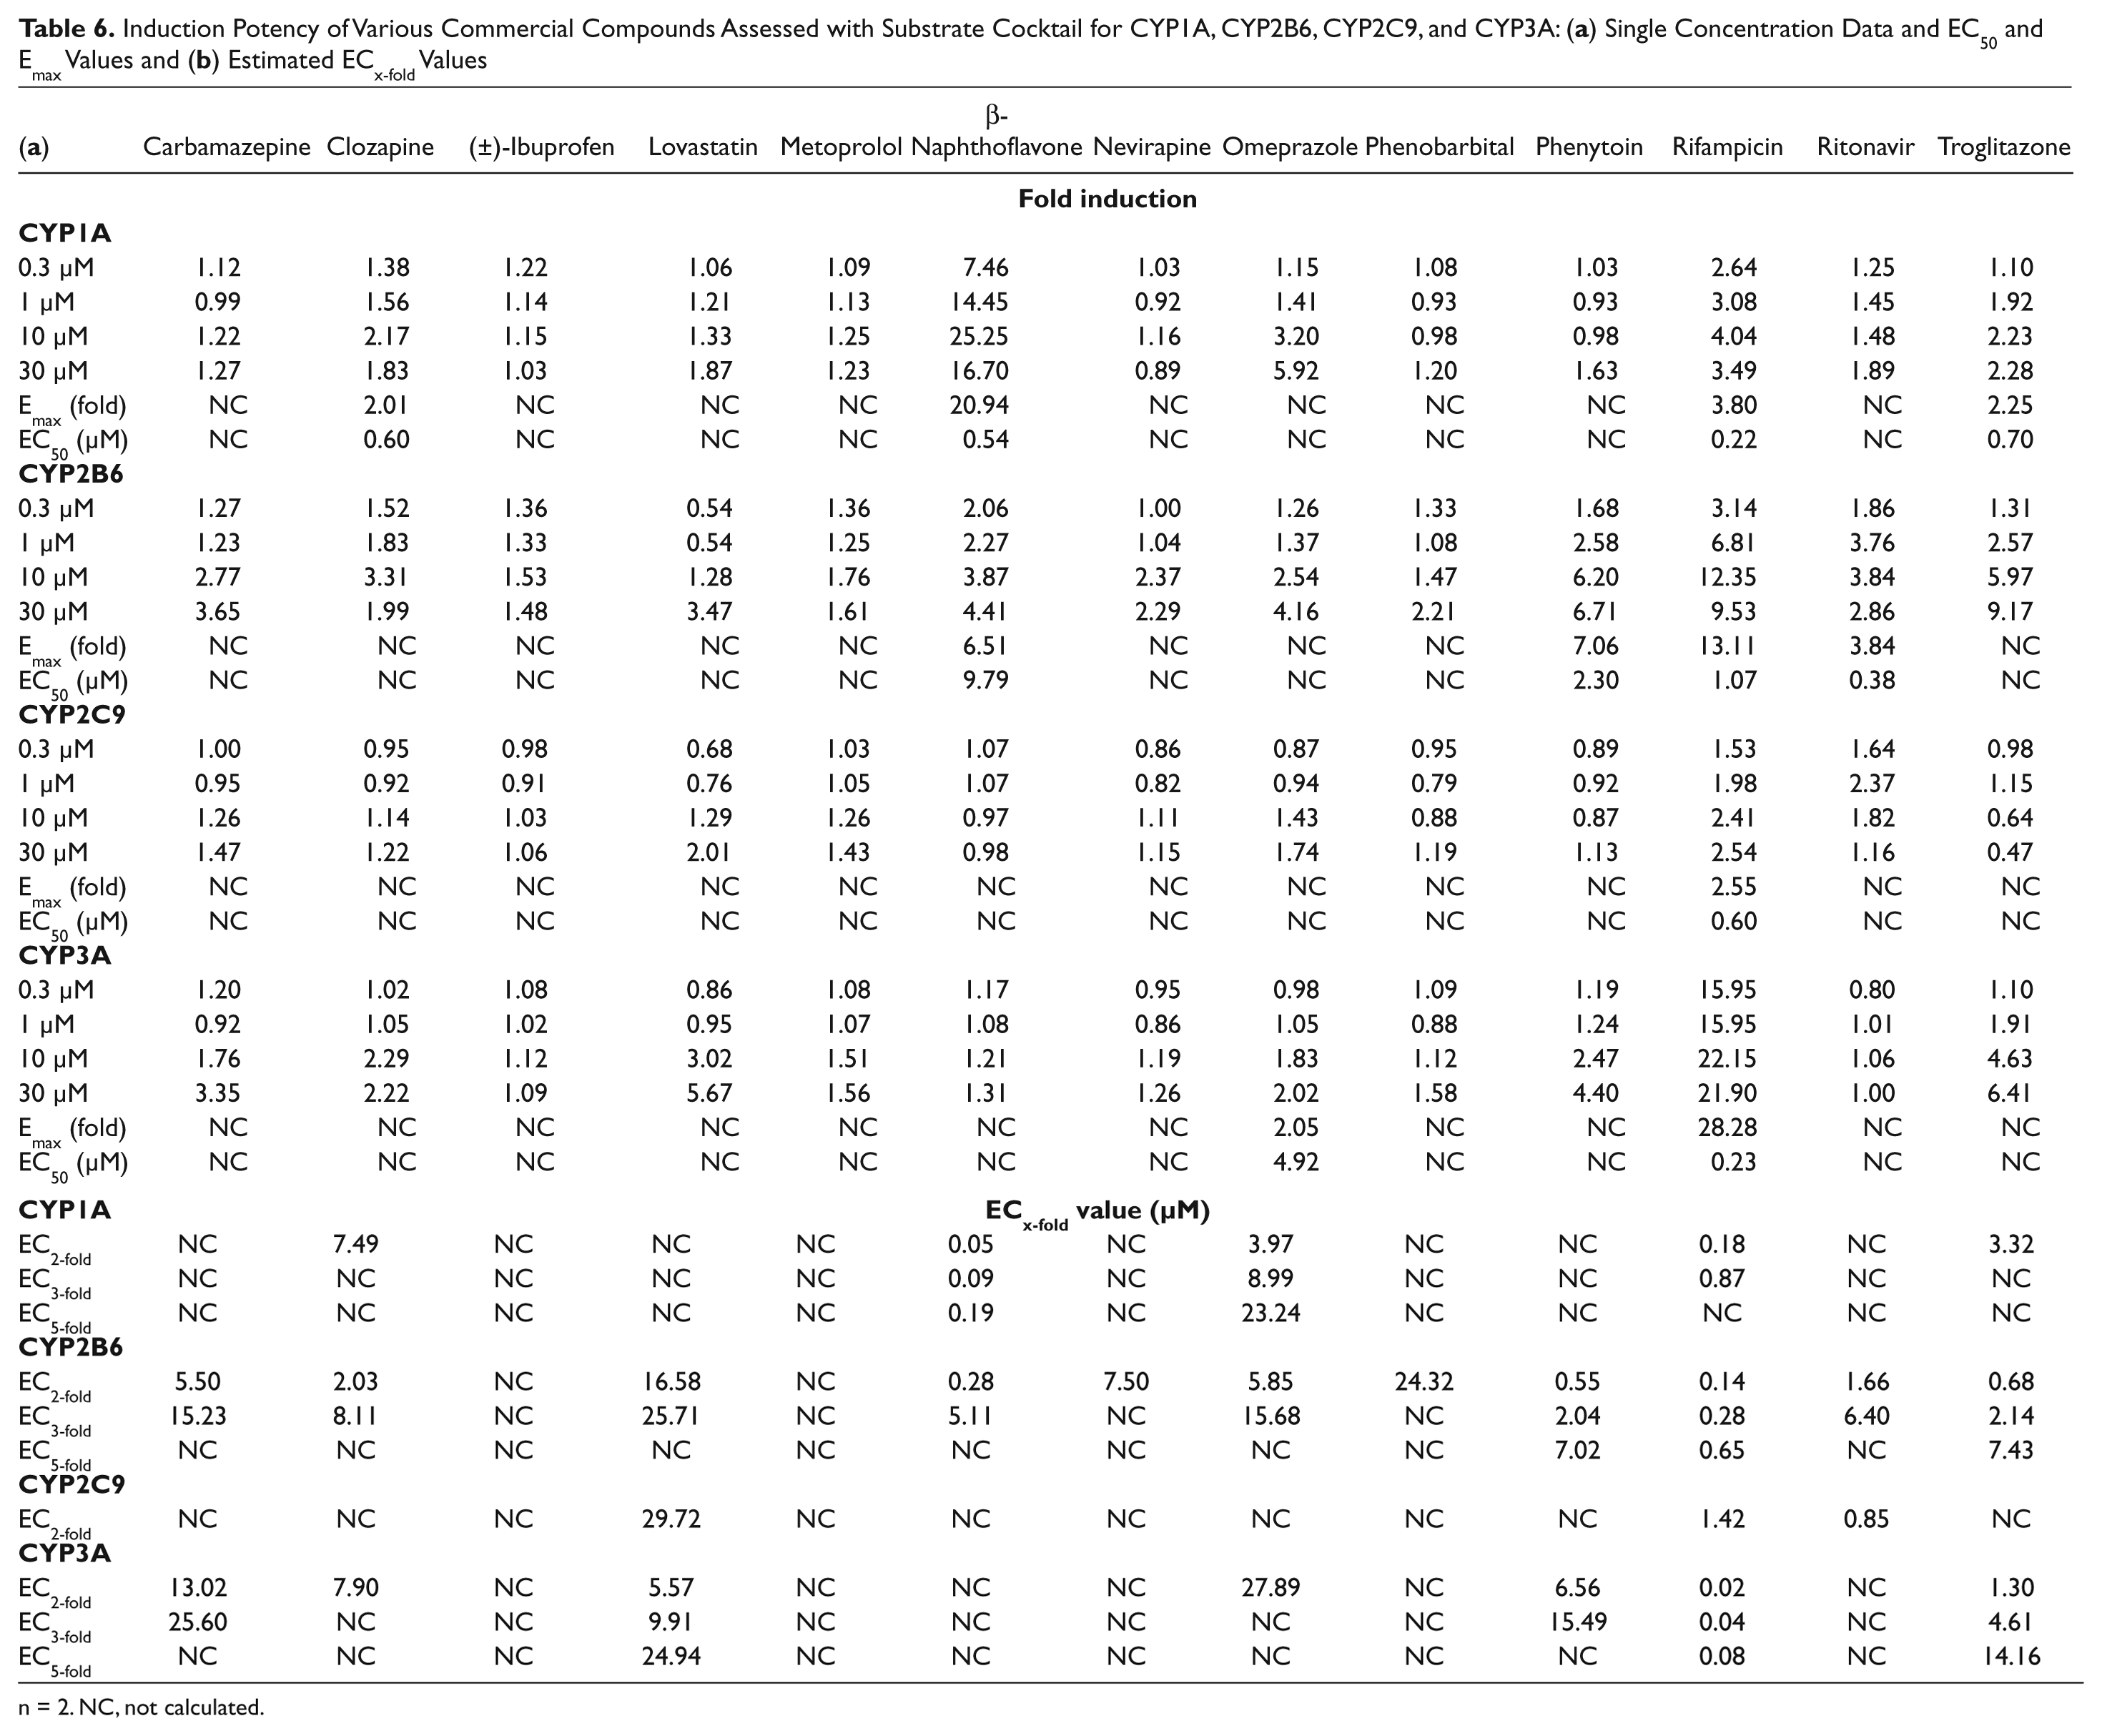
n = 2. NC, not calculated.
ECx-fold values were calculated to allow more direct comparisons of induction potency between compounds. The calculation made the assumption of linearity in the estimated region. Despite the limitations of this simplified approach, the rank order of potency, as evidenced by the potency of typical positive controls such as rifampicin relative to other compounds, is demonstrated by these values.
CYP1A induction occurred with the two well-described inducers, β-naphthoflavone and omeprazole, but also occurred with rifampicin and troglitazone, which are known CYP3A inducers.2,24,25 Rifampicin’s estimated EC50 value for increased CYP1A activity was similar to the value observed for its CYP3A induction, which suggests a possible link between the PXR signaling for CYP3A induction and the increase seen for CYP1A by treatment with rifampicin.
Many compounds induced CYP2B6, as expected, such as carbamazepine, phenytoin, and rifampicin.2,26 Phenobarbital did not show significant induction at the concentrations tested, which is consistent with phenobarbital’s reported EC50 value of over 100 µM. 27 Again, β-naphthoflavone induced CYP2B6, and its EC50 value was similar to the results obtained for CYP1A. This phenomenon may parallel rifampicin’s apparent effect on CYP1A.
Weak induction by rifampicin was observed for CYP2C9, as previously reported.2,28 In addition, lovastatin, omeprazole, and ritonavir appeared to weakly induce CYP2C9.
CYP3A was induced by many of the compounds in the panel, such as rifampicin and troglitazone. 29 Due to variability of the data at 0.3 µM for rifampicin and less data points to determine the curve, the EC50 value does not match well with the full curve results from Figure 1 . Ritonavir, a known PXR ligand and time-dependent inhibitor of CYP3A, showed no increase of CYP3A activity, which is consistent with ritonavir boosting the exposure of other human immunodeficiency virus (HIV) retrovirals by inhibiting CYP3A-mediated metabolism. 30
The use of a substrate cocktail in a 96-well format with a form of cell counting is highly suitable for HTS for multiple reasons. By using the 96-well format and a substrate cocktail, the assessment of more compounds and more concentrations of those compounds can be accomplished without compromising the quality of the assessment. In addition, the use of a high-content screening system for counting the cells allows for a rapid in situ assessment of cell number and possible analysis of other cytotoxic parameters. That information from the high-content screening system allows for compensation of well-to-well variation and calculation of EC50 values for cytotoxicity or other cytotoxic parameters due to compound treatment that could be used for evaluation of the induction data and ranking of potential hepatotoxicity of the compounds being screened. As a result, a substrate cocktail system, such as the one we have described, is a valuable tool in the rapid assessment of induction potential of drug candidates.
Footnotes
Acknowledgements
The authors thank Linda Buckley and Eric T. Williams (Eisai) for their editorial assistance and Eric for his thoughtful discussion of the work.
Declaration of Conflicting Interests
The authors declared no potential conflicts of interest with respect to the research, authorship, and/or publication of this article.
Funding
The authors were fully supported for the research and publication of this article by Eisai.