
Abstract
The widespread use of two-dimensional (2D) monolayer cultures for high-throughput screening (HTS) to identify targets in drug discovery has led to attrition in the number of drug targets being validated. Solid tumors are complex, aberrantly growing microenvironments that harness structural components from stroma, nutrients fed through vasculature, and immunosuppressive factors. Increasing evidence of stromally-derived signaling broadens the complexity of our understanding of the tumor microenvironment while stressing the importance of developing better models that reflect these interactions. Three-dimensional (3D) models may be more sensitive to certain gene-silencing events than 2D models because of their components of hypoxia, nutrient gradients, and increased dependence on cell-cell interactions and therefore are more representative of in vivo interactions. Colorectal cancer (CRC) and breast cancer (BC) models composed of epithelial cells only, deemed single-cell-type tumor spheroids (SCTS) and multi-cell-type tumor spheroids (MCTS), containing fibroblasts were developed for RNAi HTS in 384-well microplates with flat-bottom wells for 2D screening and round-bottom, ultra-low-attachment wells for 3D screening. We describe the development of a high-throughput assay platform that can assess physiologically relevant phenotypic differences between screening 2D versus 3D SCTS, 3D SCTS, and MCTS in the context of different cancer subtypes. This assay platform represents a paradigm shift in how we approach drug discovery that can reduce the attrition rate of drugs that enter the clinic.
Introduction
RNA interference (RNAi) is a biological process involving the targeting of specific mRNA transcripts for degradation resulting in gene loss of function and has become a powerful tool in high-throughput screening (HTS) for the discovery of novel drug targets and the dissection of molecular mechanisms of action.1–3 Although HTS tools and methods enable the collection of data on the genomewide scale, screens are limited by the same technical aspects of current in vitro assay systems in low throughput that have proven to be unable to provide robust, high-priority targets that can withstand extensive validation. 4
Cell-based proliferation studies of cancer in both high and low throughput are typically conducted using cells of a single type. This is problematic because the conventional solid tumor has been shown to be influenced by local and systemic factors produced by noncancerous cells. 5 Emerging evidence supports the critical role of cancer-associated stromal cells in promoting tumor initiation, differentiation, angiogenesis, invasion, metastasis, and immunosuppression.6,7 Conventional two-dimensional (2D) cell culture methods involve growing cells on a flat, plastic surface, but little is known about how key aspects of in vivo biology, such as nutrient and oxygen gradients, govern gene expression patterns in three-dimensional (3D) orientation.8,9 This limits our understanding of intra- and extracellular signaling influenced by 3D cell-cell interactions as well as our ability to identify clinically relevant molecular targets. Therefore, we hypothesized that the fate of cells is intimately related to contributions from surrounding cells and their 3D configuration.
We designed an RNAi screen that would explore this hypothesis in the context of breast and colorectal cancer. The goal of this screen is threefold: to elucidate subtle differences in 2D versus 3D tumor growth driven by siRNA-mediated gene silencing, to identify specific factors that affect the viability of breast and colorectal cancer, and to determine the influence of fibroblasts on the proliferation of cancer cells.
Materials and Methods
Cell Lines and Reagents
DLD-1 (ATCC) cells were grown in RPMI medium 1640 (Gibco, Waltham, MA), whereas MDA-MB-231-GFP (Cell Biolabs, Inc., San Diego, CA) and RFP-expressing human neonatal dermal fibroblasts (HNDF; Angio-Proteomie, Boston, MA) cells were grown in DMEM (Gibco), all according to vender protocols. All media were supplemented with 10% fetal bovine serum (FBS), 100 U penicillin, and 100 µg streptomycin, components purchased from ThermoFisher Scientific (Waltham, MA).
Stable Cell Line Generation
Puromycin kill curves were established for DLD-1 cells with a final concentration of 2 µg/mL. Cignal Lenti-positive control green fluorescent protein (GFP) particles were transduced into DLD-1 cells (multiplicity of infection = 10). Cignal Lenti reporters are ready-to-transduce lentiviral particles constitutively expressing GFP, driven by cytomegalovirus promoter. Transduction was performed in Corning 6-well microplates; clonal isolation was performed by single-cell dilution into Corning 384-well microplates. Fluorescence and proliferation were monitored daily for 3 wk using the Invitrogen EVOS FL Auto Imaging System. Clonal populations with high-viability bright fluorescence expression were isolated and tested for transfectability. The chosen clone for screening was designated “DLD-1-GFP.”
Primary Screen
RNAi screening was conducted using the Ambion Silencer Select Human Kinome siRNA Library Version 4, which consists of three unique, nonoverlapping, nonpooled siRNAs per 710 human kinase genes. siRNA reagents (2 µL; 400 nM) were stamped into microplates (described in detail below) using a Velocity11 VPrep liquid-handling system (Agilent, Santa Clara, CA) integrated into a BioCel robotic platform (Agilent) in columns 1 to 22, leaving columns 23 and 24 empty for negative (Ambion Silencer Select Negative Control #2) and positive (Qiagen Allstars Hs Cell Death) controls, respectively. The median value of each plate’s negative control column was used to normalize sample wells, whereas the positive control was used to assess transfection efficiency and assay performance.
Two-dimensional screening was conducted in Greiner Bio-One 384-well black, clear, flat-bottom microplates, whereas 3D screening was conducted in Corning 384-well black, clear, round-bottom ultra-low-attachment spheroid microplates. Invitrogen lipofectamine RNAiMAX transfection reagent (2D: DLD-1-GFP, 0.15 µL; HNDF, 0.20 µL; multi-cell-type tumor spheroids [MCTS], 0.17 µL; 3D: DLD-1-GFP, 0.05 µL; HNDF, 0.08 µL; MCTS, 0.07 µL) was added in 20 µL serum-free, antibiotic-free media to plate wells using a Thermo Scientific Matrix WellMate and Microplate Stacker. Plates were incubated for 45 min at room temperature to allow for the sufficient formation of siRNA-to-lipid complexes. Cells were added to plate wells in 20 µL media containing 20% FBS and without antibiotics (2D: DLD-1-GFP, HNDF, 2000 cells/well; MCTS, 2000 cells/well, 3:2 ratio; 3D: DLD-1-GFP, HNDF, 500 cells/well; MCTS, 500 cells/well, 3:2 ratio). The final 40 µL per well contained 20 nM siRNA in media with 10% FBS. Cells were cultured for 72 h at 37 °C in 5% CO2 before endpoint assays.
Viability Assay
Cell viability was assessed using the CellTiter-Glo Luminescent Cell Viability Assay. CellTiter-Glo reagent was added directly to microplates (2D: 20 µL, 60 µL final volume; 3D: 30 µL containing 10% trypsin, 70 µL final volume) and incubated at room temperature for 20 min for 2D culture. For 3D culture, plates were incubated on a shaker at room temperature for 5 min and then set still for 20 min. Luminescence signal was detected using the EnVision Multilabel Plate Reader. The EnVision Multilabel Plate Reader uses an ultrasensitive aperture and detector system to collect emitted luminescence from the sample in 384-well plate format. Plates were read using the following parameters: 0.1 mm distance between plate and detector, 0.3 s measurement time.
Image Acquisition
Plates were imaged with the IN Cell Analyzer 6000 Cell Imaging System (GE Healthcare Life Sciences). The IN Cell Analyzer 6000 uses a scientific CMOS 5.5 megapixel camera and a proprietary epifluorescence-based line scanning confocal system for image acquisition in confocal, open aperture, and transmitted light modes. Image acquisition was performed with a 10× Nikon lens objective.
Primary Screen Analysis and Hit Selection
The assay readout for each well was normalized by dividing by the median negative control readout for the plate and multiplying by 100, yielding a percentage of negative control value that corrects for plate-to-plate variance. A robust z-score was then calculated by subtracting the median screen percentage and dividing by the screen median absolute deviation. The difference between z-scores was then used to assess differences between each screen. The RSA algorithm 10 was used to rank gene-level differences between the screens. All analysis was performed in R. 11 The gene-level aggregation of the data is the result of taking the median of a particular metric (percentage viability, z-score, z-diff, etc.) at the siRNA level, usually for three different siRNAs against the same gene.
Secondary Screen
The secondary screen was conducted using the Ambion Select Library. Genes with the highest median z-score from the primary screen were selected, and three independent siRNAs against these genes were cherry-picked and screened in the same assay. In a few cases, the siRNA sequence in the Ambion Select Library was the same as in the primary screening library, in which case it was eliminated from the data set as it would not be an independent data point. Data in the secondary screen was analyzed as it was in the primary, including negative control normalization and z-score calculation. Ranking the follow-up genes by the median z-score for all independent siRNAs tested against the gene (usually six) provided the basis for selecting genes for further validation.
Results
A 384-Well HTS-Compatible Spheroid Assay for RNAi Screening
The workflow for this screening campaign involved eight distinct culture conditions (
The first step of establishing a robust screening assay was to determine efficient transfection conditions for all eight parameters of this HTS screen ( Fig. 1A–H ). Optimal cell-seeding quantity for MDA-MB-231-GFP, DLD-1-GFP, HNDF, and MCTS was determined by observing cell density in 2D/3D 384-well plates over 72 h (not shown). The lipid-based transfection reagent RNAiMax was titrated in wells containing 20 nM siRNA of either a nontargeting control (negative) or a cell death control (positive) following vendor protocols (see the Materials and Methods section). After 72 h, CellTiter-Glo was added to determine viability. The lipid concentration that resulted in the greatest difference in viability between these two controls while minimizing lipid-associated toxicity was chosen to move forward with screening.
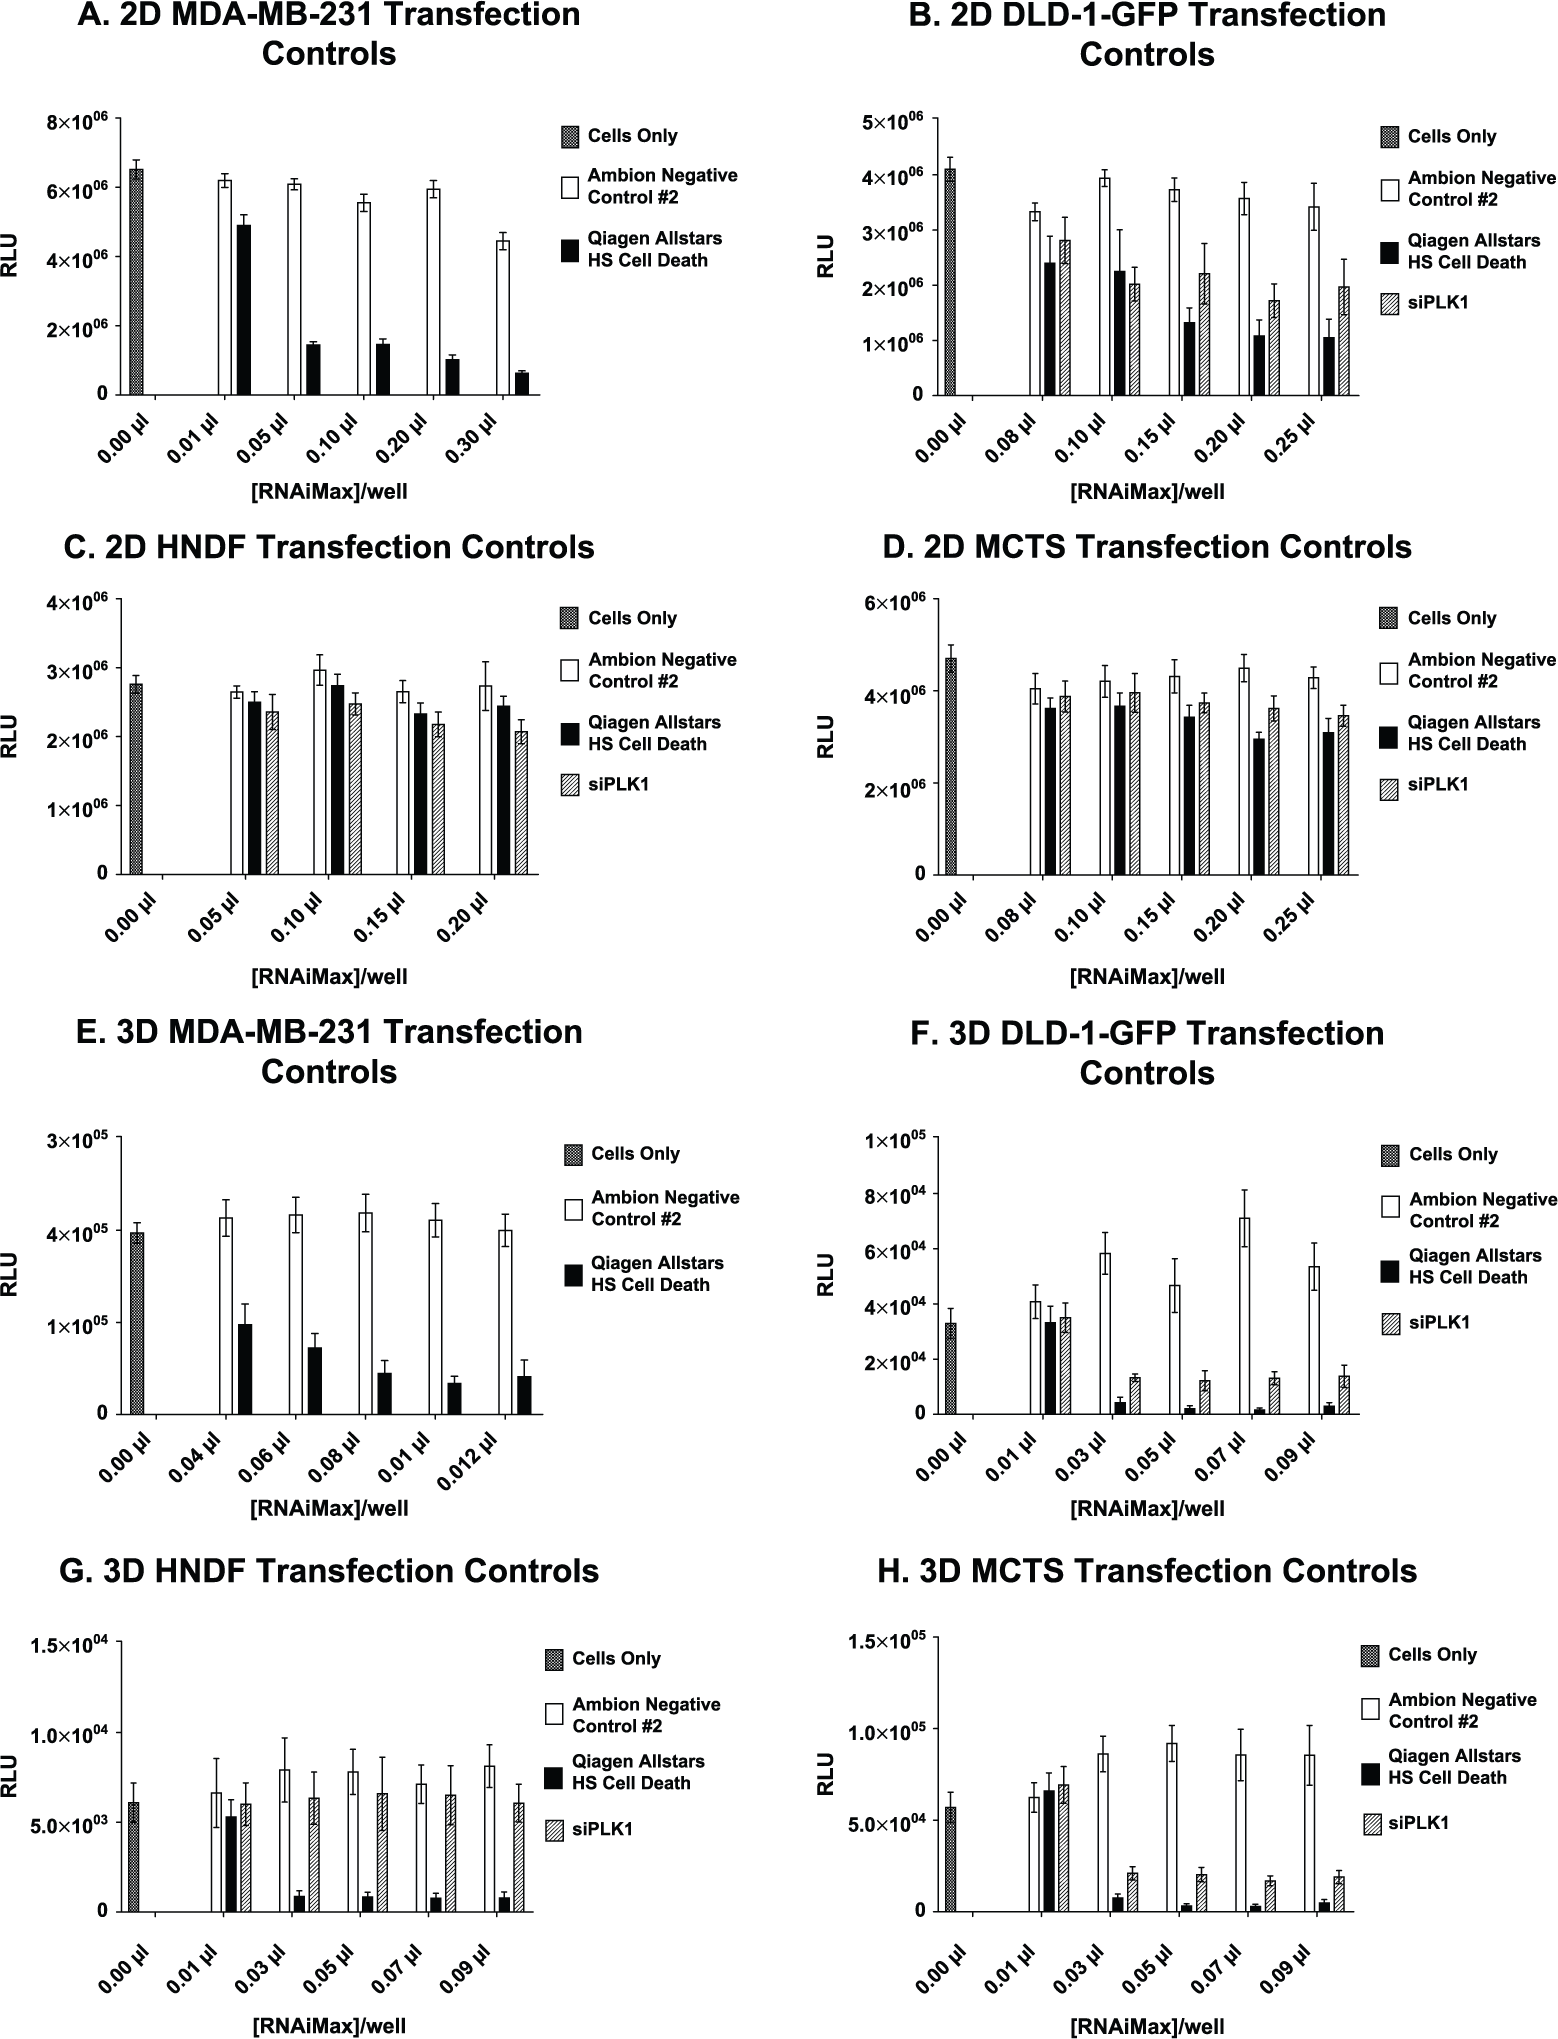
Transfection optimization. (
Effect of Gene Knockdown in 2D versus 3D SCTS Models
Having established a robust and reproducible platform to measure spheroid viability and morphology, we ran the Kinome library against both MDA-MB-231-GFP and the DLD-1-GFP cell lines grown as SCTS and 2D monolayers (
Fig. 2
). A scatter plot of the median Z-scores for the screen run for both the breast cancer cell line MDA-MB-231-GFP and the colorectal cancer cell line DLD-1-GFP under 2D and 3D conditions is shown in
Figure 2A
. The breast cancer cell line shows less of a correlation between the 2D and 3D SCTS screen conditions as compared with the correlation between the 2D and 3D conditions for the colorectal cell line DLD-1-GFP. This is reflected in the number of genes showing differential activity between the 2D and 3D breast and colorectal cancer. Of the 704 genes screened, less than 2% of the library showed a differential effect between the 2D and 3D culture conditions. The genes that when knocked down caused a differential viability effect between 2D monolayer and 3D SCTS conditions are depicted in
Figure 2
and
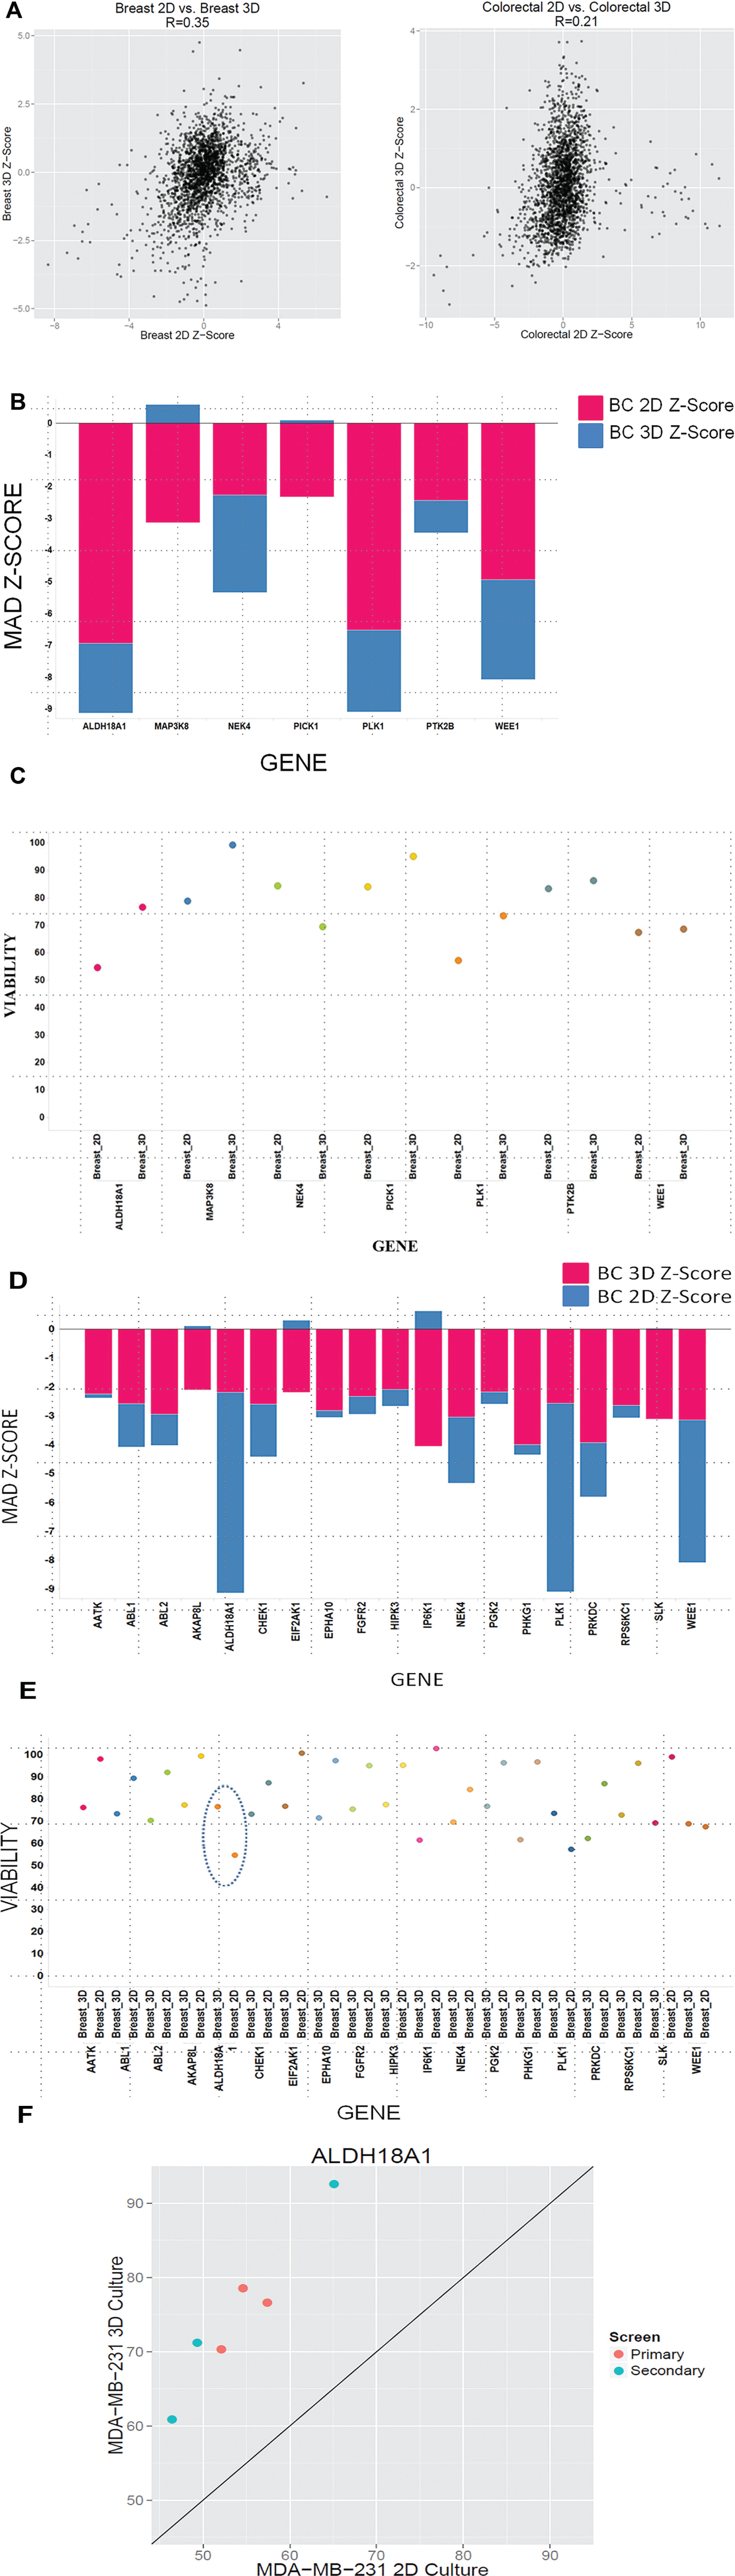
Effect of gene knockdown in single-cell-type tumor spheroids in two dimensions (2D) versus three dimensions (3D). (
Effect of Gene Knockdown in Different SCTS Models
Having established the effect of geometry on viability, we then investigated the effect of the different cancer types on viability.
Figure 3A
shows the correlation plots comparing the median Z-scores for breast and colorectal cancer with each other in both 2D and 3D SCTS conditions. Within the 2D conditions, the correlation between breast and colorectal cancer is 0.27, which allows for a reasonable overlap in genes affecting viability. However, a comparison between breast and colorectal cancer for the 3D SCTS condition reveals an R-score of 0.12, which indicates very little overlap between the genes affecting viability. A comparison of the genes differentially regulated in 2D between breast and colorectal cancer implicates ALDH18A, WEE1, and PRPS2. Although knockdown of ALDH8A1 and WEE1 shows a 46% and 33% decrease in viability in MDA-MB-231-GFP cells under 2D conditions, knockdown of PRPS2 shows a 71% decrease in viability in DLD1-GFP cells as compared with virtually no change in the MDA-MB-231-GFP cells (
Fig. 3B
;
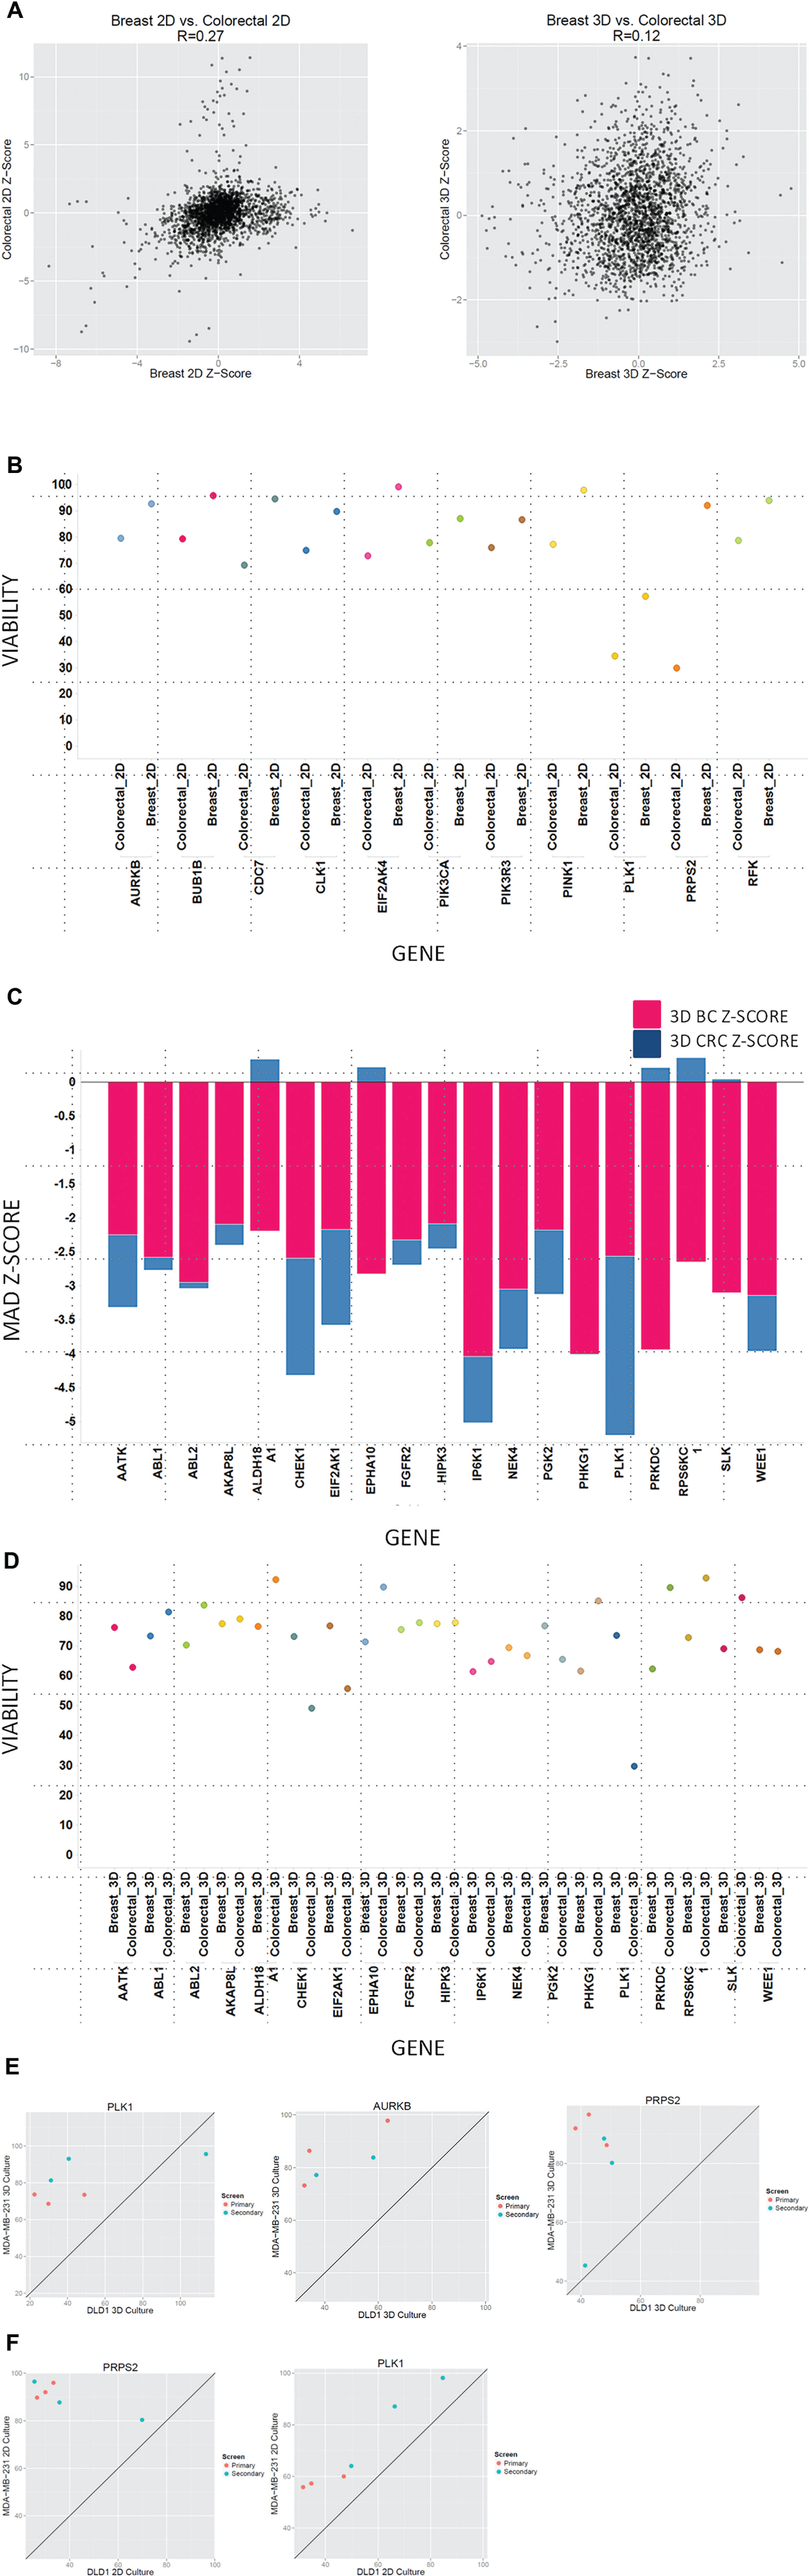
Effect of gene knockdown in single-cell-type tumor spheroids in breast cancer versus colorectal cancer and two dimensions (2D) versus three dimensions (3D). (
Effect of the Stroma-Differential Sensitivities to Gene Knockdown between Multi- and Single-Cell-Type Tumor Models
Tumor stroma plays a very important role in therapeutic resistance, cell proliferation, and drug response. To better mimic the tumor microenvironment, we screened MCTS composed of DLD1-GFP cells with fibroblasts.
Figure 4A
shows three plots that investigate the correlation between the median Z-scores of MCTS in 2D and 3D, fibroblasts alone in 2D and 3D, and colorectal SCTS and MCTS. None of these correlation plots show a strong correlation between viability responses, with R values of 0.13, 0.11, and 0.14, respectively.
Figure 4B
delineates the differential response between the MCTS and fibroblasts alone under 2D and 3D conditions. In both the primary and validation screens, knockdown of PRPS2 caused a severe decrease in viability in DLD1-GFP SCTS and MCTS. However, knockdown of PRPS2 did not affect the viability of fibroblasts alone (
Fig. 4B
). The addition of fibroblasts to MCTS does not confer a protective advantage to the DLD1-GFP cells in either 2D or 3D in terms of viability (
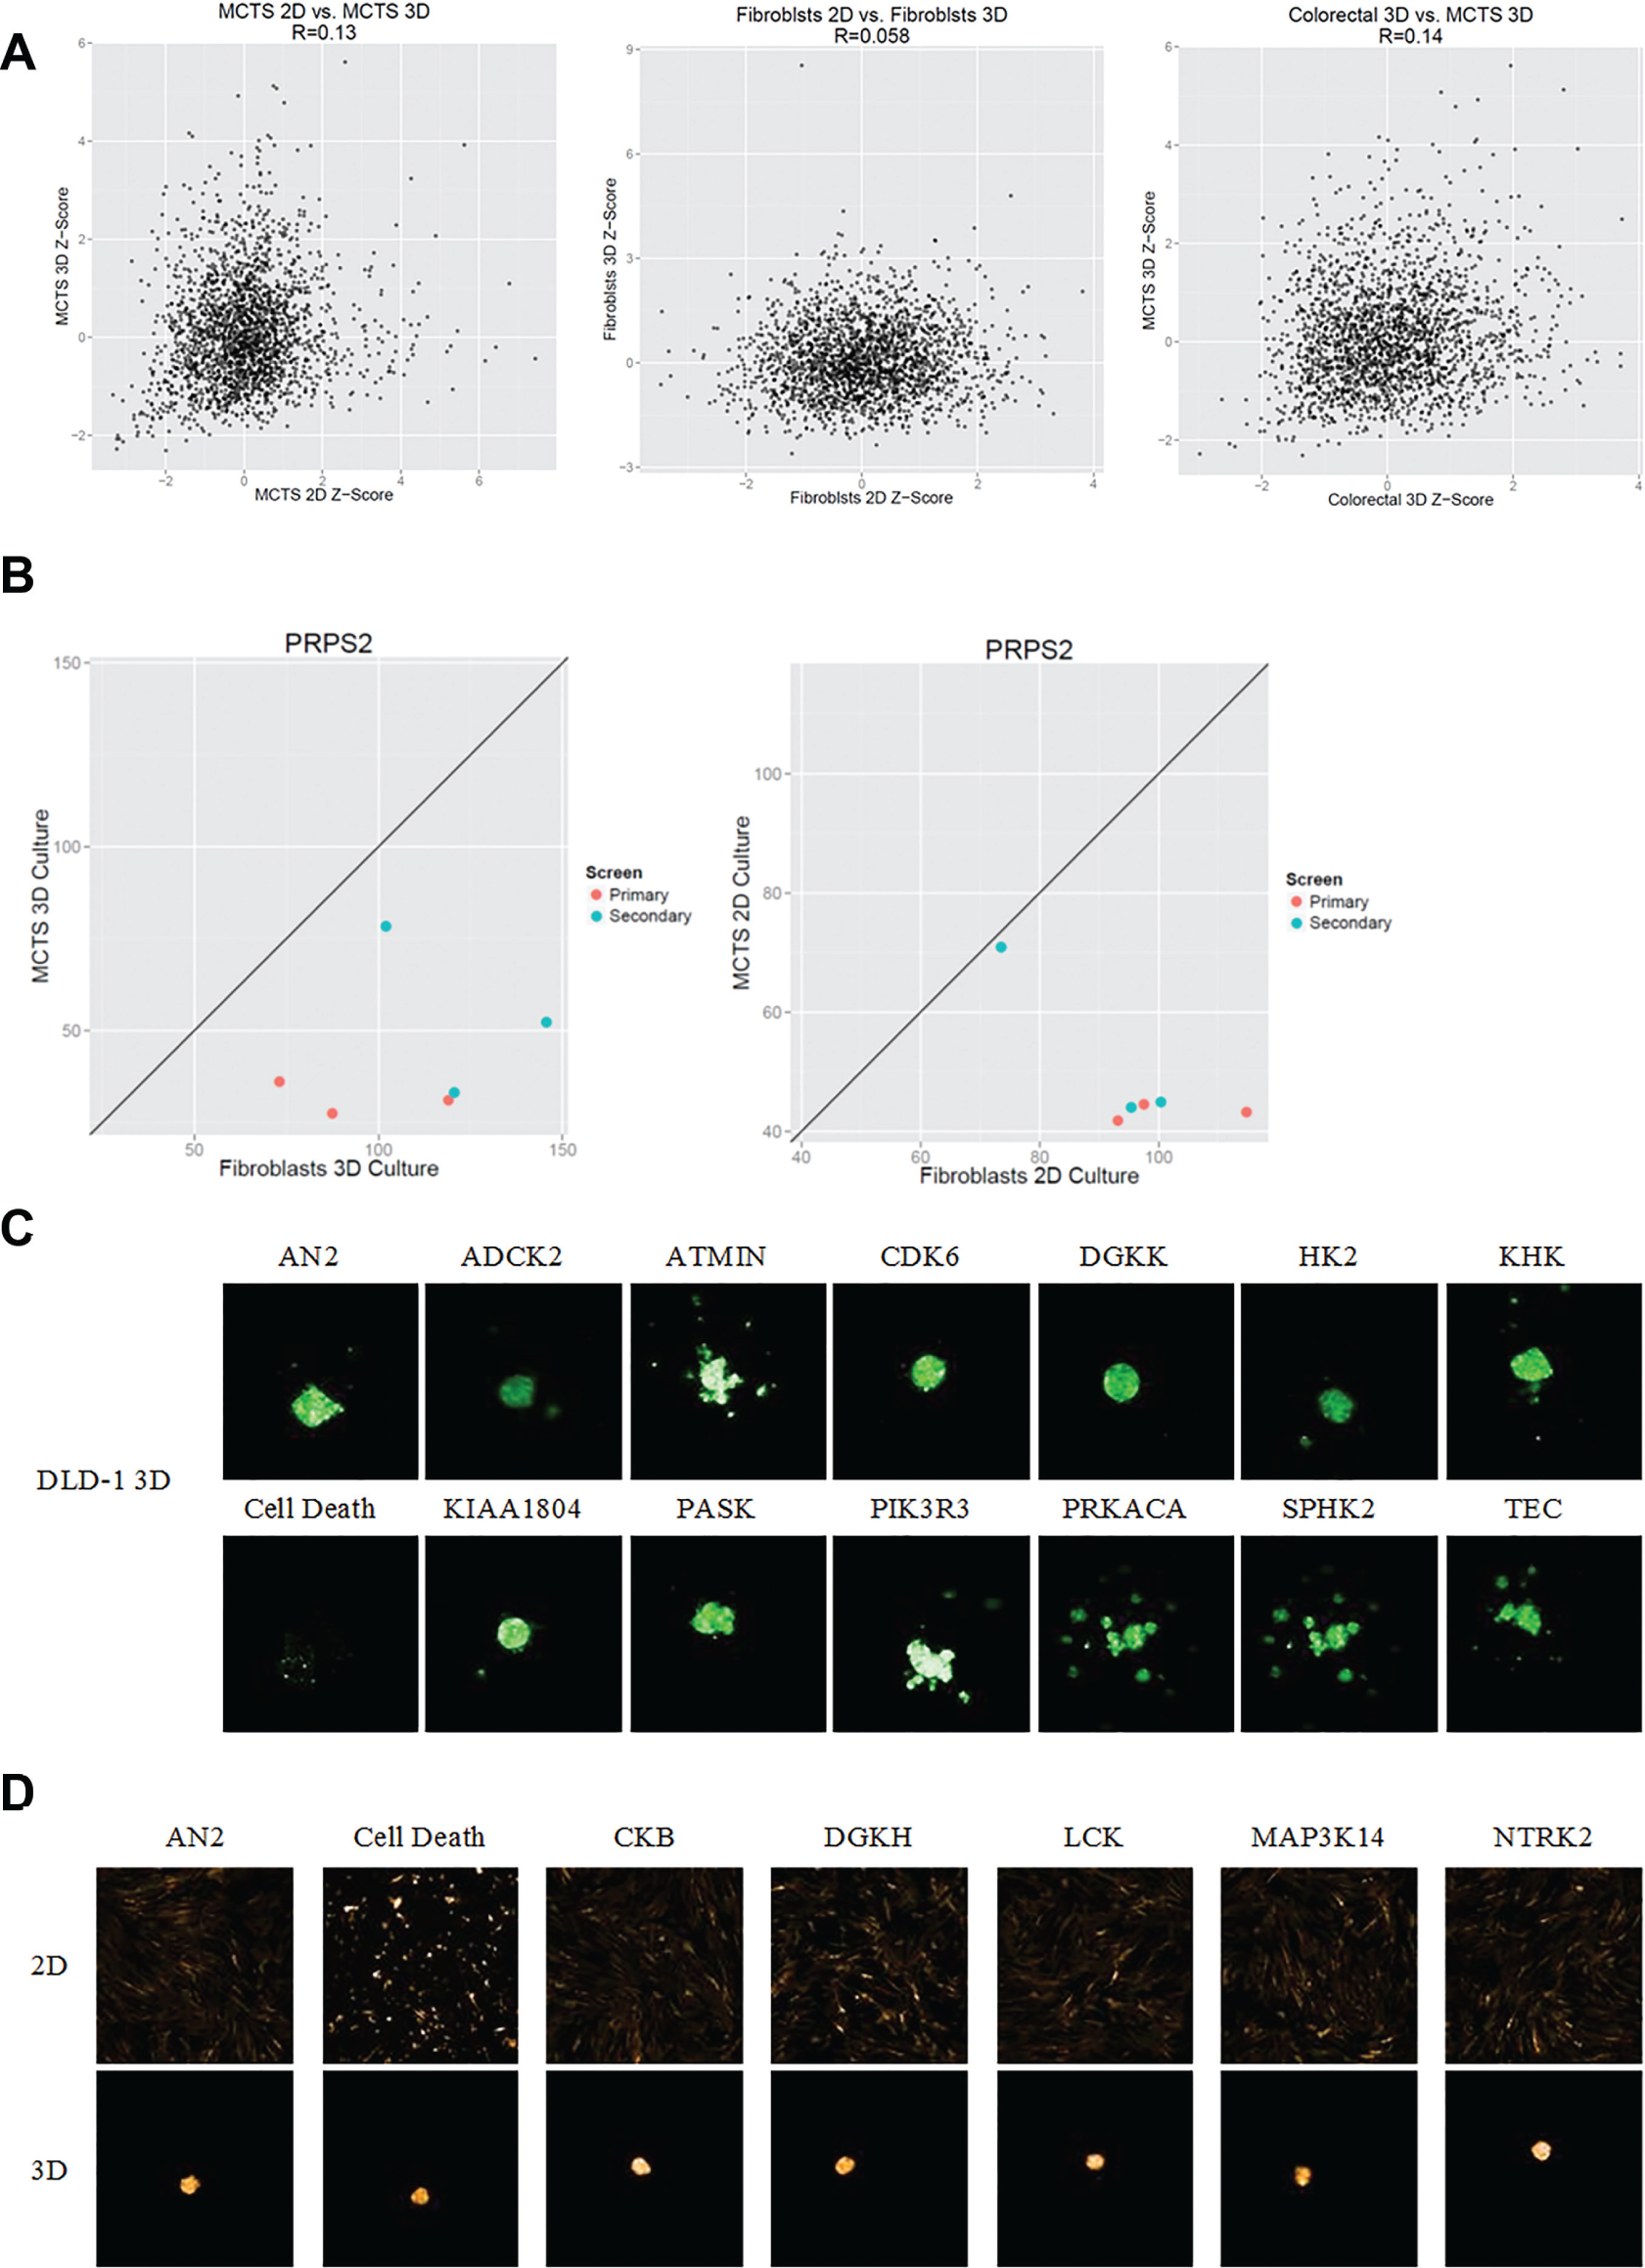
Multi-cell-type tumor spheroids (MCTS) versus single-cell-type tumor spheroids in two dimensions (2D) versus three dimensions (3D). (
Discussion
The tumor microenvironment plays an important role in the processes of tumor growth, metastasis, and drug resistance, yet most oncology drug discovery programs in HTS rely on cell proliferation assays with cancer cells cultured in a 2D monolayer on plastic.5,12–14 Although 2D assay systems have been useful for discovering compounds that target genetic drivers of cancers, they are devoid of influence from the heterogeneous cell population associated with the tumor microenvironment. Two-dimensional cultures also lack the complex architecture of the tumor microenvironment in vivo. The intricate network of distinct populations of stromal and immune cells in epithelial tumors communicate and contribute to the physiology and biochemistry of the tumor, including the responses to chemotherapeutic treatments. Accordingly, in vitro 3D organotypic models designed to recapitulate the natural tumor composition and environment are expected to provide a biologically relevant assay platform that will fill a critical gap between the 2D cell proliferation assays and animal models. Here, we proposed to build an HTS compatible, multi-cell- and single-cell-type 3D organotypic model of solid tumors and investigate the genes necessary for differential survival between the 2D and 3D models so as to be able to understand the mechanisms of survival specific to each growth mode and target them appropriately. Furthermore, in the context of understanding how viability was differentially regulated between cells growing in 2D and 3D models, we were interested in knowing which genes were unique to a particular tumor type versus the other. Ultimately, from the context of building and understanding complex, physiologically relevant systems, we were also interested in understanding how the stromal cells in a tumor in vivo affect the proliferation of cancer cells.
When comparing the growth in 2D versus 3D architecture of breast cancer and colorectal cancer cells, there were some genes that when knocked down differentially regulated viability in 2D monolayer and 3D SCTS models. For example, knockdown of the genes ALDH18A1 (aldehyde dehydrogenase 18 family, member A1) and PLK1 (polo-like kinase 1) in breast cancer cells caused a significant decrease in viability in the 2D monolayer as compared with 3D SCTS (
Fig. 2B
In the context of 3D breast cancer SCTS, knockdown of PHKG1, PRKDC, EPHA10, NEK4, and IP6K1 causes significant decreases in viability in breast cancer 3D SCTS as compared with colorectal cancer 3D SCTS. IP6K1 belongs to a family of inositol phosphatase kinases that regulate cell-cell adhesion and thereby metastasis in breast cancer. 17 Knockdown of this gene resulting in a significant loss of viability is conceivable given its role in cell-cell signaling. Furthermore, Ephrin receptor A10 (EphA10) is a relatively uncharacterized protein that is expressed in many breast cancers but not expressed in normal breast tissue. 18 Knockdown of this gene also results in decreased viability in the 3D breast cancer SCTS model.
One of the most important aspects of building this screening platform was the ability to address the differences between SCTS and MCTS models. We found that the knockdown of ATM, PRKACA, KHK, FRK, and NTRK2 caused a significant decrease in viability in the 3D MCTS model as compared with the SCTS model. Most of these genes have been shown to be associated with increased differentiation, and in fact, FRK functions as an oncogene. 19 Knockdown of these genes is purported to be associated with reduced viability, and this is indeed what we see in our 3D models. Surprisingly, these were not associated with an SCTS effect. Instead, it seemed like the growth of the fibroblasts and DLD-1 cancer cells together made them more susceptible to the knockdown of these genes. The effect of the stromal component on the sensitivity of the cancer cells to growth inhibition is an essential component of this screen.
The development of our 3D MCTS and SCTS RNAi screening platform is a step toward understanding the contribution of the tumor microenvironment to cancer cell viability. There is a dire need for chemotherapeutic combinations that will selectively attack and kill both the actively proliferating cancer cells and the slower-growing cancer stem cell population that is responsible for generating the drug-resistant cohort of cells that survive and repopulate the tumor. Our work aims to study and understand the role of tumor heterogeneity, clonal evolution, dormancy, and cell death and, in doing so, to bring forth novel mechanisms of action that will help uncover druggable targets. In the long term, we hope that our work will help alleviate the pain and suffering caused by these diseases by providing the means to better manage and combat them. We also hope that our HTS 3D model represents a paradigm shift in the way we view and define relevant biological models and that this screening regimen will be broadly applied to more than one disease type.
Footnotes
Acknowledgements
We would like to thank Carleen Klumpp-Thomas for help with the robotics implementation of the screens.
Supplementary material is available online with this article.
Declaration of Conflicting Interests
The authors declared no potential conflicts of interest with respect to the research, authorship, and/or publication of this article.
Funding
The authors disclosed receipt of the following financial support for the research, authorship, and/or publication of this article: This work was funded by the National Institutes of Health Intramural Research Program to NCATS and by the NCGC Spark award established by Ajit Jadhav.
References
Supplementary Material
Please find the following supplemental material available below.
For Open Access articles published under a Creative Commons License, all supplemental material carries the same license as the article it is associated with.
For non-Open Access articles published, all supplemental material carries a non-exclusive license, and permission requests for re-use of supplemental material or any part of supplemental material shall be sent directly to the copyright owner as specified in the copyright notice associated with the article.