
Abstract
Affinity-based solid-phase extraction (SPE) is an attractive low-cost sample preparation strategy for biomarker analysis. Molecularly imprinted polymers (MIPs) as affinity sorbents offer unique opportunities for affinity SPE, due to their low manufacturing cost and high robustness. A limitation is the prediction of their affinity; therefore, screening of analyte recovery and specificity within a large range of SPE conditions is important in order to ensure high-sensitivity detection and assay reproducibility. Here, a µ-SPE method for screening of the MIP-SPE materials using a commercial 384-well filter plate is presented. The method allows for rapid and automated screening using 10–30 µL of packed SPE sorbent per well and sample volumes in the range of 10–70 µL. This enables screening of many different SPE sorbents while simultaneously identifying optimal SPE conditions. In addition, the 384-well format also facilitates detection with a multitude of analytical platforms. Performance of the µ-MIP-SPE method was investigated using a series of MIPs designed to capture pro-gastrin-releasing peptide (ProGRP). Fractions coming from sample load, cartridge wash, and elution were collected and analyzed using mass spectrometry (MS). The top-performing MIPs were identified, together with proper SPE conditions.
Keywords
Introduction
Recent developments of traditional generic solid-phase extraction (SPE) sorbents have provided new high-performing varieties, like mixed-mode polymeric sorbents1,2 and nanostructured materials.3,4 While many of these SPE materials are excellent when applied for removal of contaminants, the reduction of sample complexity is often lacking, especially in the case of low abundant biomarker analytes in complex matrixes, such as blood, serum, 5 plasma, 6 or urine.7,8 Thus, there is a need for new SPE sample preparation materials with high selectivity and specificity toward targeted analytes, preferably with a high specific surface area and enhanced chemical/physical stability.9,10 In order to enable high-sensitivity detection in complex samples, affinity sorbents based on molecular recognition, such as immunosorbents, 11 aptamer-based sorbents, 12 and molecularly imprinted polymers (MIPs), 13 are finding increased use. Among them, SPE sorbents based on immobilized antibodies are usually highly specific to their target. 14 Many successful biomarker assays have been developed by combining immunoaffinity SPE and MS,15,16 but their broad application has been limited by issues such as antibody stability, variability, availability, cost, and challenging sample preparation (e.g., mismatched solvents). 17 MIPs represent a possible alternative to antibody-based SPE, as MIPs have a low manufacturing cost, can be tailor-made with functionalities complementary to the target analyte, and can work even under extreme conditions (pH, temperature, and organic solvents).18,19 Generally, the manufacturing of MIP sorbents involves a preorganization of the target molecule to be imprinted with the functional monomers, followed by a polymerization step with a cross-linker to lock the monomers into a polymer network and create the affinity sorbent.20,21 Traditionally, MIP-SPE sorbents have been developed and applied for capture of small molecular targets,22,23 but the development of MIPs for capture of biomolecules has been growing with the increased scientific understanding of imprinting.24,25 Currently, MIPs targeting peptides or proteins cannot match the high affinity of the best antibodies, although the recent progress in MIP synthesis and the ever-increasing sensitivity and dynamic range of new analytical instruments could very well provide ample opportunities for new affinity SPE assays using MIPs.
In a typical development of a MIP SPE method, several parameters needs to be screened, comprising those related to the synthesis of the sorbent, as well as those related to its use in SPE, that is, load, wash, and elution conditions. The performance is commonly evaluated by packing the imprinted polymer (15–50 mg) into SPE cartridges, and then measuring the recovery of the target compound in the fractions obtained after cartridge load, wash, and elution. 10
Here, an automated, high-throughput SPE screening method is presented and used for screening of molecularly imprinted sorbents in order to identify promising candidates. The method is based on 384-well filter plates and is comparable to the previously presented ISET platform. 26 This type of platform greatly facilitates the screening of different phases with simultaneous investigation of diverse solvent/buffer conditions. Compared with the ISET, the 384-well filter plate format provides increased bed volume, and thus binding capacity (needed to enable use of low-affinity materials), and can be used with analysis techniques other than matrix-assisted laser desorption/ionization (MALDI), for example, liquid chromatography–electrospray ionization mass spectrometry (LC ESI-MS). The molecularly imprinted materials used for development and validation were designed to selectively capture a proteotypic peptide of pro-gastrin-releasing peptide (ProGRP), NLLGLIEAK, as previously reported. 27
Although the 384-well format has been extensively utilized for immunoassays and in vitro receptor binding studies, its use in SPE is relatively new. 28 The presented method has been automated using liquid handling robotics, for the addition of the different solvents during the SPE process. The eluents resulting after the SPE experiments were analyzed on two different analytical platforms (ESI-triple quadrupole and MALDI-Orbitrap), allowing for quantification of NLLGLIEAK and evaluation of the different MIP sorbents based on recovery and removal of background.
The collected multiplexed experimental data on the ProGRP-specific MIP and non - imprinted polymer (NIP) phases provided both mechanistic information concerning analyte binding and an improved protocol for the specific enrichment of NLLGLIEAK with reduced non - specific binding.
Materials and Methods
Protein and Peptide Samples
Internal standard (IS) NLLGLIEA[K_13C615N2] (95% purity, Thermo Fisher Scientific, Braunschweig, Germany) was diluted according to the AQUA peptide storage and handling guidelines and stored at −20 °C. Stock solutions of IS and NLLGLIEAK of 5 µM were used to prepare samples by dilution with 50 mM ammonium bicarbonate (ABC) buffer solution.
β-Casein (Sigma-Aldrich, St. Louis, MO) was digested overnight with trypsin (Promega, Madison, WI) in a 1:100 ratio (enzyme–protein) at 37 °C. The digested protein was diluted with 0.1% trifluoroacetic acid (TFA) and frozen to stop the digestion process. Stock solutions of 4 µM were used to prepare samples by dilution with 50 mM freshly prepared ABC buffer.
µ-SPE in the 384-Filter Plate Format
µ-SPE was performed using 384-well filter plates filled with MIPs imprinted to capture the ProGRP signature peptide NLLGLIEAK. NIPs were used as controls to assess the MIP imprinting efficiency.
The MIPs were prepared as described previously with minor modifications 27 (see Supporting Information). Briefly, PMIP-1 and PMIP-2 were prepared by ethylene glycol dimethacrylate (EDMA) copolymerized with methacrylic acid (MAA), and PMIP-3 and PMIP-4 polymers were prepared from hydrophobic divinylbenzene (DVB) copolymerized with 2-amino ethyl methacrylamide (EAMA). For all MIPs, an N-terminally Z-protected peptide was used as a template for generating the surface imprint ( Suppl. Table S1 ). The NIPs were prepared by the same synthetic protocol without the initial addition of the template molecule. The SPE platform used either MultiScreen HTS 384-well filter plates from Millipore made of styrene acrylonitrile (SAN) with polyvinylidene fluoride (PVDF) membrane/polyester support or AcroPrep 384-well filter plates from Pall Life Sciences made of polypropylene (SAN) with glass fiber (borosilicate glass, 1.0 μm) membrane. Thermo Scientific (Waltham, MA) Nunc plates made of polystyrene were used as collection plates. A Millipore MultiScreen HTS Vacuum Manifold coupled to a vacuum pump (0–6 g/cm2, Nerliens Meszansky, Oslo, Norway) was used to carry out the SPE protocol. A Biomek 3000 Laboratory Automation Workstation (Beckman Coulter, Fullerton, CA) was used to enable automated sample preparation. Control of the robot was governed directly by Biomek automation software v3.3 (Beckman Coulter).
The MIP-µ-SPE protocol consisted of the following steps;
A fixed vacuum of 10–15 Hg was used for filling the wells with 20 µL of MIP/NIP material.
Wash, 2 × 60 μL of acetonitrile (ACN), was subsequently pulled through the wells.
Conditioning with 2 × 60 μL of methanol (MeOH), followed by 2 × 60 μL of 50 mM ABC buffer.
A 20 µL sample in loading buffer was added to each well.
80 µL of wash buffer was added to each well.
For elution of the bound analytes, 80 µL of elution solution was added.
During the transfer of washing and elution buffers, the vacuum was turned off and then turned on after the addition in order to facilitate a homogeneous wetting of the SPE bed.
MS analysis was performed on the collected fractions.
Liquid Chromatography–Tandem Mass Spectrometry Analysis
The chromatographic system consisted of LPG-3400 M pumps with integrated degasser, a WPS-3000TRS autosampler, and an FLM-3000 flow manager (Dionex, Sunnyvale, CA). Chromatographic separation was carried out on a Hypersil GOLD aQ analytical column (Thermo Scientific, 100 Å, 3 µm, 50 × 1 mm) preceded by a Hypersil GOLD aQ Drop-In Guard Cartridge (Thermo Scientific, 100 Å, 3 µm, 10 × 1 mm). Sample (40 µL) was injected in mobile phase A (20 mM formic acid [FA] and ACN 99:1, v/v) and eluted with a 30 min linear gradient from 1% to 85% of mobile phase B (20 mM FA/ACN 1:99, v/v) at a flow of 40 µL/min. After each gradient run, the column was washed for 3 min with 90% mobile phase B and reequilibrated with mobile phase A. Column temperature was kept constant at 30 °C. For the MS (TSQ Quantum Access, Thermo Fisher Scientific) quantification, the standard peptide NLLGLIEA-[K_13C615N2] was spiked into the samples, and using selected reaction monitoring (SRM), the transitions pairs 489.9 → 638.3 and 489.9 → 751.4 were monitored (qualifier and quantifier, respectively). TSQ data were processed by Xcalibur’s QualBrowser (Thermo Scientific), and the analyte peak area was automatically extracted by the genesis peak detection algorithm. Only peaks with a signal-to-noise (S/N) ratio above 10 and retention times corresponding to those of the reference samples were used. All collected fractions were diluted 1:10 with a 0.001% polyethylene glycol (PEG) + 0.1% FA solution before injection into the liquid chromatography–tandem mass spectrometry (LC-MS/MS) system, in order to reduce ACN concentration, maximize the ESI ionization, and minimize the absorption of peptides to the vials walls. 29
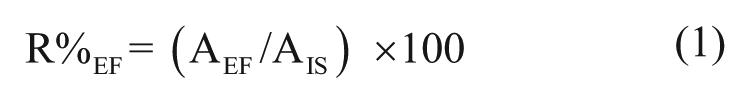
The recovery of NLLGLIEAK for each analyzed fraction (R%EF) was calculated based on the peak area generated by the NLLGLIEAK in the extracted fraction (AEF), and the peak area of NLLGLIEA[K_13C615N2] peptide (AIS), according to eq 1:
The recovery was normalized by setting the sum of all the observed peak areas for all fractions, that is, the sample flow-through, wash, and elution, as equation eq 2:

Nano-LC-MS/MS Analysis
For nano-LC-MS/MS analysis, sample fractions were mixed with 2 µM heavy standard NLLGLIEA[K_13C615N2] in a 1:1 ratio by volume and diluted 1:10 with a solution of 0.1% FA. Thereafter, 5 µL of the diluted sample was injected into the nano-LC-MS/MS system. Analysis was performed on an EASY-nLC (Thermo Scientific) running with a 75 μm × 150 mm fused silica column packed in-house with ReproSil C18 (3 μm, 120 Å from Dr. Maisch, Ammerbuch-Entringen, Germany) as an analytical column, preceded by a 0.1 × 20 mm, 5 µm EASY C18-A1 precolumn (Thermo Scientific) at 300 nL/min. The mobile phases consisted of (A) 20 mM FA and ACN (99:1, v/v) and (B) 20 mM FA and ACN (1:99, v/v). A linear gradient was run from 10% to 50% B in 15 min. Between samples, the B content was increased to 95% over 2 min and left constant for 5 min. The total analysis time per run was 22 min. The LC setup was connected to a TSQ Vantage instrument equipped with a nano-ESI ion source operated in positive ionization mode, spray voltage was set at 1.7 kV, and the heated capillary was kept at 270 °C. The mass spectrometer was operated in SRM mode and using the following transitions: 485.8 → 347.2, 485.8 → 460.3, 485.8 → 573.4, 485.8 → 630.4, and 485.8 → 743.5 for the target peptide NLLGLIEAK and 489.8 → 355.2 and 489.8 → 468.3 for the IS NLLGLIEA-[K_13C615N2] (IS). TSQ data were processed using Skyline software v3.1 (MacCoss Lab, Seattle, WA).
The ratio of the peak area of the target peptide (NLLGLI- EAK) from the extracted fraction (EF) to the peak area of the NLLGLIEA[K_13C615N2] peptide (IS) was used for quantification of NLLGLIEAK in samples, according to eq 1.
MALDI-MS
For the MALDI-MS analysis, 1 µL of SPE fraction was mixed with 1 µL of 2 µM labeled standard NLLGLIEA[K_13C615N2] and 1 µL of alpha-cyano cinnamic acid matrix solution and spotted onto a MALDI target plate for analysis. Analysis was performed on a hybrid MALDI LTQ Orbitrap XL (Thermo Fisher Scientific) instrument. Full MS spectra for each spot were obtained as the average of 10 mass scans in positive mode, mass range 700−2000 Da at 60,000 mass resolution. The selective ion monitoring (SIM) spectra were obtained in positive mode, mass range 880−990 Da using 60,000 mass resolution. The peak intensities were extracted using Xcalibur (Thermo Scientific), and the data were analyzed with the statistical software package R. 30
The intensity ratio (Intensity Ratio %) of each sample fraction was calculated from the intensity of the target peptide (NLLGLIEAK) observed in the sample fraction (IEF) and the intensity of the heavy IS (IIS), according to eq 3:

Results and Discussion
The workflow of the method is illustrated in Figure 1 , where the MIPs are prepacked into wells of a 384-well filter plate; (1) sample is drawn through the SPE bed, and after washing, (2) the captured analyte is eluted and (3) the collected eluents are analyzed using LC-MS and/or MALDI for the quantification of recovery and evaluation of the background removal (i.e., spiked peptides added to the sample) ( Fig. 2 ).
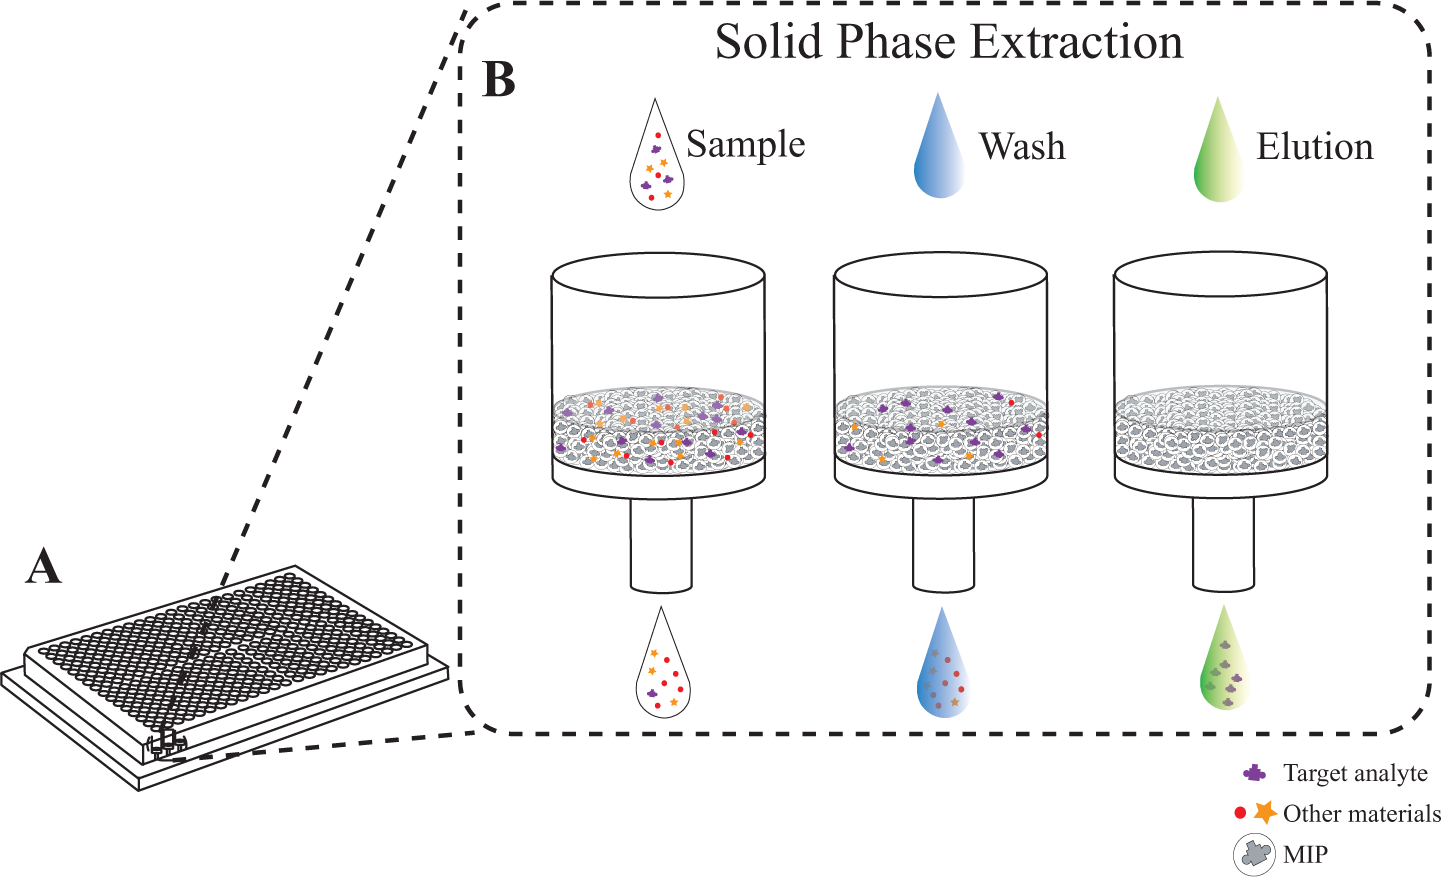
Schematic representation of the 384-well filter plates and the workflow of the SPE step in the microwell. (
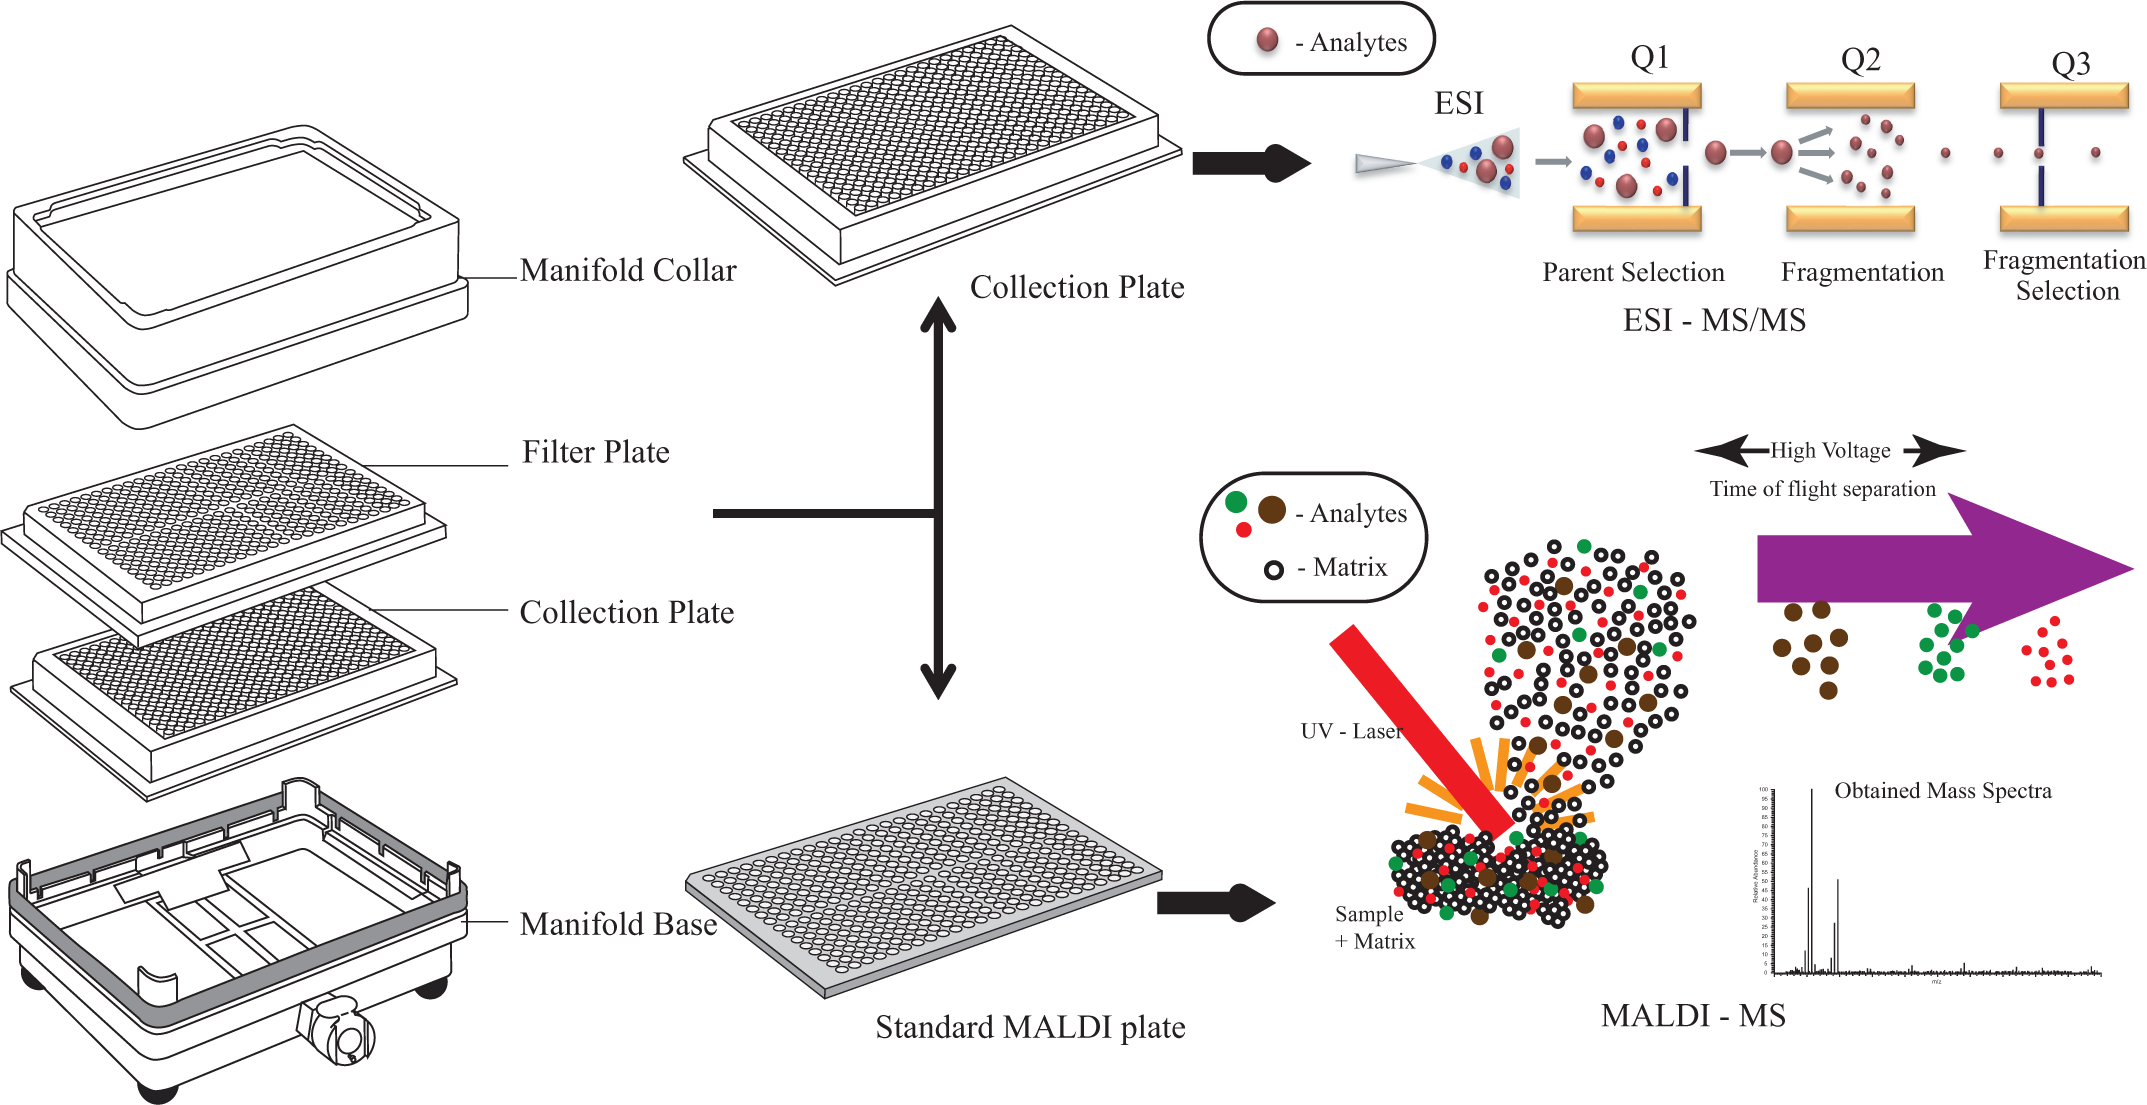
Schematic representation of the dual (MALDI and ESI)-analysis readout facilitated by the 384-well filter plate SPE method.
384-Well Filter Plate: SPE Setup and Development
During SPE, unspecific absorption to surfaces can lead to sample losses and false results. Therefore, the retention of analyte contributed by unspecific absorption in the 384-well filter plate setup was investigated. Briefly, 20 µL of a 5 nM NLLGLIEAK peptide in 50 mM ABC buffer was loaded into the filter plate wells without any MIP/NIP phase, followed by running an SPE protocol using 5% ACN as washing buffer and 80% MeOH + 3% FA as the elution buffer. The collected eluents were analyzed with LC-MS/MS for detection of binding of the target peptide. The analysis ( Suppl. Fig. S5 ) showed that approximately 10% of the loaded peptide was bound to surfaces of the well (membrane absorption, dead volumes in the tip) and recovered during the elution step. At this quite low concentration (5 nM), the total loss due to adsorption was approximately 25% of the loaded analyte.
Chemical compatibility of the microplates and filter plates was checked with different conditions. Prolonged exposure of ACN resulted in warping of MultiScreen HTS 384-well filter plates and cross talk in the collection plates. This problem was addressed by changing the filter plates to AcroPrep 384-well filter plates, which are made of polypropylene (SAN) with glass fiber (borosilicate glass, 1.0 μm) membrane. The latter was inert to the all buffer conditions used in the described experiments.
High-Throughput Screening of MIPs Using LC-MS
In the initial development of the 384-well filter plate SPE platform, only PMIP-4 and its nonimprinted counterpart PNIP-2 were used. These two sorbents had been previously investigated for SPE of the NLLGLIEAK peptide, using a reversed-phase-like SPE protocol with a low amount of organic modifier in the wash solution. 27 Thus, the 384-well filter plate SPE platform should provide the same results as the previous investigation. The impact of increasing organics in the washing buffer on the SPE sample preparation was therefore investigated using increasing ACN% (5, 10, 15, 30, 50, and 95). Supplemental Figure S6 shows the recovery (R%) in the elution plotted against the ACN concentration used in the wash step. As expected, the data showed that a wash buffer with 5% ACN provides a higher recovery than the washes with higher ACN. This trend is also seen for the NIP, albeit with a lower recovery in the elution step. This effect can be explained by considering the nature of the peptide and the polymer. NLLGLIEAK is a 0.8 kDa proteolytic digest product dominated by a hydrophobic pentapeptide segment (55% hydrophobic residues); the polymeric sorbents were in this case based on DVB as the main constituent. In agreement with our recent report, this leads to a reversed-phase retention mechanism with a strong non - specific hydrophobic contribution. To suppress this effect, a careful optimization of the wash conditions is required. Indeed, at an increased ACN%, that is, at 30% and 50%, more significant imprinting-related differences in the elution recoveries were observed. However, as high content of ACN in the wash step resulted in lower recoveries, there is an obvious trade-off between recovery and specificity.
A second screening was performed to narrow down the optimal organic content in the wash step. For this experiment, wash buffers containing 5%, 7.5%, 10%, and 12.5% ACN were used. Samples of 5 nM NLLGLIEAK peptide in 50 mM ABC buffer were loaded onto the MIP/NIP materials, followed by wash and elution using 80% MeOH/3% FA. Recovery (R%) of the analyte in the wash and elution fractions was calculated and plotted against the ACN concentration ( Suppl. Fig. S7 ).
Analysis of the wash fraction ( Suppl. Fig. S7A ) shows that using 7.5% ACN as wash buffer leads to 34% of the analyte loss, whereas usage of 10% ACN as wash buffer increases the analyte loss to 48%. Based on the recovery observed in the elution step ( Suppl. Fig. S7B ), it appears that the most selective MIP retention, for this particular SPE protocol, could be found when using 7.5%–10% of ACN. At 7.5%, a total recovery of 50% was observed for the MIP, compared with 25% for its NIP counterpart. At 10% ACN, the recovery was a bit lower (40%), but the discrimination versus the NIP, showing only 8%, was significantly better. Wash with 12.5% ACN displayed lower recovery and diminished the affinity of the MIP compared with NIP. The 384-well filter plate–based SPE method thus provided the same results as the previously reported 1 mL cartridge for a NLLGLIEAK-specific MIP phase. 27
Verification by the MALDI-MS Method
The 384-well filter plate platform can in many situations be “too fast” for analysis readout with LC-MS; that is, 384 samples would take days to weeks to analyze. Therefore, MALDI-MS was investigated as an option for rapid readout in order to achieve a better match between the SPE-screening and the MS analysis time. While MALDI-MS can easily provide a qualitative answer, the multiplexed testing is much more useful if quantitative data from the samples can be obtained. The feasibility of a quantitative MALDI-MS method was investigated by direct comparison with nano-LC-MS analysis. The previous LC-MS experiments showed an optimal reversed-phase-based SPE with 7.5% ACN in the wash buffer. These conditions were used for performing SPE with PMIP-3 (MIP) and its counterpart PNIP-2 (NIP). Samples of 1 µM NLLGLIEAK peptide in 50 mM ABC buffer were used, and the concentration was increased to improve detection with MALDI. The collected SPE eluent fractions were subjected to analysis with both MALDI-MS and nano-LC-MS.
The observed peak area ratio (%) from the nano-LC-MS experiment was compared with the observed intensity ratio (%) from the MALDI experiment ( Fig. 3 ). The intrasample variation of the MALDI and LC-MS provided a relative standard deviation (RSD) of <10%, excluding one “outlier” for PNIP-2, although the intersample variation was somewhat higher (10%–15%).
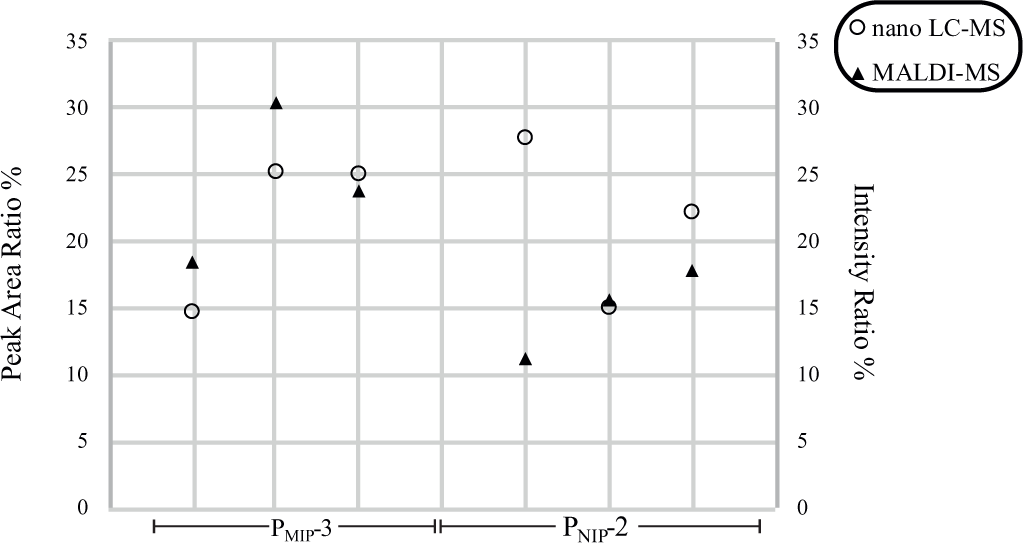
Quantitative comparison using nano-LC-MS (peak area ratio %) with the MALDI (intensity ratio %) samples of 20 µL of 1 µM NLLGLIEAK peptide in 50 mM ABC buffer, followed by 7.5% ACN wash and elution with 80% MeOH/3% FA.
The reproducibility of the sample preparation was investigated by comparing duplicates in the SPE and MS process, as shown in Supplemental Figure S8 . The deviation is very low in the MS analysis, ≤1% ( Suppl. Fig. S8B ). However, variations arising from different SPE replicates ( Suppl. Fig. S8A ) are not entirely surprising, and can be attributed to flow variations and variations in bed volume. The variations in the SPE process make it extra important to at least employ relative quantitation and large number of replicates.
High-Throughput Screening of the Polymer Library Using MALDI-MS
Using the MALDI-MS method, the ProGRP affinity of six different MIP/NIP (PMIP-1–4 to PNIP-1–2) phases was investigated. In order to see if additional modes of selectivity could be identified, additional SPE conditions, as depicted in Table 1 , were evaluated using samples of 4 µM NLLGLI- EAK. Briefly, after equilibration of the sorbents, 20 µL of 4 µM NLLGLIEAK peptide in loading buffers ABC + 0.5% FA (L1), ABC + 0.8% NaOH (L2), ABC (L3), and 100% ACN (L4) was added to each µ-well. The µ-SPE was carried out with 90 µL of washing buffers 7.5% ACN + 0.5% FA (W1), 7.5% ACN + 0.8% NaOH (W2), 7.5% ACN (W3), and 100% ACN + 0.1% FA (W4), and 30 µL of elution buffers 80% ACN + 3% NH3 (E1), 80% ACN + 3% FA (E2), and 50% MeOH + 5% FA (E3). The collected SPE fractions were then spotted in triplicate on a MALDI target plate with 1 µL of an IS 10 nM NLLGLIEA[K_13C615N2] and 1 µL of alpha-cyano cinnamic acid for analysis using SIM mode MALDI-MS.
Different SPE Optimization Conditions Used for the Semiquantitative Method for Materials PMIP-1–4 to PNIP-1–2.
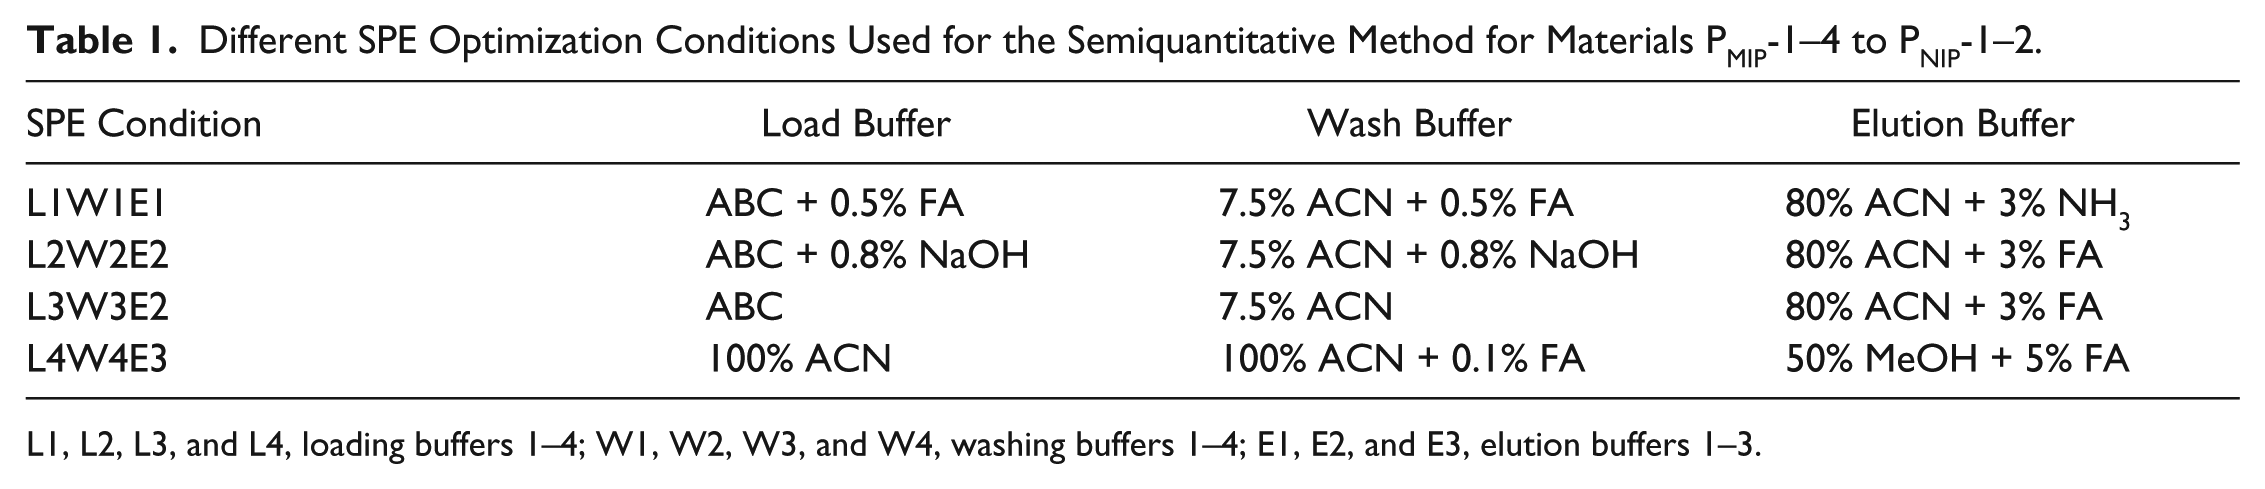
L1, L2, L3, and L4, loading buffers 1–4; W1, W2, W3, and W4, washing buffers 1–4; E1, E2, and E3, elution buffers 1–3.
The MALDI-MS peak intensity for NLLGLIEAK of different MIP (PMIP-1–4) and NIP (PNIP-1–2) phases in four different conditions—condition 1, L1W1E1; condition 2, L2W2E2; condition 3, L3W3E2; and condition 4, L4W4E3 is plotted in Figure 4 . The data indicate that conditions 1 and 2 result in lower peak intensity than conditions 3 and 4. Imprinting-related effects in condition 3 are small, possibly a consequence of the relatively high sample load. However, the use of condition 3, corresponding to the condition selected in our previous report, MIPs PMIP-3 and PMIP-4, showed increased analyte peak intensities corresponding to enhanced recoveries exceeding the NIP (PNIP-2).
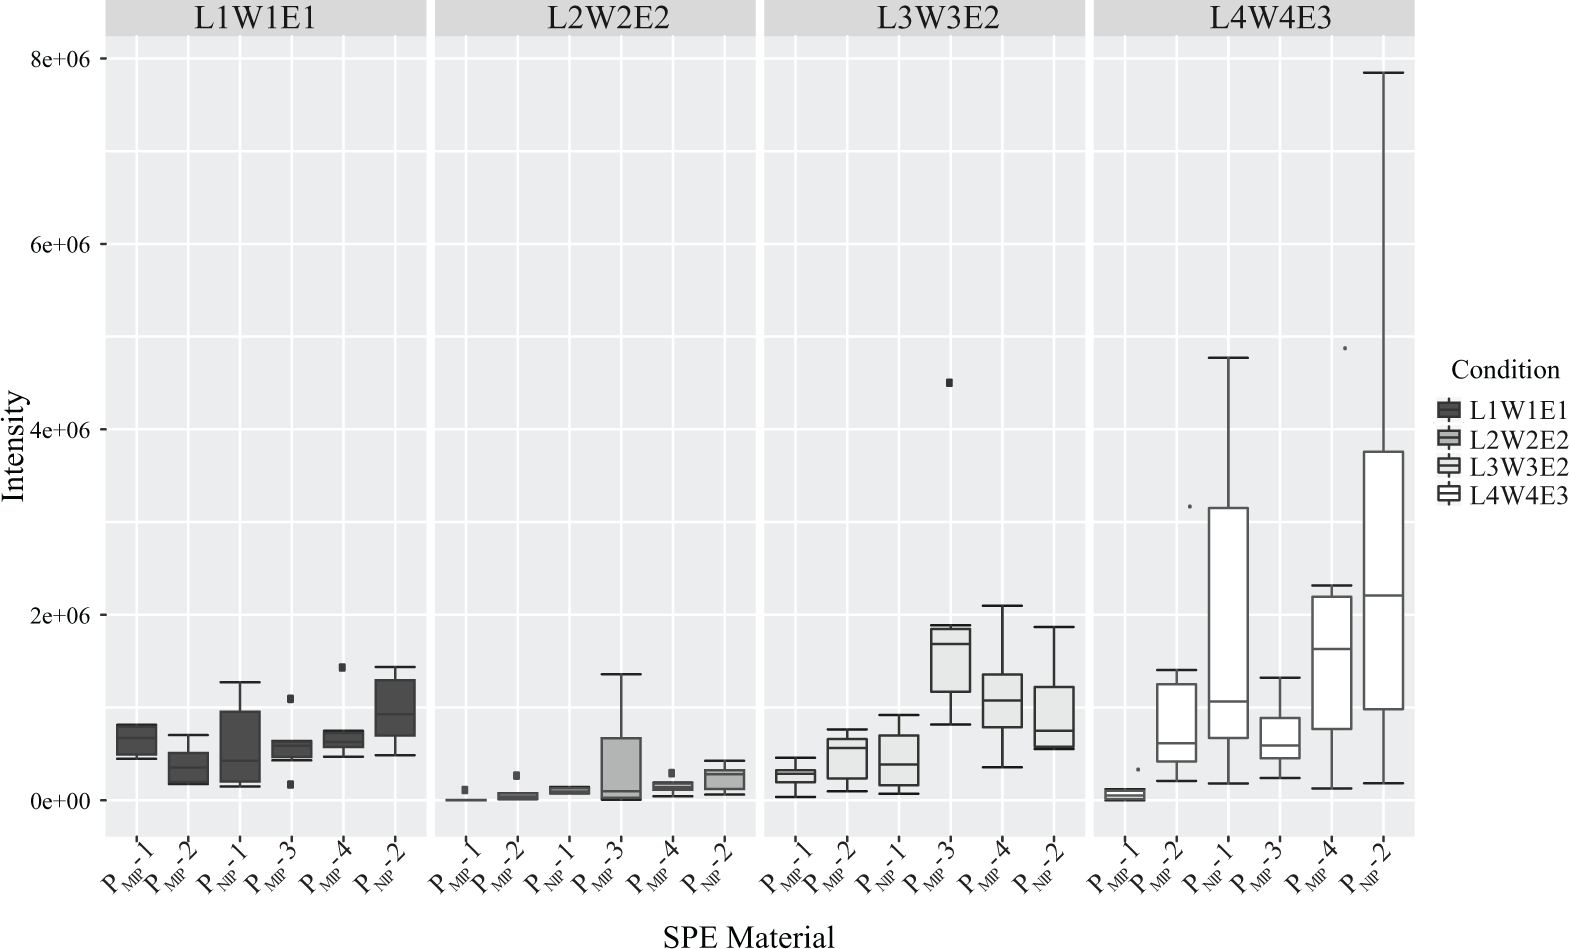
MALDI-MS analyte peak intensity observed for different MIP (i.e., PMIP-1–4) and NIP (PNIP-1–2) phases using four different conditions (L1W1E1, L2W2E2, L3W3E2, and L4W4E3). The box shows the MALDI-MS intensities generated by the replicates of the corresponding polymer, and the solid black line inside the box represents the median. Black dots above and below the boxes represent outliers.
Investigation of MIP Selectivity
A further investigation of the selectivity at lower sample load was carried out by repeating the same experiment with samples of 40 nM NLLGLIEAK mixed with 40 nM β-casein digest (1:1 ratio). These concentrations still allowed for analysis using MALDI-MS. Figure 5 shows the mean intensities (six spots, two samples) for the NLLGLIEAK peak (970 Da) (dark bars), and the white bars represent the summed intensity of the observed background peaks (i.e., sum of the intensity of the peptide peaks originating from the β-casein digest). Individual peptide intensities can be seen in Supplemental Figure S9 . The data indicate that conditions 1 and 2 provide a generic SPE with high recovery observed for all peptides and have little to offer in terms of selectivity. Condition 3 provided two candidates showing selective retention, that is, PMIP-4 (MIP) and PNIP-2 (NIP). Both phases offered a reduced background and minor selectivity, but with a low recovery. An interesting result was obtained using condition 4. The background in condition 4 was very low, and good selectivity could be observed using PMIP-4 (MIP) versus PNIP-2 (NIP).
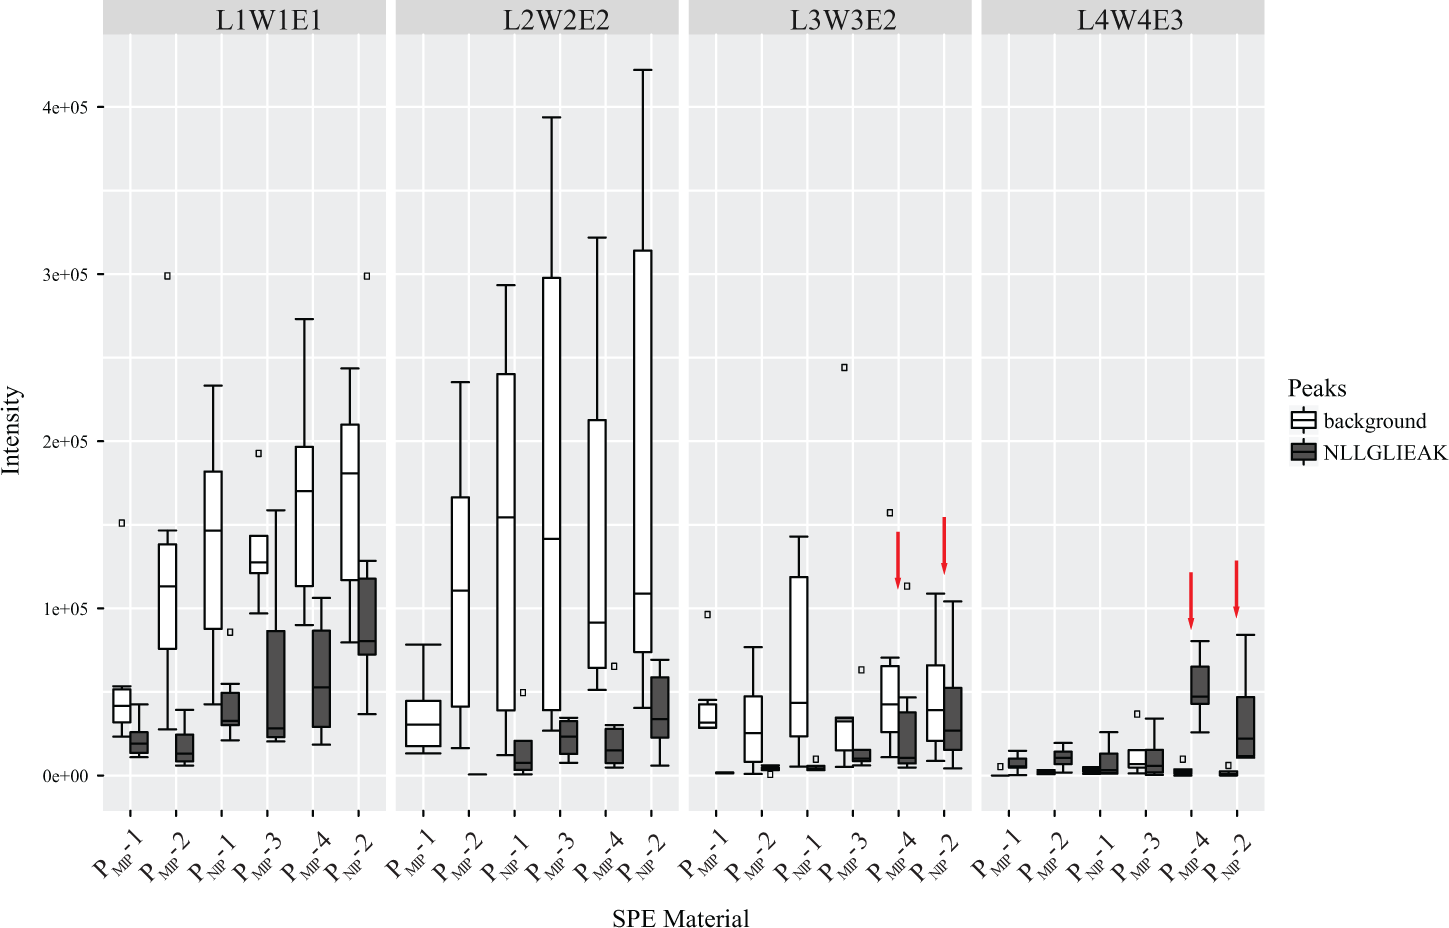
Intensity of the analyte peak (NLLGLIEAK) and sum of the background peaks (i.e., sum of the intensity of the peptide peaks corresponding to the β-casein digest), corresponding to each SPE material in four different conditions using MALDI-MS analysis: condition 1, L1W1E1; condition 2, L2W2E2; condition 3, L3W3E2; and condition 4, L4W4E3. The box shows the MALDI-MS intensities generated by the replicates of the corresponding polymer, and the solid black line inside the box represents the median. Black dots above and below the boxes represent the outliers.
In conclusion, the presented approach provides a convenient “all-in-one” experimental platform for performing high-throughput screening of synthetic polymer (MIP) libraries. Moreover, the method is also applicable to any generic SPE or affinity phases that can be packed in the filter plate. The 384-well filter plate method increases sample preparation throughput significantly, that is, 15–20 min per sample (SPE and MALDI-MS analysis), compared with 60–90 min per sample (SPE and LC-MS analysis) for the standard off-line SPE cartridge method. Moreover, the highly parallelized method means that costs are reduced, for example, using a less solid phase (20 µL) and smaller sample volume (both often available in limited amounts) and solvents, naturally facilitating considerable time savings, which scales with the increased sample numbers. It can be automated using basic liquid handling robotics and applied in different analytical workflows, leading in turn to greater consistency and reduced sample preparation time and effort. The issue of long analysis time as the LC-MS runs could be addressed using a MALDI readout, as demonstrated here. An entire plate can be run in 8 experiments (e.g., in our experiment, we used 8 different polymers with 4 SPE conditions in duplicate, for 48 samples in total for each experiment), and a partial analytical run of 144 samples on a MALDI-MS could be performed in approximately 15–20 min per sample (SPE and MALDI-MS analysis), with the cost of extraction sorbent for the screening made at a very low per sample cost (~0.5–1 USD/sample). The 384-well laboratory automation also minimizes the risk of mislabeling and sample handling errors. This makes the 384-well filter plate setup an efficient high-throughput screening platform for newly prepared sorbent materials using a MALDI-MS output.
In the case of the investigated ProGRP-specific MIP and NIP phases, the multiplexed experiments confirmed findings previously reported 27 with the identification of the optimal polymer sorbent for the hydrophobic retention of NLLGLIEAK. In addition, the presented platform allowed the identification of new SPE conditions with suppressed nonspecific binding. In the same settings, MIP sorbents showed enrichment toward the target peptide NLLGLIEAK, with the depletion of other peptides.
Footnotes
Supplementary material is available online with this article.
Declaration of Conflicting Interests
The authors declared no potential conflicts of interest with respect to the research, authorship, and/or publication of this article.
Funding
The authors disclosed receipt of the following financial support for the research, authorship, and/or publication of this article: This work has been performed as part of the ITN project PEPMIP (grant agreement no. 264699) supported by the Seventh Research Framework Programme of the European Commission under Marie Curie actions.
References
Supplementary Material
Please find the following supplemental material available below.
For Open Access articles published under a Creative Commons License, all supplemental material carries the same license as the article it is associated with.
For non-Open Access articles published, all supplemental material carries a non-exclusive license, and permission requests for re-use of supplemental material or any part of supplemental material shall be sent directly to the copyright owner as specified in the copyright notice associated with the article.